Figure 1.
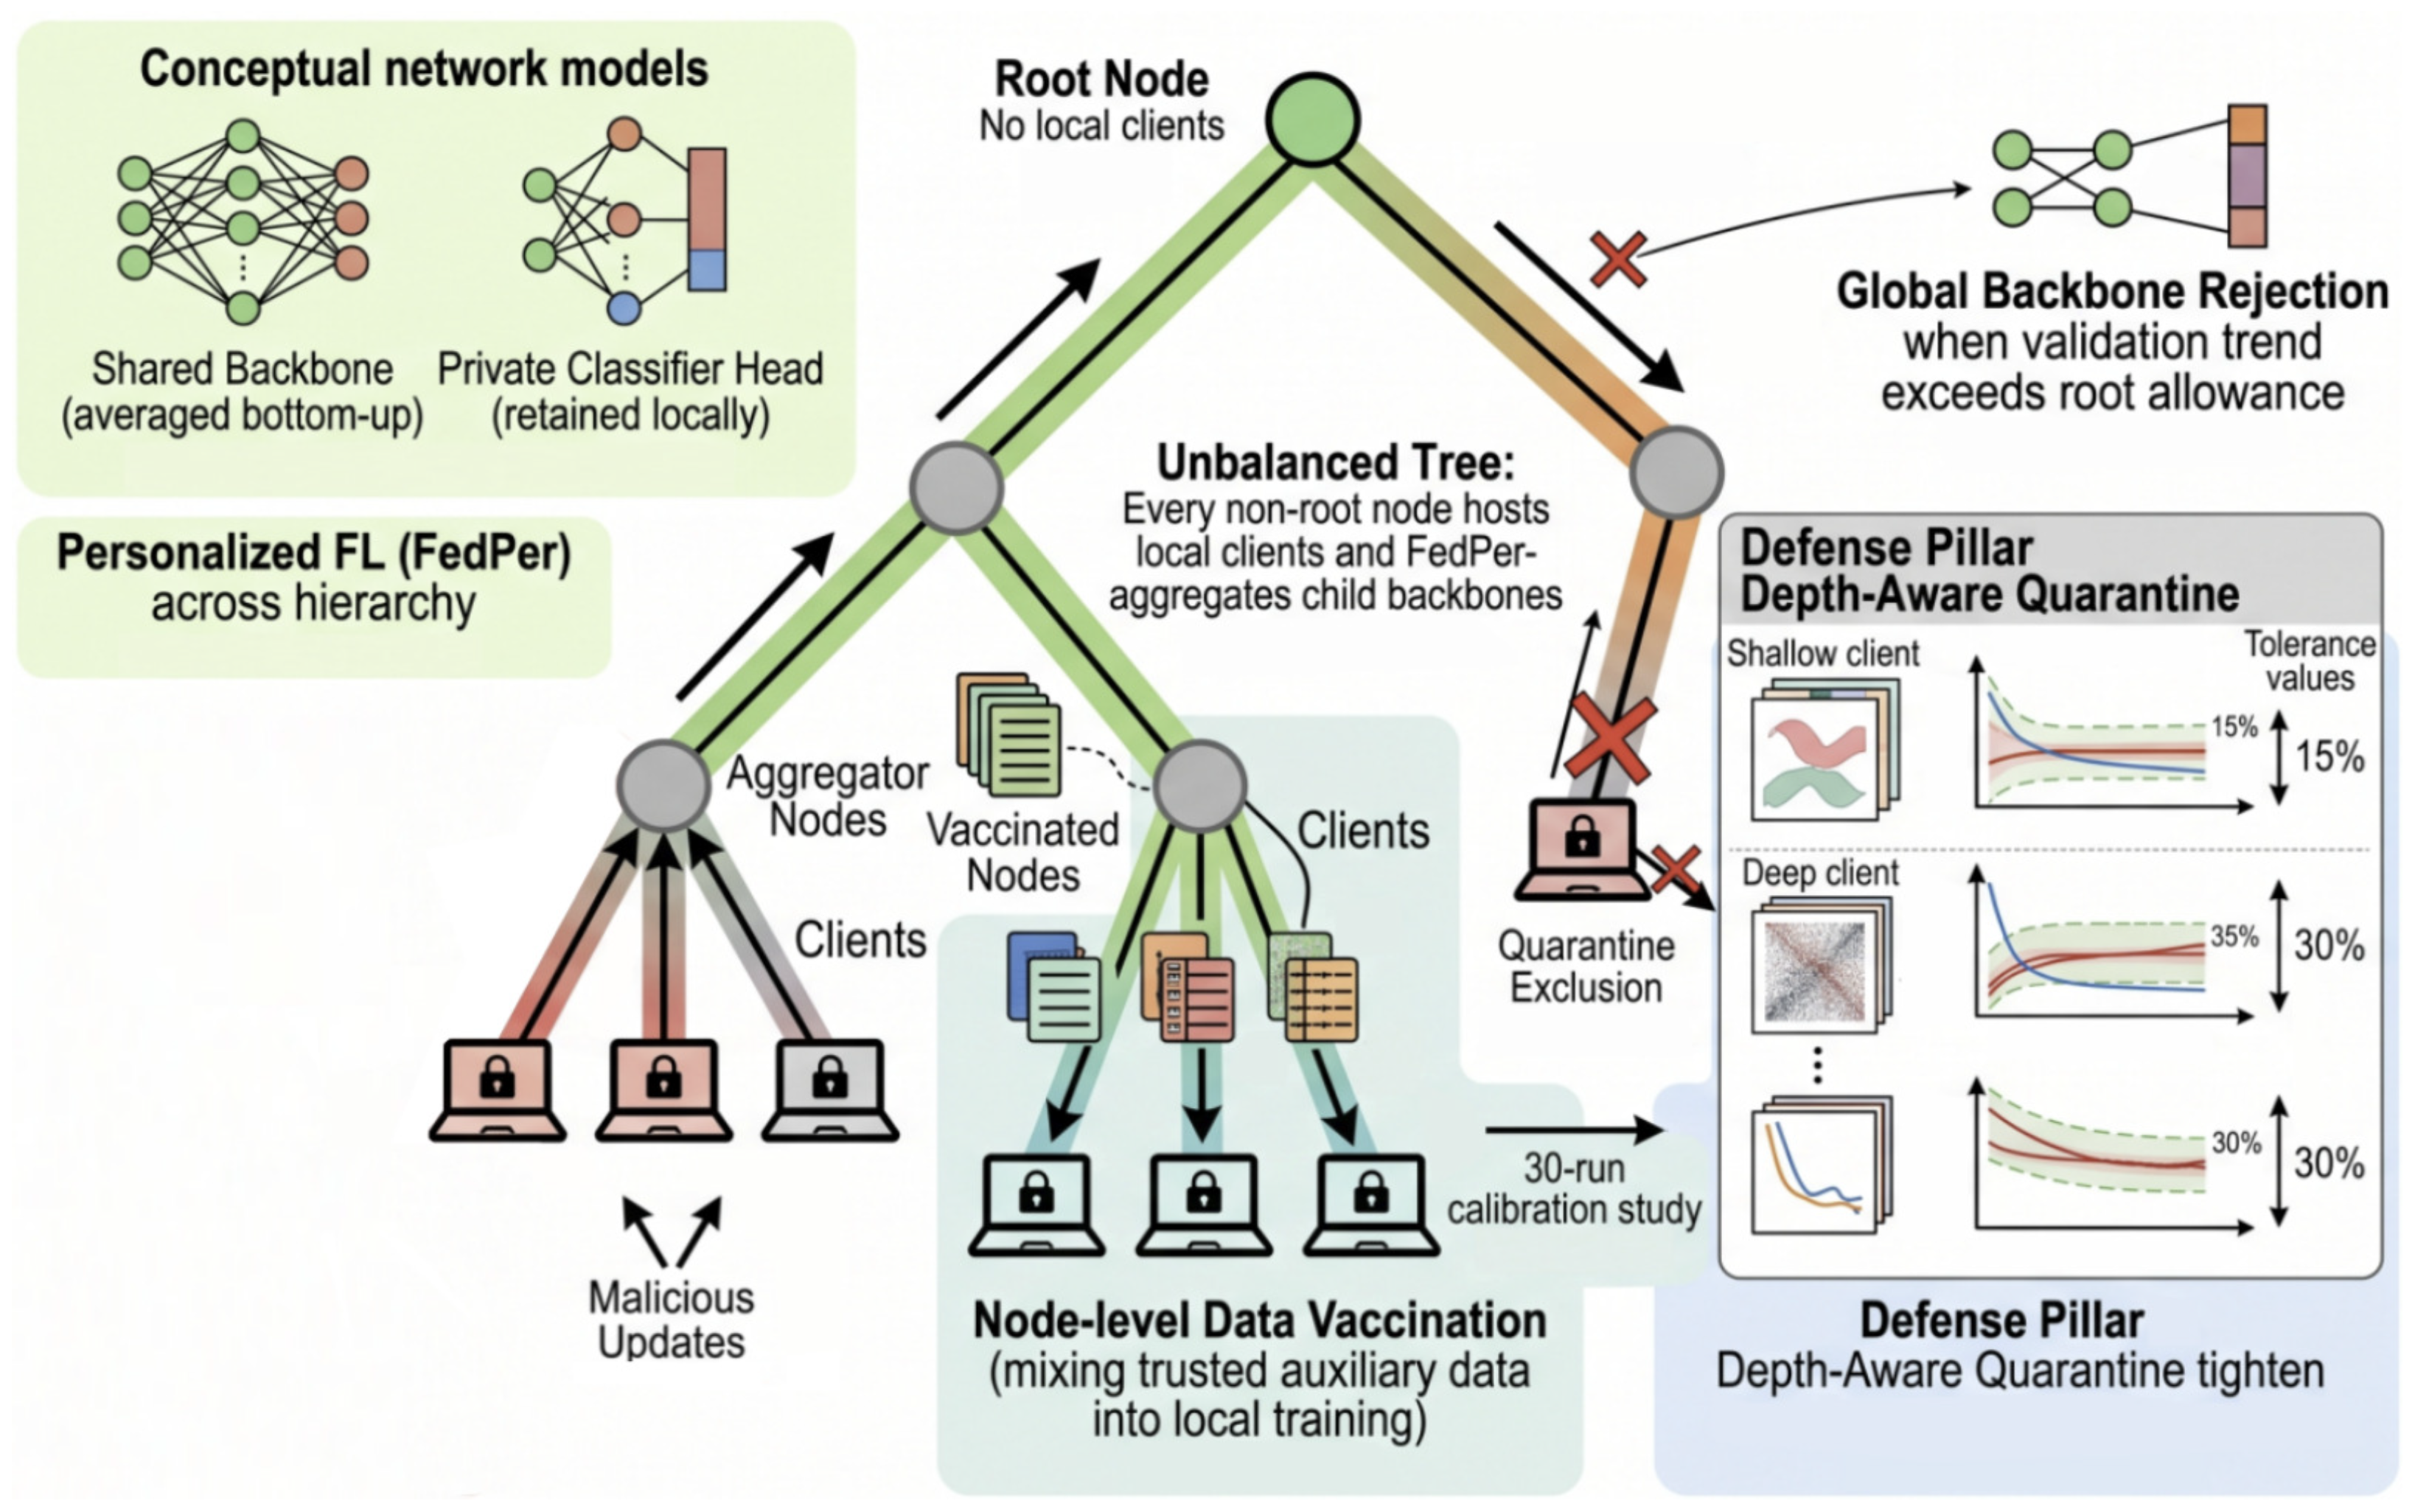
Graphical abstract of FLVaccin. Center: unbalanced tree—root (green); aggregators (grey) host clients and FedPer-aggregate upward; red: malicious updates. Top left: Personalized FL, shared backbone vs. private head. Bottom mid: node-level CIFAR-100 vaccination (30-run calibration). Bottom right: depth-aware per-client quarantine and root backbone rejection.
Figure 1.
Graphical abstract of FLVaccin. Center: unbalanced tree—root (green); aggregators (grey) host clients and FedPer-aggregate upward; red: malicious updates. Top left: Personalized FL, shared backbone vs. private head. Bottom mid: node-level CIFAR-100 vaccination (30-run calibration). Bottom right: depth-aware per-client quarantine and root backbone rejection.
Figure 2.
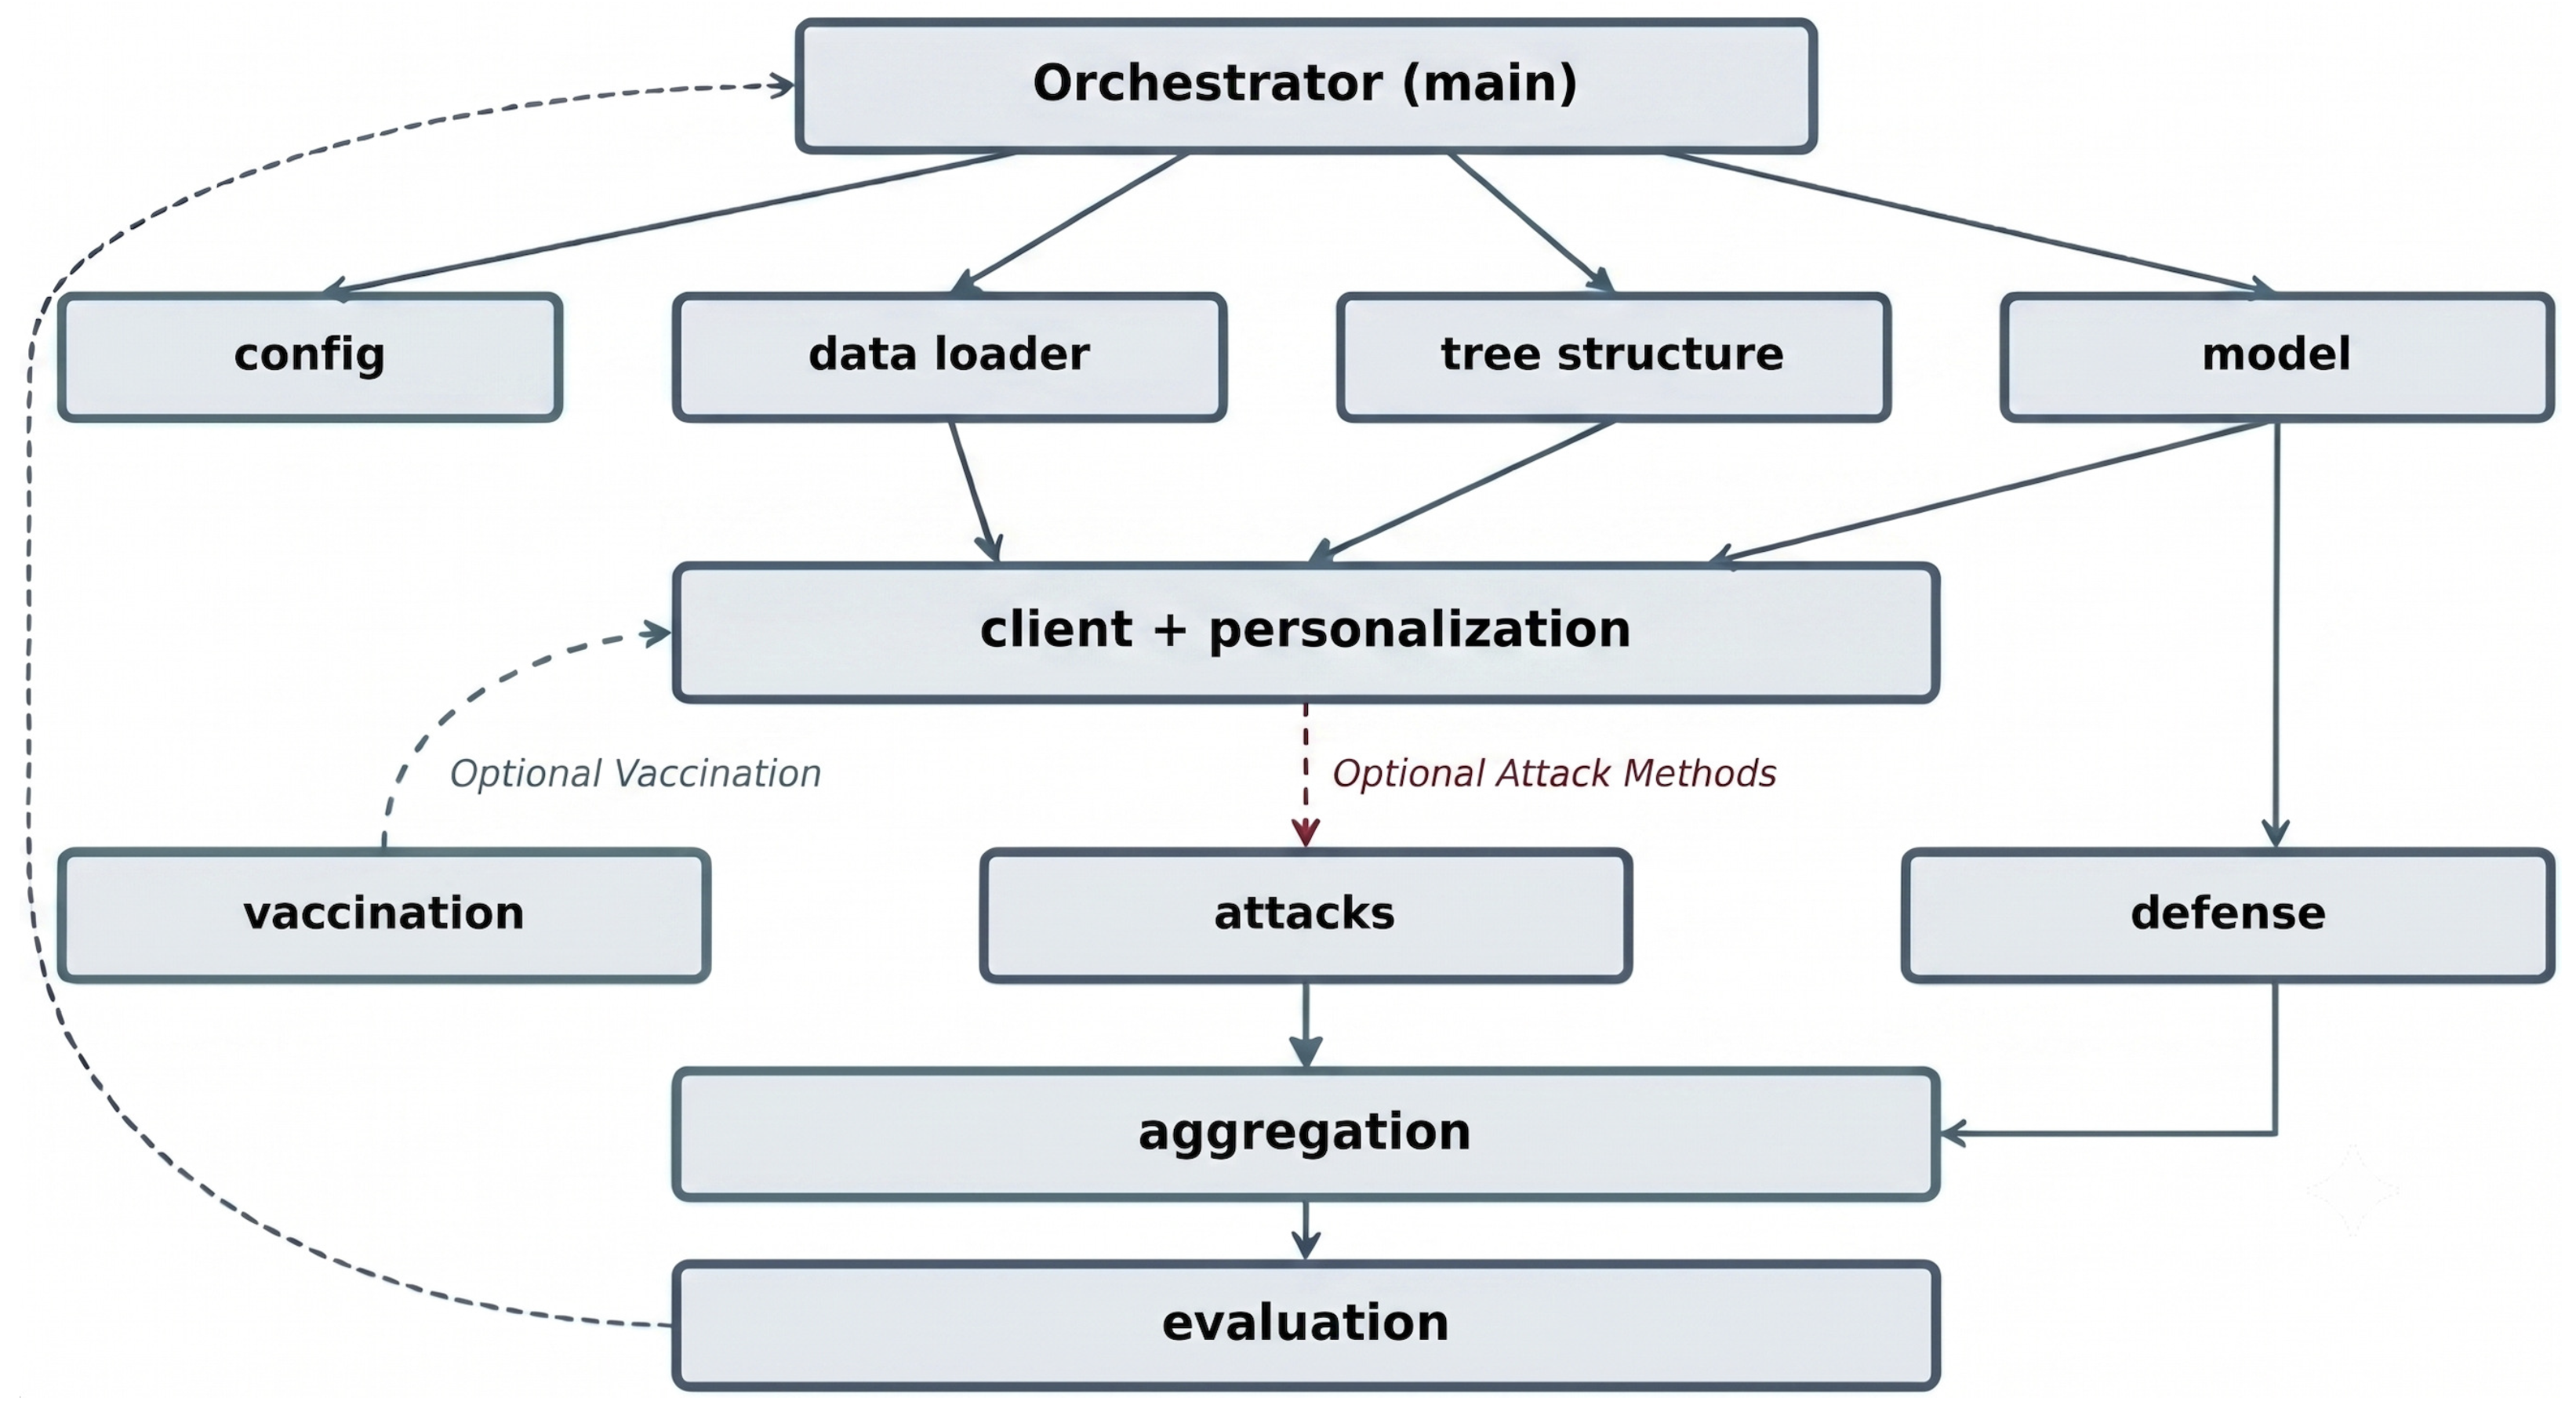
FLVaccin architecture and defense dataflow. Setup modules configure the unbalanced FedPer tree. During client training, vaccination and potential attacks may be applied. The defense mechanism implements per-client quarantine and, optionally, root backbone rejection prior to bottom-up aggregation and evaluation. The primary innovation is the coupling of vaccination, tolerance, and quarantine mechanisms across different tree depths.
Figure 2.
FLVaccin architecture and defense dataflow. Setup modules configure the unbalanced FedPer tree. During client training, vaccination and potential attacks may be applied. The defense mechanism implements per-client quarantine and, optionally, root backbone rejection prior to bottom-up aggregation and evaluation. The primary innovation is the coupling of vaccination, tolerance, and quarantine mechanisms across different tree depths.
Figure 3.
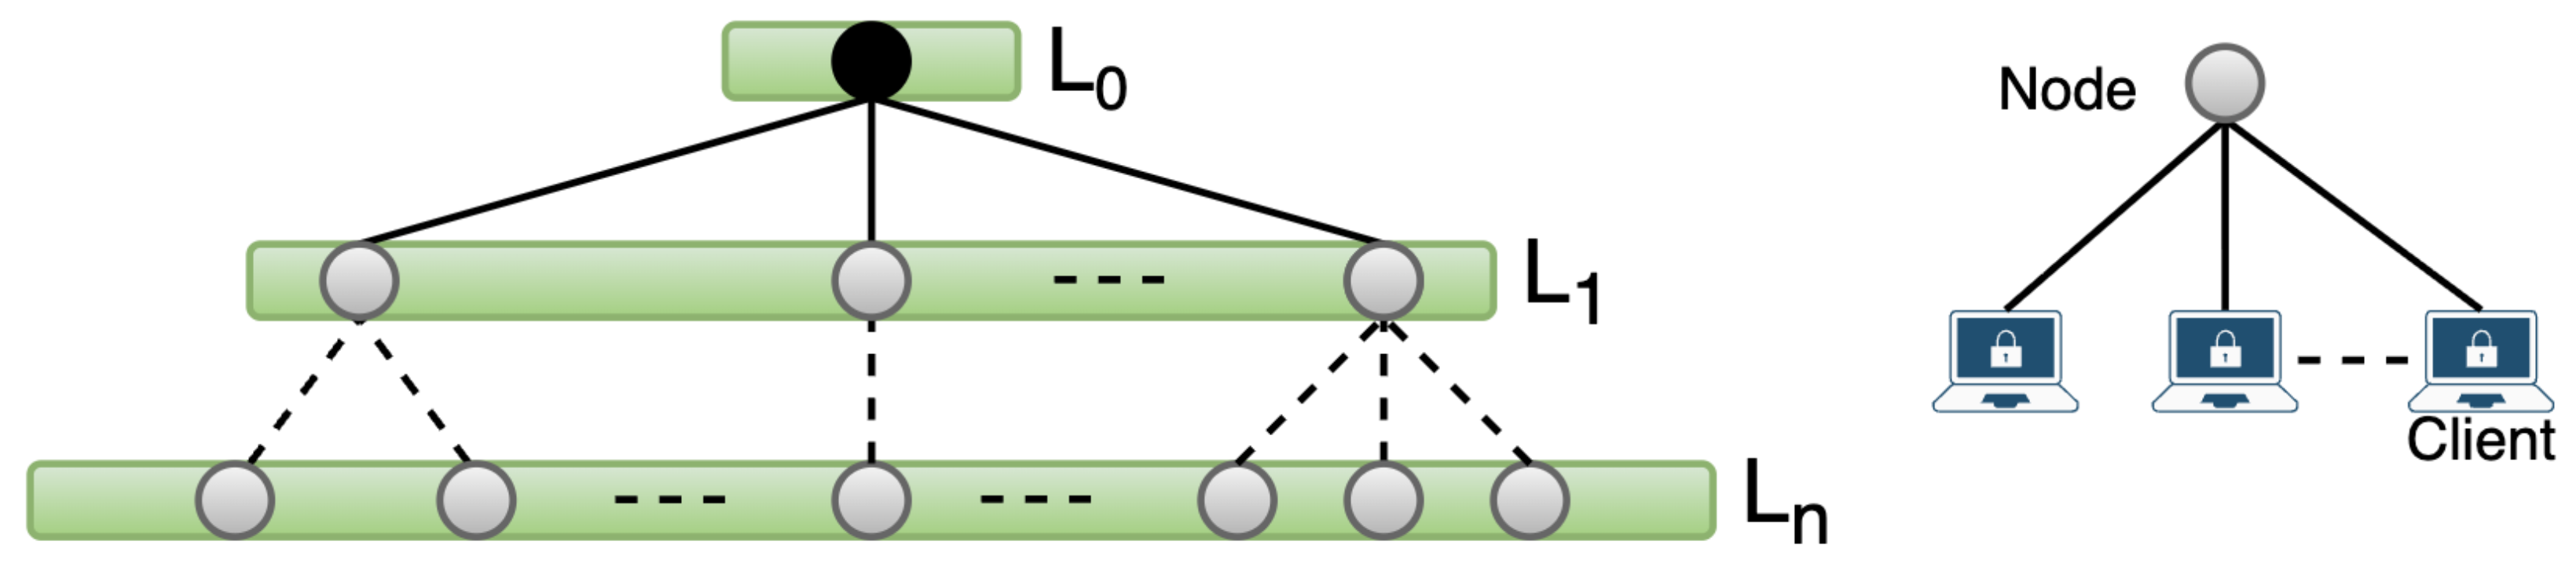
Schematic unbalanced hierarchical FL tree under FedPer. Green bars: levels . Black circle: root (no local clients). Grey circles: non-root aggregators that FedPer-aggregate child shared backbones; each may host 0–N local clients (right inset). Lines: federation flow between levels and from node to clients.
Figure 3.
Schematic unbalanced hierarchical FL tree under FedPer. Green bars: levels . Black circle: root (no local clients). Grey circles: non-root aggregators that FedPer-aggregate child shared backbones; each may host 0–N local clients (right inset). Lines: federation flow between levels and from node to clients.
Figure 4.
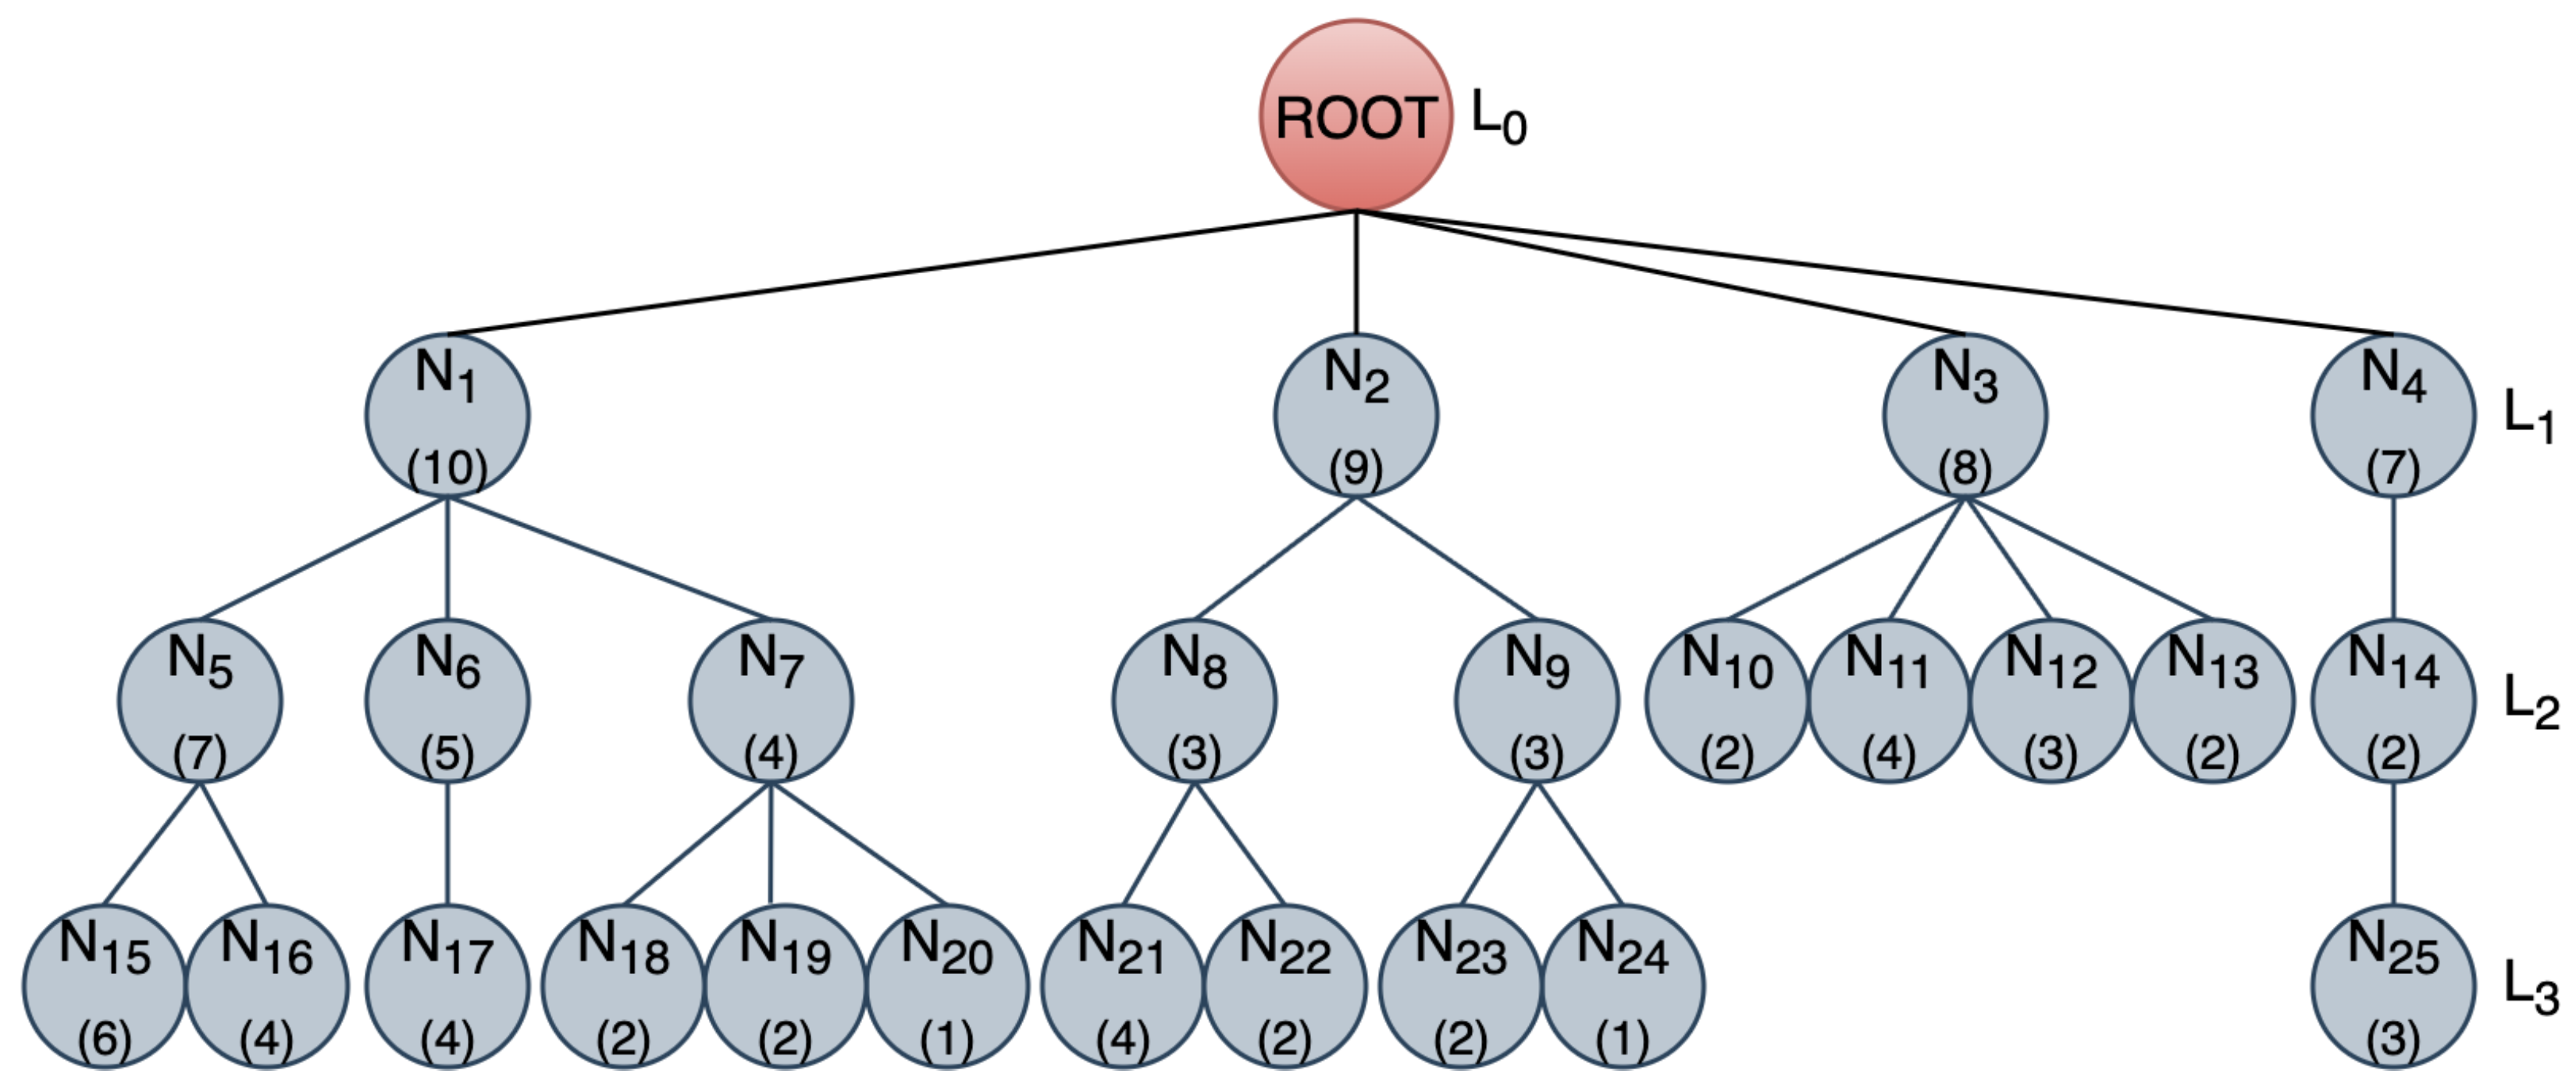
Fixed experimental unbalanced tree used in all scenarios. Four hierarchy levels (–): the root at (red) has zero local clients; blue nodes – are non-root aggregators at levels 1–3. Edges show heterogeneous fan-out (e.g., has three children; has one; is a leaf). Parenthetical counts are hosted clients per node (1–10; 100 total). The same structure is instantiated in every run reported below.
Figure 4.
Fixed experimental unbalanced tree used in all scenarios. Four hierarchy levels (–): the root at (red) has zero local clients; blue nodes – are non-root aggregators at levels 1–3. Edges show heterogeneous fan-out (e.g., has three children; has one; is a leaf). Parenthetical counts are hosted clients per node (1–10; 100 total). The same structure is instantiated in every run reported below.
Figure 5.
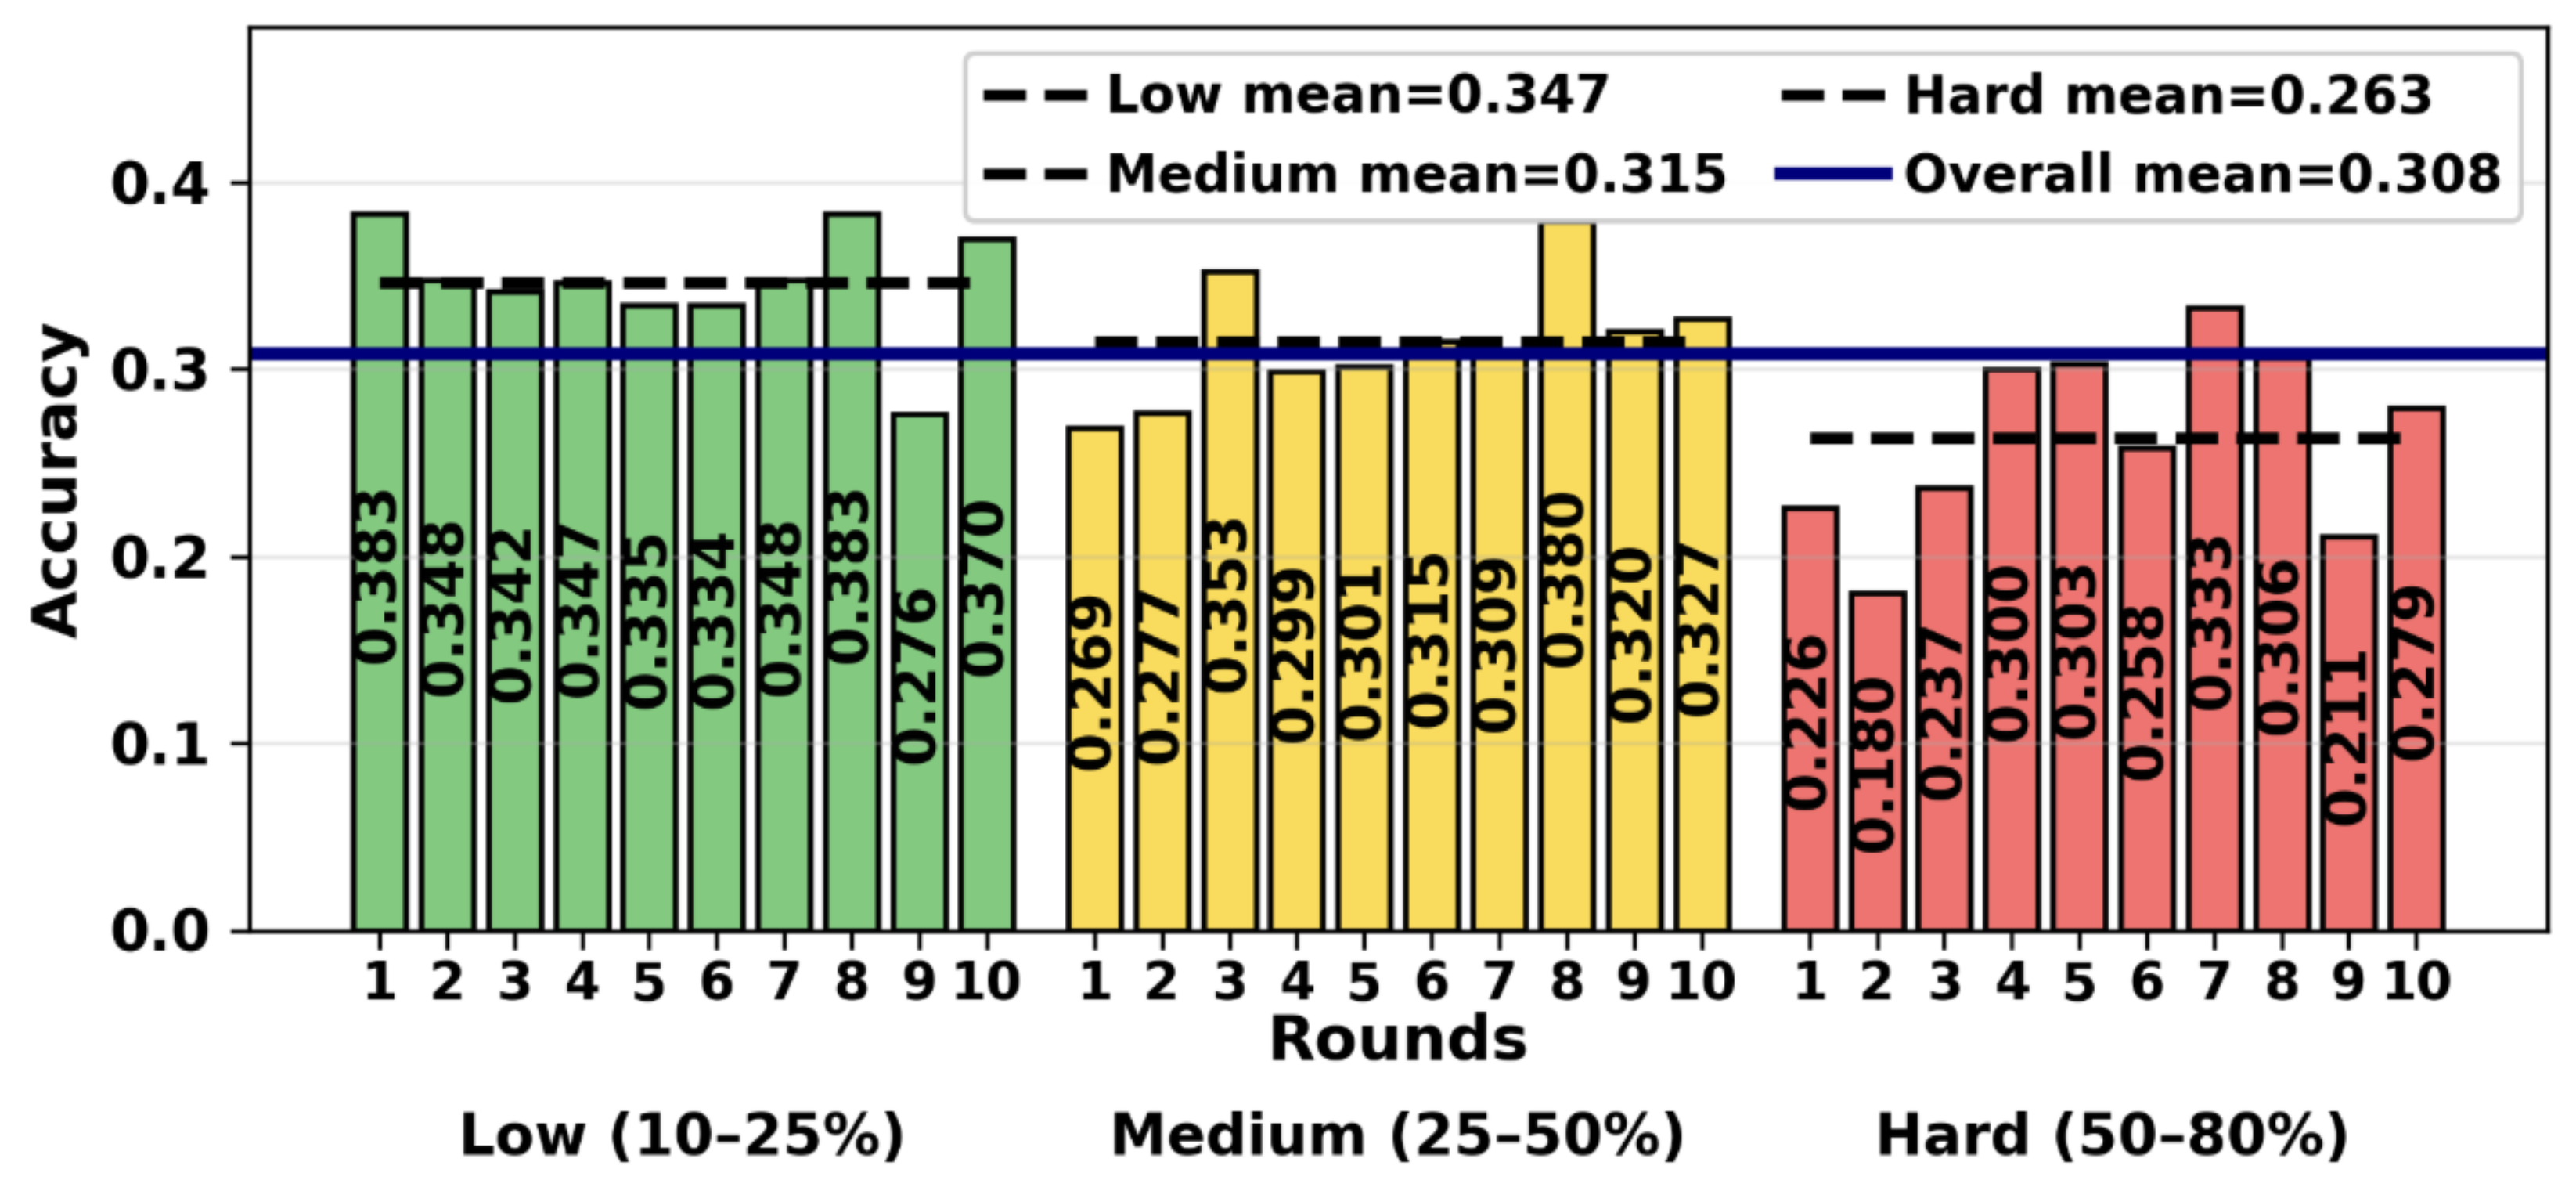
Round 1 global accuracy across 30 vaccination calibration runs on the fixed tree (one federated round per run). Bars are grouped by vaccination band—Low, Medium, and Hard (10–25%, 25–50%, and 50–80% node coverage and per-node injection, respectively)—with ten runs per band. Dashed horizontal lines: tier means (Low 34.7%, Medium 31.5%, Hard 26.3%); solid navy line: overall mean 30.8%. Per-run values are printed inside each bar.
Figure 5.
Round 1 global accuracy across 30 vaccination calibration runs on the fixed tree (one federated round per run). Bars are grouped by vaccination band—Low, Medium, and Hard (10–25%, 25–50%, and 50–80% node coverage and per-node injection, respectively)—with ten runs per band. Dashed horizontal lines: tier means (Low 34.7%, Medium 31.5%, Hard 26.3%); solid navy line: overall mean 30.8%. Per-run values are printed inside each bar.
Figure 6.
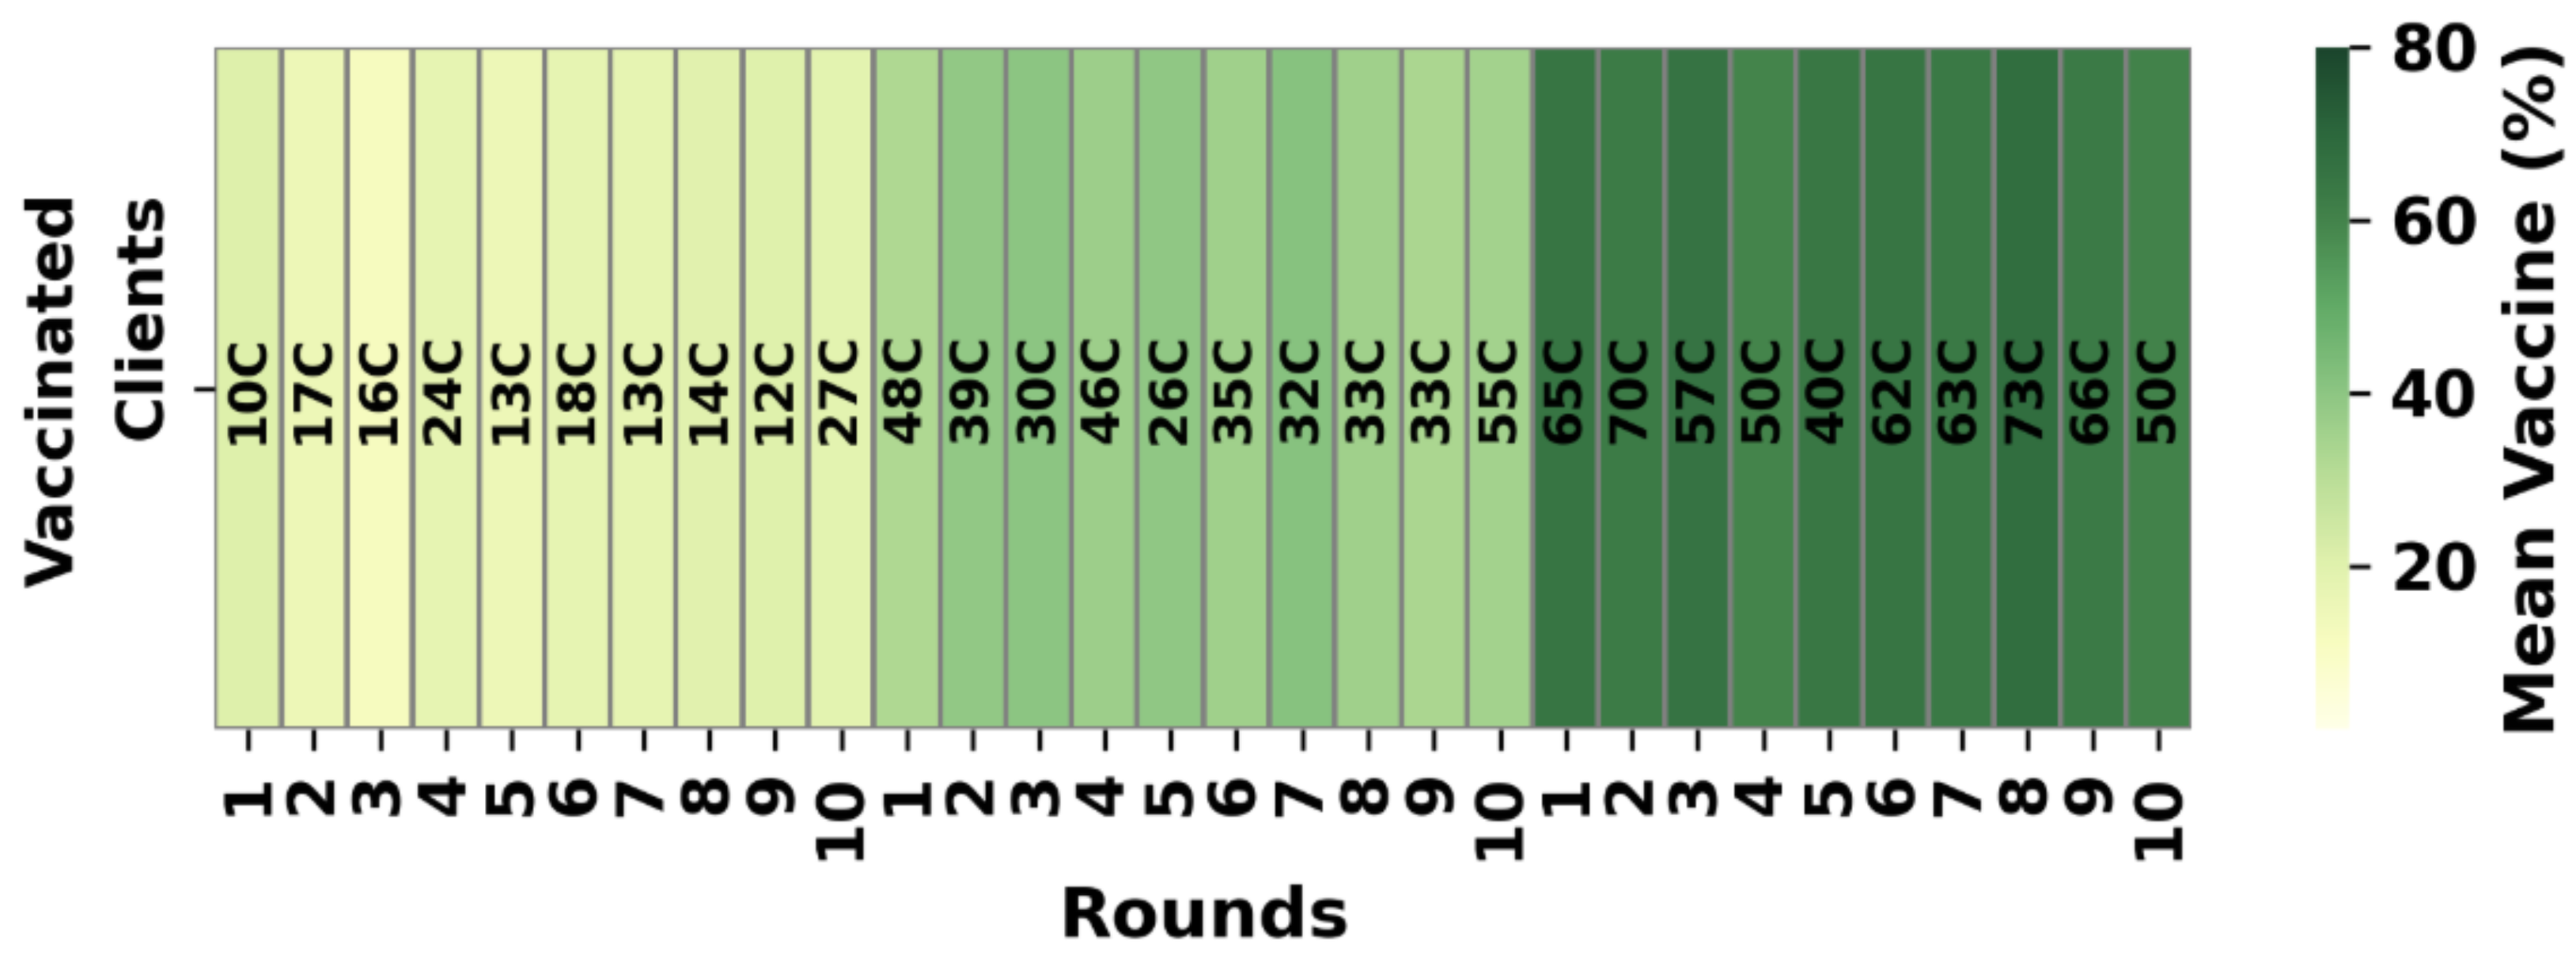
Vaccination configuration sampled in each calibration run. Cell color: mean CIFAR-100 injection percentage across vaccinated nodes (scale 0–80%). Cell label (e.g., “12C”): number of hosted clients at vaccinated nodes for that run. Runs are grouped by the same Low, Medium, and Hard bands; darker cells in the Hard band reflect both broader node coverage and higher per-node injection rates.
Figure 6.
Vaccination configuration sampled in each calibration run. Cell color: mean CIFAR-100 injection percentage across vaccinated nodes (scale 0–80%). Cell label (e.g., “12C”): number of hosted clients at vaccinated nodes for that run. Runs are grouped by the same Low, Medium, and Hard bands; darker cells in the Hard band reflect both broader node coverage and higher per-node injection rates.
Figure 7.
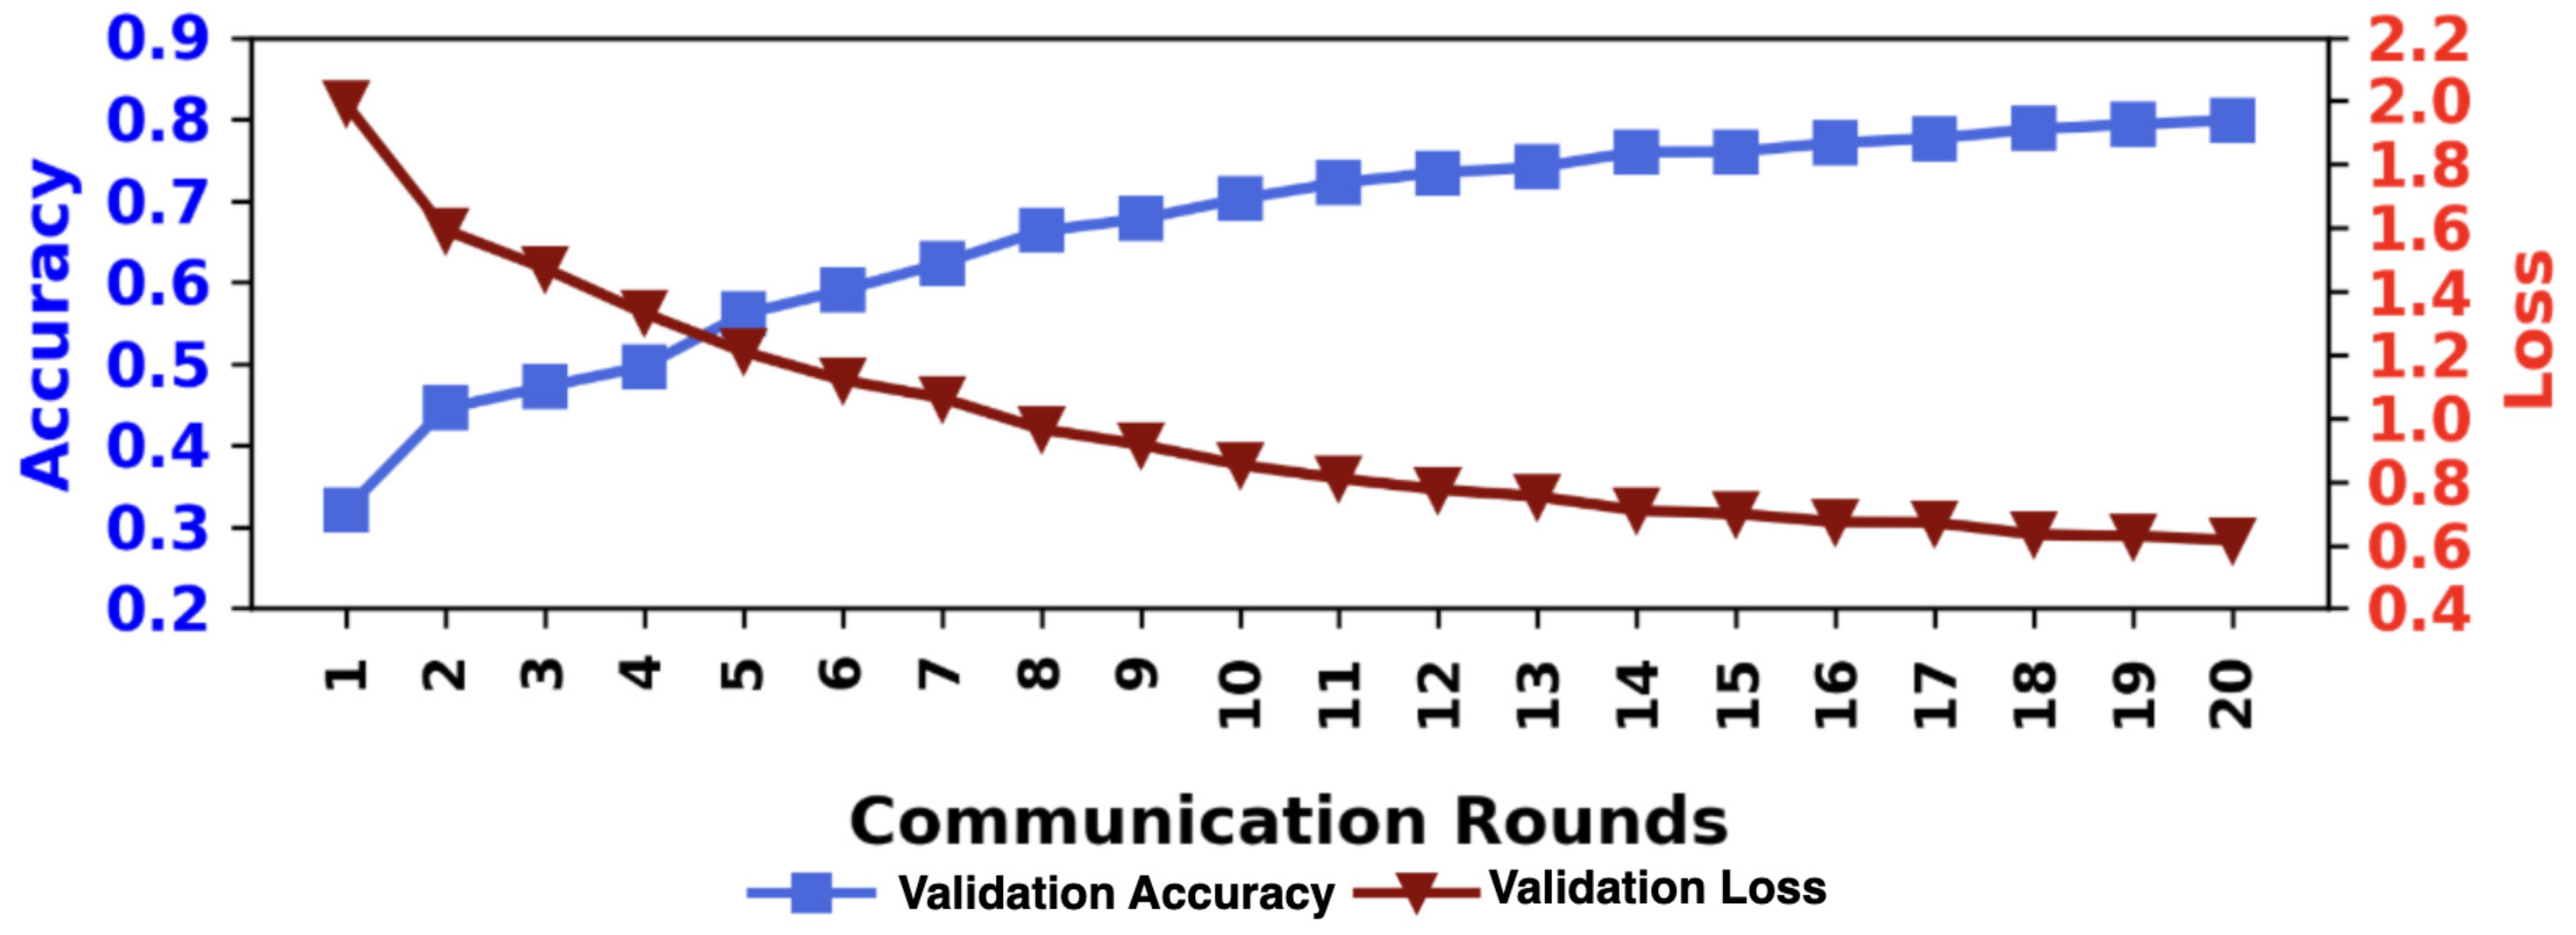
Global validation accuracy and loss during clean 20-round hierarchical FedPer training on the fixed tree. Dual y-axes: accuracy (left, blue) and cross-entropy loss (right, red) evaluated on the full CIFAR-10 test set at the root after each communication round.
Figure 7.
Global validation accuracy and loss during clean 20-round hierarchical FedPer training on the fixed tree. Dual y-axes: accuracy (left, blue) and cross-entropy loss (right, red) evaluated on the full CIFAR-10 test set at the root after each communication round.
Figure 8.
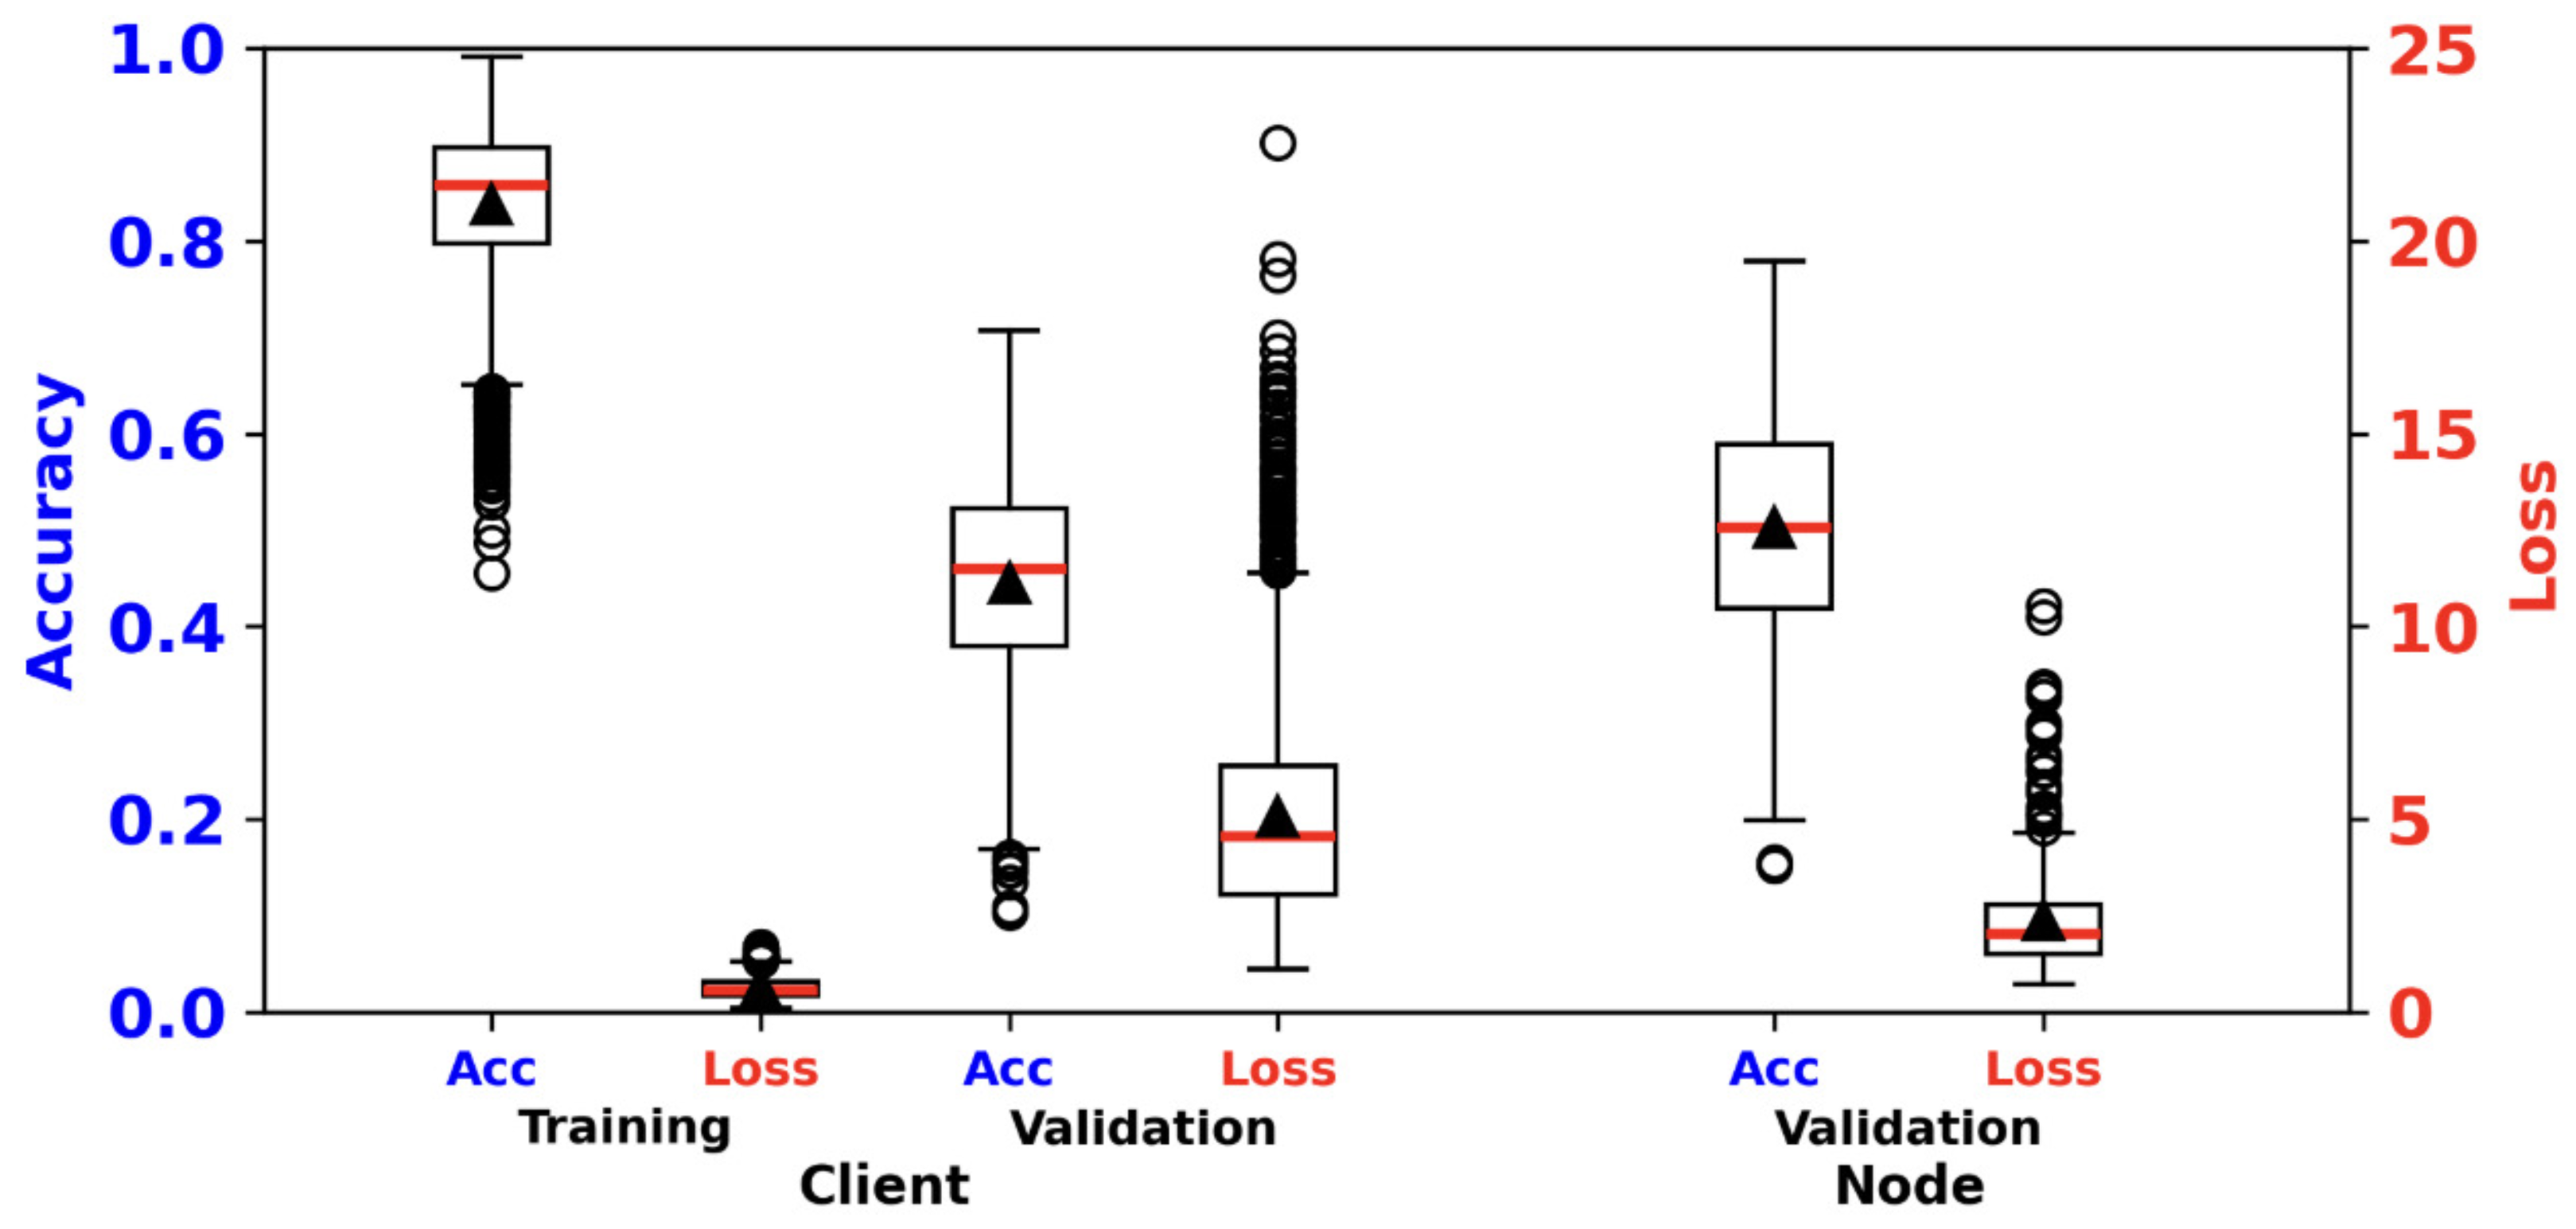
Distribution of training and validation metrics across hosted clients and aggregator nodes, pooled over all 20 communication rounds. Dual y-axes: accuracy (left, blue) and loss (right, red). Red line: median; black triangle: mean; circles: outliers.
Figure 8.
Distribution of training and validation metrics across hosted clients and aggregator nodes, pooled over all 20 communication rounds. Dual y-axes: accuracy (left, blue) and loss (right, red). Red line: median; black triangle: mean; circles: outliers.
Figure 9.
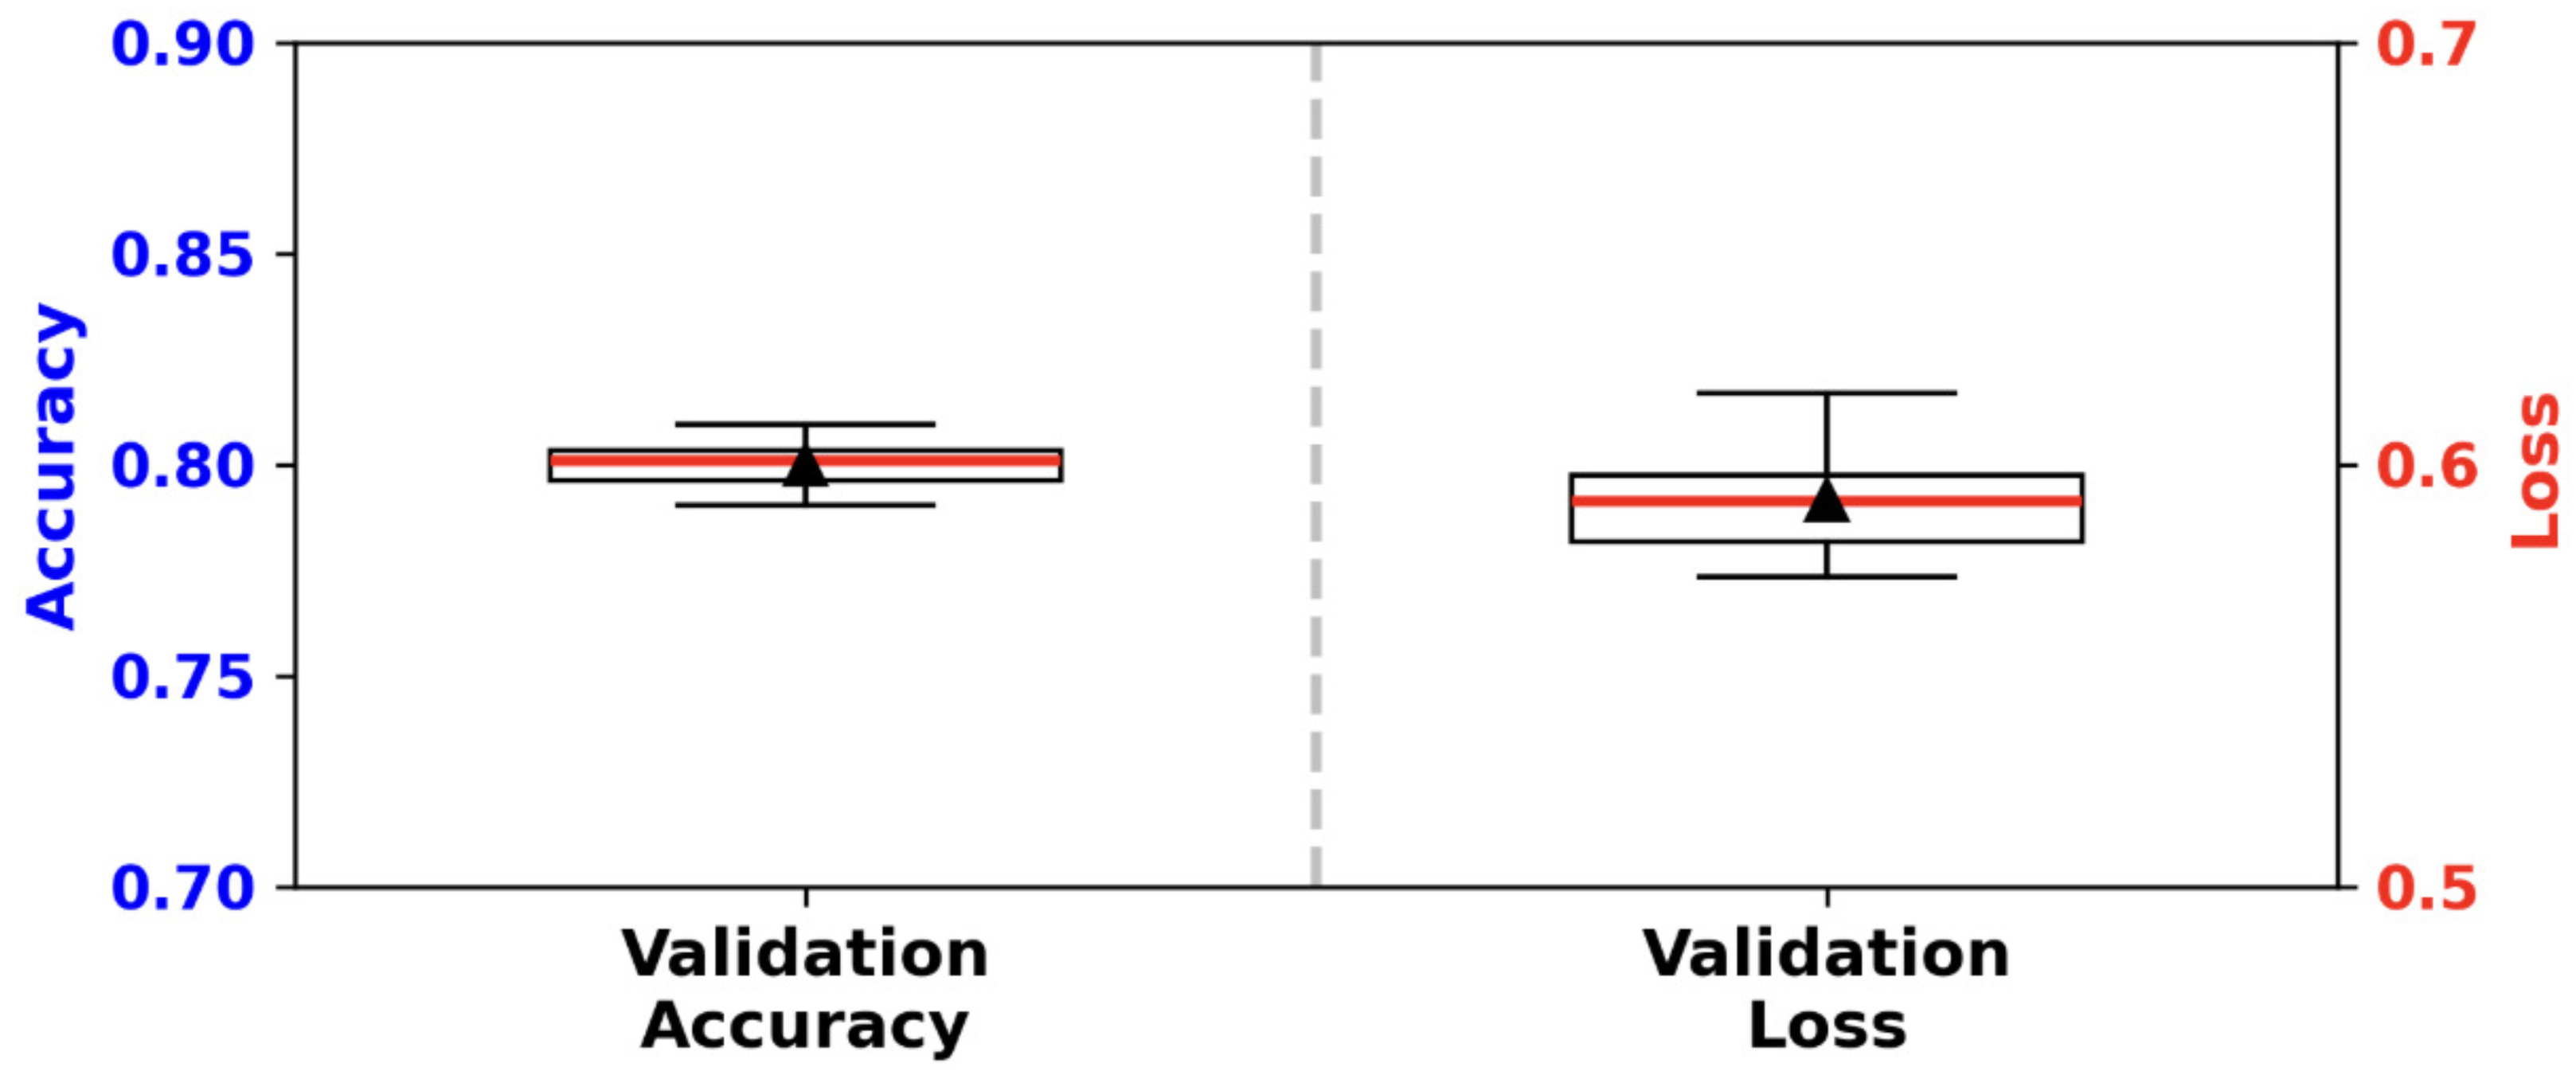
Repeated k-fold validation accuracy and loss for the frozen clean FedPer model (50 folds: 5-fold × 10 repeats). Red line: median; black triangle: mean.
Figure 9.
Repeated k-fold validation accuracy and loss for the frozen clean FedPer model (50 folds: 5-fold × 10 repeats). Red line: median; black triangle: mean.
Figure 10.
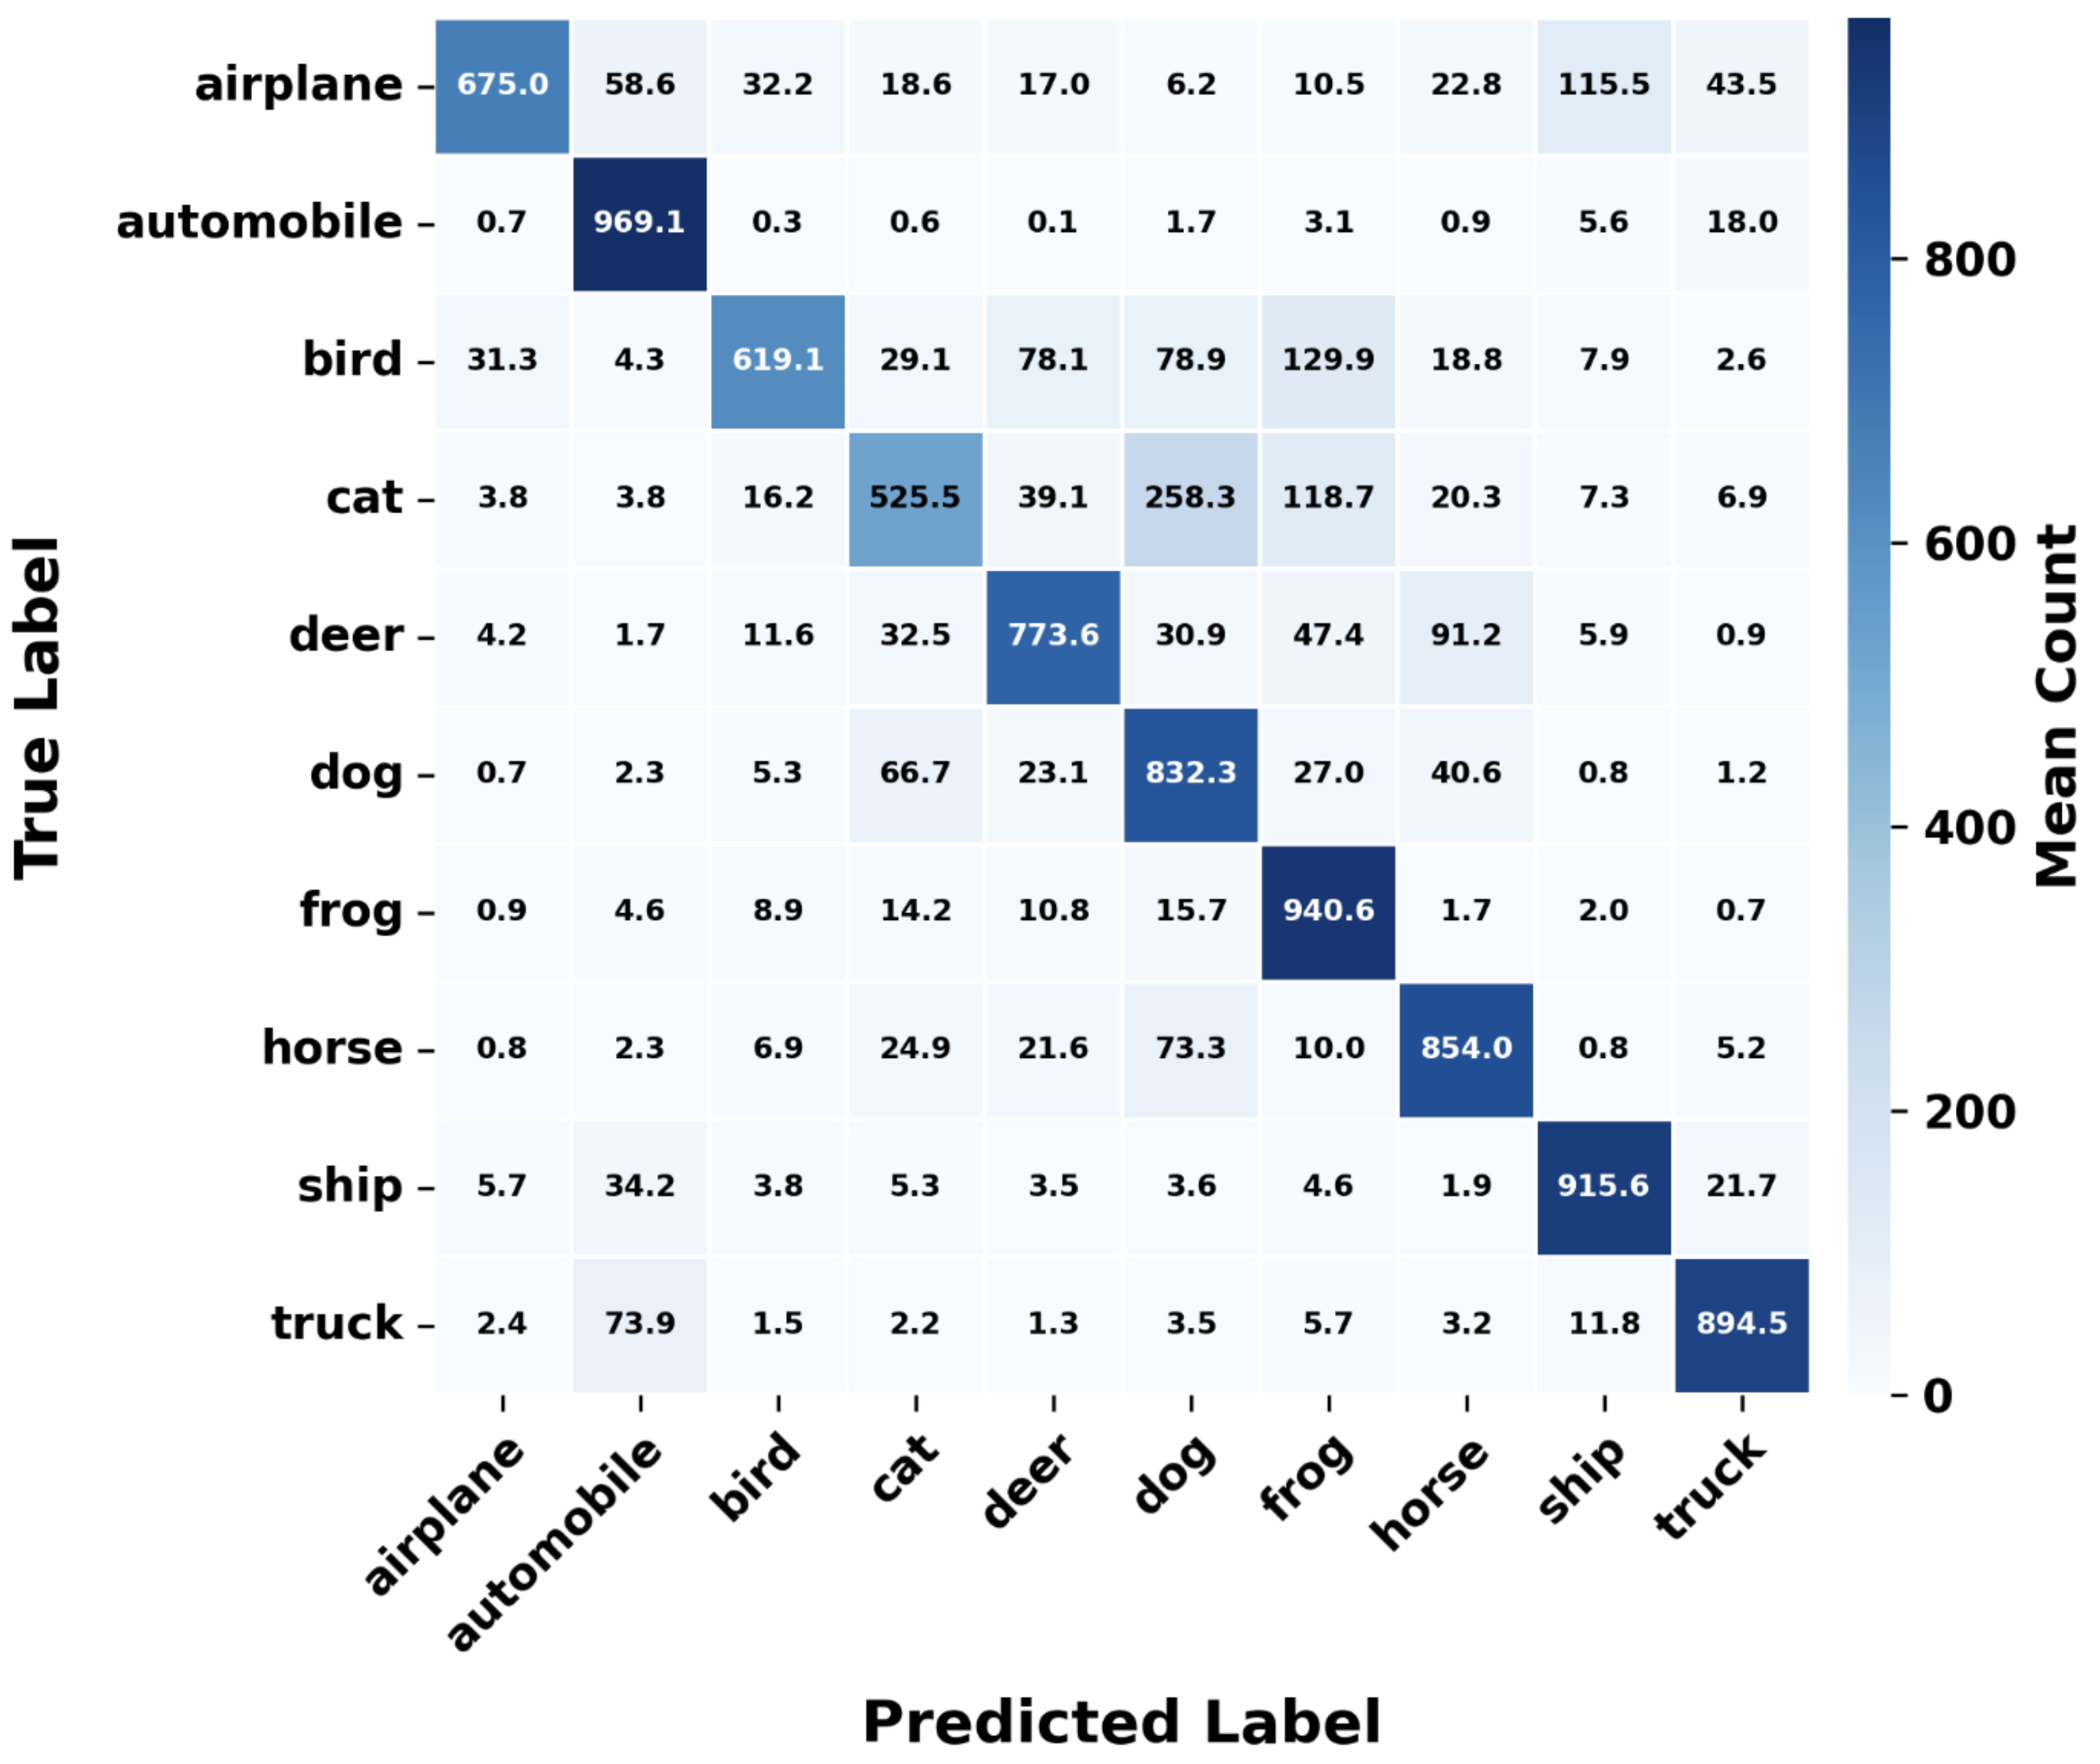
Mean k-fold confusion matrix for the clean baseline (aggregated over 50 validation folds). Cell values: mean predicted counts per true class; darker blue indicates higher counts.
Figure 10.
Mean k-fold confusion matrix for the clean baseline (aggregated over 50 validation folds). Cell values: mean predicted counts per true class; darker blue indicates higher counts.
Figure 11.
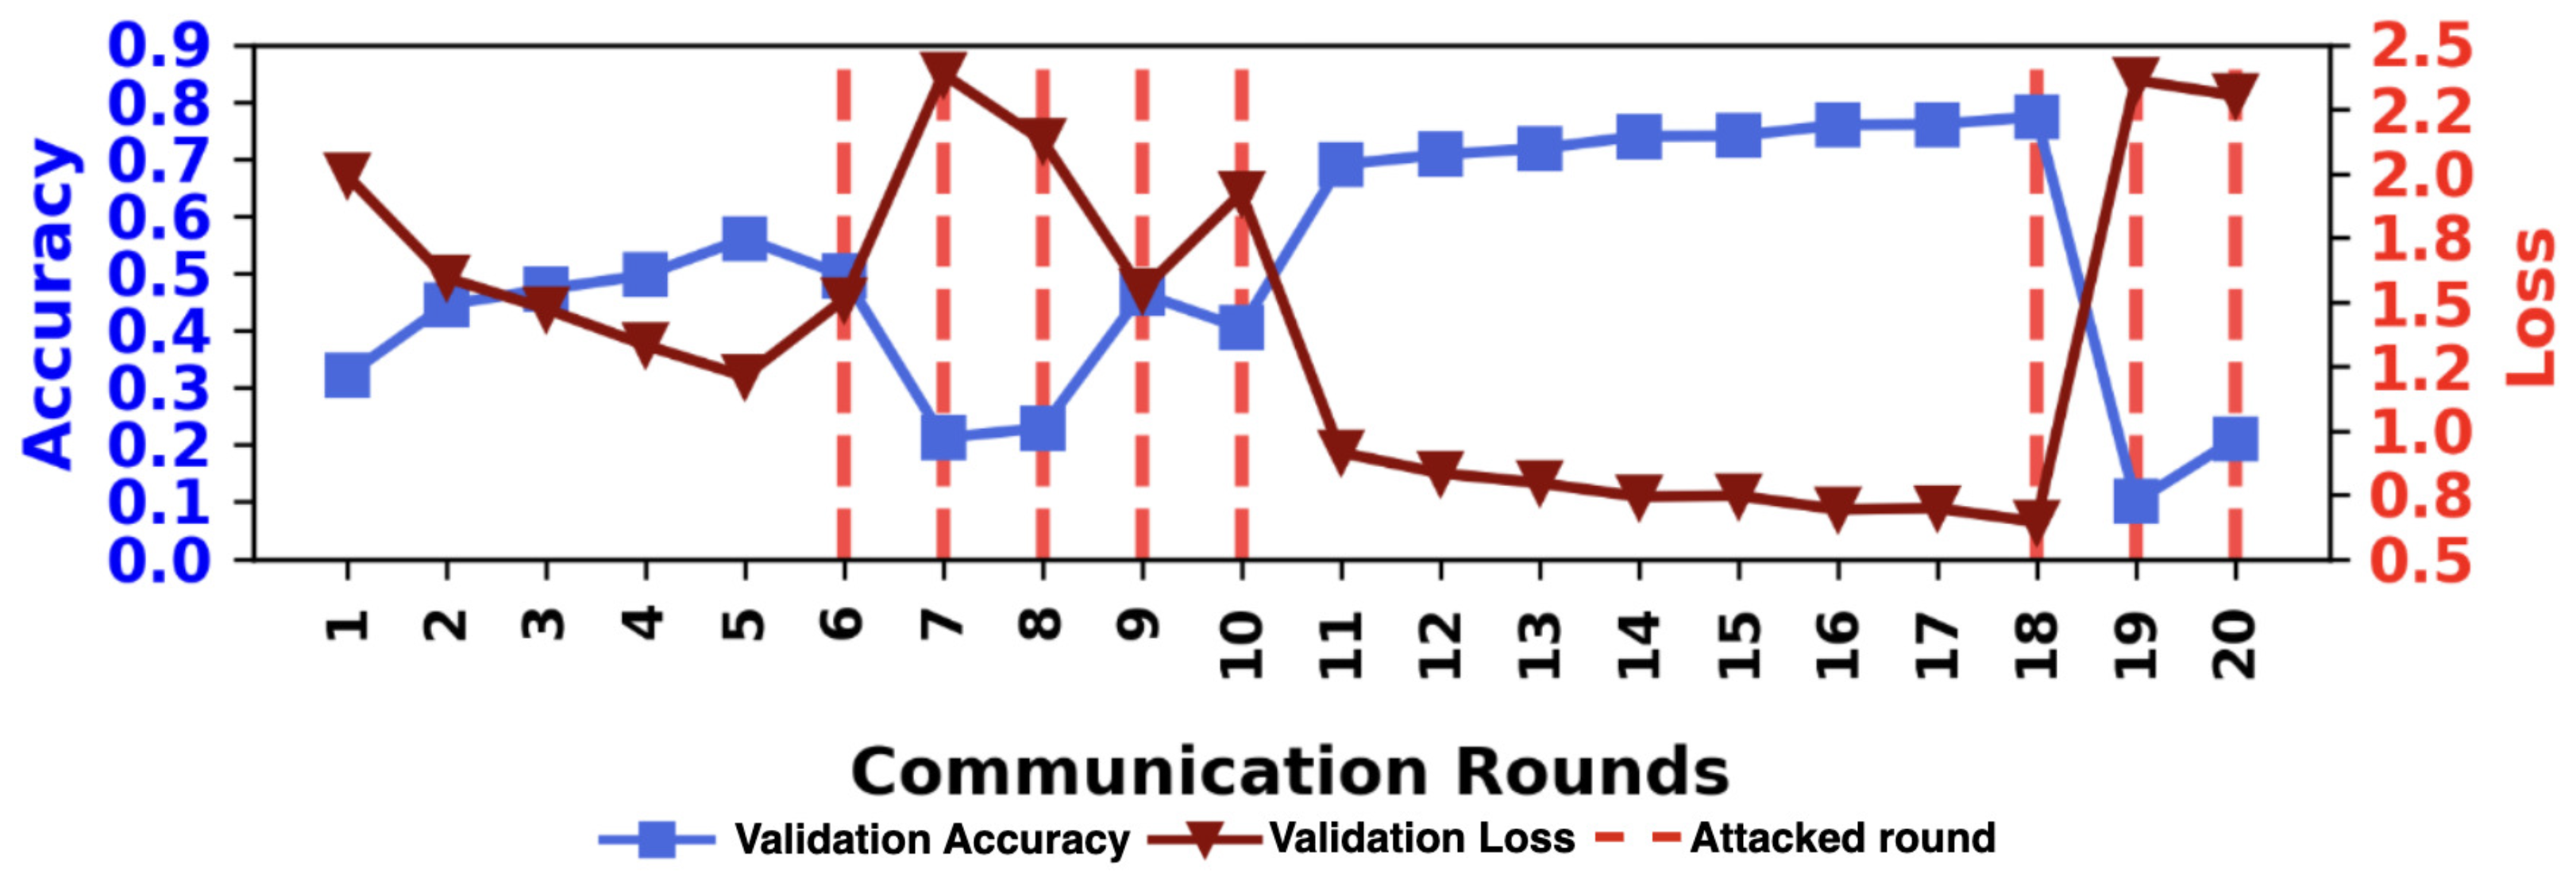
Global validation accuracy and loss under free-attack poisoning without defense. Dual y-axes: accuracy (left, blue) and loss (right, red) at the root after each round; dashed vertical lines mark attack rounds.
Figure 11.
Global validation accuracy and loss under free-attack poisoning without defense. Dual y-axes: accuracy (left, blue) and loss (right, red) at the root after each round; dashed vertical lines mark attack rounds.
Figure 12.
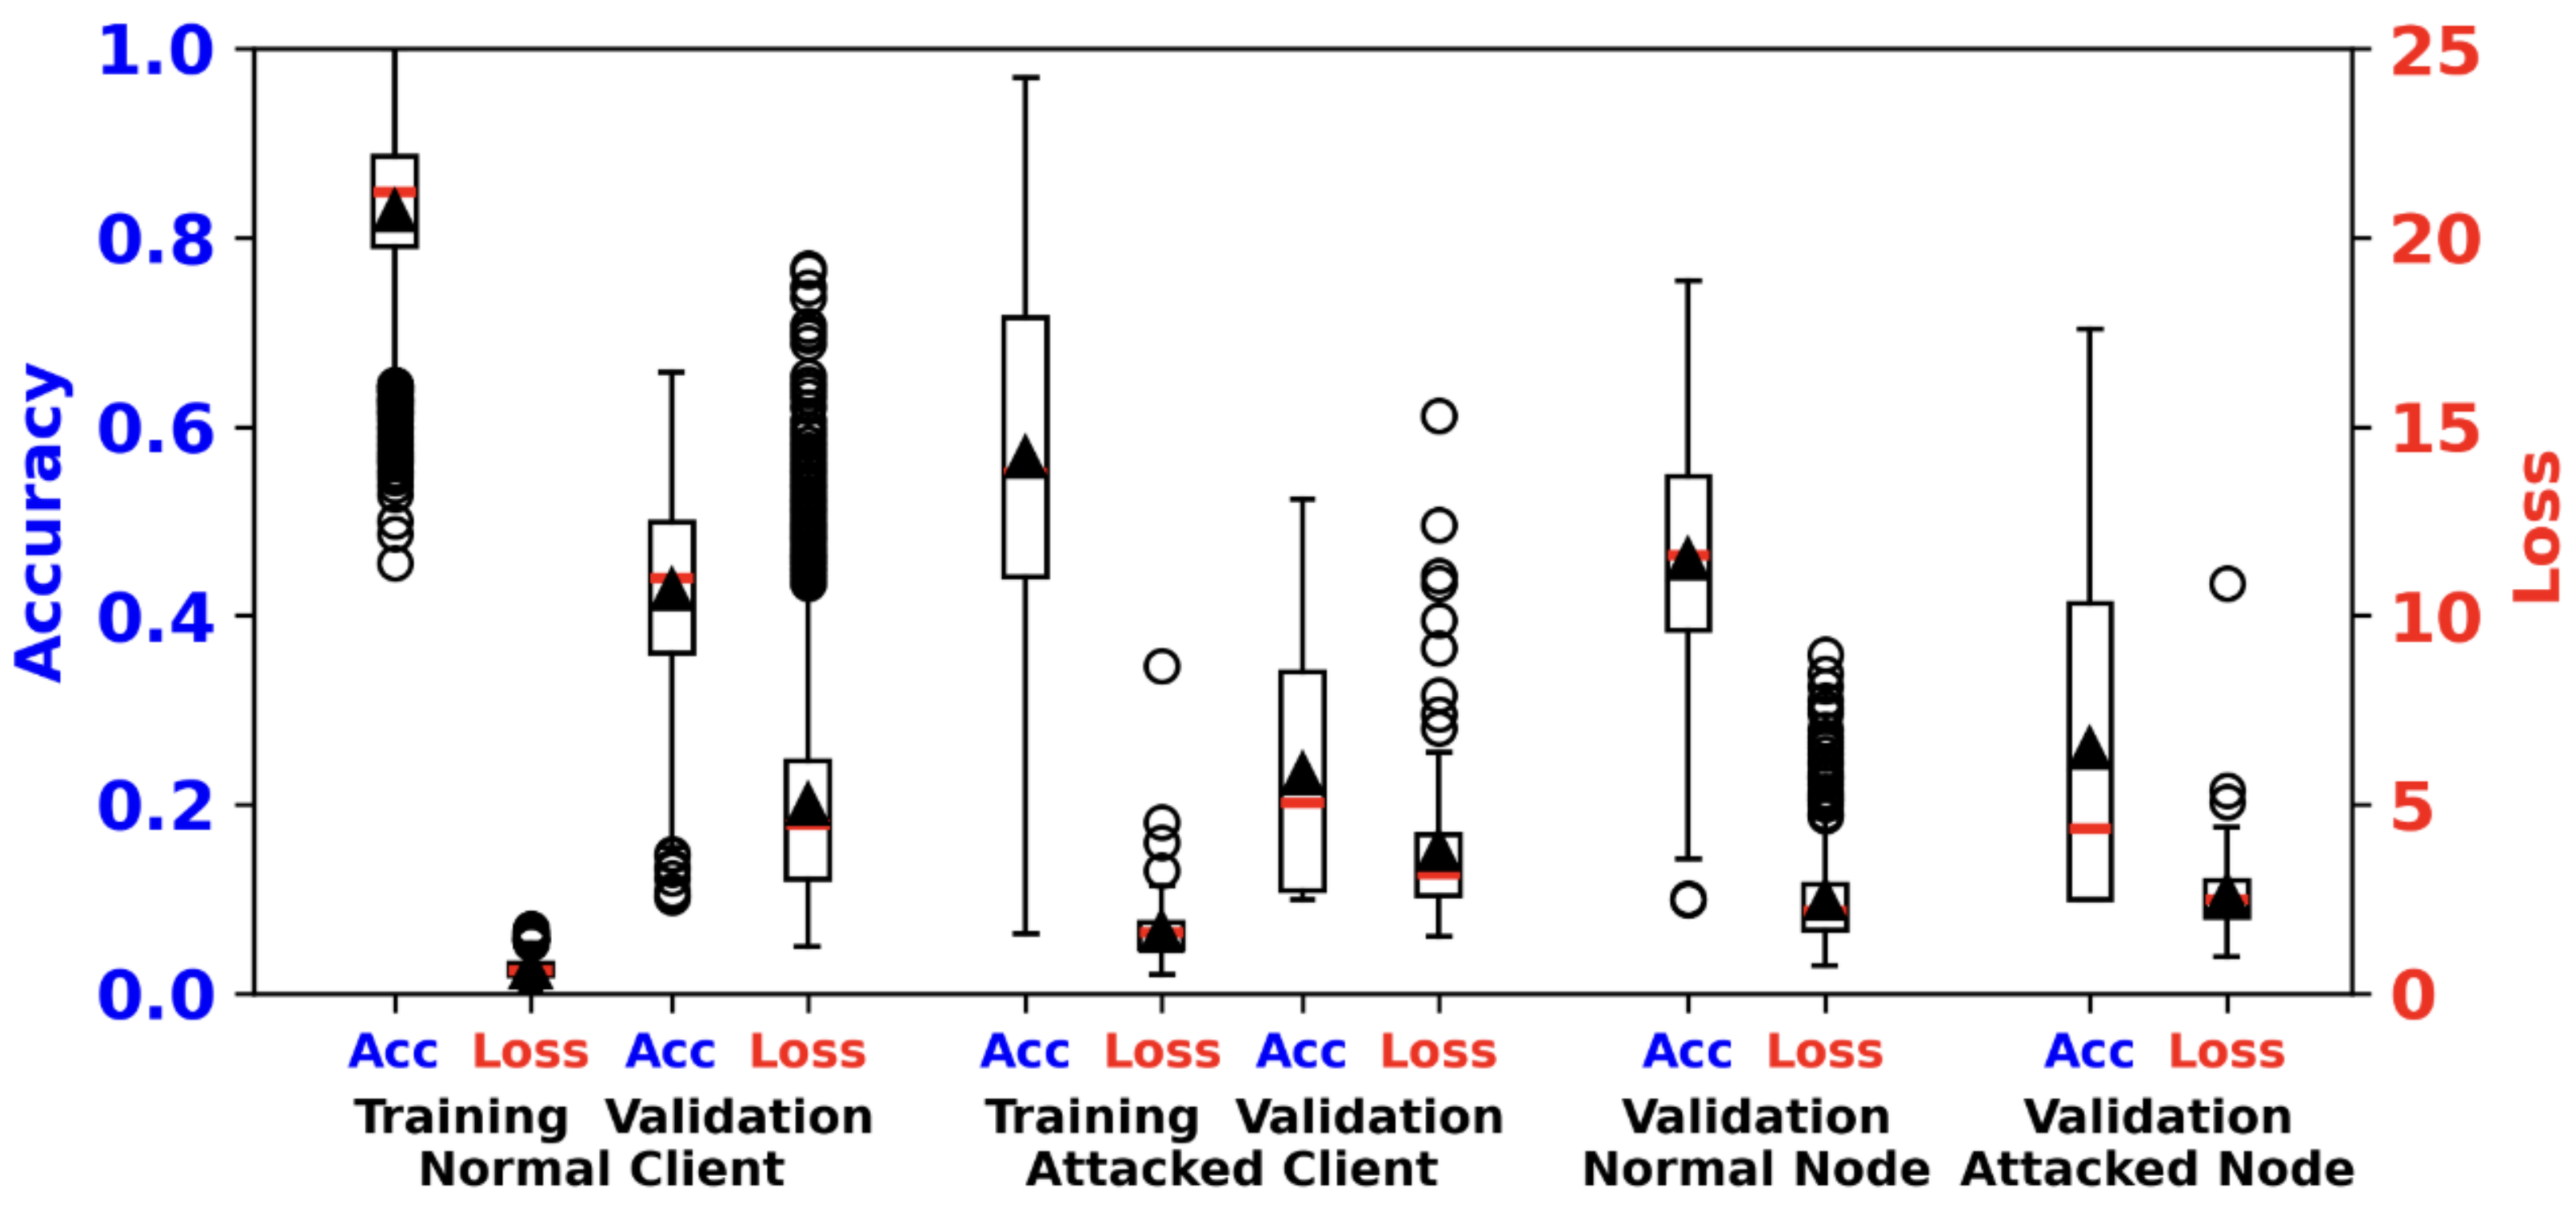
Distribution of training and validation metrics for normal vs. attacked clients and nodes under free attacks (pooled over all rounds). Dual y-axes: accuracy (left, blue) and loss (right, red). Red line: median; black triangle: mean; circles: outliers.
Figure 12.
Distribution of training and validation metrics for normal vs. attacked clients and nodes under free attacks (pooled over all rounds). Dual y-axes: accuracy (left, blue) and loss (right, red). Red line: median; black triangle: mean; circles: outliers.
Figure 13.
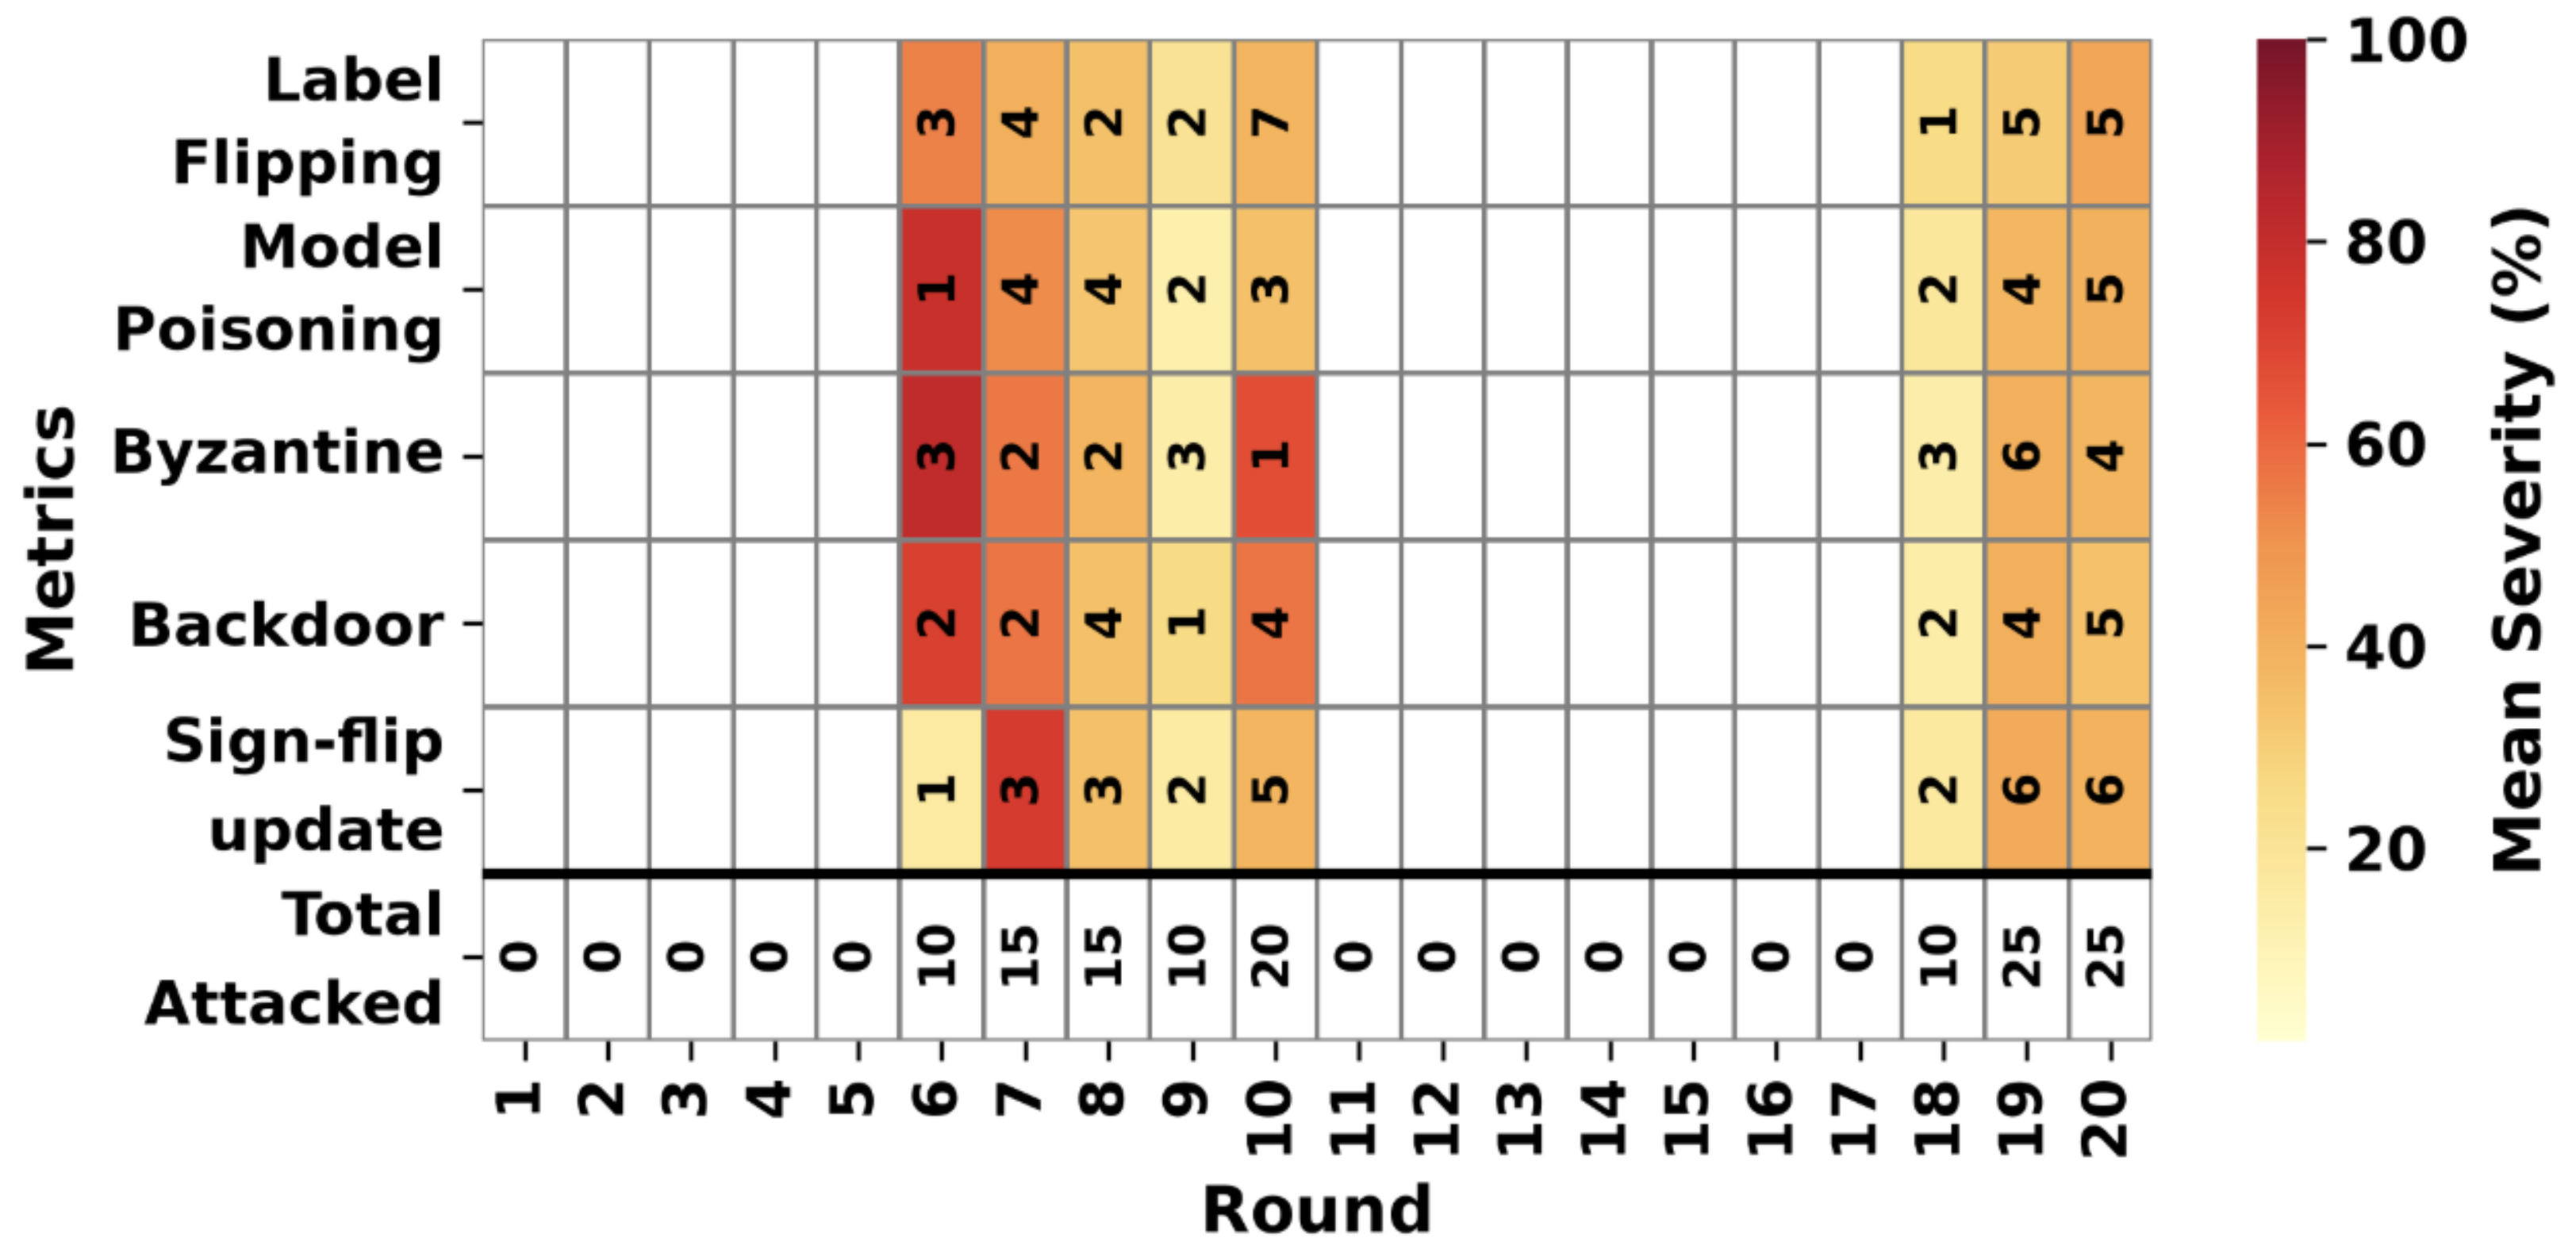
Attack-event timeline for the free-attack scenario. Rows: five attack types plus total attacked clients per round. Columns: communication rounds 1–20; color scale: mean severity (%). Cell labels: number of targeted clients per attack type (bottom row: total attacked clients). Attacks cluster in rounds 6–10 and 18–20.
Figure 13.
Attack-event timeline for the free-attack scenario. Rows: five attack types plus total attacked clients per round. Columns: communication rounds 1–20; color scale: mean severity (%). Cell labels: number of targeted clients per attack type (bottom row: total attacked clients). Attacks cluster in rounds 6–10 and 18–20.
Figure 14.
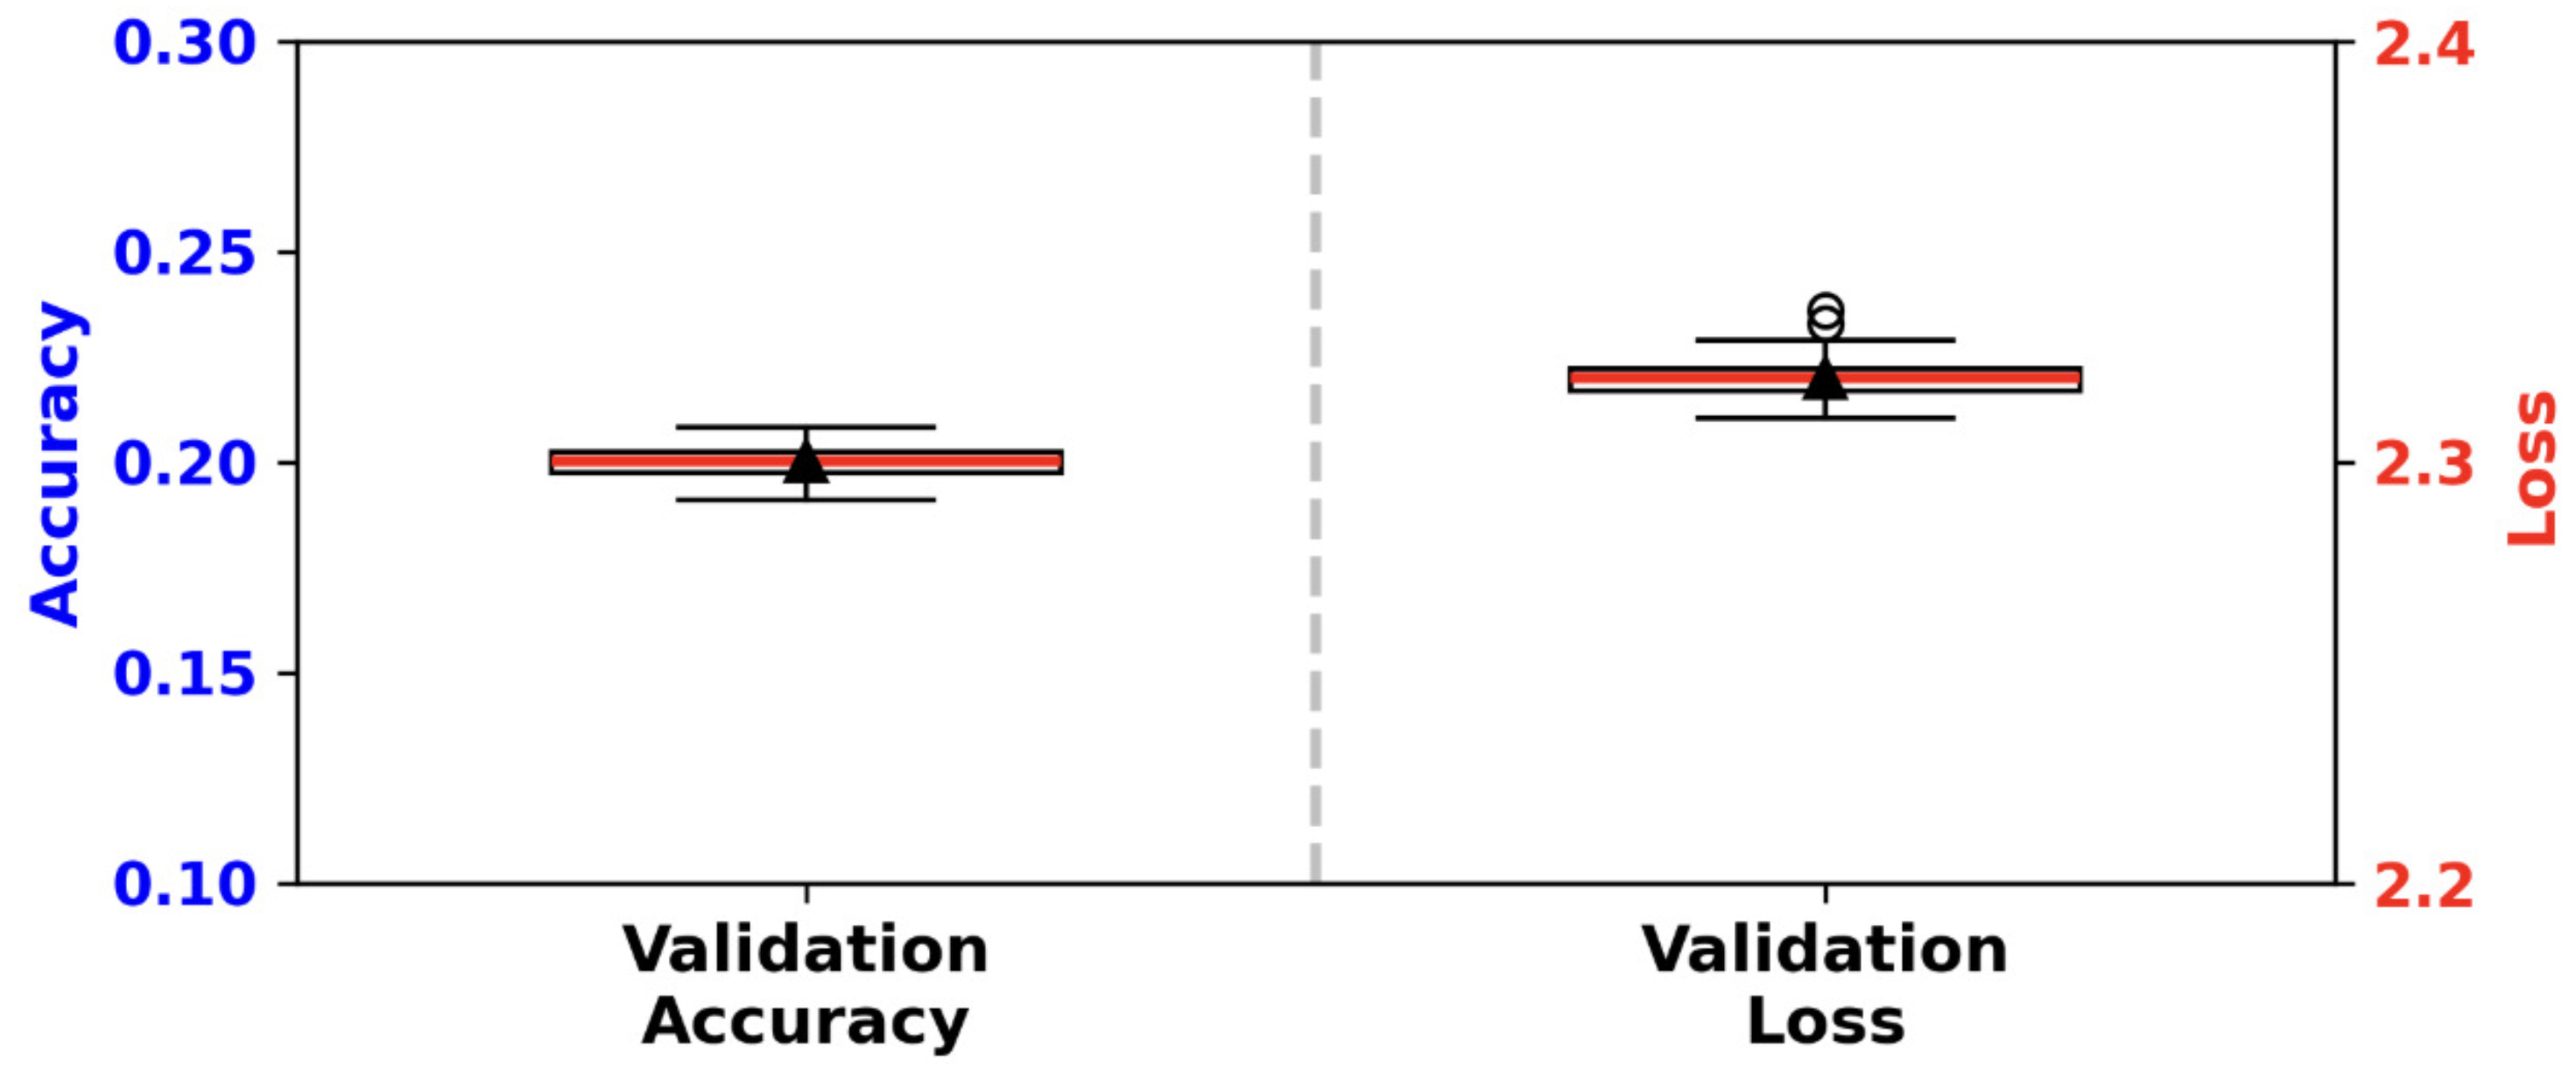
Repeated k-fold validation accuracy and loss for the frozen model after free-attack training (50 folds: 5-fold × 10 repeats). Red line: median; black triangle: mean.
Figure 14.
Repeated k-fold validation accuracy and loss for the frozen model after free-attack training (50 folds: 5-fold × 10 repeats). Red line: median; black triangle: mean.
Figure 15.
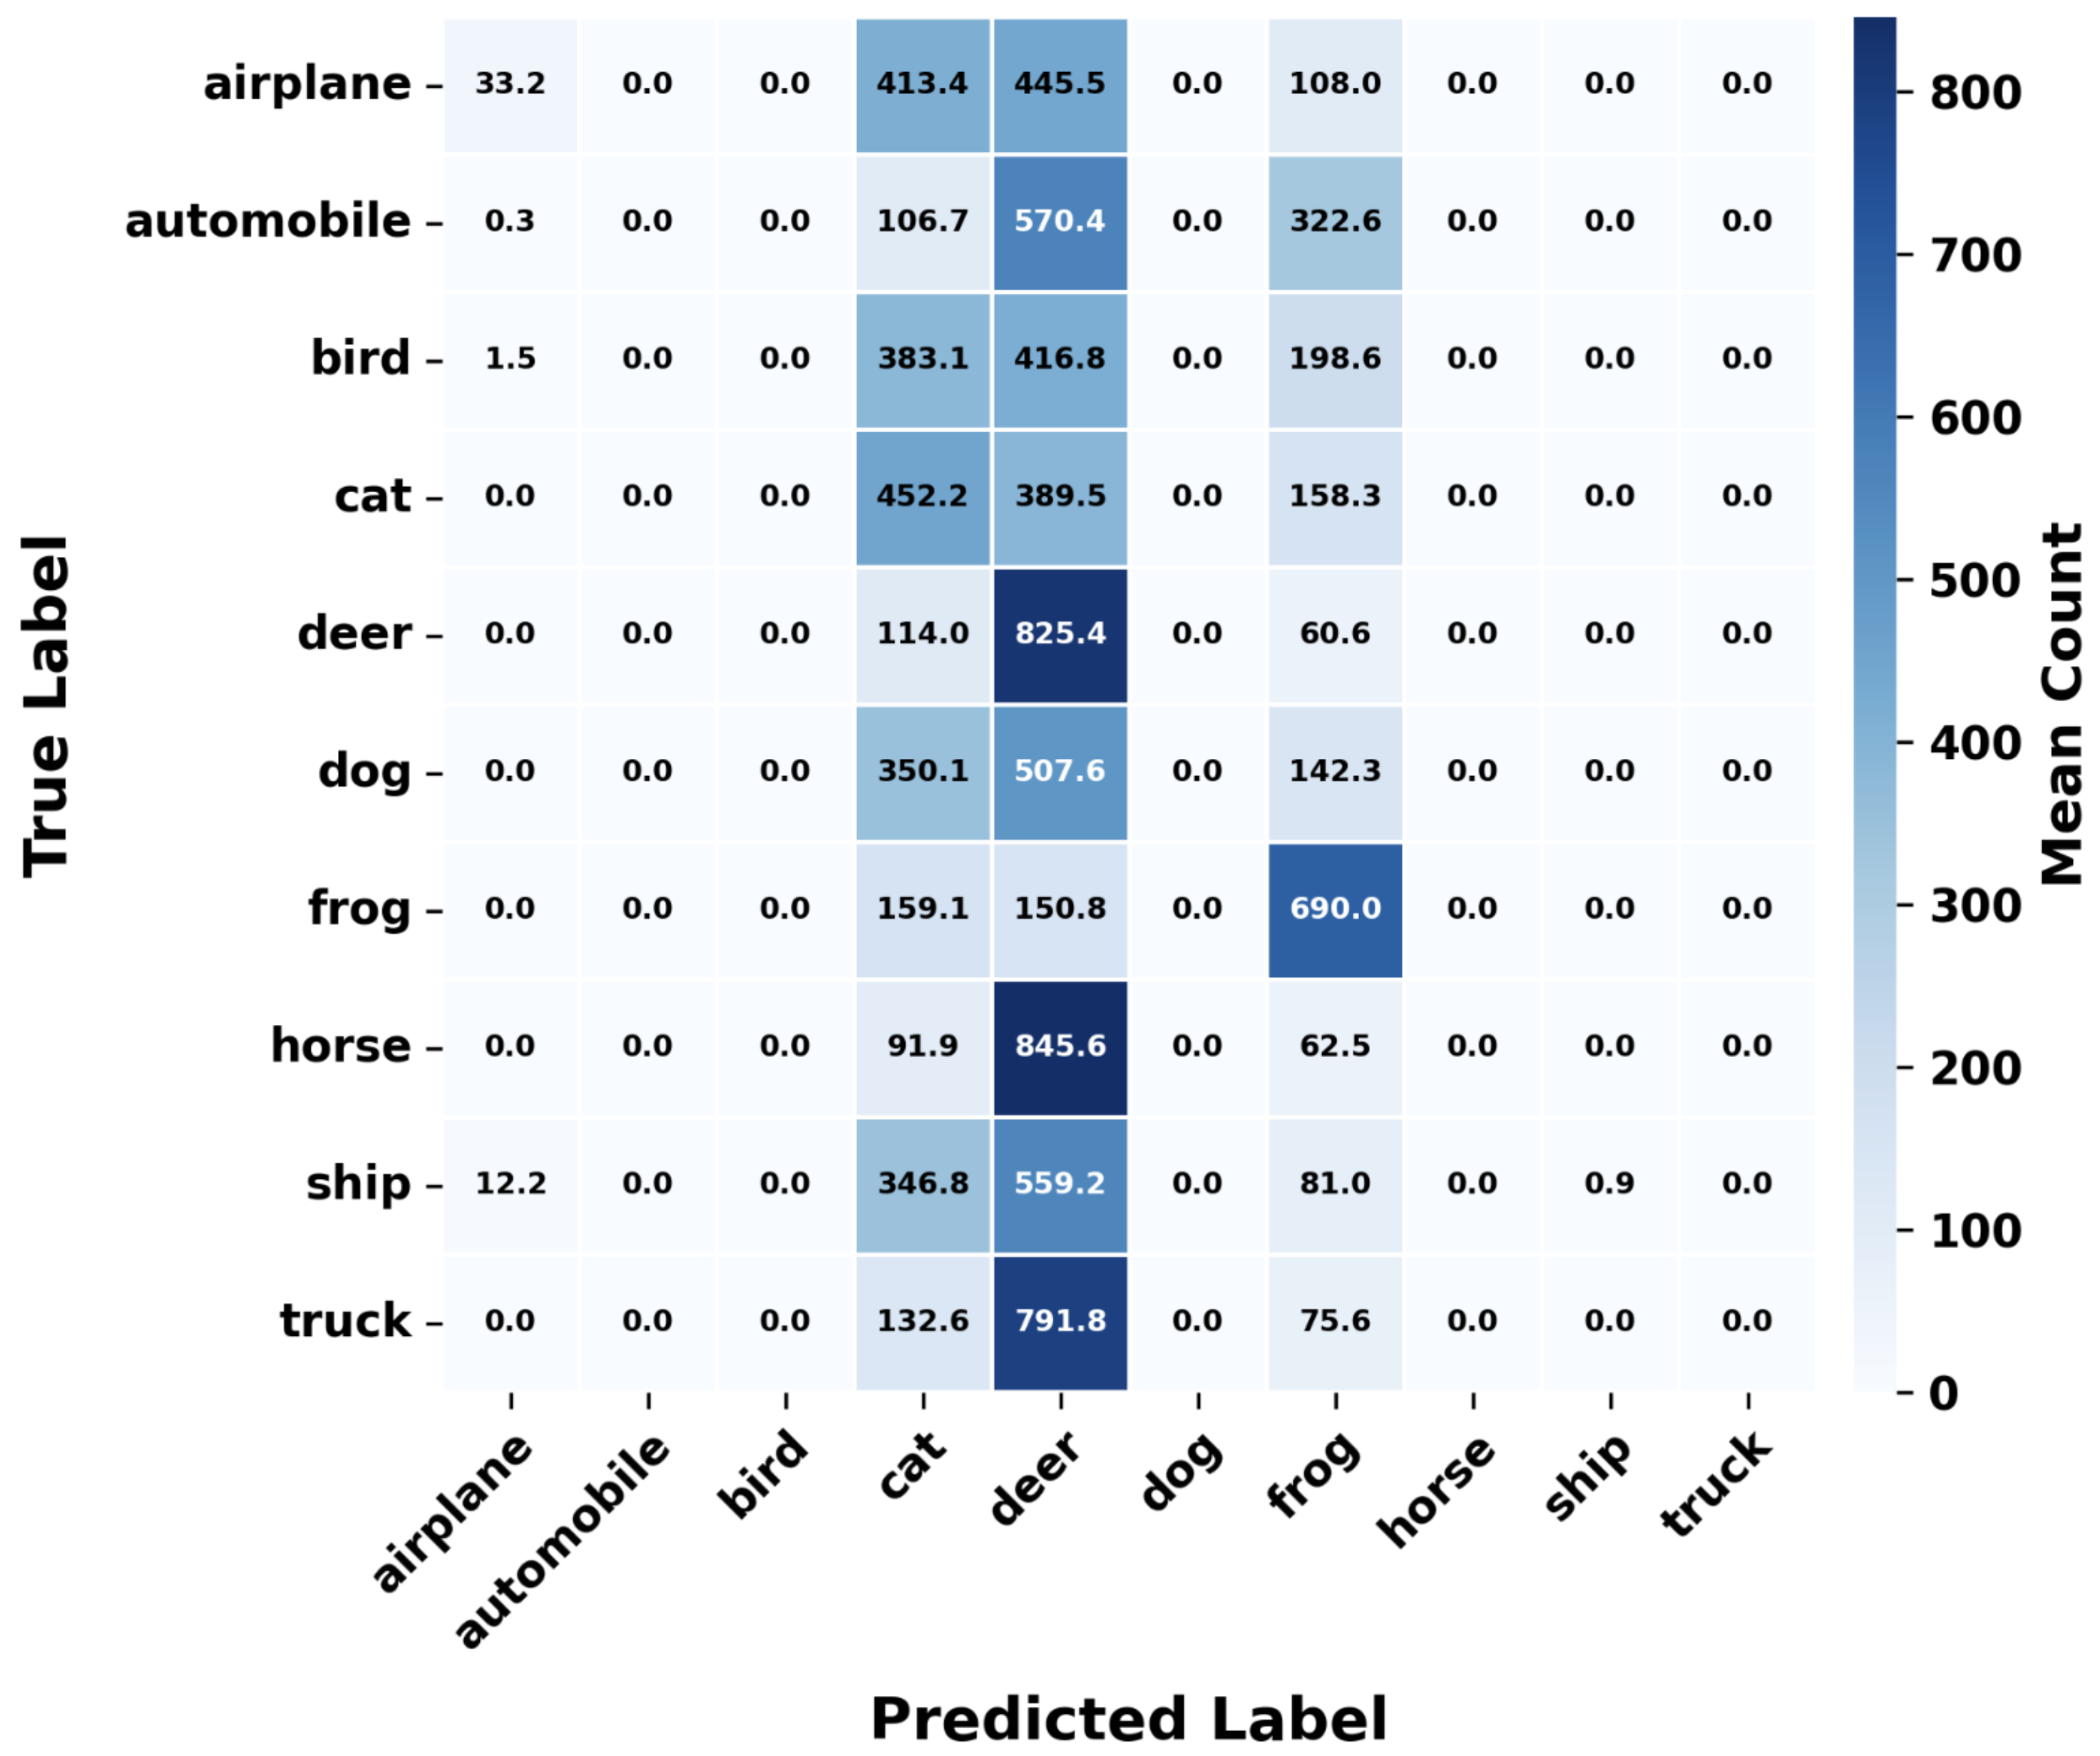
Mean k-fold confusion matrix after unconstrained attacks without defense (aggregated over 50 validation folds). Cell values: mean predicted counts per true class.
Figure 15.
Mean k-fold confusion matrix after unconstrained attacks without defense (aggregated over 50 validation folds). Cell values: mean predicted counts per true class.
Figure 16.
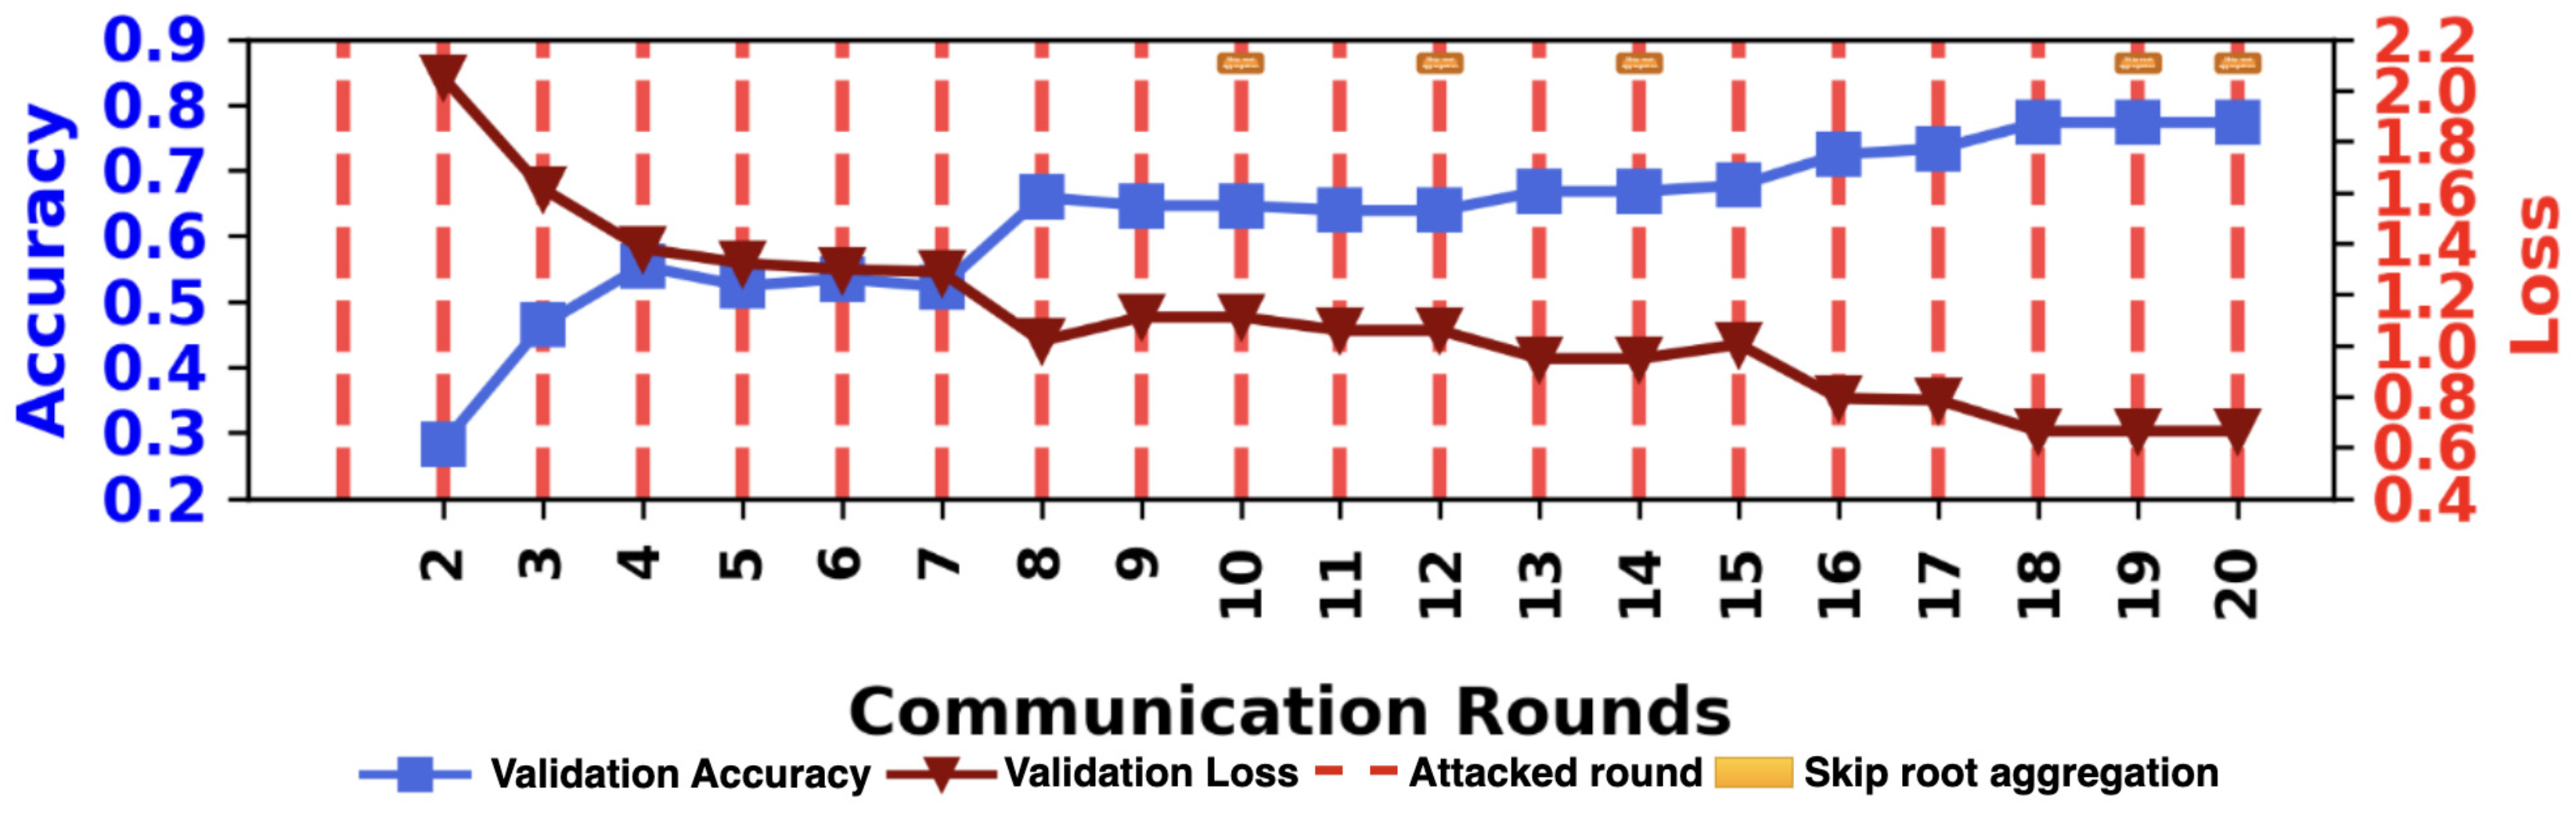
Global validation accuracy and loss under sustained attacks with trend-based quarantine enabled. Dual y-axes: accuracy (left, blue) and loss (right, red) at the root; dashed vertical lines mark attack rounds; orange squares: skip-root aggregation (rejected global backbone update).
Figure 16.
Global validation accuracy and loss under sustained attacks with trend-based quarantine enabled. Dual y-axes: accuracy (left, blue) and loss (right, red) at the root; dashed vertical lines mark attack rounds; orange squares: skip-root aggregation (rejected global backbone update).
Figure 17.
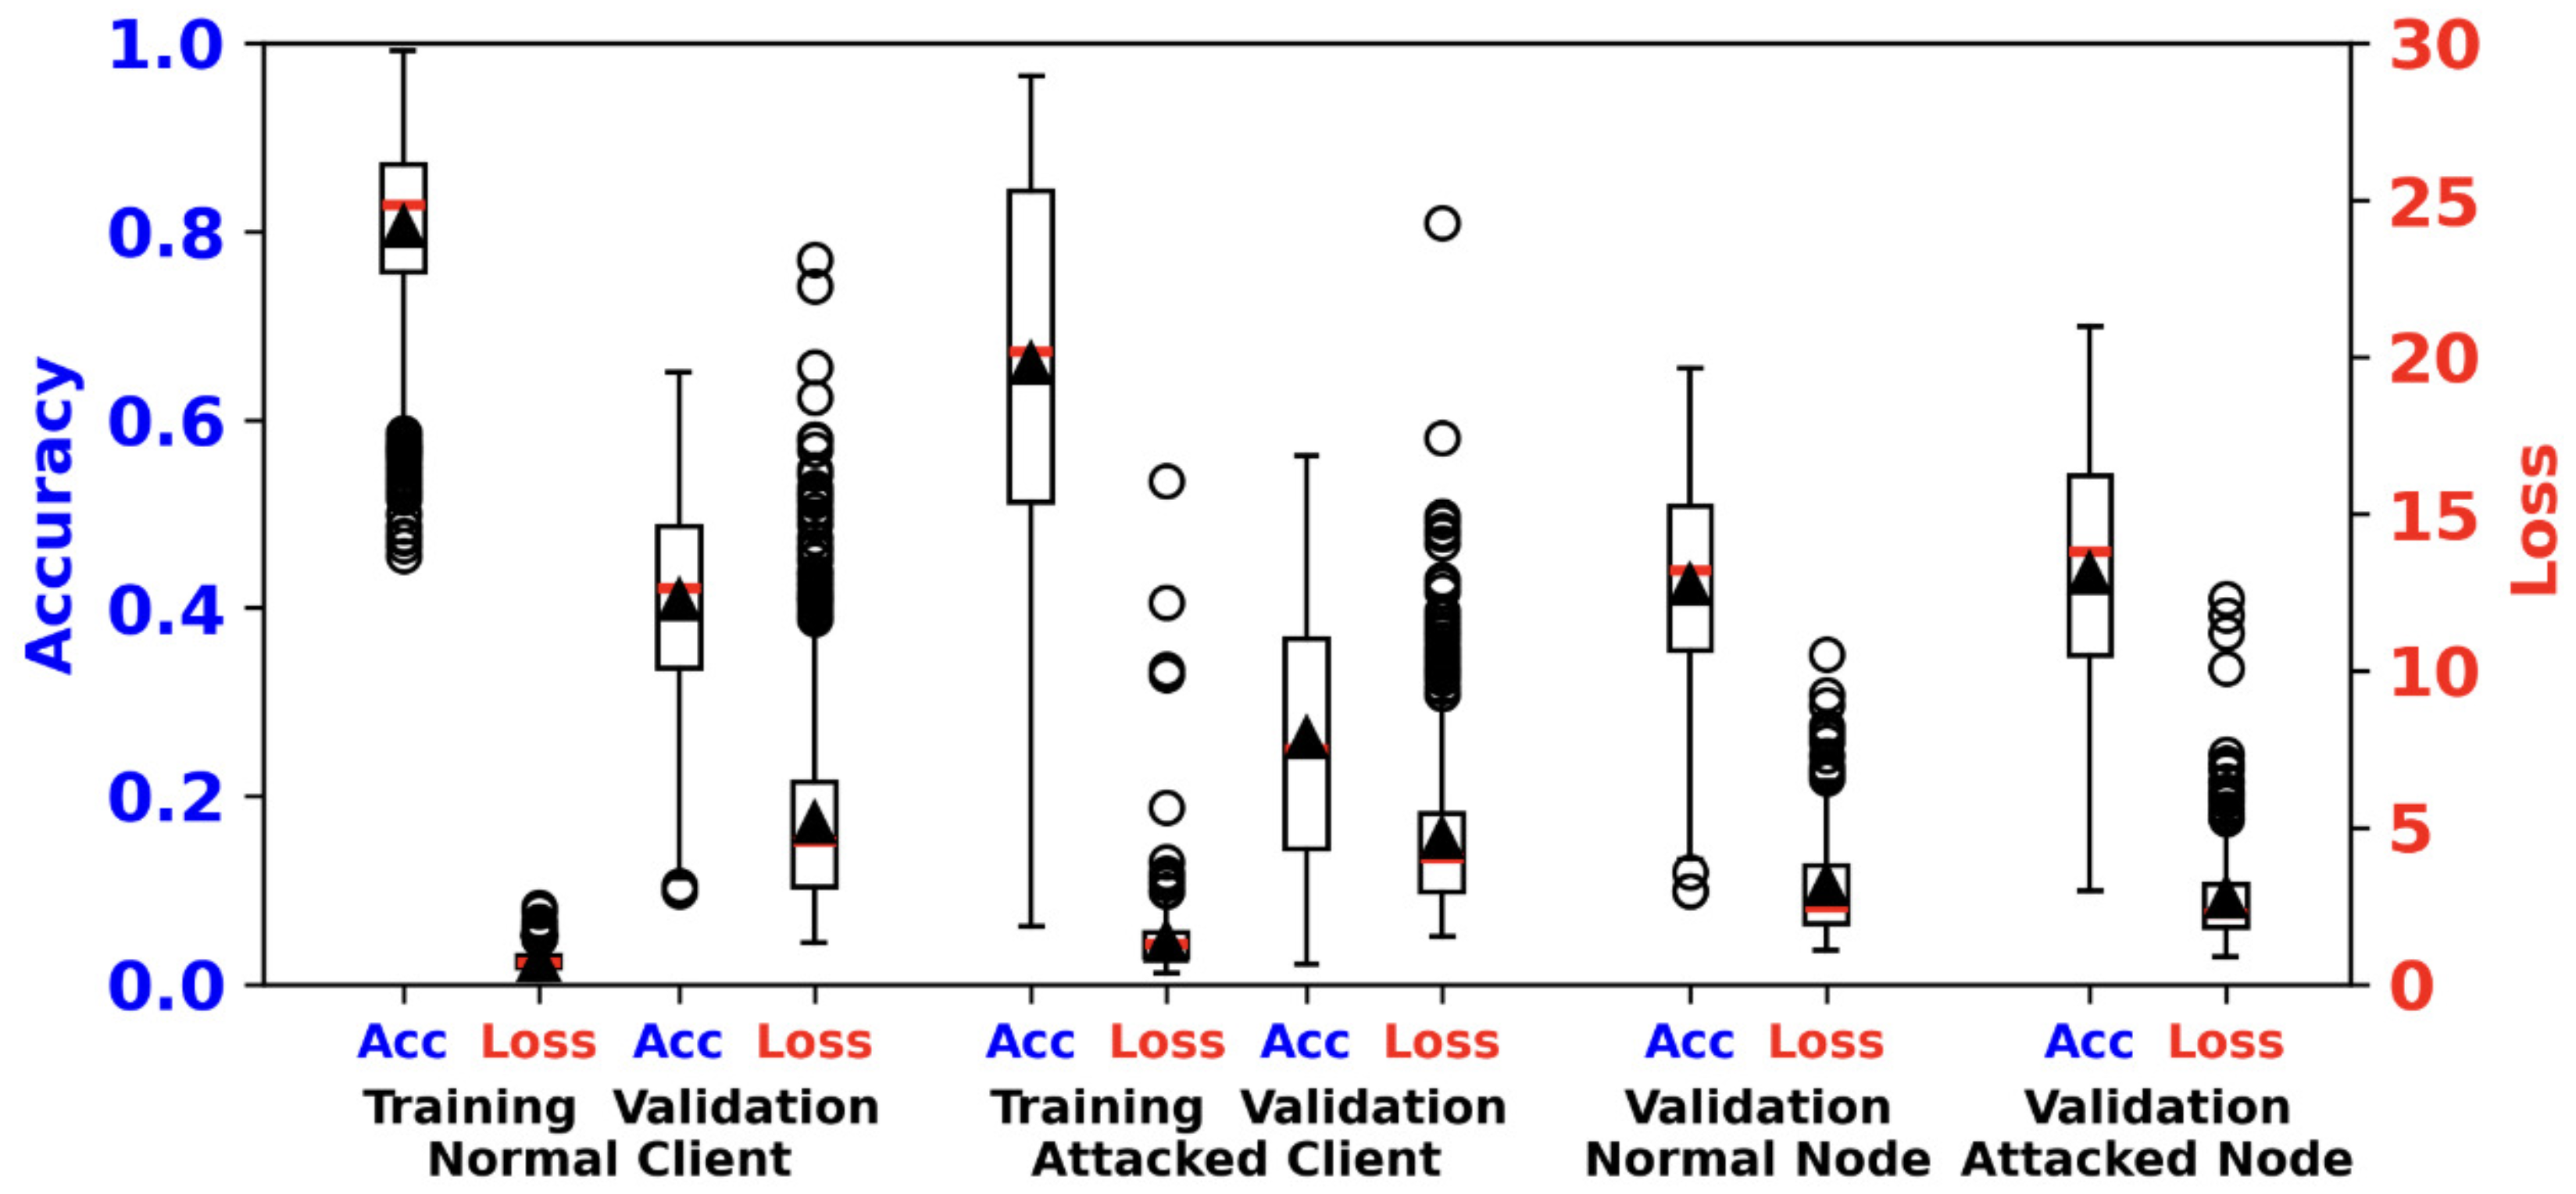
Distribution of training and validation metrics for normal vs. attacked clients and nodes under defended training (pooled over all rounds). Dual y-axes: accuracy (left, blue) and loss (right, red). Red line: median; black triangle: mean; circles: outliers.
Figure 17.
Distribution of training and validation metrics for normal vs. attacked clients and nodes under defended training (pooled over all rounds). Dual y-axes: accuracy (left, blue) and loss (right, red). Red line: median; black triangle: mean; circles: outliers.
Figure 18.
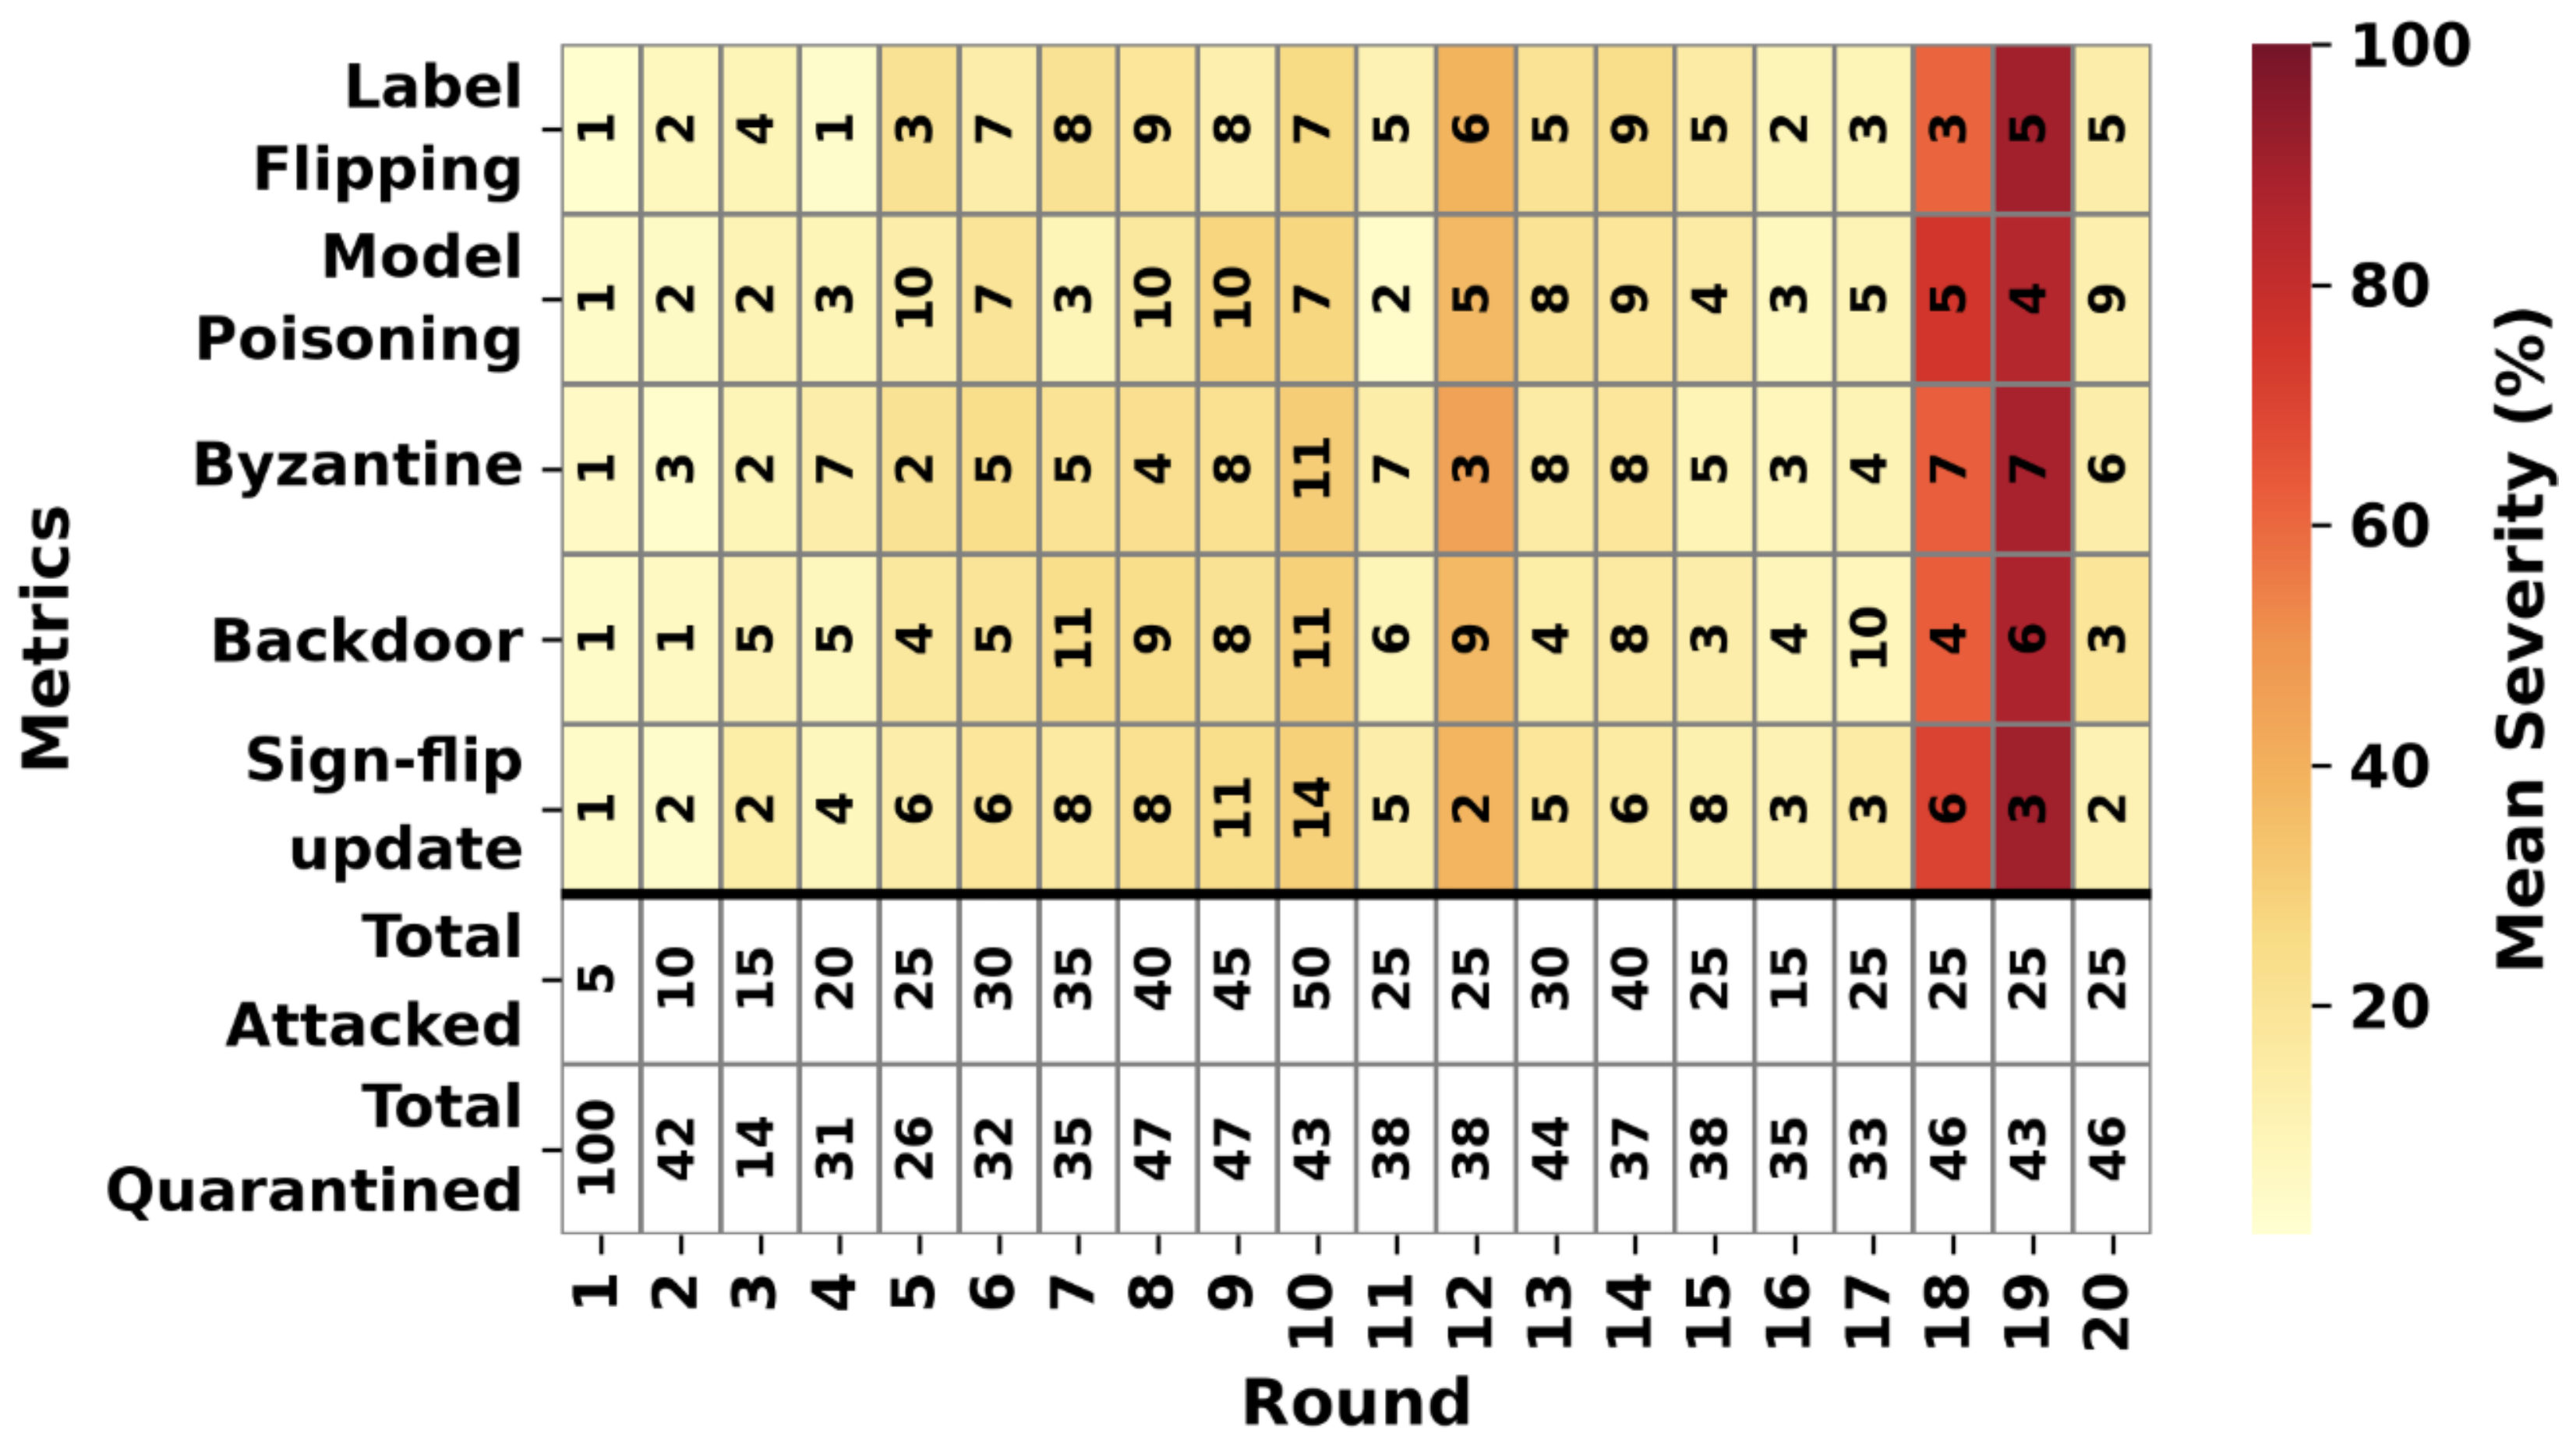
Attack and quarantine timeline for the defended scenario. Rows: five attack types, total attacked clients, and total quarantined clients per round. Columns: communication rounds 1–20; color scale: mean attack severity (%). Cell labels: targeted client counts per attack type.
Figure 18.
Attack and quarantine timeline for the defended scenario. Rows: five attack types, total attacked clients, and total quarantined clients per round. Columns: communication rounds 1–20; color scale: mean attack severity (%). Cell labels: targeted client counts per attack type.
Figure 19.
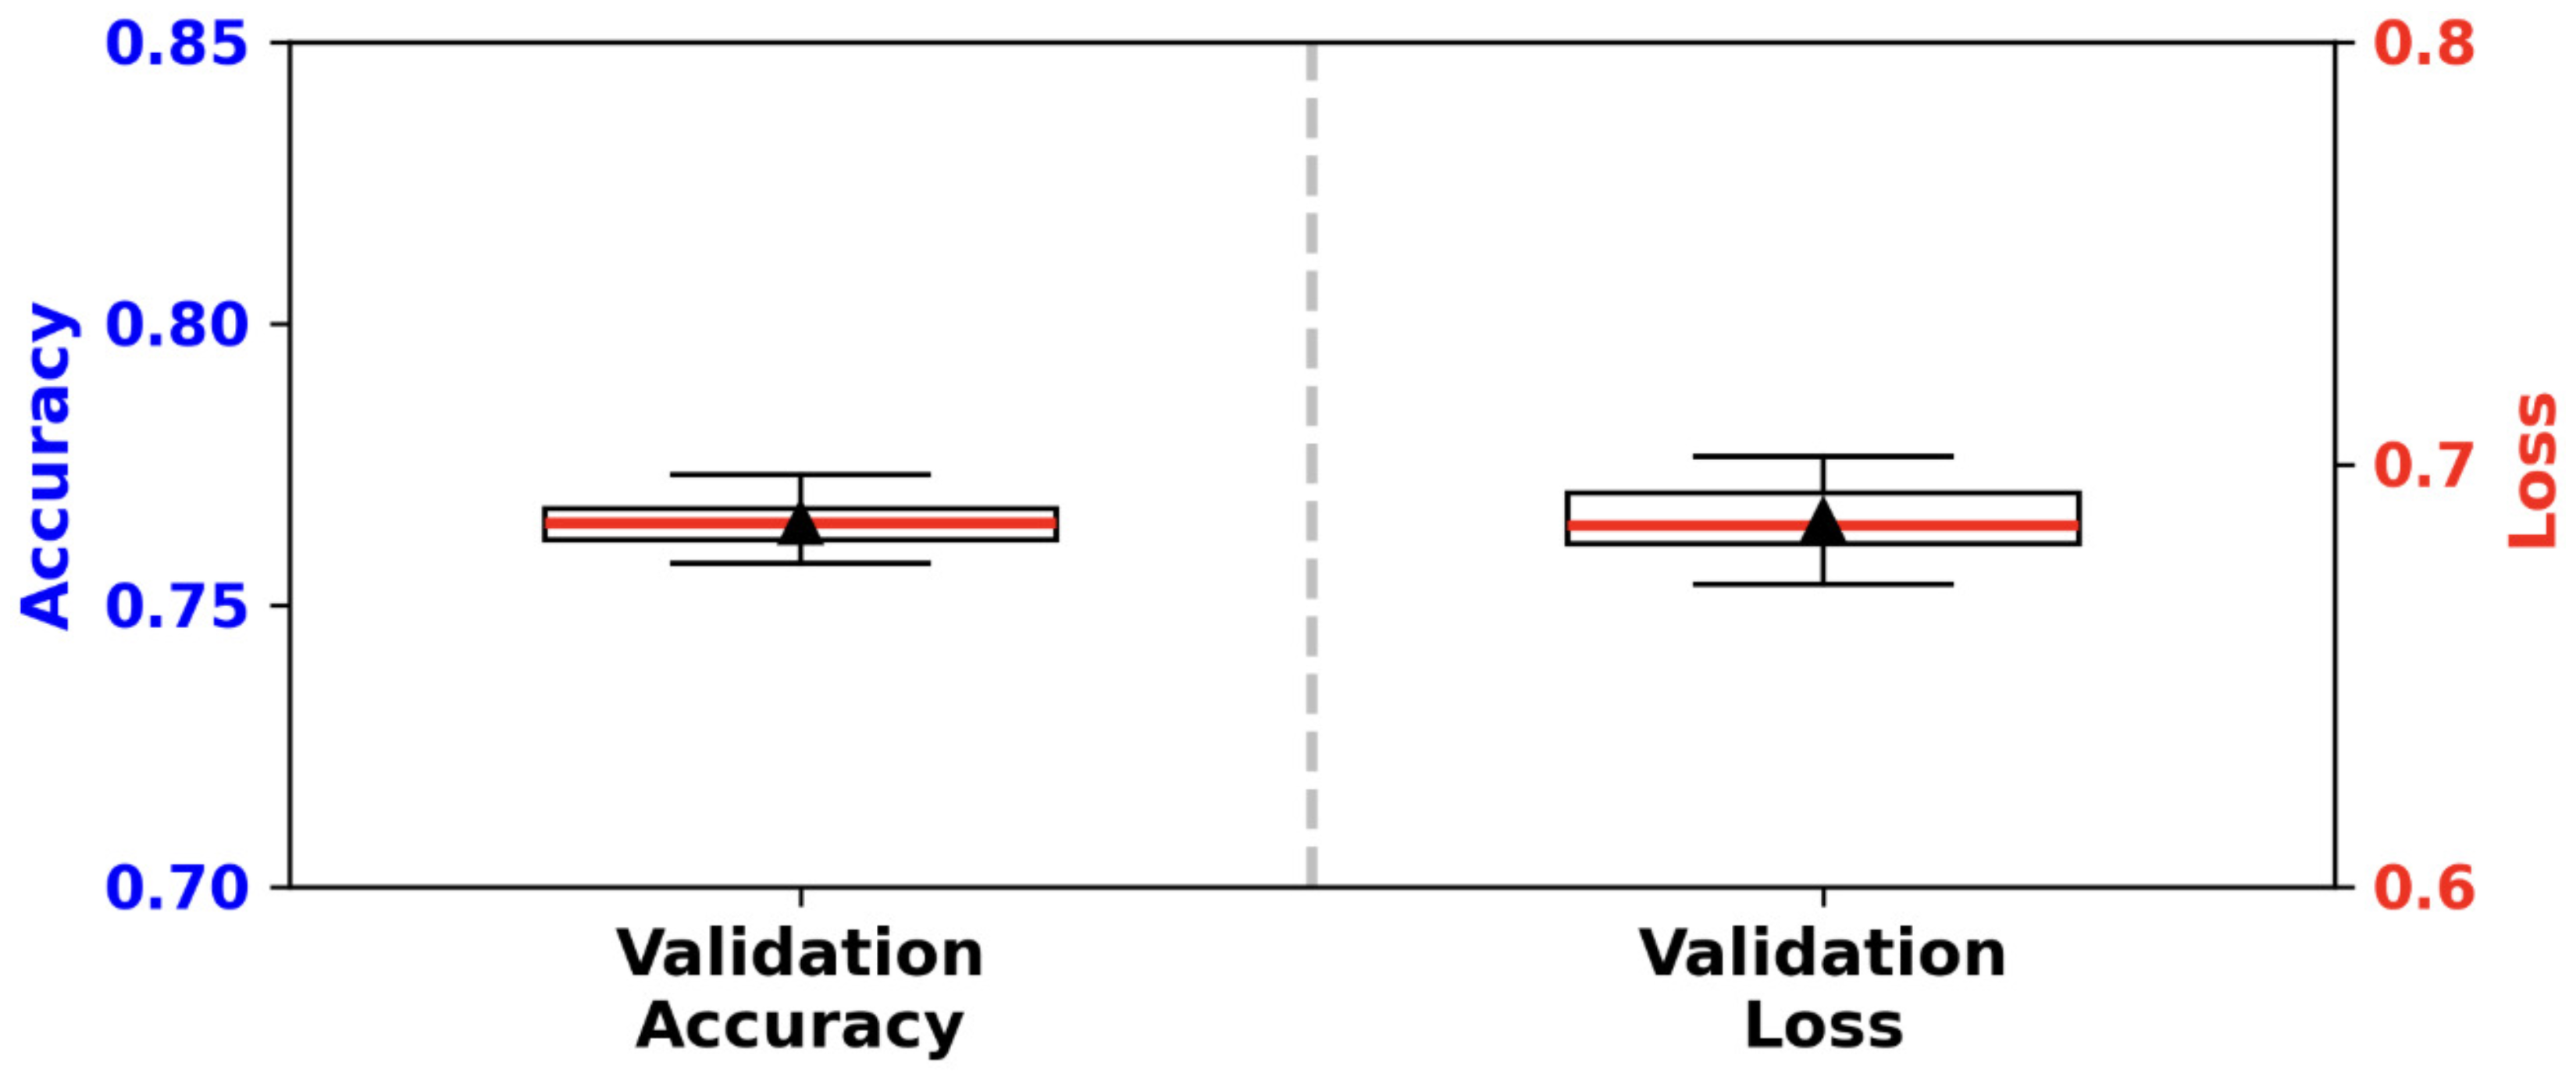
Repeated k-fold validation accuracy and loss for the frozen defended FedPer model (50 folds: 5-fold × 10 repeats). Red line: median; black triangle: mean.
Figure 19.
Repeated k-fold validation accuracy and loss for the frozen defended FedPer model (50 folds: 5-fold × 10 repeats). Red line: median; black triangle: mean.
Figure 20.
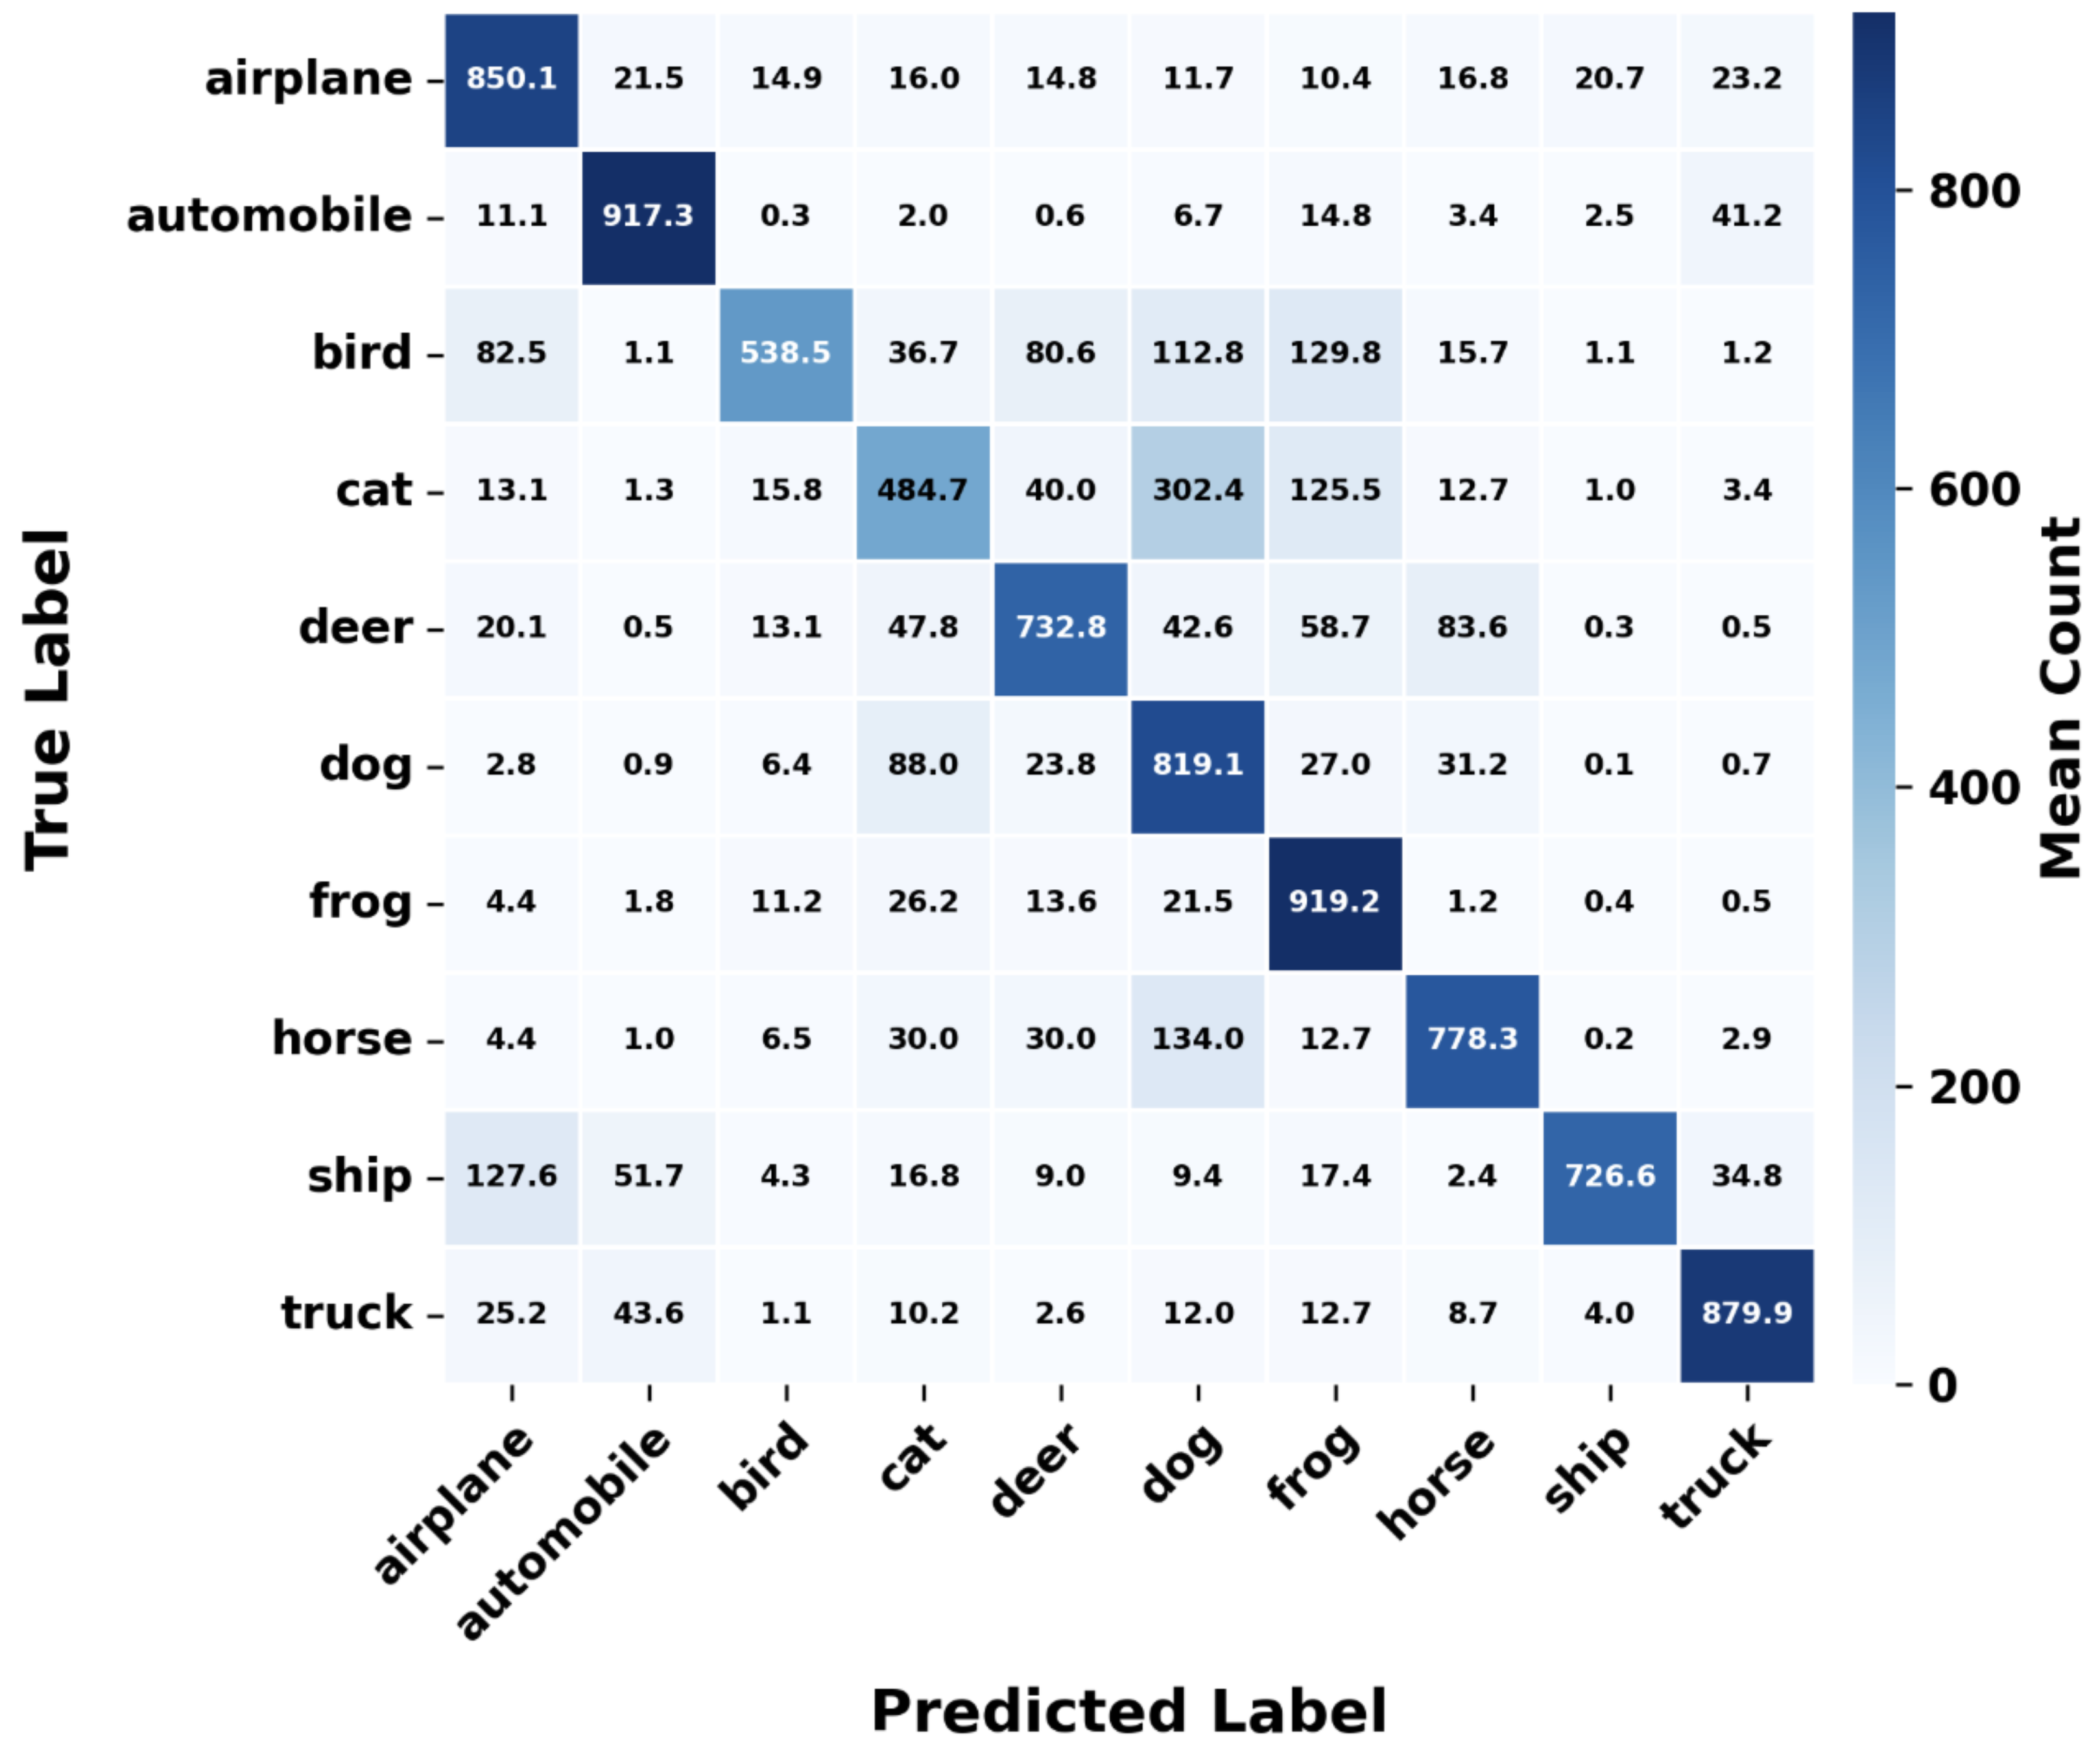
Mean k-fold confusion matrix after defended training (aggregated over 50 validation folds). Cell values: mean predicted counts per true class.
Figure 20.
Mean k-fold confusion matrix after defended training (aggregated over 50 validation folds). Cell values: mean predicted counts per true class.
Table 1.
Contextual landscape of CIFAR-10 poisoning defenses (reported accuracies; not a head-to-head comparison). Columns: Attack—threat type; Acc. with defense—reported accuracy under attack with the defense enabled; Hierarchy—whether the method uses hierarchical aggregation; Non-IID ()—client data split (IID, Dirichlet Non-IID with concentration , or not reported).
Table 1.
Contextual landscape of CIFAR-10 poisoning defenses (reported accuracies; not a head-to-head comparison). Columns: Attack—threat type; Acc. with defense—reported accuracy under attack with the defense enabled; Hierarchy—whether the method uses hierarchical aggregation; Non-IID ()—client data split (IID, Dirichlet Non-IID with concentration , or not reported).
| Method | Year | Attack | Acc. with Defense | Hierarchy | Non-IID () |
|---|
| Sundar et al. [31] | 2025 | Backdoor | 82.9% | No | Not reported |
| RECESS [32] | 2023 | Model poison | 60.4% | No | Not reported |
| SHIELD [8] | 2025 | Poisoning | 60.58% | Yes | IID & Non-IID () |
| BOD-hybrid [33] | 2025 | Backdoor | 78.2% | No | IID & Non-IID |
| FeRA [34] | 2025 | DBA backdoor | 86.1% | No | Not reported |
| FLAIR [35] | 2023 | Untargeted | 66.9% | No | Not reported |
| Bagdasaryan et al. [3] | 2020 | Model-repl. | ∼80% | No | Not reported |
| FLVaccin (ours) | 2026 | Mixed (5) | 76.5% † | Yes | Non-IID () |
Table 2.
FedPer round-protocol notation.
Table 2.
FedPer round-protocol notation.
| Group | Symbol | Meaning |
|---|
| Model split |
| | | Shared backbone (features); averaged bottom-up at every node |
| | | Private classifier head of client i (classifier); never sent to aggregation |
| | , | Backbone and head of client i when round t begins |
| Rounds |
| | t, T | Current round index and total communication rounds |
| | E | Local training epochs per active client in each round |
| Indices |
| | i | Federation client (hosted at some tree node) |
| | v | Aggregator node in |
| | j | Model indexed in aggregation pool |
| Aggregation |
| | | Non-quarantined models at node v (hosted clients and child-node models) |
| | | Number of models averaged in Equation (1) |
| | , | Shared backbone after aggregation at v; candidate global backbone at root (accepted or rejected) |
Table 3.
Quarantine notation: symbols, meaning, and role in the defense.
Table 3.
Quarantine notation: symbols, meaning, and role in the defense.
| Symbol | Meaning |
|---|
| , | Client i’s training accuracy and loss after round t (validation metrics computed on the full CIFAR-10 test set) |
| , | Round-over-round relative change in accuracy and loss (Equation (7)); positive means improvement |
| Maximum tolerated drop for client i in round t; quarantine triggers if any trend falls below |
| Largest benign relative accuracy swing from the 30-run vaccination calibration (Section 4.2); upper bound on legitimate metric movement |
| , | Allowed drops at the shallowest hosted level (, near the root) and at the deepest level () in round t |
| , , | Tree level of the node hosting client i; maximum level in the tree; normalized depth (0 at root, 1 at deepest) |
| Maps depth and round to client i’s allowance by linear interpolation between the root and deep endpoints (Equation (6)) |
Table 4.
Summary of experimental scenarios and key outcomes.
Table 4.
Summary of experimental scenarios and key outcomes.
| Scenario | Attacks | Defense | Test Acc | Repeated K-Fold Acc |
|---|
| Vaccination mean | 0 | Off | — | 30.8% (round-1 mean) |
| Normal baseline | 0 | Off | 79.9% | |
| Free attack | 130 | Off | 21.0% | |
| Attack + defense | 535 | Vaccination + quarantine | 77.3% | |
Table 5.
Repeated k-fold validation statistics for the clean baseline (5-fold × 10 repeats, 50 folds; frozen global shared backbone with per-client heads).
Table 5.
Repeated k-fold validation statistics for the clean baseline (5-fold × 10 repeats, 50 folds; frozen global shared backbone with per-client heads).
| Metric | Mean ± Std | 95% CI | p-Value |
|---|
| Validation accuracy | | [79.87, 80.11] | |
| Validation loss | | [0.588, 0.595] | |
Table 6.
Repeated k-fold validation statistics after free-attack training (5-fold × 10 repeats, 50 folds; frozen global shared backbone with per-client heads).
Table 6.
Repeated k-fold validation statistics after free-attack training (5-fold × 10 repeats, 50 folds; frozen global shared backbone with per-client heads).
| Metric | Mean ± Std | 95% CI | p-Value |
|---|
| Validation accuracy | | [19.90, 20.14] | |
| Validation loss | | [2.319, 2.322] | |
Table 7.
Repeated k-fold validation statistics after defended training (5-fold × 10 repeats, 50 folds; frozen global shared backbone with per-client heads).
Table 7.
Repeated k-fold validation statistics after defended training (5-fold × 10 repeats, 50 folds; frozen global shared backbone with per-client heads).
| Metric | Mean ± Std | 95% CI | p-Value |
|---|
| Validation accuracy | | [76.35, 76.58] | |
| Validation loss | | [0.685, 0.689] | |