1. Introduction
Through the use of cloud computing, organizations can now rely on the internet to access computing resources as needed. This reduces the need to invest heavily in physical servers or software infrastructure. As a result, cloud computing has transformed how organizations build datacenter infrastructure, especially for large-scale e-commerce platforms. These platforms now achieve greater scalability and reliability for their databases. The cloud reduces operational costs for organizations compared to traditional methods of hosting by eliminating the need for organizations to invest in capital buildings and allowing them to more flexibly and dynamically allocate resources and utilize them according to their workload requirements by adopting a pay-as-you-go usage model. The result of these changes has enabled e-commerce platforms to dramatically reduce the level of complexity and effort in deploying, managing, and operating an e-commerce platform, while simultaneously increasing the ability of e-commerce platforms to scale and operate efficiently [
1].
The growth of e-commerce will continue and result in an increased volume of data produced from online sales, customer engagement, and product management. The efficient storage and processing of this significant amount of data will be a challenge. Cloud computing is a very good option for storing and processing all of your customer data using a network of storage facilities while giving you access to that data from anywhere using the internet. The use of multiple storage facilities around the globe provides you with greater reliability of storage and ensures that all of your data will continue to be available [
2,
3]. The global cloud computing industry is predominantly dominated by a few major cloud providers, with the most important being Amazon Web Services (AWS), Google Cloud Platform (GCP), and Microsoft Azure. The three major cloud providers deliver the capability to access highly scalable infrastructure services to support the growth of enterprise applications. In comparison to other public cloud providers, AWS offers a greater selection and higher quality of public cloud services. In addition, GCP offers leading-edge technologies for both data analytics and machine learning applications. Azure’s success stems from its innovative approach to implementing hybrid cloud capabilities, which enable organizations to transition from legacy on-premise infrastructure to cloud-based infrastructure [
3,
4].
Cloud computing platforms provide some of the most essential database solutions in the market today. Database as a Service (DBaaS) allows businesses to create and manage their database without complex hardware and manual installation problems, thanks to the cloud. Cloud-based databases like those on AWS and Microsoft Azure have been built on top of scalable and highly available databases for large amounts of data and a large number of users accessing the system simultaneously. DBaaS solutions are critical for applications with frequent database workload changes caused by fluctuations in demand from customers, such as e-commerce applications [
5,
6]. Even though NoSQL has been growing rapidly due to its ability to handle large amounts of unstructured or semi-structured data, there is still a strong need for relational (SQL) databases because they maintain strict data consistency and transactional integrity when processing transactions from enterprise resource planning (ERP) systems. Microsoft SQL Server is one example of a relational database that is required in enterprise environments where ACID compliance and structured data models must be considered. This is why relational databases are often used in transaction-heavy systems like an e-commerce site, because it is very important to keep accurate records of every financial transaction happening with your business [
7,
8]. Additionally, the latest version of the .NET platform (.NET 8) offers considerable performance enhancements and architectural advancements to assist developers in building more scalable and productive applications. As such, .NET 8 features a number of significant upgrades intended to enable the development of high-performing websites across networked cloud platforms—making it a prime choice for building highly scalable web applications [
9]. One of the key features within the ASP.NET Core technology stack is its Web API Framework, which makes it easier to develop RESTful services capable of supporting large numbers of concurrent user requests (multiple requests to an API sent at the same time) and providing fast response times to all requests [
10]. E-commerce applications rely on real-time information and their ability to maintain a constant connection to the back-end database(s) for any type of order processing [
1]. In addition to backend application performance, modern web technologies emphasize building interactive and responsive user interfaces. Using Blazor WebAssembly allows .NET developers to build rich client-side applications utilizing C# instead of JavaScript [
11]. Through this method, developers can create responsive Progressive Web Applications (PWAs) that provide an enhanced shopping experience for users online [
12].
There has been an insufficient number of systematic, quantitative evaluations of cloud-based databases versus traditional (i.e., on-premise) databases, comparing performance levels of cloud databases to an on-premise database when subjected to realistic application workloads, despite the many research studies that show cloud computing/cloud databases offer users advantages. The majority of the research studies performed to date used benchmark data created synthetically (as is common in evaluating other types of services), and most studies used only simple experimental comparisons that do not simulate enterprise applications as they would exist in the “real” world, therefore having a significant impact on performance. Therefore, to assess cloud databases’ performance while they operate under “realistic” transactional workloads, significant empirical research must be conducted regarding cloud database performance versus on-premise database performance [
8,
13].
While numerous investigations have been conducted on performance tests for cloud and on-premise databases [
14,
15]. There remain many limitations in the literature, including those we address in this study. Most previous studies, such as those by Noor et al. [
14] and Gyorodi et al. [
15], have used either synthetic benchmark datasets or single queries that do not adequately account for the full transactional complexity of real-world enterprise applications, which means that their findings may not accurately represent performance differences when running mixed workloads (i.e., SELECT, INSERT, UPDATE, and DELETE concurrently). Unlike these prior efforts, the present study isolates the deployment environment as the sole independent variable by holding the application codebase, database schema, and dataset volume constant across both platforms—a control that, to our knowledge, has not been jointly enforced in prior e-commerce database benchmarking work. Many earlier comparison studies also compared cloud and on-premise environments based on different application code bases and/or database schemas and/or hardware tiers, creating uncontrolled variables and thereby limiting the credibility of their findings.
This combination of architectural and data-level controls remains absent from prior e-commerce database studies. In addition, many of the other studies have only looked at one performance metric, namely, response time or throughput, and have not combined multiple performance metrics together into a holistic framework to evaluate performance. This issue is articulated by Husain et al. [
16]. The following study will create an original methodology that will be used to evaluate the performance of the .NET Core 8 e-commerce application (along with the accompanying database schema, 5000 product records and 10,000 transaction record datasets) in both environments. The traditional evaluation method (in this case, an identical sample of a SQL Server database) can lead to bias based on architecture and creates issues when attempting to measure performance in a valid scientific manner. We will be creating a controlled environment to eliminate this bias and provide a true and fair measure of the deployment environment’s impact on the performance of the .NET Core 8 application.
The study will also evaluate each of the four CRUD operations (SELECT, INSERT, UPDATE, DELETE) as concurrent users, up to 50 at a time, use the application, noting the query response times, throughput (amount of data processed by the system in a specific amount of time), and CPU usage. Performance will be evaluated on three different types of metrics to ensure we have provided a fair and accurate measure under typical workloads for both the Microsoft SQL Server (on-premise) and Azure SQL Database (cloud) deployment environments, and not under simulated benchmarks.
The four key technical contributions of this study are a controlled experimental design where application code, database schema, and a fixed set of transactional data (5000 product records and 10,000 transaction records) were all held constant between SQL Server (on-premises) and Azure SQL Database (cloud) with the deployment environment being the only independent variable; the use of a statistically rigorous verification protocol (30 replicated trials for each operation; ANOVA and independent t-test at p < 0.001) to validate the performance difference observed between the two environments; performing the .NET 8, ASP.NET Core Web API, Blazor WebAssembly and EF Core deployment stack under realistic e-commerce workloads; and developing a reproducible evaluation framework that supports evidence-based decisions for cloud migration.
The remainder of this paper is organized as follows:
Section 2 reviews related work;
Section 3 situates the proposed results within state-of-the-art benchmarks;
Section 4 describes the experimental architecture and methodology;
Section 5 presents on-premise performance measurements;
Section 6 presents the comparative statistical analysis, scalability stress testing, and cost–performance analysis;
Section 7 discusses limitations;
Section 8 concludes; and
Section 9 outlines future work.
2. Related Work
Prior benchmarking studies have compared on-premise and cloud-hosted relational databases, focusing solely on response time as a performance metric. Noor et al. [
14] compared on-premise SQL servers to Azure SQL servers at various operation types and user loads, finding that although on-premise systems will sometimes outperform lower-priced tiers of Azure, higher-priced tiers (S4 and S9) display comparable or even above-average performance as user concurrency increases while providing far greater reliability and scalability. Similar case studies were conducted by Gyorodi et al. [
15], who compared SQL Server on-premise to SQL Server on Azure by comparing the system response times across various tiers, revealing that on-premise systems had lower response times than free or P1 tiers of Azure, although response times of higher-tiered Azure systems approached those of an on-premise system. Zbořil and Svatá [
17] expanded the comparison beyond two providers by benchmarking Amazon RDS (PostgreSQL), Google Cloud SQL, and Azure Database for PostgreSQL using a SELECT-intensive workload, with throughput for each provider of 17,595 TPS, 14,148 TPS, and 8982 TPS, respectively. Future benchmarking efforts are expected to go beyond response time by incorporating fault tolerance and resilience as additional performance dimensions.
Numerous studies have compared relational databases and non-relational databases for workloads associated with e-commerce and IoT. A large e-commerce dataset deployed in both SQL Server and MongoDB in the cloud demonstrates that database selection influences performance (Aboutorabi et al., 2015) [
8]. Eyada and Genidy (2020) [
18] compared MongoDB and MySQL under an IoT sensor-data insertion workload (12 sensors), measuring response times of 1234 ms for MongoDB and 72,132 ms for MySQL, a result specific to high-frequency insert operations rather than large-scale SELECT queries. This illustrates that database architecture can have a significant impact on workloads with high write volumes. Andrea et al. (2025) [
19] measured response time through five million text records in SQL Server, MySQL, Oracle, and PostgreSQL and found SQL Server provided the lowest response time at 12,548 ms, with PostgreSQL producing the highest at 78,390 ms. All of these studies illustrate that relational databases remain applicable today to transaction-based e-commerce applications requiring ACID compliance and structured data models.
Many mechanisms have been developed to improve efficiency in cloud databases through Azure SQL optimization research. Das et al. [
13] developed an indexing system that automatically indexes millions of databases hosted on Azure SQL and demonstrates measurable improvements in query execution efficiency. Dundjerski and Tomasevic [
20] developed an automated troubleshooting framework for Azure SQL Databases that leverages advanced monitoring diagnostic tools to enhance performance and reliability. Viswanathan et al. [
21] developed predictive resource provisioning systems in Azure SQL that forecast future resource consumption. Vardhan et al. [
22] compared query optimization techniques between Oracle Cloud and Amazon RDS in high-concurrency scenarios (800 sessions), achieving throughput of 27,500 TPS/24,000 TPS, respectively, through cache optimizations and concurrent session management. Recent advances to traditional optimization include the application of machine learning and deep learning techniques in database management, while AI-defined/automated self-managing/self-optimizing database systems are suggested as a means of managing data autonomously [
23]. Learning-based query execution mechanisms, automatic configuration tuning systems, and broader surveys on integrating machine learning into contemporary database architectures illustrate significant enhancements in efficiency/adaptability [
24,
25,
26,
27].
Husain et al. [
16] conducted research on e-commerce performance measures, showing that a single metric is insufficient to capture performance in isolation, and assessed how multiple performance metrics can be used to improve database performance in a cloud environment. They state that using a single metric, such as response time, does not capture all aspects of a cloud database’s performance and therefore must also include evaluation of other key metrics, such as latency, throughput, and scalability. They also provide insight into how the design of a .NET marketplace application affects its response time when used in parallel with other applications, using data from Karwaczyński et al. [
9], and therefore create a context for examining the interaction between application-layer decisions and the performance of the database layer. Although these two studies were conducted to assist with benchmarking database performance, the vast majority of studies either used synthetic benchmarks or focused on a single transaction type and did not simulate the mix of transactional workloads that e-commerce production traffic has experienced.
Economic and scalability considerations have also been examined in the literature. Sui et al. [
3] proposed a cloud computing architecture for scalable database resource pools, emphasizing dynamic resource allocation for applications with fluctuating demand. Noor et al. [
14] noted that with appropriate pricing-tier selection, cloud deployments can achieve a lower total cost of ownership than on-premise alternatives. Pierleoni et al. [
4] compared AWS, Google Cloud, and Microsoft Azure for IoT applications, finding that Azure’s hybrid cloud capabilities provide a distinct advantage for organizations transitioning from legacy on-premise infrastructure. However, comprehensive cost–performance analyses that combine empirical throughput measurements with operational cost data across multiple concurrency levels remain scarce in the literature.
The current study builds on existing literature by making four distinct contributions.
Table 1 highlights the four ways in which these contributions address the shortcomings of various pieces of research that are most closely aligned with this research.
For the first time, an e-commerce database benchmarking exploration has identified an application codebase, beneath it a database schema, and the same dataset volume (only the way phpMyAdmin is handled: as a local embedded or via the cloud). This makes it impossible to determine which specific elements are causing potential issues/errors in any performance/error-based differences between these data stores. For example, Noor et al. [
14] and Gyorodi et al. [
15] compared cloud and on-premise (latency) systems where multiple hardware levels or app configurations were the underlying variables, thereby not controlling for any of these variables.
Current research has examined either response time or throughput, either separately or not at all. For instance, Zbořil and Svatá [
17] only observed throughput under SELECT-based syntactic workloads. Noor et al. [
14] and Gyorodi et al. [
15] do the same, with only response time observed. Neither combine/query response time nor throughput.
The previous statistical validation process was inadequate because very few studies reported confidence intervals or effect sizes to demonstrate that the difference is statistically significant and not attributable to measurement error. This has been noted as a limitation by Husain et al. [
16]. The current study demonstrates validation through 30 replicated trials for each operation, employing repeated-measures ANOVA with the Greenhouse–Geisser correction across all trials and Bonferroni post hoc comparisons to analyze the data. Each outcome will also provide Cohen’s d effect sizes at
p < 0.001.
This study demonstrates practical validation of the entire .NET 8 ASP.NET Core Web API/Blazor WebAssembly and EF Core stack under actual e-commerce workloads and therefore provides a reproducible process for any business to use as part of the overall process for determining whether to migrate to cloud services.
3. State-of-the-Art Database Performance Comparison
Table 2 presents a qualitative summary of representative performance results reported in previous studies alongside the results of the proposed system.
Section 2 investigated prior research regarding methodology (scope, limitations), whereas this section supports the former description by providing a quantitative and comparative summary of results from previously published studies within the context or parameters established in order to assess the overall quality of the performance outcome’s position relative to published empirical benchmarks.
The outcomes of previous research and the proposed system are presented in
Table 2, including a description of performance findings from the existing literature and the results of the proposed system. The systems examined support various workloads, including IoT (Internet of Things) data ingestion, large-scale SELECT queries, and high-concurrency transactional processing. The systems were assessed across different dataset sizes and levels of concurrent users. Thus, the quantitative numbers across the published studies represented in this table cannot be used for direct comparison; instead, this table serves as qualitative contextual evidence to place the proposed studies within the larger body of research literature and will not be used as the basis of performance rankings across numerous studies.
The following baseline systems have received considerable attention from researchers exploring state-of-the-art solutions for cloud and distributed database environments: MongoDB, MySQL, Microsoft SQL Server, Oracle Cloud Database, and Amazon RDS (PostgreSQL) [
17,
18,
19,
20]. These systems also provide varying levels of strength across different workload characteristics; for example, MongoDB performs well in insert-dominated workloads, while Microsoft SQL Server performs well with large-volume SELECT queries. In addition, both Oracle Cloud and Amazon RDS have demonstrated comparable throughput for transactional workloads with high concurrency.
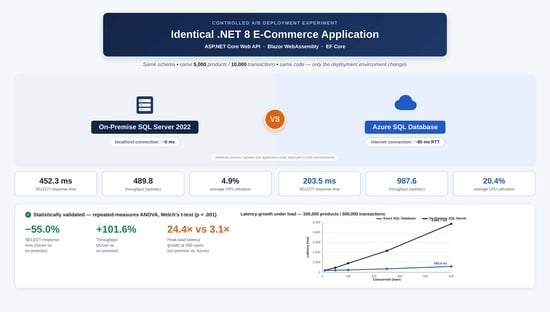
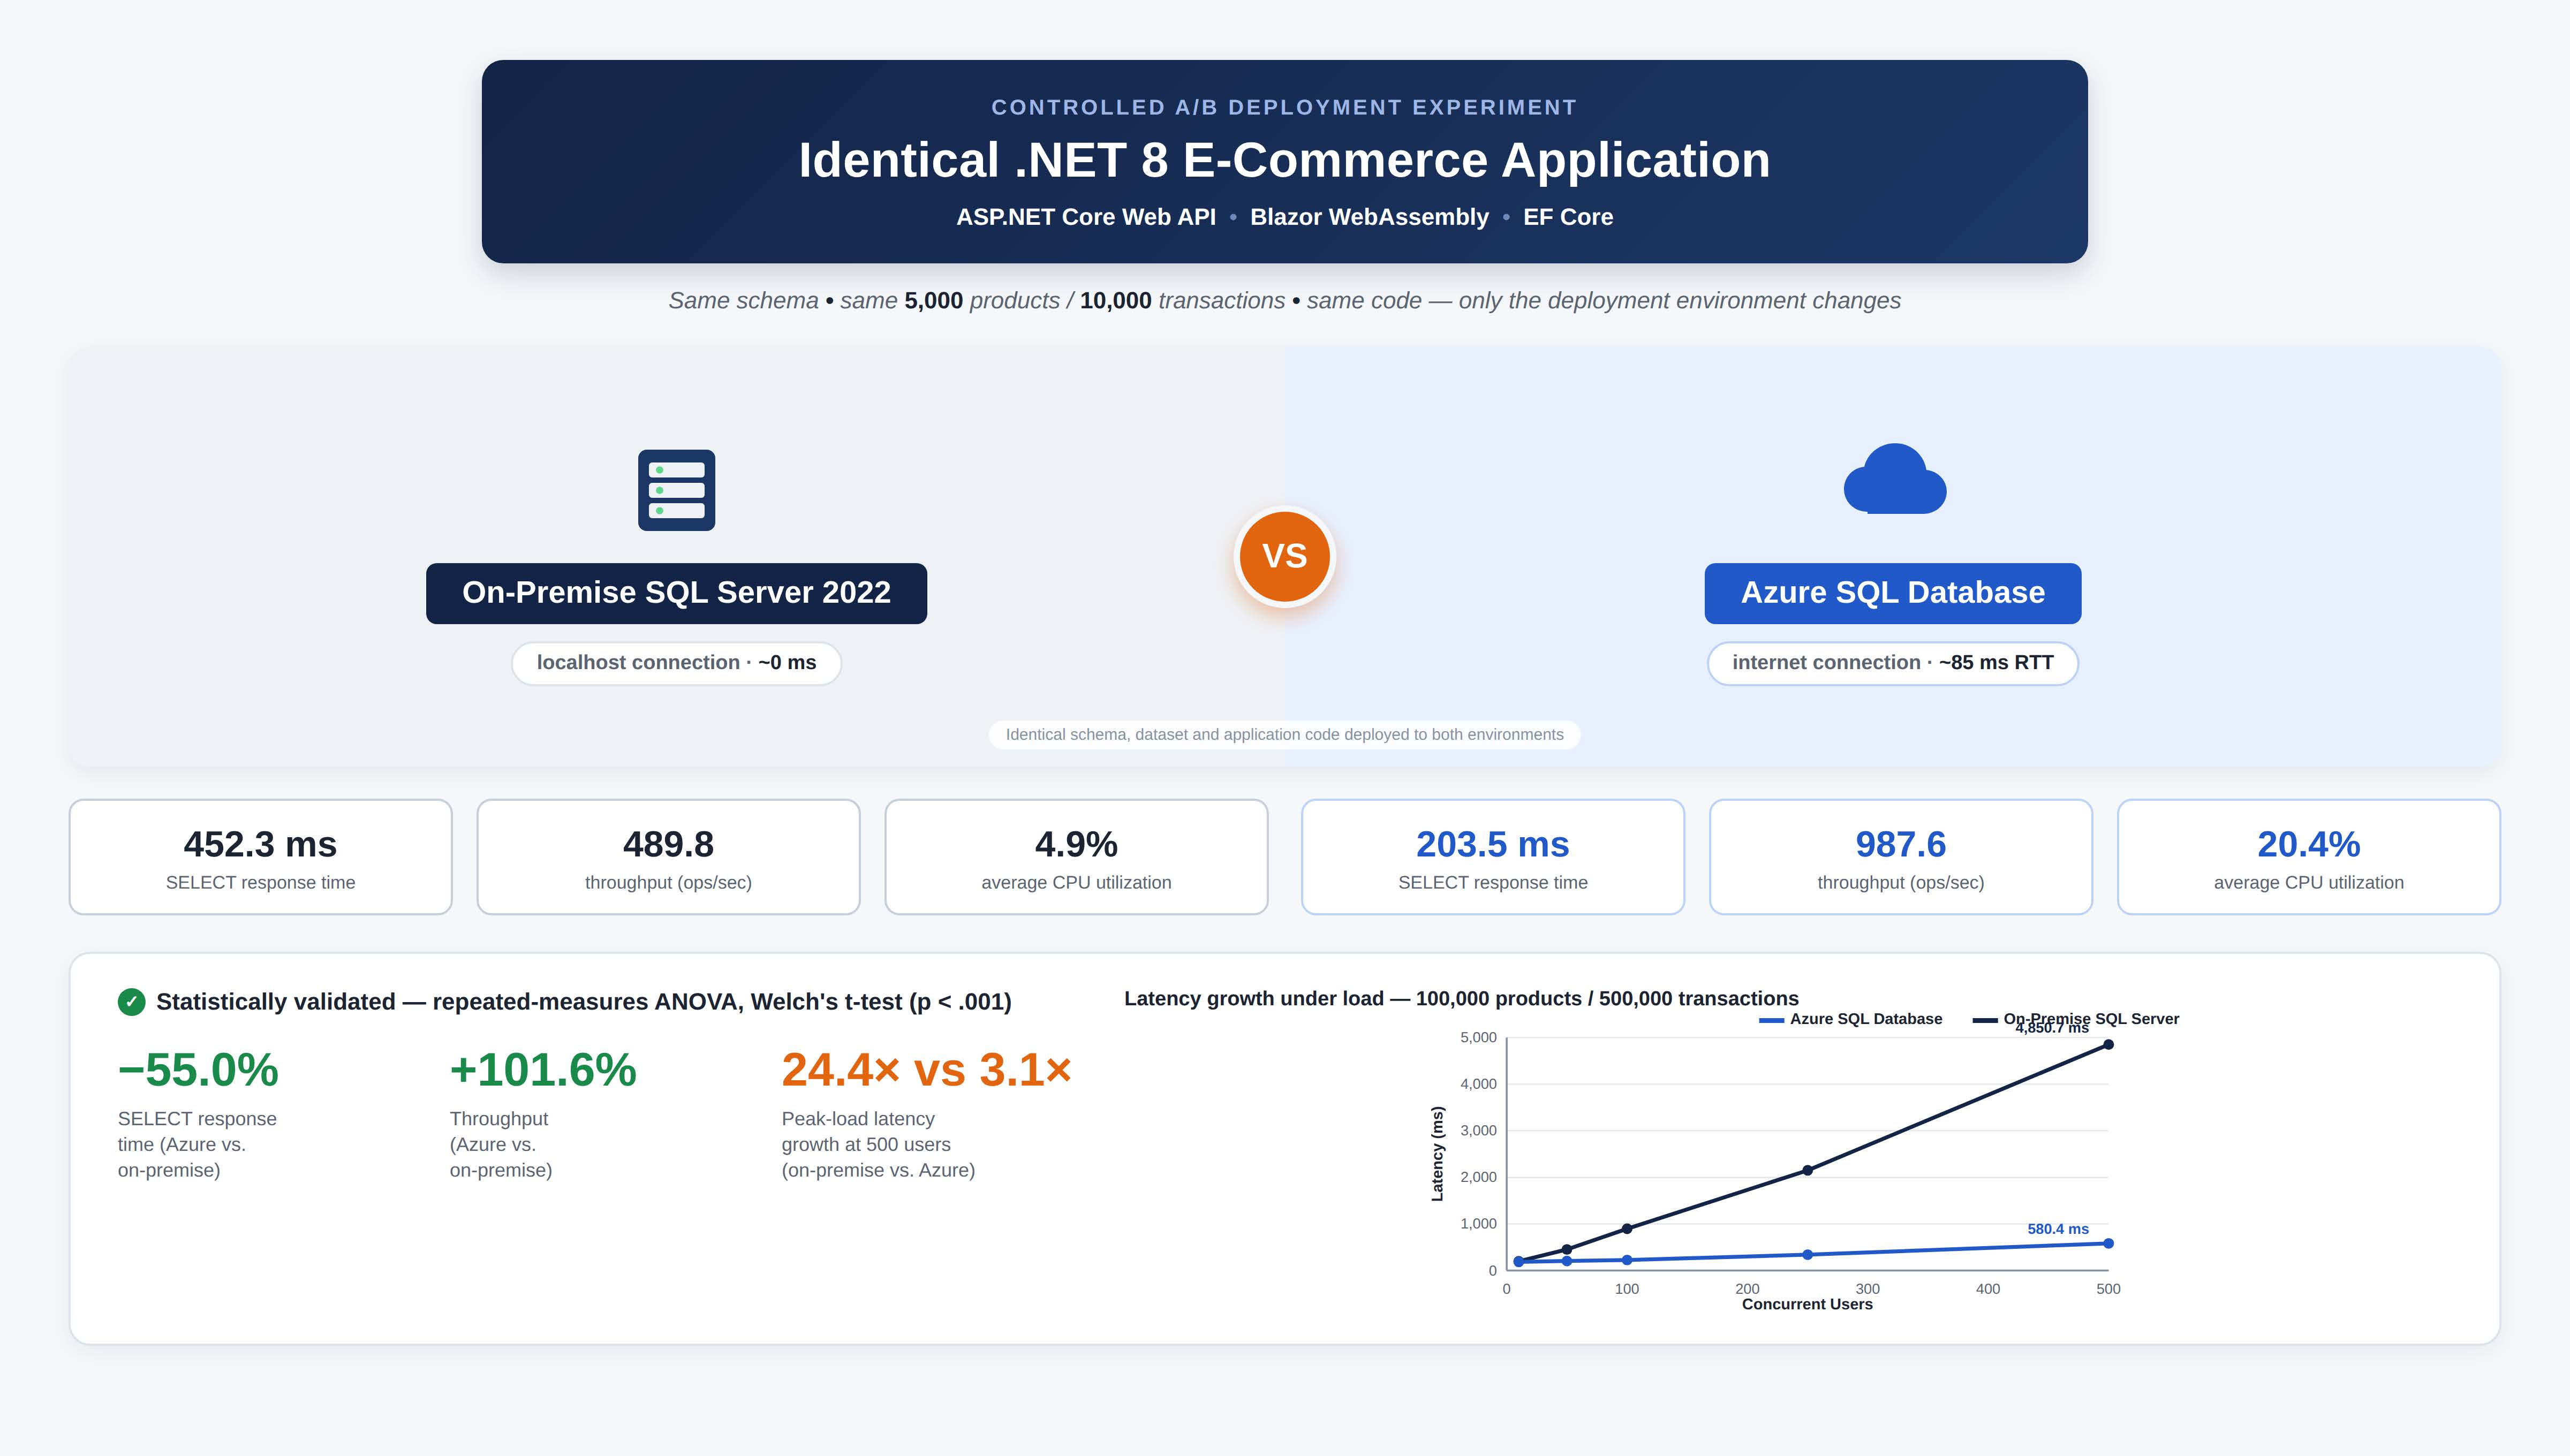
The system was tested in a manner that parallels its existing on-site baseline using the same experiment design. Azure SQL Database has lessened the mean response time of a SELECT statement by 55.0% when compared to the on-premise SQL Server (203.5 ms vs. 452.3 ms) and increased the number of operations per second by 101.6% (987.6 ops/s vs. 489.8 ops/s), respectively, with peaks in CPU utilization at 35.2% and coefficients of variation for query operations ranging from 10.6% to 11.5%. These results demonstrate consistent, statistically reliable performance for concurrent e-commerce workloads.
4. System Architecture Testing
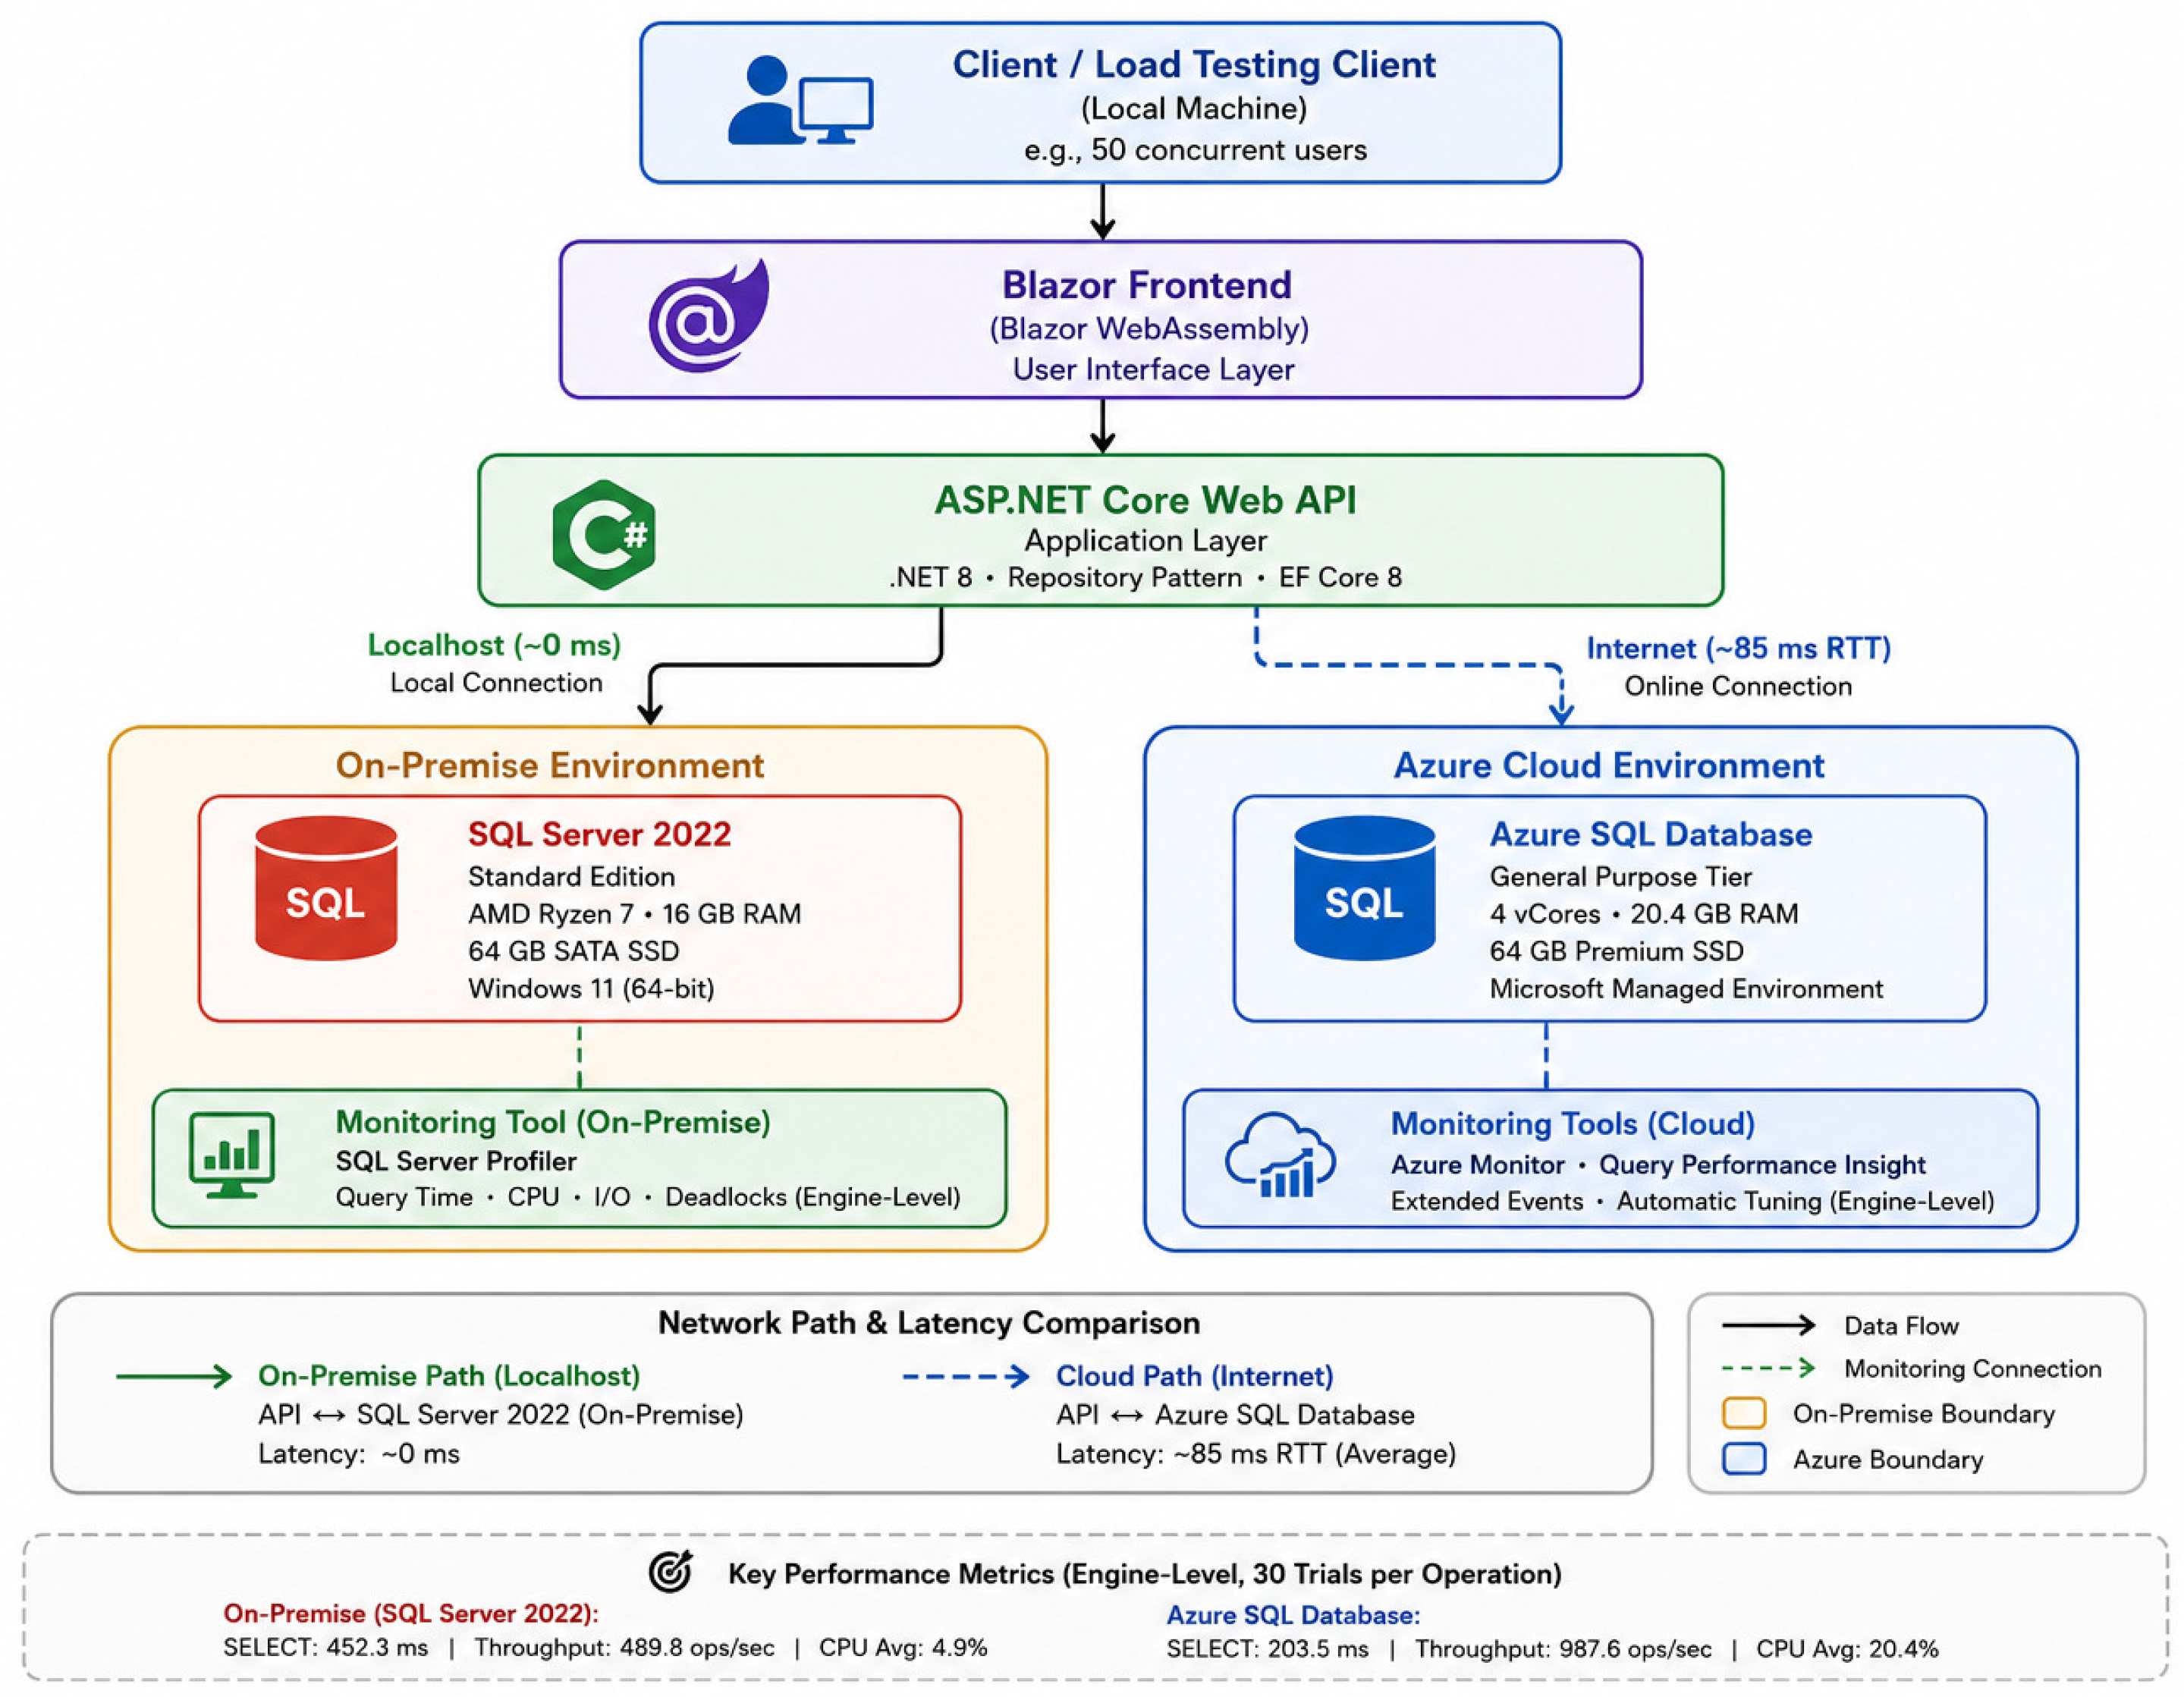
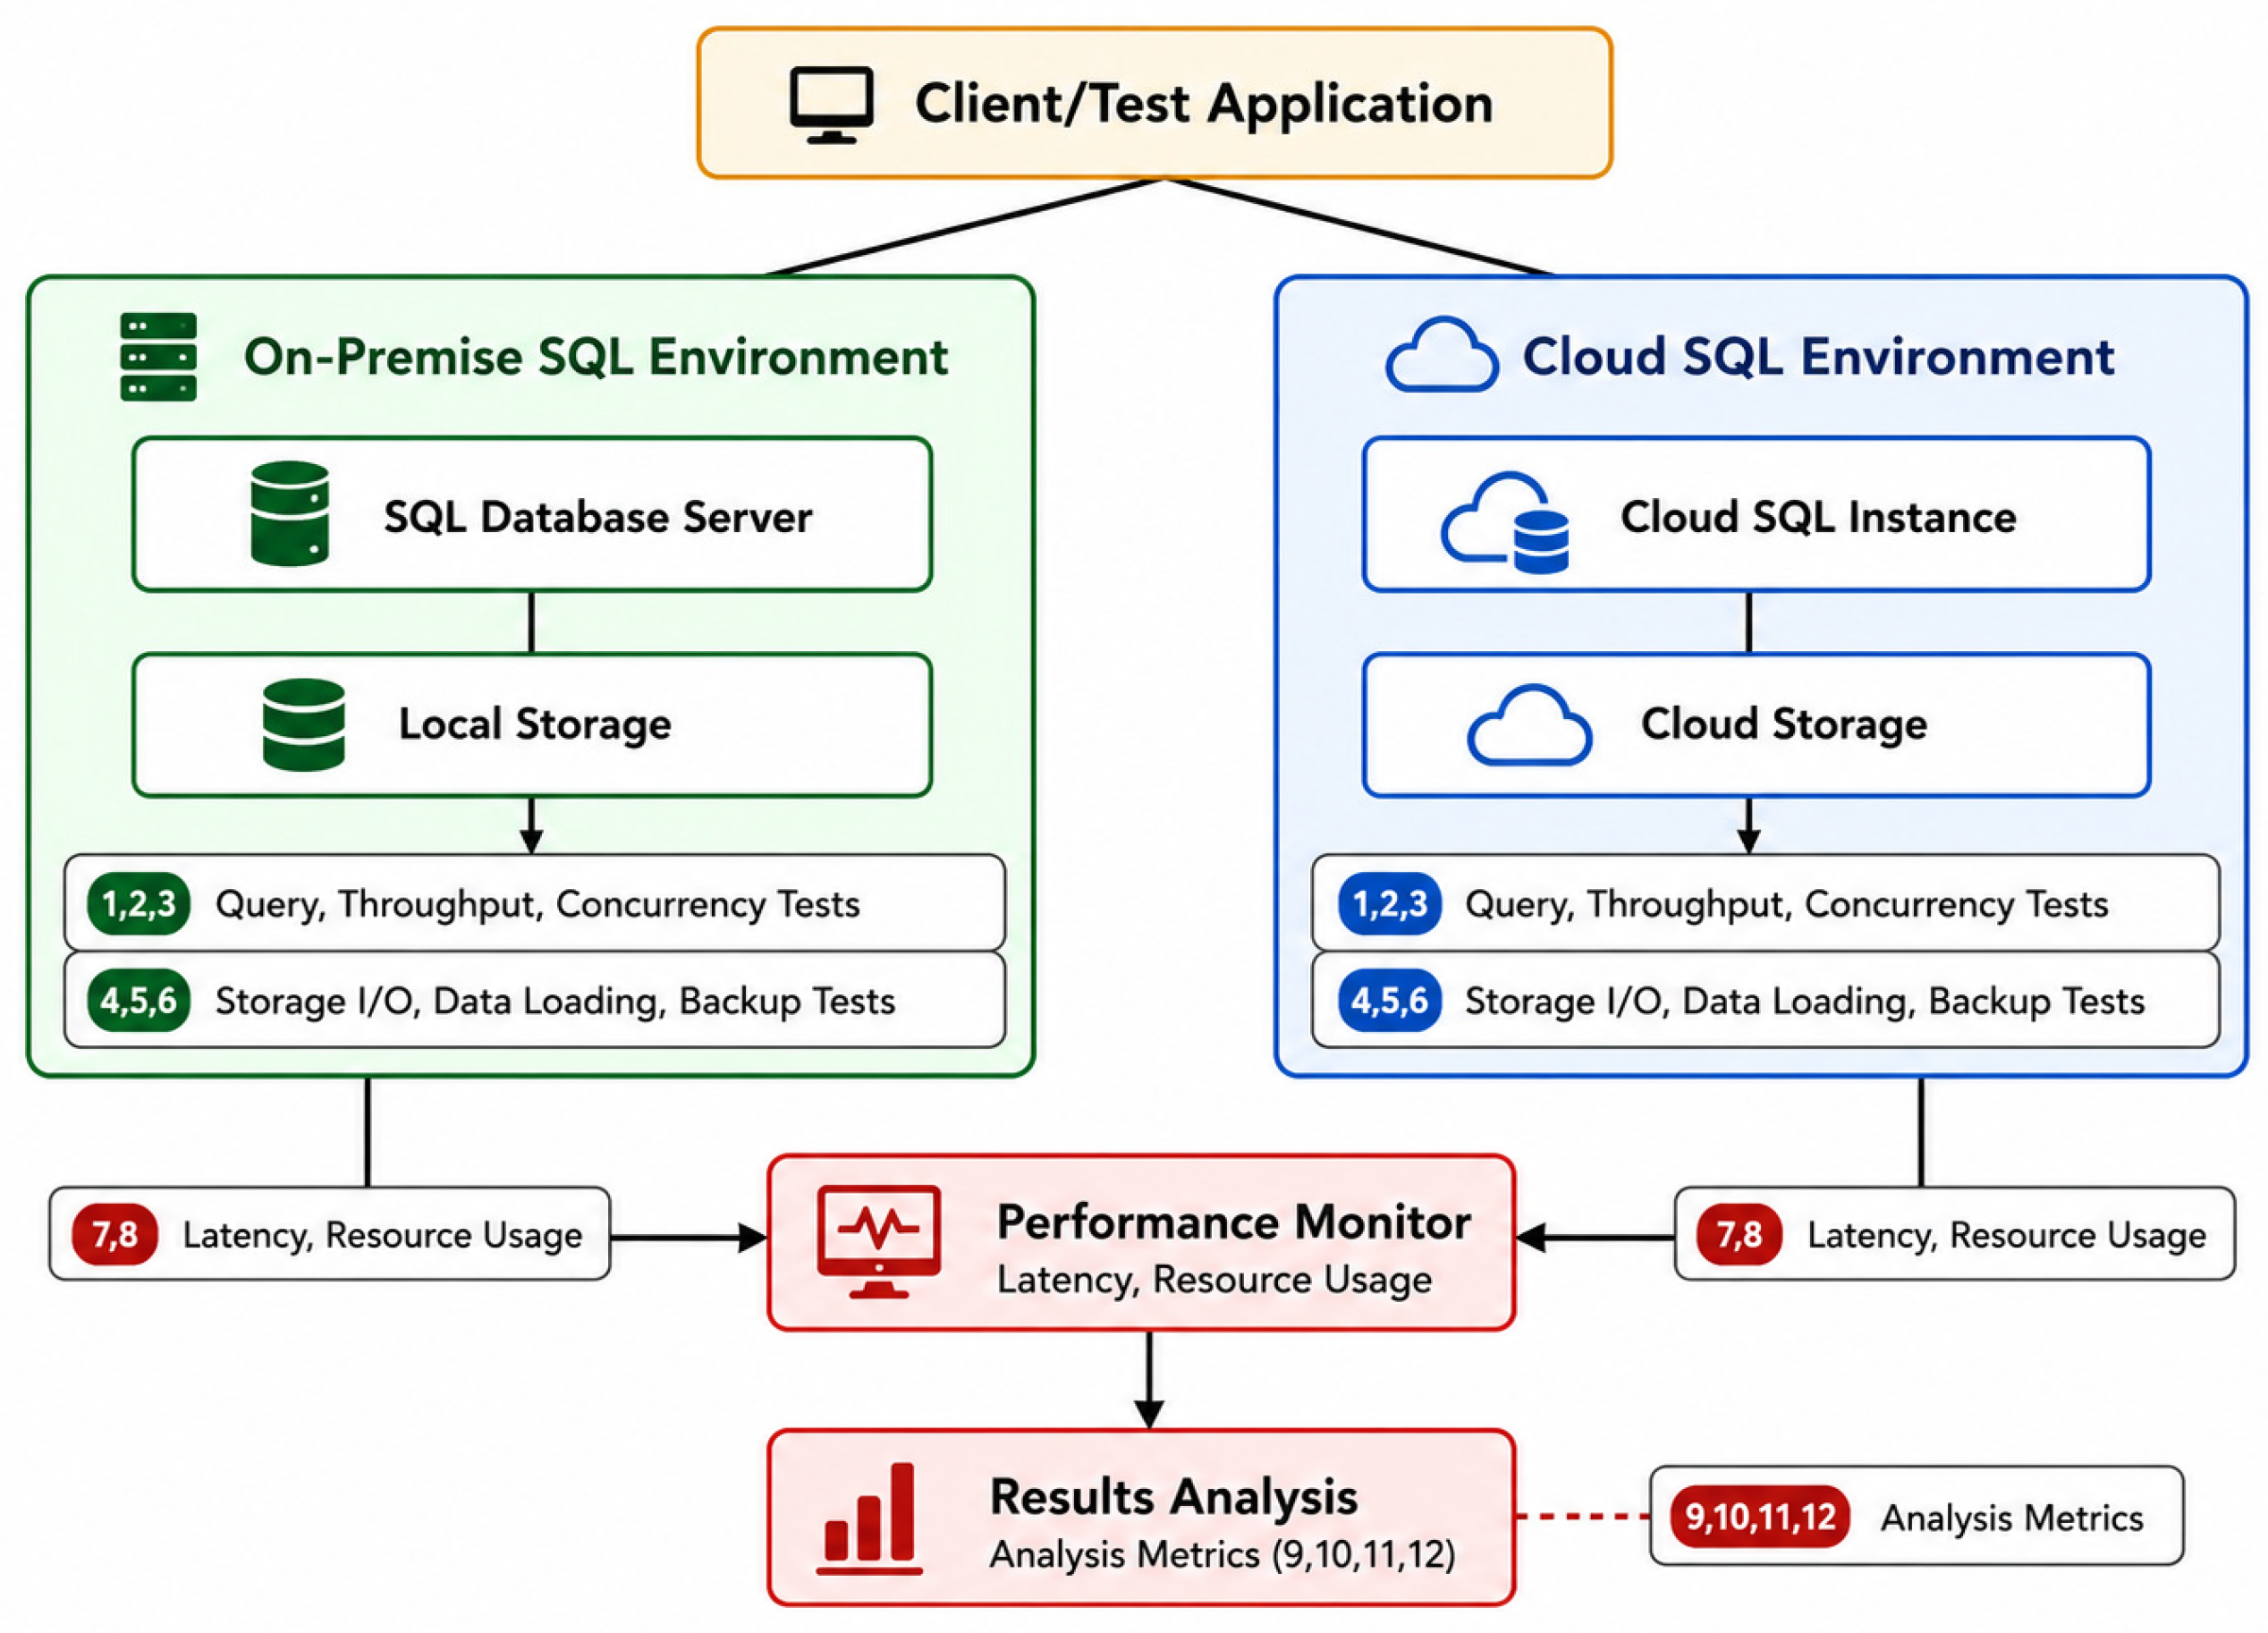
For performance evaluation, an e-commerce application developed using .NET Core 8 was provisioned in two environments: on-premise SQL Server and Azure Cloud SQL Database. The performance evaluation architecture shown in
Figure 1 includes a local PC with SQL Server, compared to an Azure Cloud solution using Azure SQL Database for storage.
Microsoft Azure was selected as the cloud platform for this research because of its ease of service management and deployment via an integrated portal. Azure’s cloud management capabilities enable efficient deployment and monitoring, making it overall very well-suited for managing an e-commerce application [
28]. The proposed system can be deployed on many different physical servers as part of production usage. However, the experimental evaluation carried out in the present study was performed using only one local machine. The SQL Server database and the ASP.NET Core Web API application, along with the load-testing client, were all hosted on this single machine (AMD Ryzen 7 processor (16 GB of RAM) and Windows 11 OS). The intent of hosting all three components of the evaluation on one local machine was to ensure that a controlled and replicable experimental environment was created, thereby reducing any impact caused by variable infrastructure characteristics when measuring performance, comparable to Azure’s built-in fault-tolerant systems.
The SQL Profiler was used to capture and analyze query execution times, deadlocks, and CPU usage on a local SQL Server database to identify performance bottlenecks. The same e-commerce system was then deployed to the Azure Cloud, where performance metrics such as query execution, CPU, memory, and I/O were analyzed using tools including Query Performance Insight, Azure Monitor, Extended Events, and Automatic Tuning. This broader approach provides a structural guide for comparing the efficiencies and capabilities of the two environments.
The goal of this research was to experimentally determine which type of database (traditional on-premise SQL Server or the recently available Azure SQL Database) performs better. The experimental design used a controlled factorial benchmarking methodology, in which each database characteristic (e.g., data size, number of concurrent users) was systematically varied while all other characteristics were held constant. This design allowed for a controlled investigation into how each variable influences specific performance measurements (throughput and latency) independently of other variables. In addition, a significant number of test conditions were used to generate sufficient variability in the test data while maintaining sufficient control over each variable to isolate its effects on overall system performance effectively.
Both deployment environments used in this research study have their hardware and software configurations documented in
Table 3. The on-premise deployment was physically hosted on a computer with a quad-core processor (16 GB of RAM) and a 64 GB solid-state drive (SSD). In this deployment, Windows 11 (64-bit) was the operating system with Microsoft SQL Server 2022 Standard installed as the database system. The cloud deployment was built using the General Purpose service tier of Azure SQL Database, was provisioned with four virtual CPUs (vCores), utilized 20.4 GB of managed memory, and was hosted in the Middle East cloud datacenter on Microsoft Azure. Both deployments used ASP.NET Core Web API (Version 8) as the application layer and Entity Framework Core (Version 8) as the object-relational mapping solution—this provides architectural consistency between both deployments.
Both the ASP.NET Core Web API application server and the load-testing client were hosted on the same local machine (AMD Ryzen 7, 16 GB RAM, Windows 11), which also served as the test controller. The on-premise SQL Server instance was accessed via localhost with negligible network latency (~0 ms), while the Azure SQL Database instance was accessed over a secured internet connection to the Azure Middle East datacenter, introducing an average round-trip latency of approximately 85 ms.
The network overhead due to using an Azure connection was evaluated by measuring round-trip latency (RTT) between the local machine and the Azure Middle East datacenter via continuous ICMP echo requests before starting each test session, using 30 samples. The average RTT for the samples was approximately 85 ms (minimum: 72 ms; maximum: 104 ms; standard deviation: 8.3 ms). However, the Azure SQL Database performance metrics used in the comparison were all gathered with Azure-native tools (i.e., Azure Monitor, Query Performance Insight, and Extended Events), which measure query execution time at the database engine level, separately from any client-side network transmission time. Therefore, when preparing the SQL query SELECT statement response time from Azure SQL, of 203.5 ms, it was measuring engine processing performance only rather than total application latency across all components of the application. The on-premise SQL Server database performance metrics were similarly gathered at the engine level using SQL Server Profiler. Measurement comparisons at the engine level ensure that when observing a difference of 55.0% in performance between the environments, the difference was due to the capability of the SQL Database Engine and not a measure of the differences in network topology.
To ensure reproducibility and fairness of the comparison, the workload generation procedure was standardized across both environments as follows. All database requests were issued programmatically via the ASP.NET Core Web API using a dedicated load-testing client that generated randomized sequences of CRUD operations (SELECT, INSERT, UPDATE, DELETE) drawn from a fixed pool of 5000 product records and 10,000 transaction records. The distribution of operation types followed a read-heavy pattern typical of e-commerce traffic, with SELECT operations comprising approximately 60% of the total request volume and INSERT, UPDATE, and DELETE operations accounting for the remainder. Concurrent user load was simulated by spawning up to 50 parallel threads, each executing independent request sequences to avoid inter-thread dependencies. To eliminate cold-start effects and cache warm-up bias, five warm-up runs were executed prior to each measurement session and discarded from the results. Query plan caching effects were controlled by clearing the SQL Server plan cache (DBCC FREEPROCCACHE) and buffer pool (DBCC DROPCLEANBUFFERS) before each test run in the on-premise environment, while the Azure SQL Database was similarly tested under a fresh connection pool state at the start of each session. Identical stored queries and parameterized commands were used in both environments to ensure that execution plans were comparable and that no environment-specific query optimization artifacts influenced the results. Each CRUD operation (SELECT, INSERT, UPDATE, and DELETE) was executed over 30 repeated trials under controlled experimental conditions. Between consecutive trials, a 60 s idle interval was maintained, and the SQL Server procedure cache was cleared before each run to reduce caching effects. Although these measures improved consistency between runs, the trials were conducted within the same experimental environment and therefore represent repeated measurements rather than fully independent statistical observations. This distinction is accounted for in the statistical analysis reported in
Section 5.
It should be noted that the end-to-end system development, deployment, and monitoring activities (including the Azure Monitor and Application Insights dashboards presented in
Section 5.2) spanned approximately six months. However, the formal statistical performance measurements reported in this study—the 30 repeated trials per CRUD operation used for the ANOVA and
t-test analyses—were collected within short, controlled sessions nested inside this broader monitoring window, following the protocol described above (warm-up runs, cache clearing, 60 s idle intervals).
The database size was designed to reflect the scale of a typical medium-sized e-commerce store rather than a large global e-commerce marketplace. An example set of ~5000 products and ~10,000 historical transactions will enable realistic relational joins, index lookups, stock transaction updates, and other concurrent transactional behavior, while providing an entirely controlled and completely reproducible experimental environment. As both deployment environments utilized an identical dataset, any differences in performance from one environment to the other can only be attributed to the database deployment architecture and not the number of records in their respective databases.
Moreover, the benchmark places greater emphasis on transaction complexity and the number of concurrent users than on the size of the datasets being processed. The operations evaluated include multi-table joins, inventory updates, payment processing, and concurrent requests for create, retrieve, update, and delete (CRUD) operations, which are representative of the operations performed by an e-commerce application.
In
Section 6.3, we will replicate our findings using the larger enterprise datasets (100K products, 500K transactions) to demonstrate that the observable performance differential continues to grow as data volume increases and is therefore reproducible across and generalizable to both the business unit and enterprise scales.
4.1. Network Architecture and System Complexity
The structure of the e-commerce platform is made up of three areas known as layers (user interface, application, and database). These three layers enable the e-commerce application to scale and maintain its performance in both local and cloud configurations. For the front-end application, we use Blazor WebAssembly. Blazor enables client-side C# execution for all product browsing, cart management, and check-out functionality. All communication between the client and server runs over RESTful HTTP requests, and all data passed between the client and server is provided in JSON format. ASP.NET Core Web API is the basis for the application layer. Endpoints for product, order, user, and inventory operations were provided via the Web API. Data access was abstracted using the repository pattern. The common interface enabled CRUD operations while reducing dependence on the business logic of the actual database implementation. Furthermore, transaction management is coordinated using the Unit of Work pattern, which ensures data consistency across multiple repositories performing their respective operations.
Microsoft SQL Server, paired with Entity Framework Core as the ORM, was used as the data layer for both deployments, mapping a schema of products, categories, orders, users, and inventory tables to C# domain objects. User requests flow from the Blazor interface through ASP.NET Core middleware to the appropriate API controller, with responses returned in JSON format. ASP.NET Core’s asynchronous programming model enables concurrent request handling, which was evaluated under loads of 1–50 concurrent users performing representative e-commerce scenarios (product search, order creation, transaction update.
The comprehensive system architecture comprises numerous interrelated elements contributing to the overall complexity of the complete system. Such elements include client-side modules, RESTful APIs, authentication modules, and relational database modules. Upon receipt of a user request through Blazor, that user request will be processed according to the standard processing pipeline, whereby it is routed to the appropriate ASP.NET Core middleware pipelines. Once received by the proper API controller, the user request will be processed according to business rules and respond back with a JSON response to the user requestor.
The ASP.NET Core Runtime has both a synchronous and an asynchronous programming model to allow for concurrent processing of requests through the hardware architecture of the platform, as well as processing multiple users’ requests at the same time. To evaluate performance, an experimental evaluation was conducted on the ASP.NET Core Runtime platform under load conditions of between 1 and 50 concurrent users performing representative e-commerce scenarios (product search, order creation, and transaction update). The ASP.NET Core Runtime performance characteristics were assessed to evaluate its ability to efficiently process requests and to analyze how the system can be deployed in a scalable way, either on a local infrastructure or in a cloud environment.
4.2. API Development
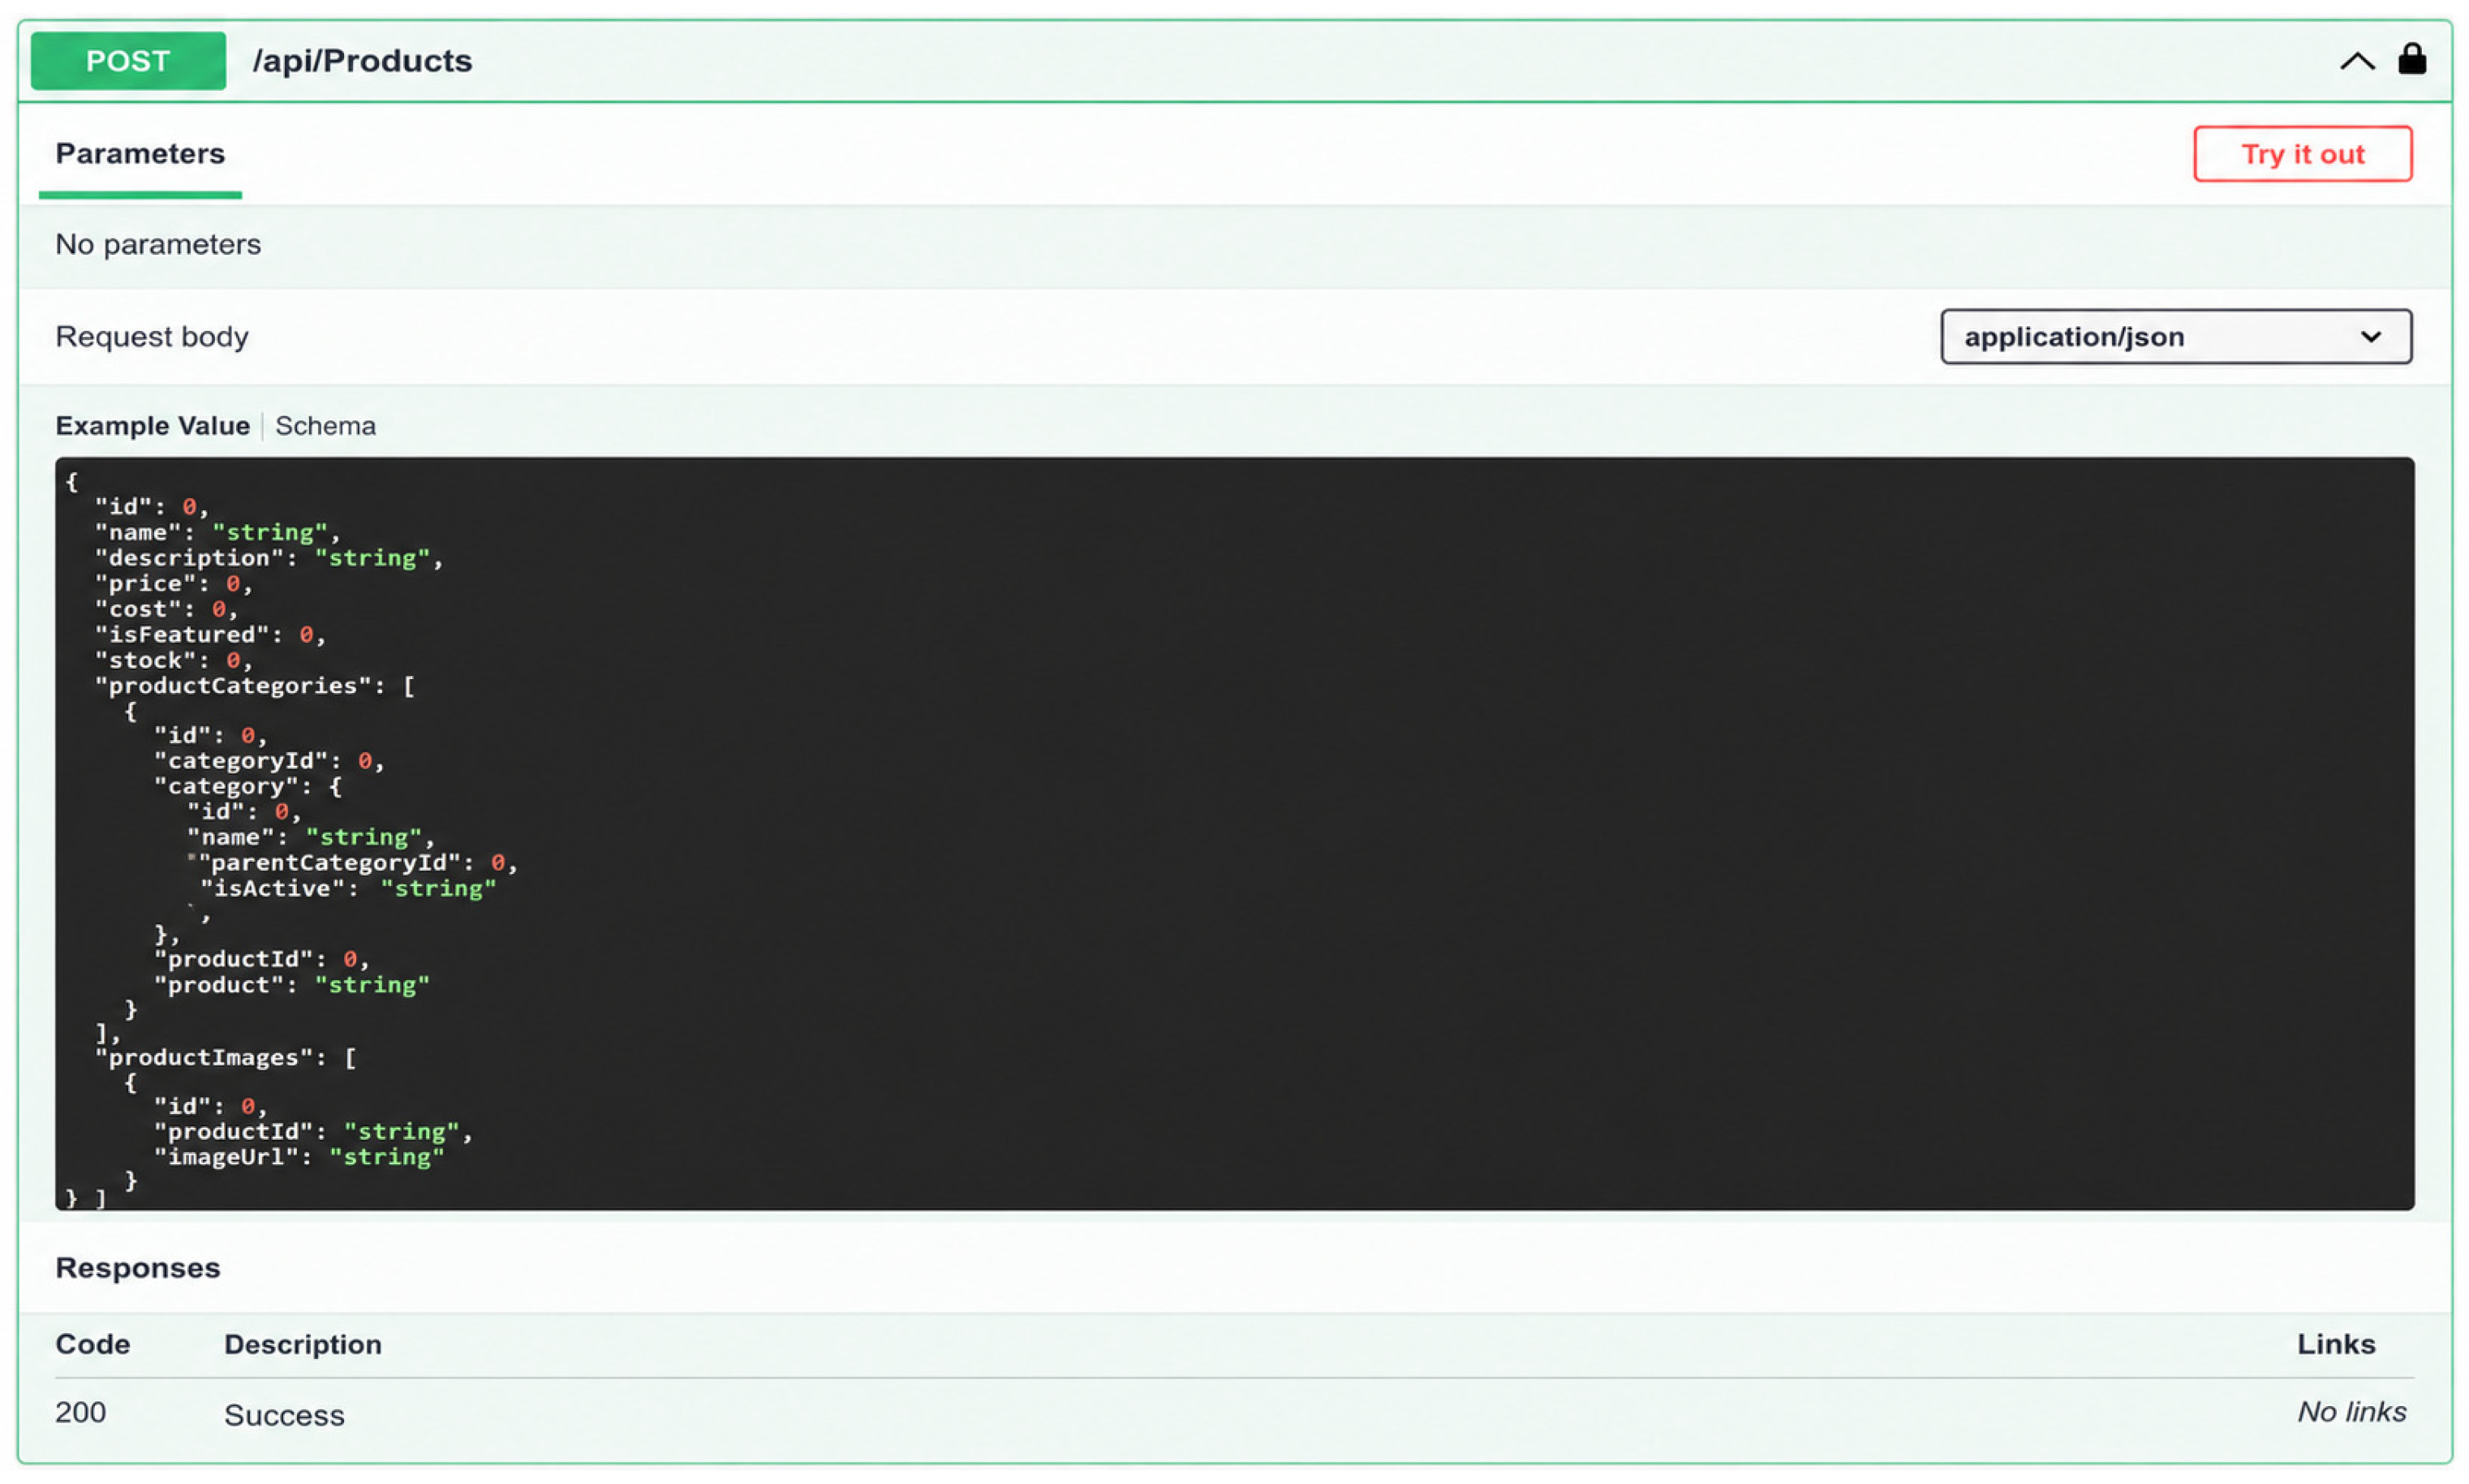
An application programming interface (API) has been implemented in ASP.NET Core using a controller method. In this way, JSON serialization is automatically built into the API to create RESTful endpoints that allow for secure access from any client via JSON Web Token (JWT)-based authentication and authorization [
29]. Each API is associated with a single entity type (e.g., product, order) and communicates with its associated database via a data context, as shown in the Swagger UI (see
Figure 2).
4.3. Blazor Frontend Development
Blazor WebAssembly is used to implement the client side, enabling integration with the .NET Core ecosystem and allowing for the use of C# [
12]. In addition, it also allows us to share models and business logic between layers of the application and thereby reduce architectural complexity. The user interface will be developed using the MudBlazor component library to provide product filtering, promotional functionality, and shopping cart and checkout support. User authentication will be accomplished using token-management mechanisms that store the user’s authenticated state in a WebAssembly-based client application [
28].
4.4. Database Architecture Development
SQL Server has been selected as the RDBMS for the project’s supporting databases due to its robust transaction management and integrity capabilities [
30]. To further increase the abstraction of database access, Entity Framework Core was used as an ORM to abstract database access into objects using C#. This allowed for the use of various Entity Framework features, such as lazy/eager loading and pooled connection capabilities [
31]. Additionally, CRUD operations were performed using LINQ, with the goal of communicating with the database using a relational query format.
Both environments utilized the same indexing strategy, as defined completely by Entity Framework Core’s Fluent API within the DataContext configuration. The default clustered index in both environments was automatically created for all primary key columns, while explicit non-clustered unique indexes were created for frequently queried fields such as Product Name, Category Name, Supplier, Supplier Name, Bank Name and Country Name, along with composite indexes for State (CountryId, Name) and City (StateId, Name). No other manual indexes were created besides those created by the schema definition. Azure SQL Database’s automatic tuning feature was not enabled, meaning that the index structure was the same between both environments and would not affect the results of this comparison as an uncontrolled variable. Entity Framework Core 8 connection pooling was configured with a maximum pool size of 1024 and a command timeout of 600 s to support high-concurrency performance testing. During high-concurrency testing, long-running operations were supported using this configuration. Both on-premise and Azure SQL Database connections utilized the same connection management configurations to ensure that differences in connection management did not impact the comparative performance results.
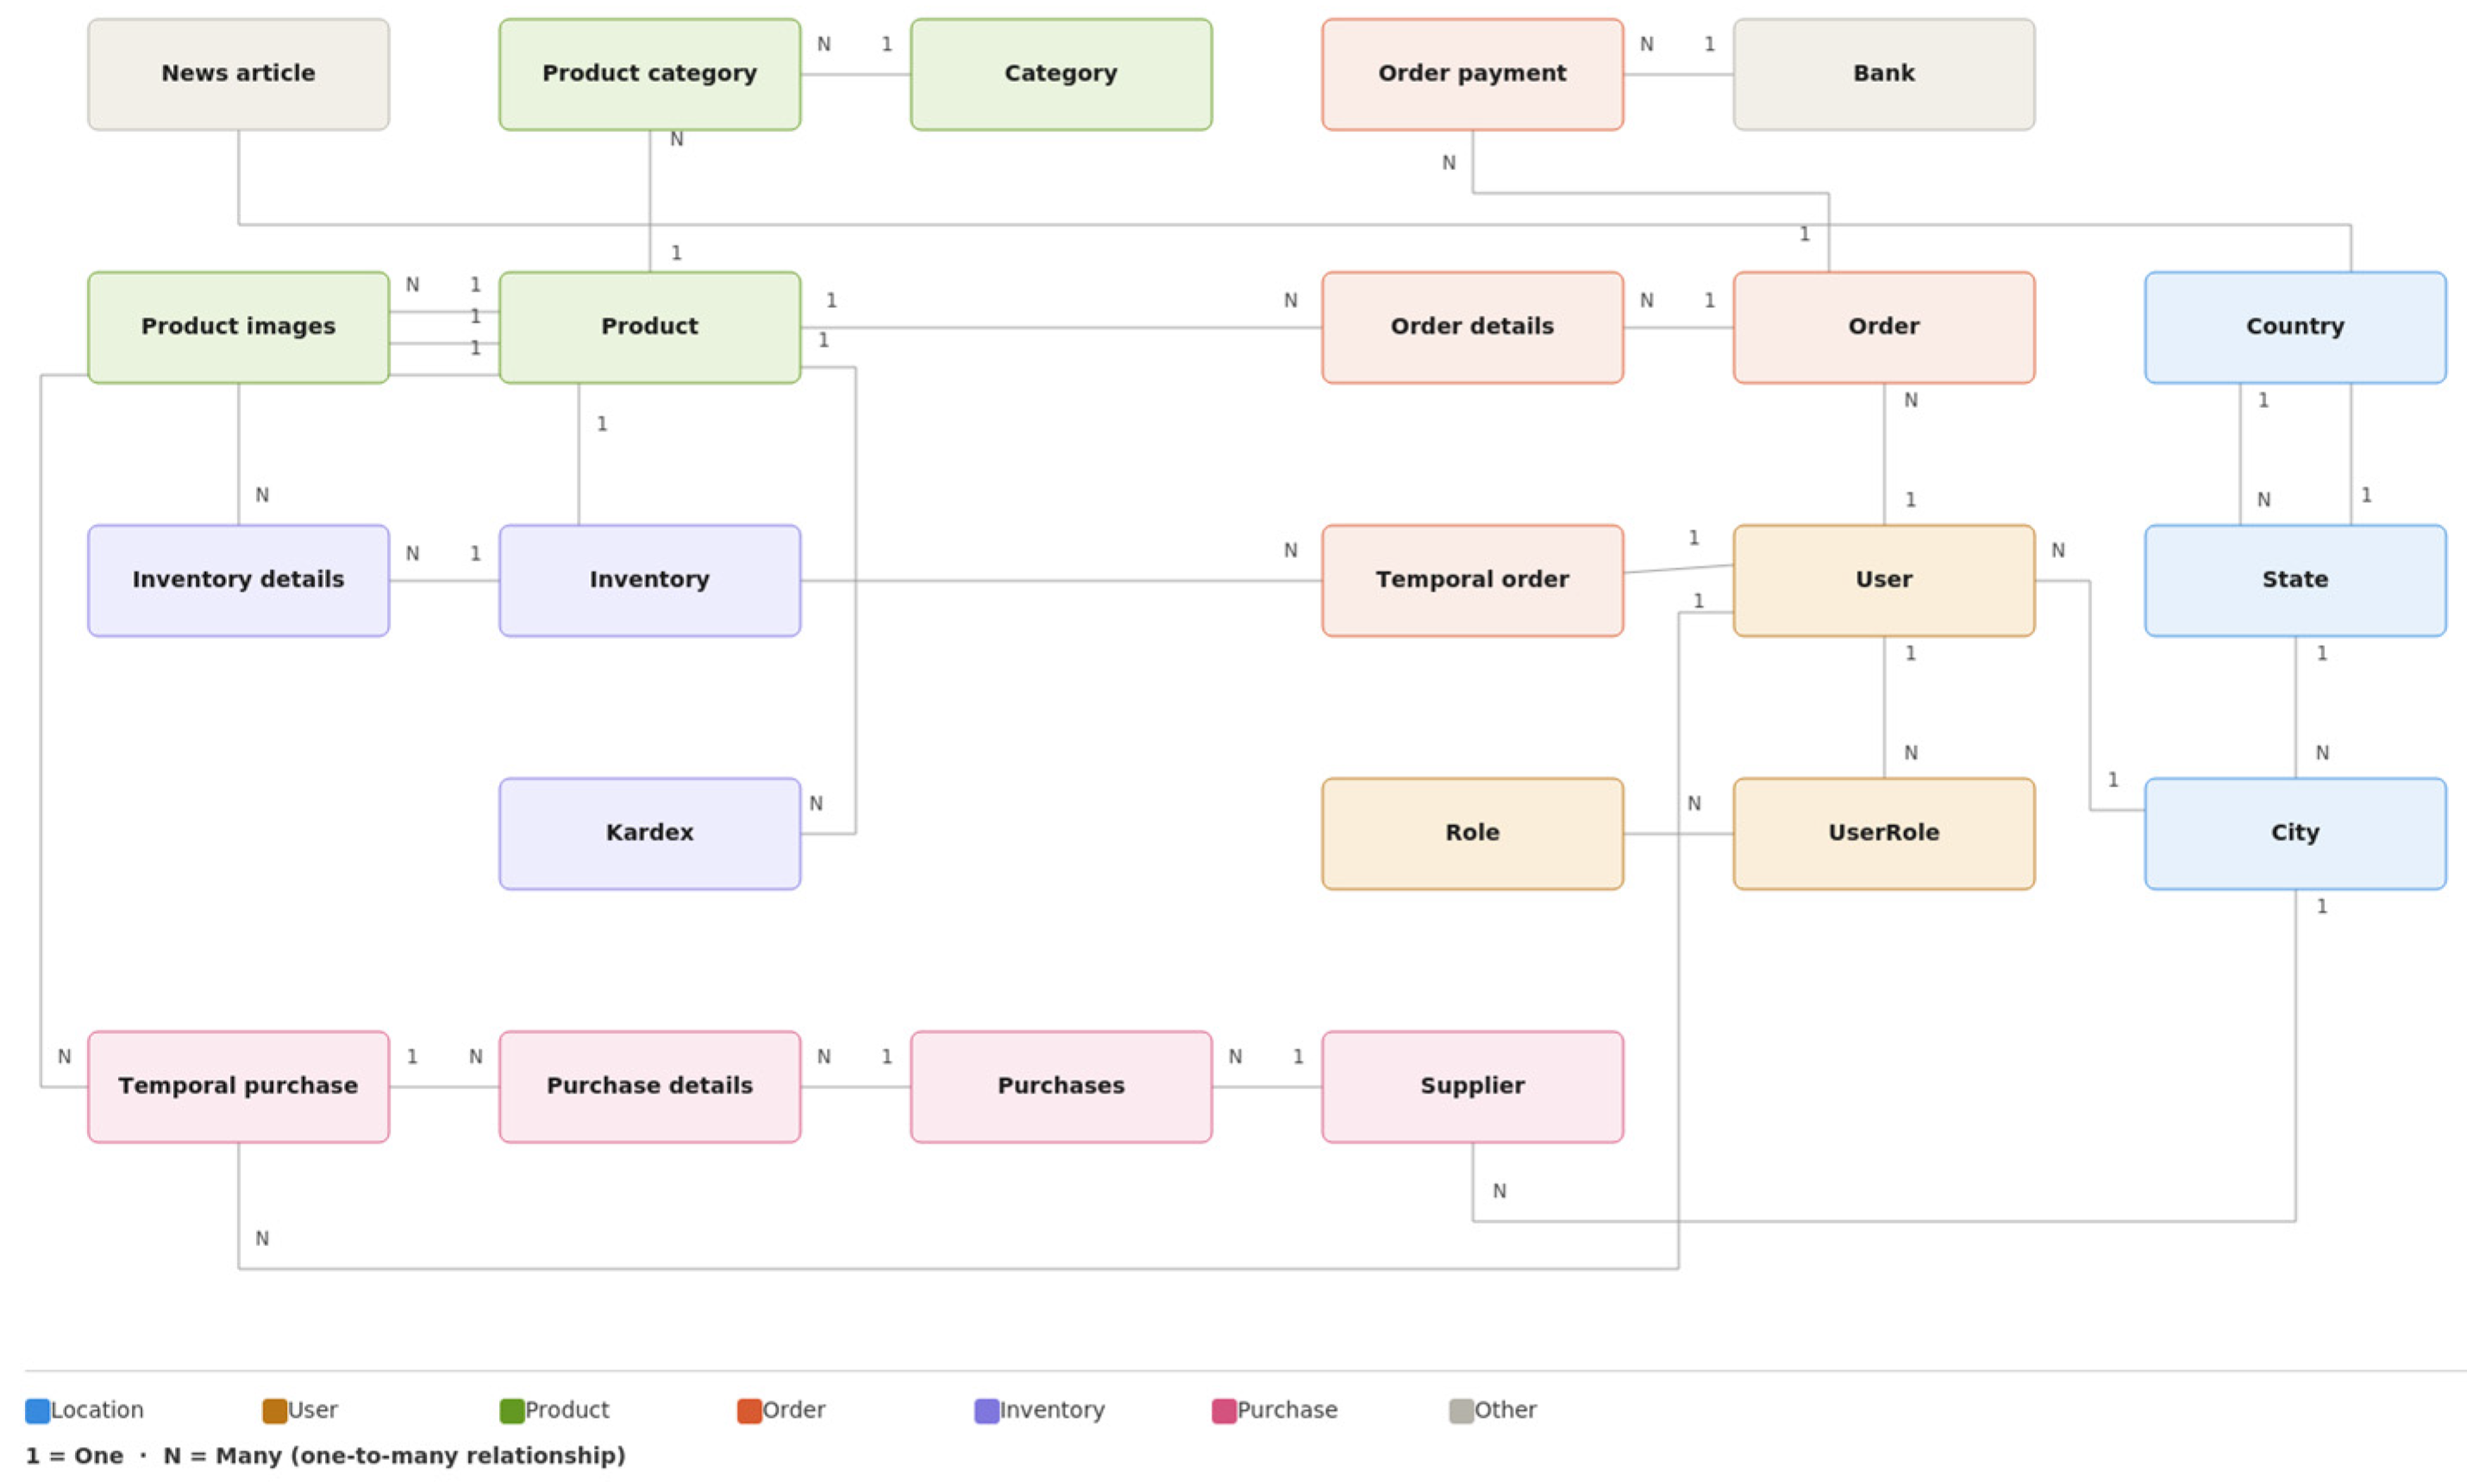
Figure 3 provides the entity-relationship diagram explaining the relations between products, categories, orders, users, and inventory. This relational model of the database architecture describes the functions of the e-commerce platform [
32]:
A product is associated with one or more categories.
Orders contain order details and payment information.
The schema is designed to efficiently manage inventory, user information, and various types of transactions.
The database also maintains internationalization and multilingual capabilities, as demonstrated in the Country and State tables, which are related to user profiles.
In a manner similar to the API deployment, the database was stored both locally and in the cloud:
Local Deployment
The local database was hosted on a local workstation running Windows 11 (64-bit) with Microsoft SQL Server 2022 Standard Edition.
The application accessed the local database through SQL Server Management Studio (SSMS) using a localhost connection during on-premise testing.
The local workstation was configured to support database access and performance testing under the experimental workload.
Cloud Deployment
The database schema was created using Entity Framework Core migrations.
An Azure SQL Database instance was provisioned through the Azure Portal, and the same database schema was deployed.
The Azure SQL Database was accessed remotely from the local workstation using SQL Server Management Studio (SSMS) over the internet.
Synchronization Strategy
The API of ASP.NET Core with Entity Framework Core was used for interaction with the database.
Synchronization between local and cloud systems was provided by automated migration of data and real-time API calls.
Updates applied from the local system were reflected on the cloud systems.
The development process leveraged cloud replication strategies, facilitating the use of built-in Entity Framework Core capabilities to ensure robust database management practices
Once the Azure SQL Database was deployed, the generated connection credentials were used to establish a secure remote connection from SQL Server Management Studio (SSMS) running on the local workstation, enabling the cloud database to be managed in the same manner as the local SQL Server instance.
4.5. Representative Query Implementation
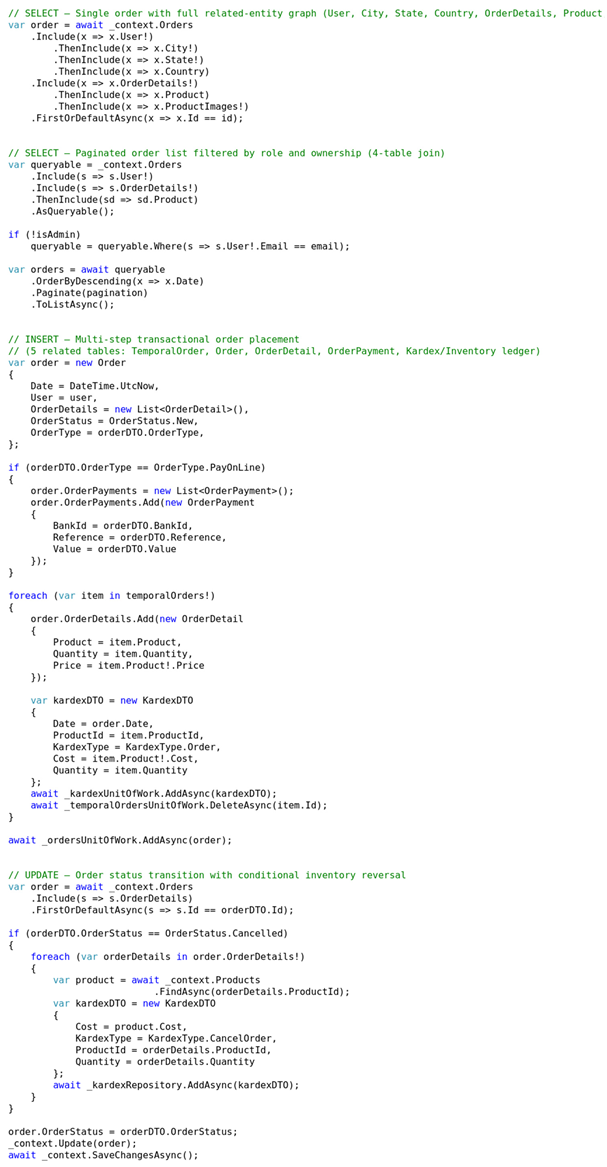
To ensure full reproducibility of CRUD operations, the actual code implementations for each operation are exported directly from the production repository. The SELECT operation is the most computationally intensive (i.e., has the most demanding workload) of the four CRUD operations and is used most extensively throughout the application; multi-table join processing (as described in
Section 5) has been taken from OrdersRepository. Other related entities: four of these entities are reached through the user/geography relationship chain (User → City → State → Country), and three through the order/product relationship chain (OrderDetails → Product → ProductImages).
SELECT—Single order retrieval with full relational context (including seven tables):
DELETE—(from ProductsRepository.cs) cascading removal across Product, ProductCategory, and ProductImage entities, implemented via EF Core’s configured cascade–delete behavior on the respective navigation properties. In the schema, inventory management is implemented via the Kardex ledger entity, which contains records of all stock activity, such as orders placed (KardexType.Order) and canceled orders (KardexType.CancelOrder). The concept of maintaining a single changing number for the total number of items in stock has been replaced by multiple transactions that form an audit trail, following the ACID standards and requirements for e-commerce transaction systems supporting financial transactions.
5. On-Premise SQL Database Performance Measurement
This section provides detailed insight into the performance of an on-premises SQL database setup. Knowledge of how on-premises SQL databases perform is valuable; this information will inform one about how much workload on-site databases can handle vis-à-vis those hosted in the cloud, as shown in
Table 4 and
Figure 4.
The on-prem production environment was built similarly to the cloud environment, with a server equipped with 4 CPU cores and 16 GB of RAM, and 64 GB of SSD storage, running a Microsoft SQL Server instance. The SQL Server instance’s Database Engine was configured to use up to 12 GB of memory, leaving sufficient memory available for OS use to support stable testing. SQL Profiling, as reported in SQL Server Profiler, was used to measure execution time, CPU time, and I/O activity across varying workloads to facilitate comparison between the on-prem SQL Server instance and the cloud database instances.
Testing was conducted using programmatically generated workloads in which 50 concurrent users simultaneously executed randomized CRUD operations (SELECT, INSERT, UPDATE, DELETE) against a fixed dataset, following the standardized workload protocol described in
Section 4, including warm-up run discarding and cache clearing between trials. The experimental database was created with approximately 5000 products and 10,000 transactions. The testing was completed with both the on-site system (Microsoft SQL Server) and the online system (Azure SQL Database), which allowed for a fair basis to compare the performance results for each system.
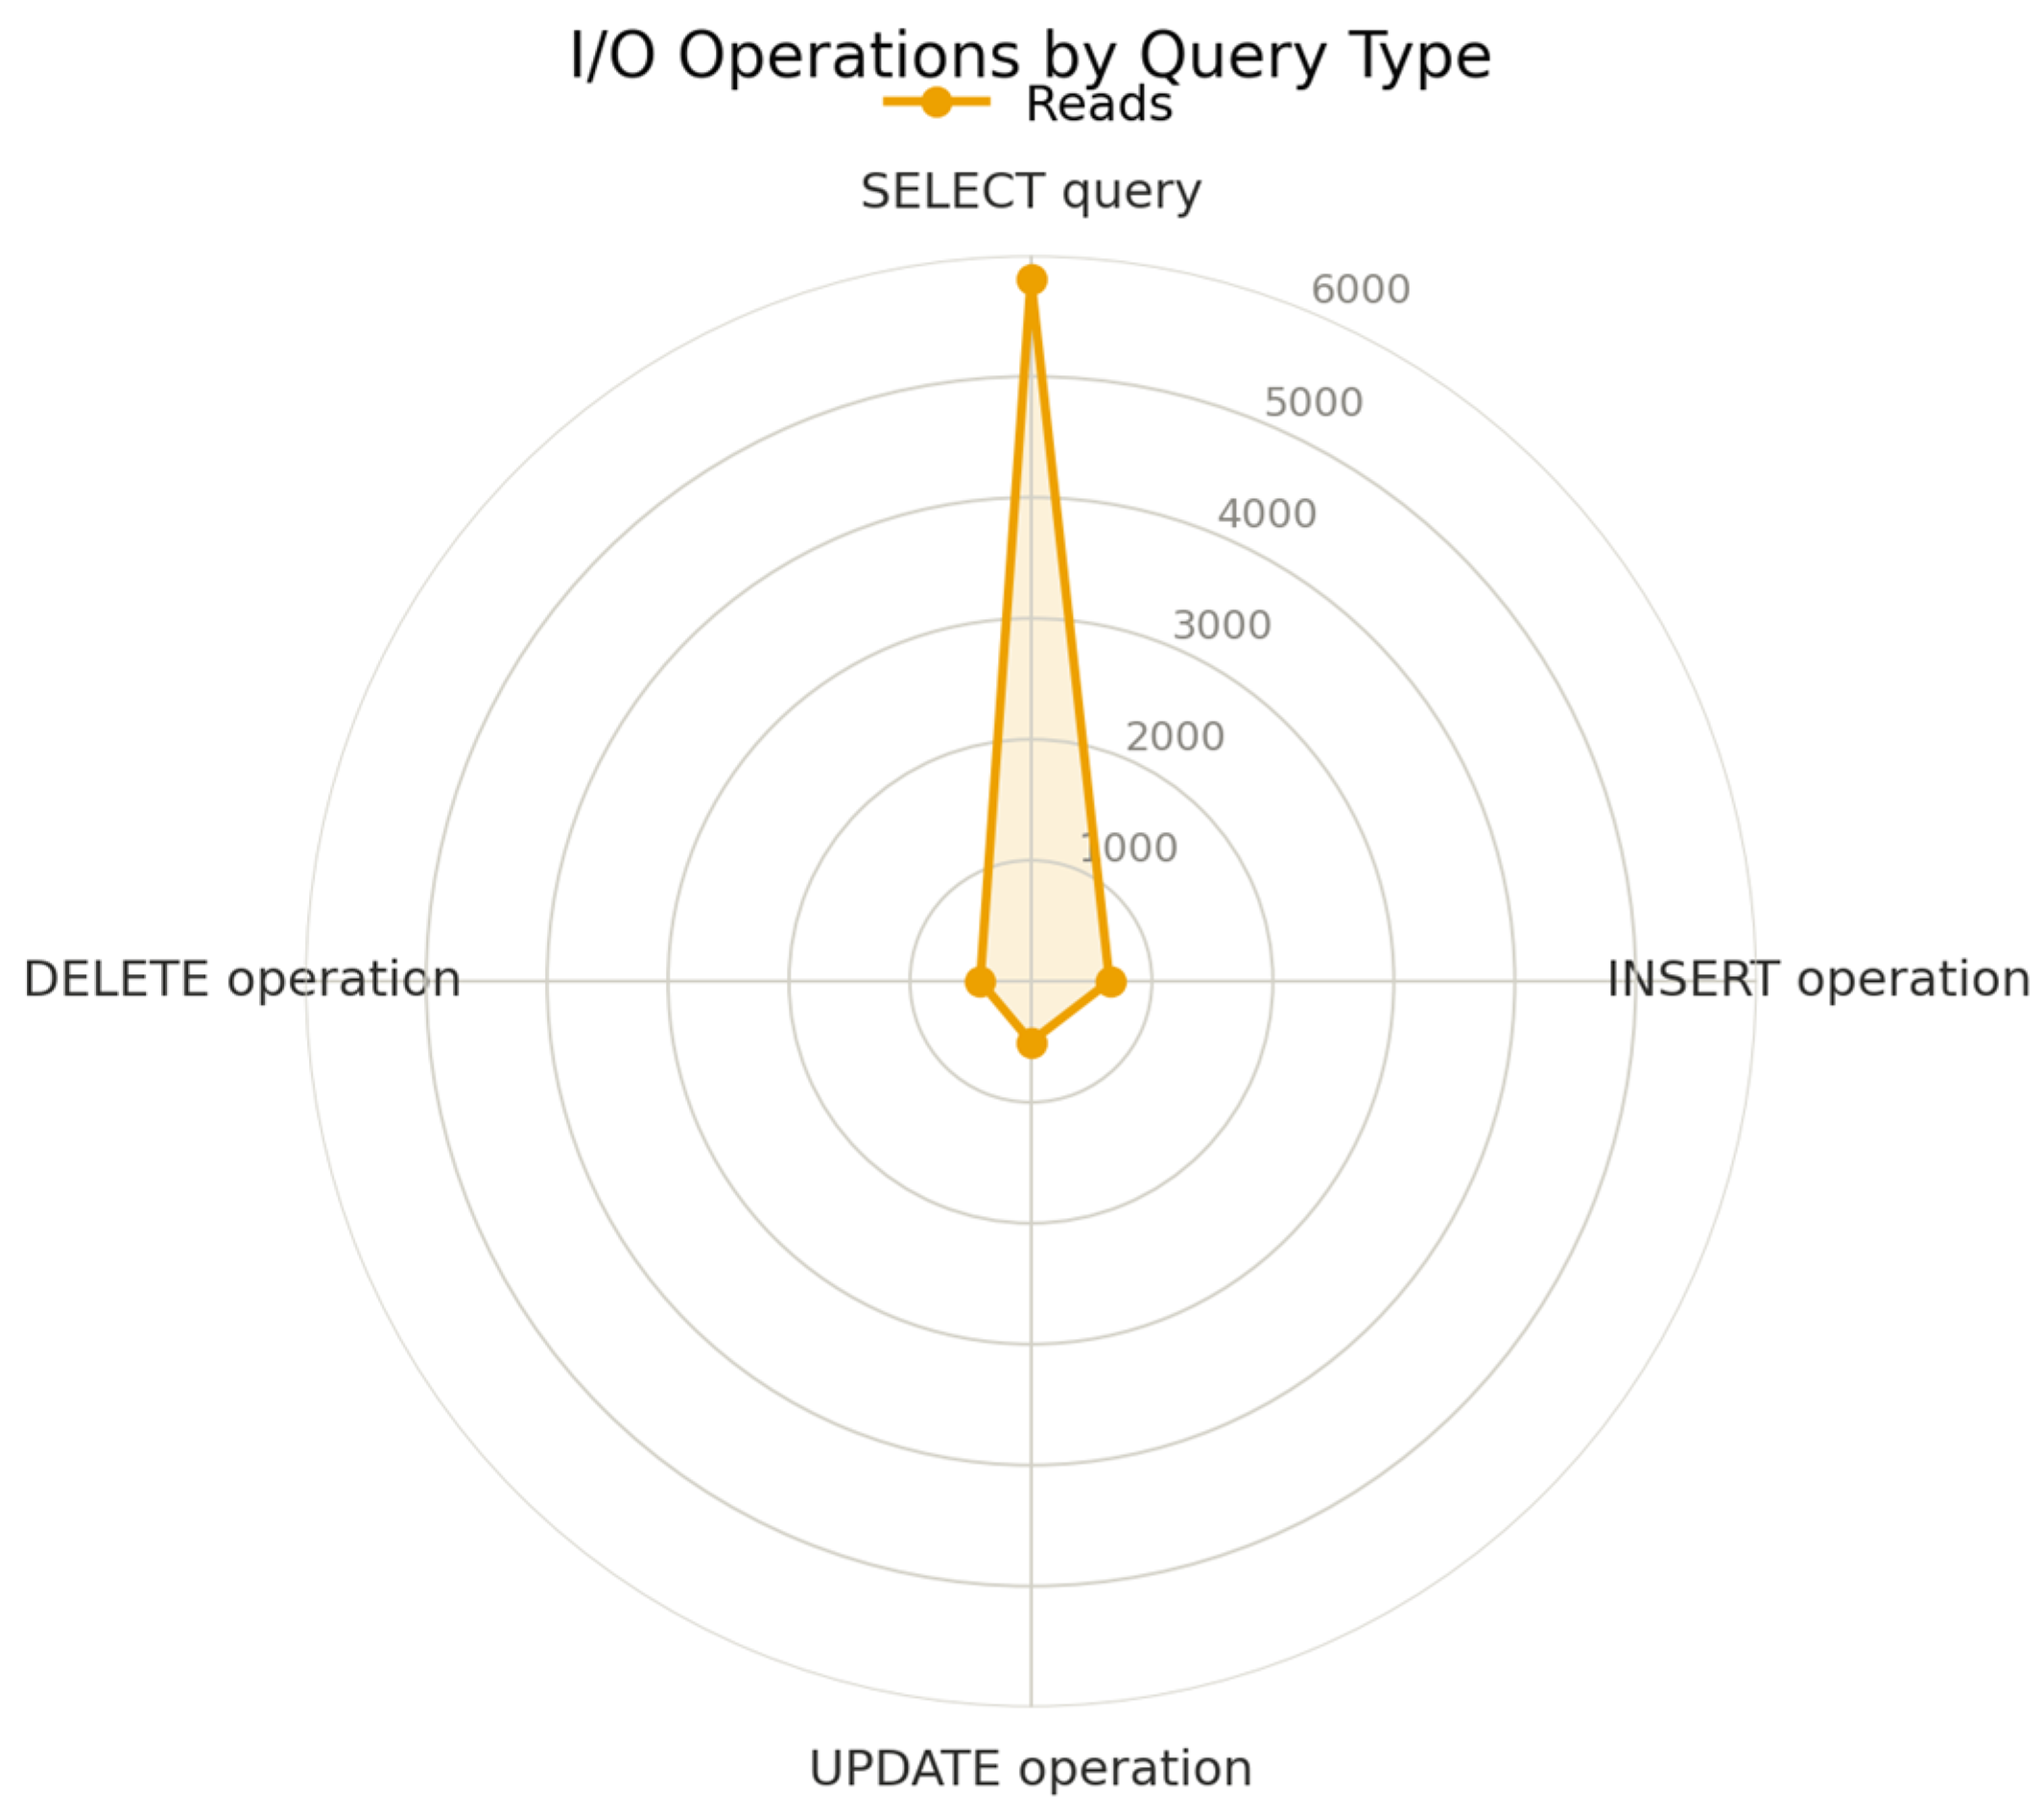
Figure 5 shows the types of queries being run against the database and how many total I/Os were completed as a result of those queries. Overall, it can be observed that SELECT creates the majority of reads (about 5000 to 6000 reads) while INSERT/UPDATE/DELETE generate comparatively little read activity relative to the volume of reads generated by SELECT, since these operations require only a small number of reads to locate the target record before performing the write or delete. Therefore, it appears that SELECT queries perform most of their work as a read-oriented activity in their respective databases. Because of the very low number of writes performed with INSERT/UPDATE/DELETE, both INSERTs and UPDATEs have been impacted negatively (to some degree) by there being a large volume of reads performed on the database every day. In addition, a high volume of read activity suggests that either the index needs to be optimized or the queries associated with those SELECT queries need to be optimized. Thus, performance-tuning opportunities may exist based upon usage trends in this chart.
SELECT queries are typically more read-heavy due to the nature of e-commerce workloads. This is because the two types of SELECT workload—product catalog browsing and transaction history retrieval—involve querying an underlying dataset containing up to 15,000 rows across the products, orders, and inventory tables, while each individual query retrieves a paginated subset of 10 records. Because these queries must join multiple tables to return a single page of results, a SELECT query typically generates many more logical I/O calls than other operation types. By contrast, INSERT/UPDATE/DELETE statements usually contain few reads (to find the record(s) to update/delete) because these types of operations tend to focus on a small number of records (i.e., one at a time). The high volume of reads also indicates potential for improved performance through the use of optimization techniques such as covering indexes or result caching in both environments.
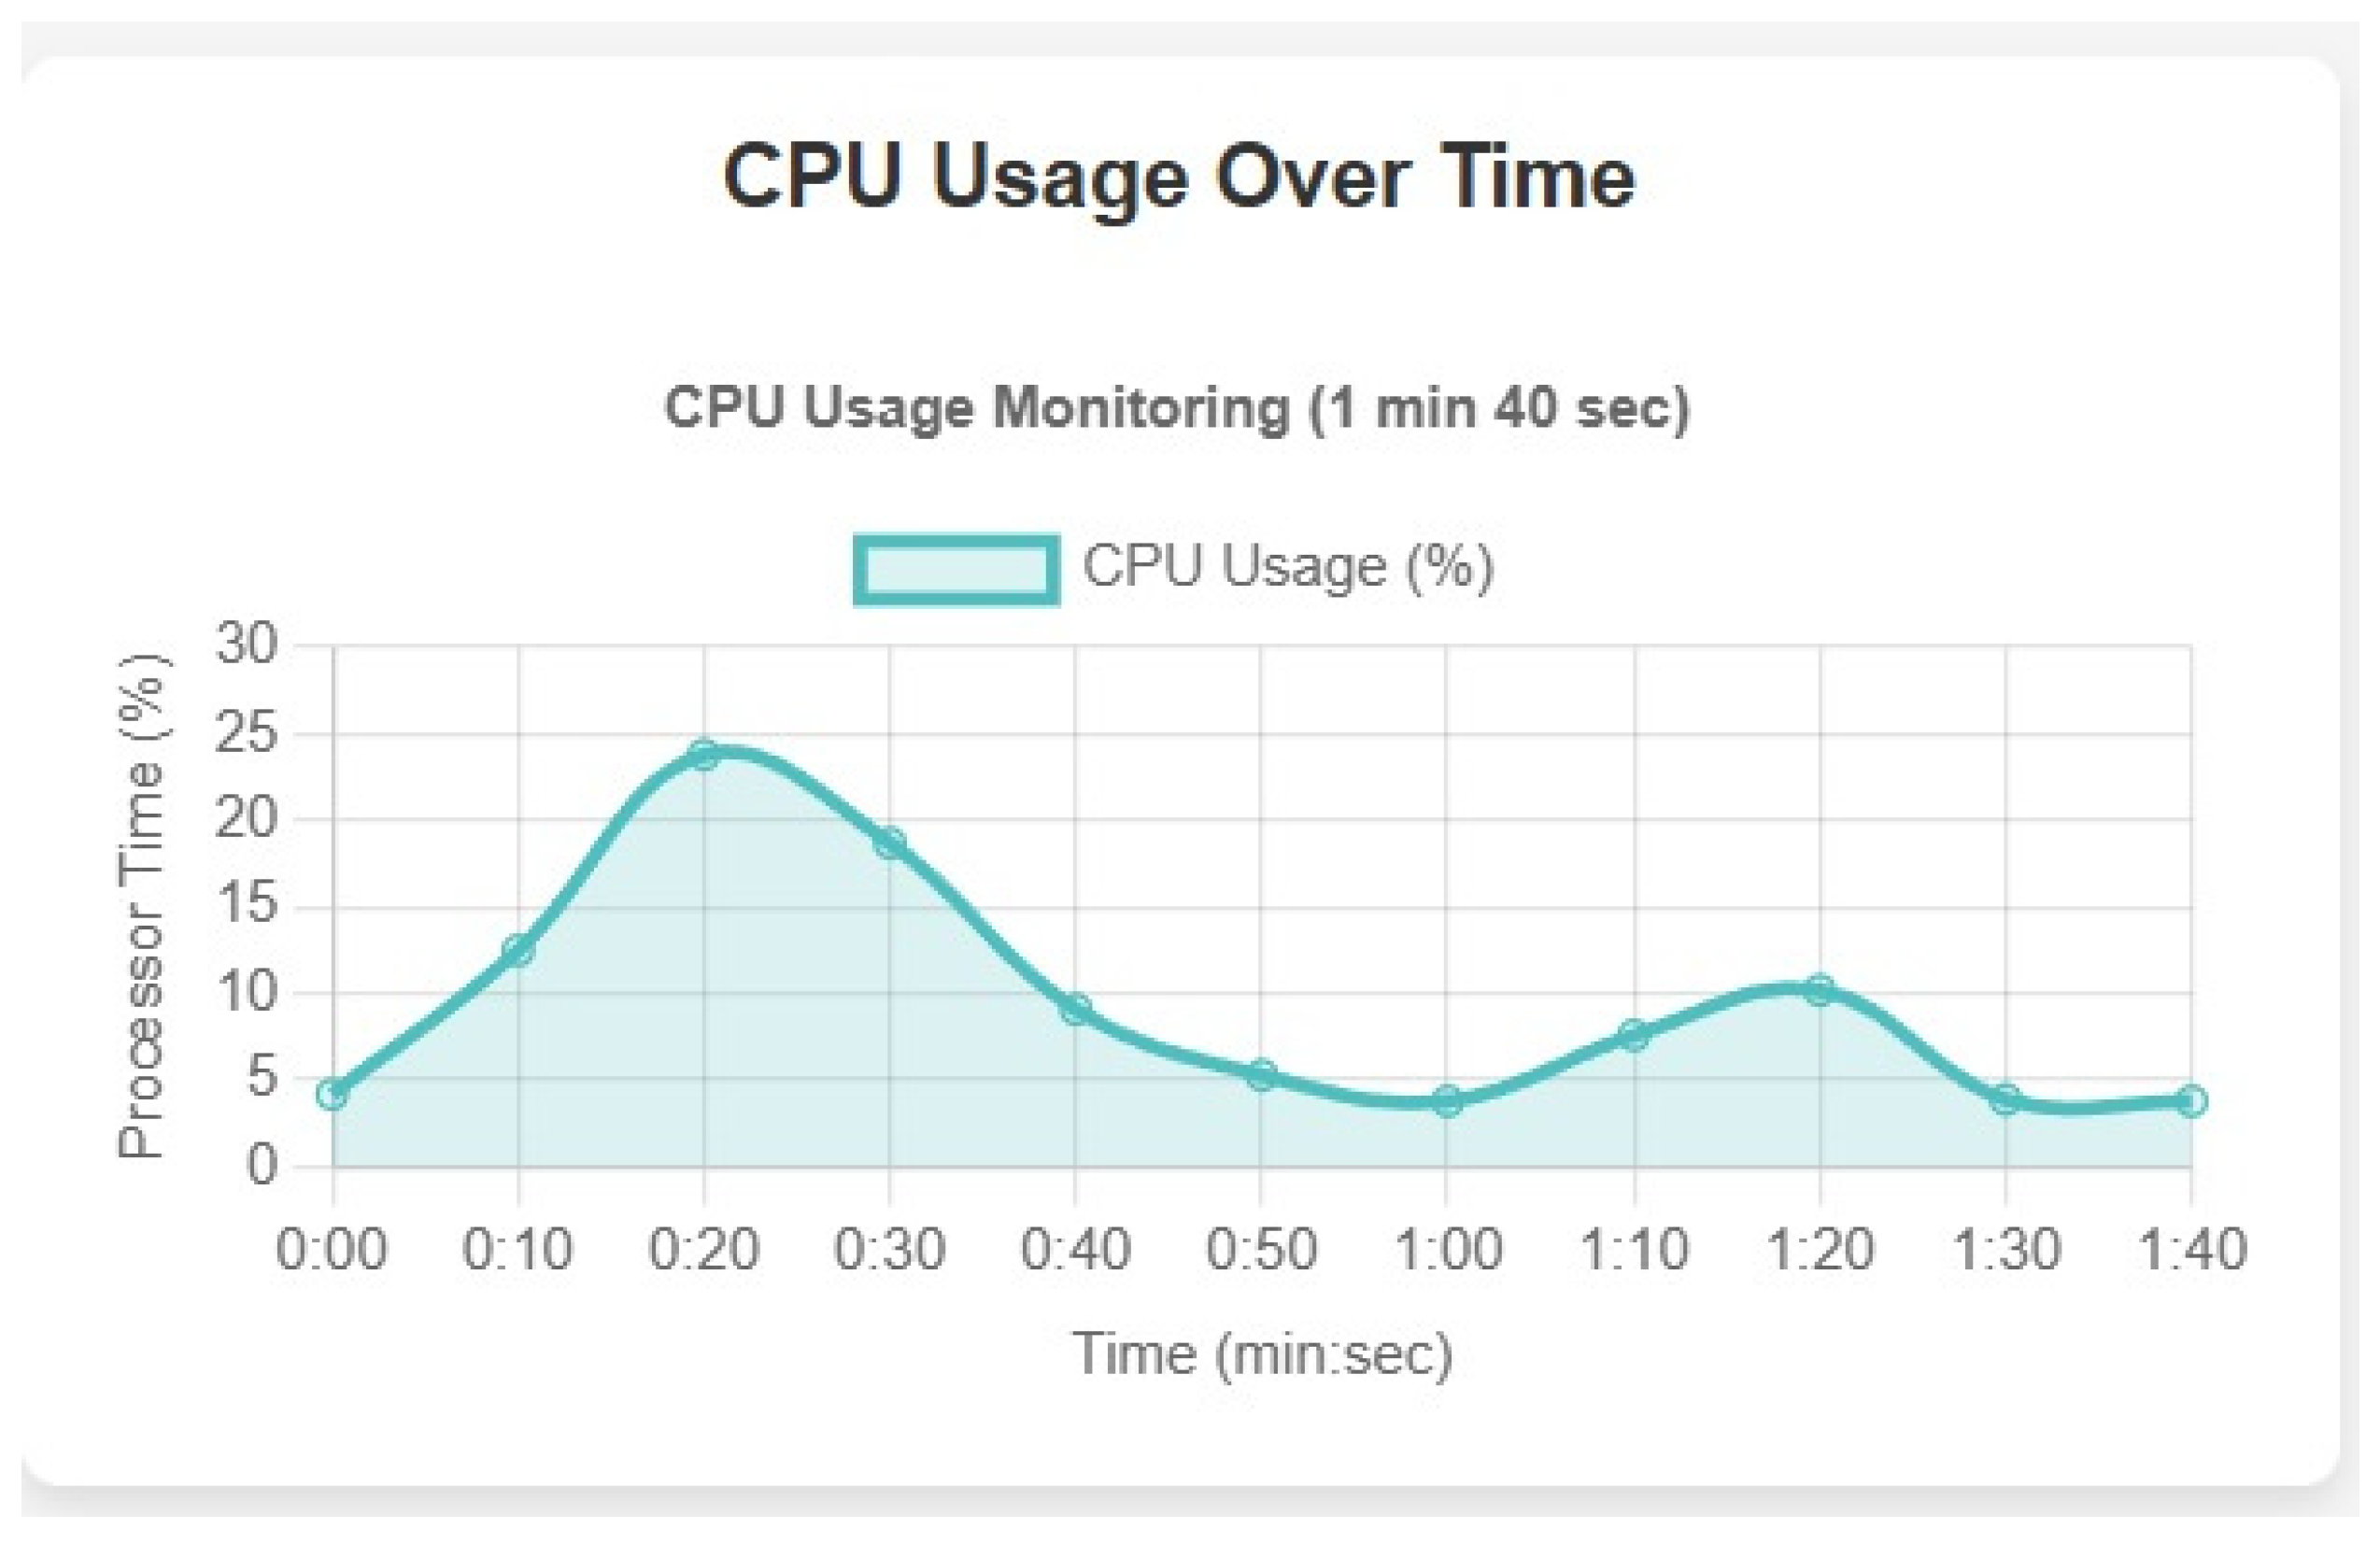
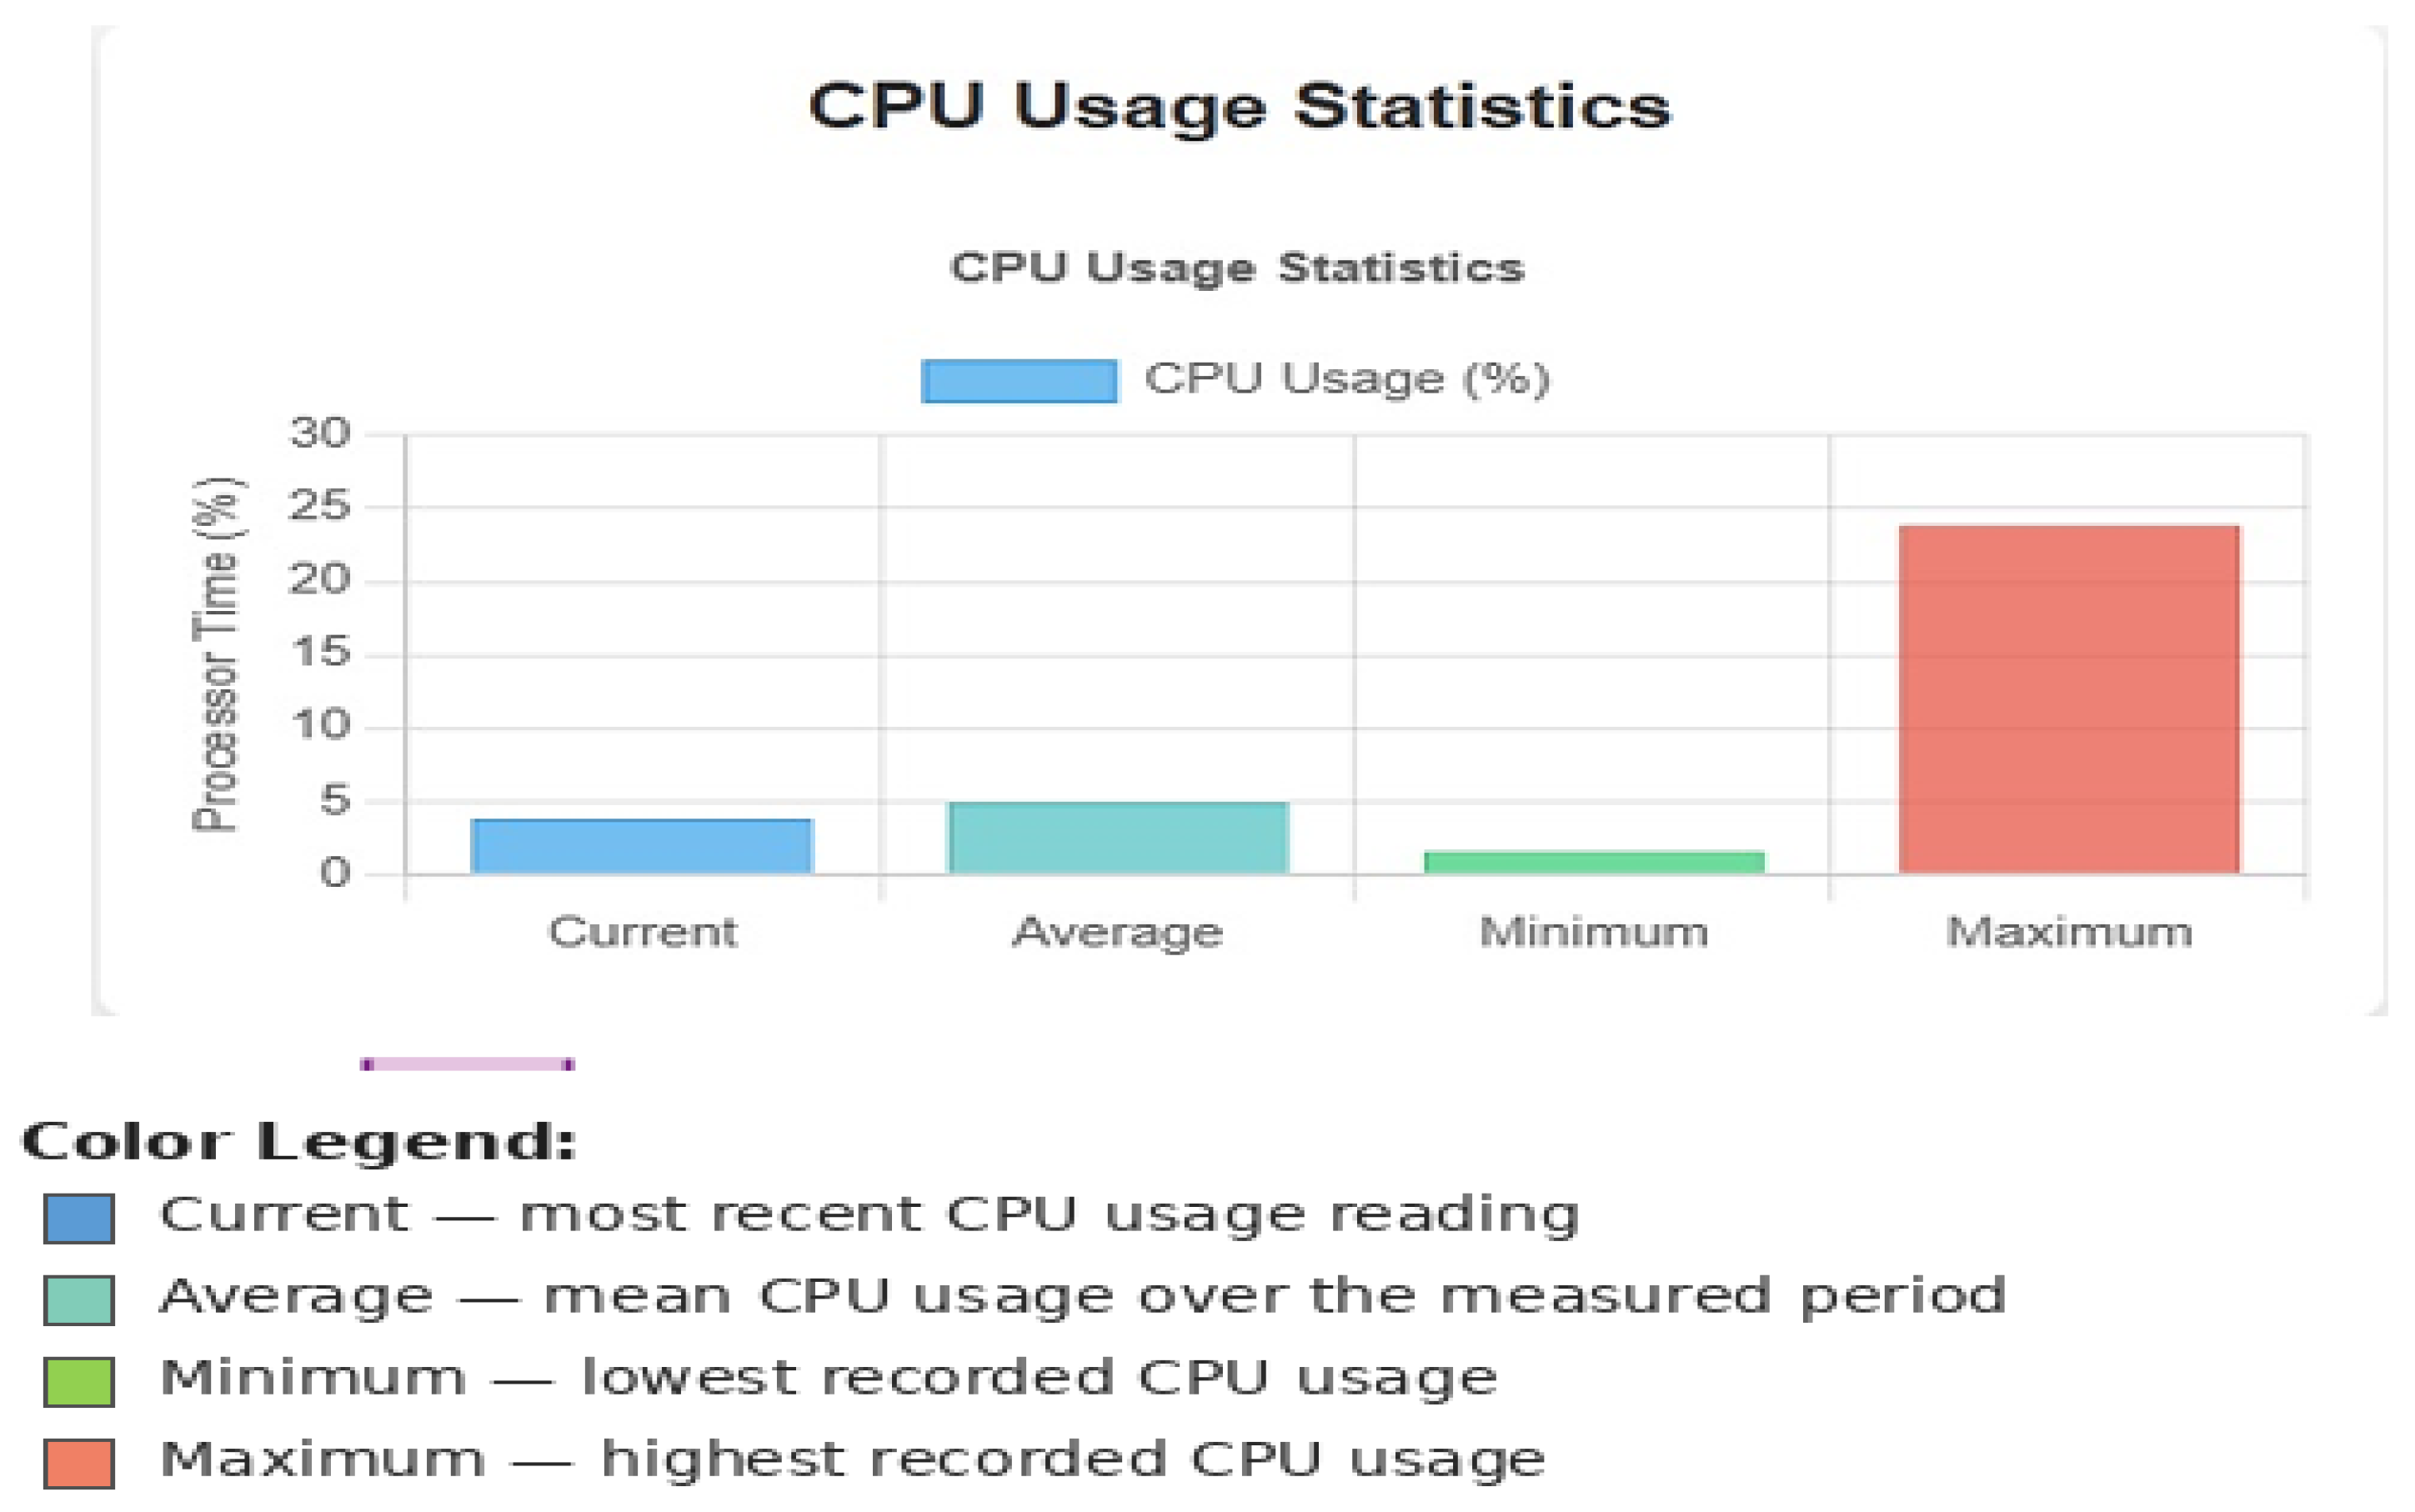
Figure 6 below depicts the CPU utilization of the system at the time the monitor was stopped. The y-axis shows the percentage of processor time being used (0–100%). The data below the graph represents actual CPU usage, with the last CPU usage recorded at 3.828% and the average CPU usage throughout the monitoring session being 4.948%. The lowest recorded usage was 1.540%, and the highest was 23.868%. In the preceding paragraph, the information in the table below will assist you in measuring the overall performance of a given server and in identifying potential bottlenecks over the course of the period being measured. As such, it will allow you to conduct an assessment of CPU utilization versus the true capabilities of a server and determine whether or not the server has been adequately utilized without placing excessive demand on the CPU.
In the on-premise environment, three interrelated factors account for the low average CPU usage of 4.9%. First, the single-node architecture results in all concurrent queries being processed through one physical scheduler, thereby serializing execution threads, instead of distributing concurrent queries over separate compute units. Second, for the purposes of performance testing, the Database Engine’s memory was set to 12 GB. This allows enough memory to run the Windows 11 operating system and the ASP.NET Core web API application in addition to the database during performance testing. Consequently, when there are 50 concurrent SELECT operations using multi-table joins on products, orders, and inventory, the working set will often exceed what can be kept in memory, causing the need for physical reads from a disk (SATA SSD) instead of fetching them from memory. Third, due to the significantly lower sequential read speed of SATA SSDs (~500 MB/s) compared to the managed Premium SSDs in Azure, the performance of the SATA SSD is limited by I/O wait time, rather than the availability to perform CPU processing. As such, the average CPU utilization will be less than the actual utilization because of the manner in which the I/O wait time is responsible for latency and the CPU process time is not, especially during times of high query load.
The resulting low average CPU utilization of 4.9% in on-premise environments reflects the constraint of the single hardware architecture configuration as a single server with one query scheduler that processes concurrent queries sequentially through the number of available CPU cores with fixed capacity. The isolated spike of 23.9% was the result of periods of higher-than-normal concurrency for the SELECT operations that involved multiple tables being joined together and, therefore, temporarily saturated on-premise using their on-premise CPU’s capacity. Unlike cloud computing environments, which can elastically scale their computing resources based on workload requests, the on-premise CPU has the limits of its four cores, and using those four cores, often to support multiple high-concurrency workloads, will create even higher sustained peaks and a higher duration of sustained CPU peaks, therefore creating the overall fundamental limit of scalability with fixed-hardware deployments.
As shown in
Figure 7, the distribution of CPU utilization across the on-premise test session reveals that there is a significant difference between the average and peak CPU utilization (4.9% vs. 23.9%) due to the way fixed-hardware deployments are created to support variable e-commerce workloads. During time periods when there are few requests and user concurrency rates are low, the physical processors handle incoming requests with limited contention since there is no queuing of threads. When user concurrency approaches 50 concurrent users and multi-table SELECT joins are being executed, all threads contend for the same four physical processors and for shared buffer pool resources all at once, thus causing saturation of the CPU and resulting in an increase to 23.9%. This behaviour has implications that must be considered when planning for capacity; provisioning on-premise hardware using an average usage level (4.9%) results in significant performance impact during times of high demand, such as promotional events or heavy seasonal traffic, due to the inability of the hardware to scale beyond its physical constraints. In contrast, as shown in
Section 5.2, using Azure’s elastic computing model allows for the management of equivalent demand surges by spreading the load across additional virtual processors, therefore avoiding saturation of physical processors and their associated limitations.
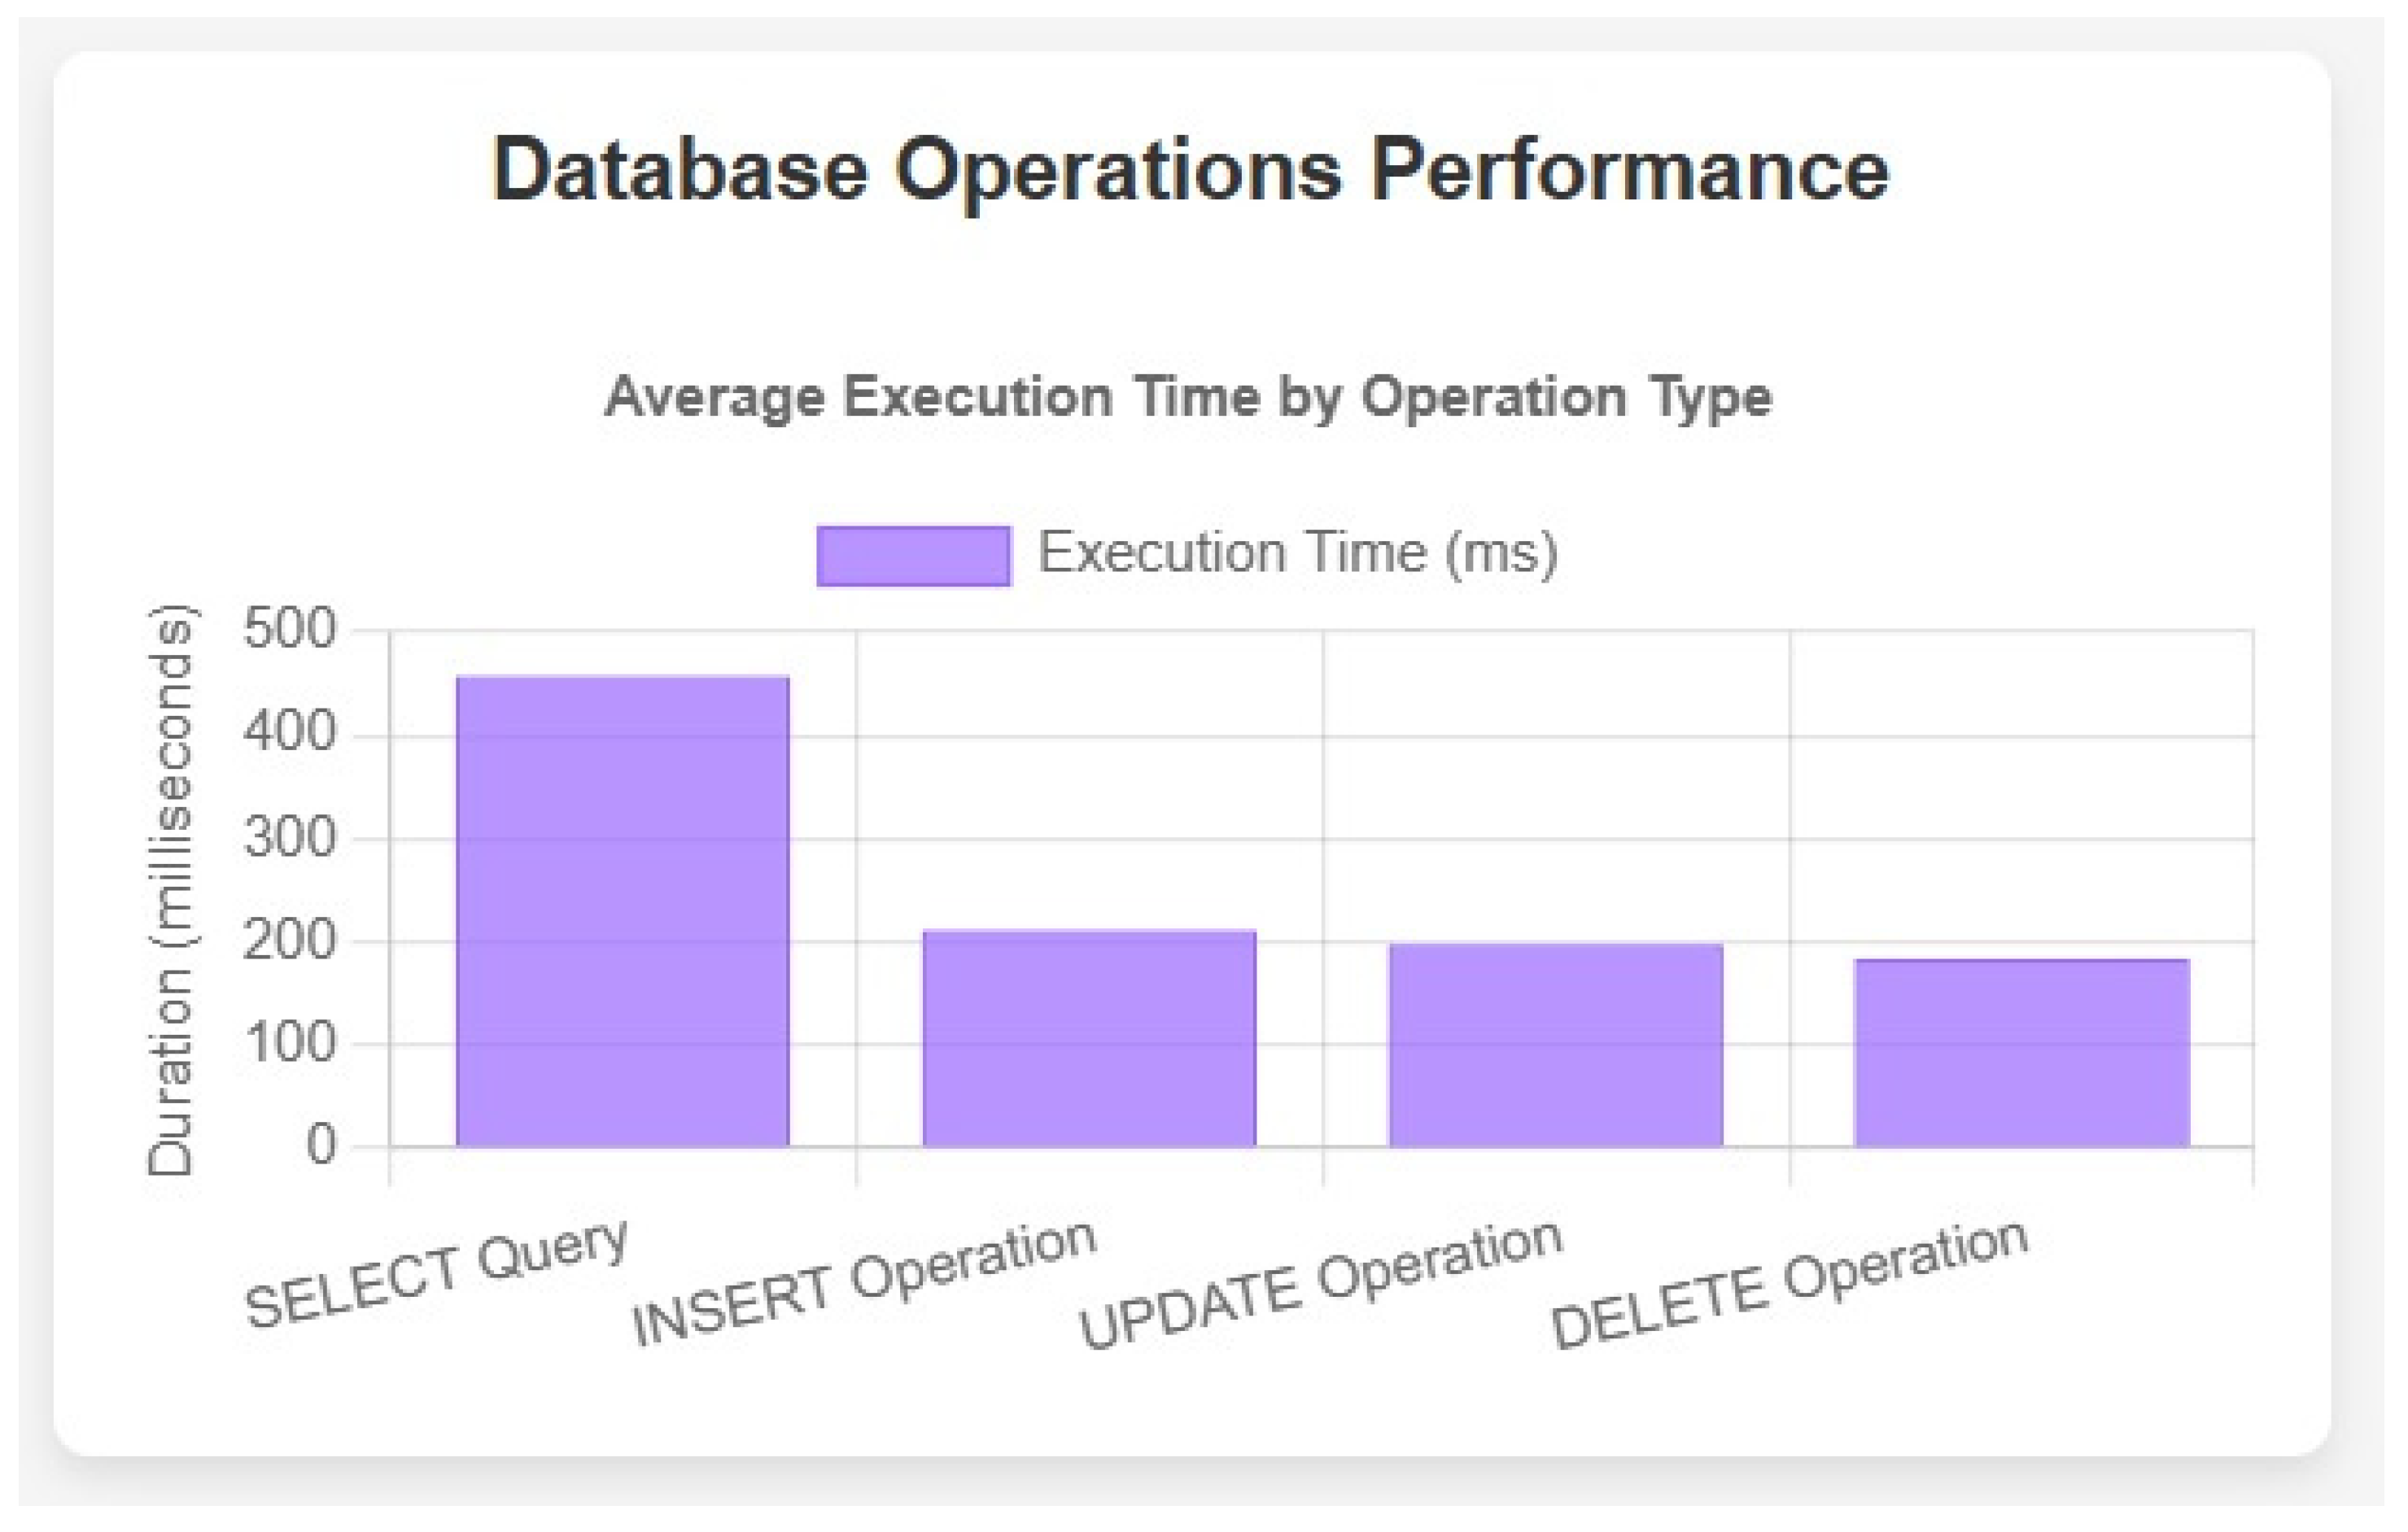
The performance metrics for four types of simple SQL operations carried out on the on-premise database system are shown in
Figure 8 with respect to both execution duration and mode (average duration in milliseconds (ms)). From that information, the bar chart for SELECT, INSERT, UPDATE, and DELETE operations allows us to determine the degree of computation required to complete each operation.
Figure 8 reveals a pronounced execution time hierarchy across CRUD operations in the on-premise environment: SELECT (452.3 ms), INSERT (207.8 ms), UPDATE (196.5 ms), and DELETE (176.2 ms). This hierarchy is not arbitrary but reflects the distinct I/O and locking mechanics of each operation type under fixed-hardware constraints. SELECT operations incur the highest cost because the e-commerce schema requires multi-table joins spanning products, categories, orders, users, and inventory simultaneously, generating large intermediate result sets that must be sorted and filtered entirely in the on-premise buffer pool before results are returned. Under 50 concurrent users, this creates a compounding effect: each concurrent SELECT competes for the same physical CPU cores and the same 12 GB buffer pool, introducing queuing latency that does not exist in environments with elastic compute scaling. The ordering of write operations (INSERT > UPDATE > DELETE) reflects each operation’s index maintenance burden: INSERT must locate insertion points in both clustered and non-clustered indexes and write new data pages; UPDATE reads and modifies existing records plus updates affected index entries; DELETE merely marks records as deleted and adjusts index pointers without generating new data pages. Critically, these differences are expected to amplify under higher concurrency because index contention and lock management overhead—both of which scale with the number of concurrent write threads—disproportionately affect INSERT operations on hardware with a fixed number of lock manager resources.
5.1. Deploying an E-Commerce Platform to Azure Cloud and Connecting with Azure SQL
The e-commerce solution can be deployed on Azure for a scalable and reliable computing environment, which has seamless integration with Azure services, including the Azure SQL Database. With the Azure App Service, the solution can be deployed and utilized anywhere in the world while the back-end performance of the solution is continuously monitored, ensuring continued operational efficiency. The Azure SQL Database was configured based upon the vCore purchasing model using the General Purpose service tier. The database used 4 vCores with 20.4 GB of managed memory and 64 GB of storage, consistent with the Azure General Purpose service tier specification, in order to run the experimental workload. This configuration guaranteed stable performance during multiple concurrent transactions performed by users of the solution. In this case, the database was utilized as the sole location for all platform data, i.e., products, users, and transactions [
33].
To model an experimental e-commerce workload for testing the performance of the SQL data warehouse described above, 50 users generated simultaneous access to common e-commerce transactions during the workload-testing phase (e.g., SELECTs, INSERTs, UPDATEs, DELETEs) using a dataset that contained 5000 records (each representing an item for sale) and 10,000 records (each representing a transaction). The workload being tested more closely represented actual e-commerce workloads and provided an opportunity to measure system response time, throughput, and latency under a variety of workloads The statistical performance results for the on-premise database are summarized in
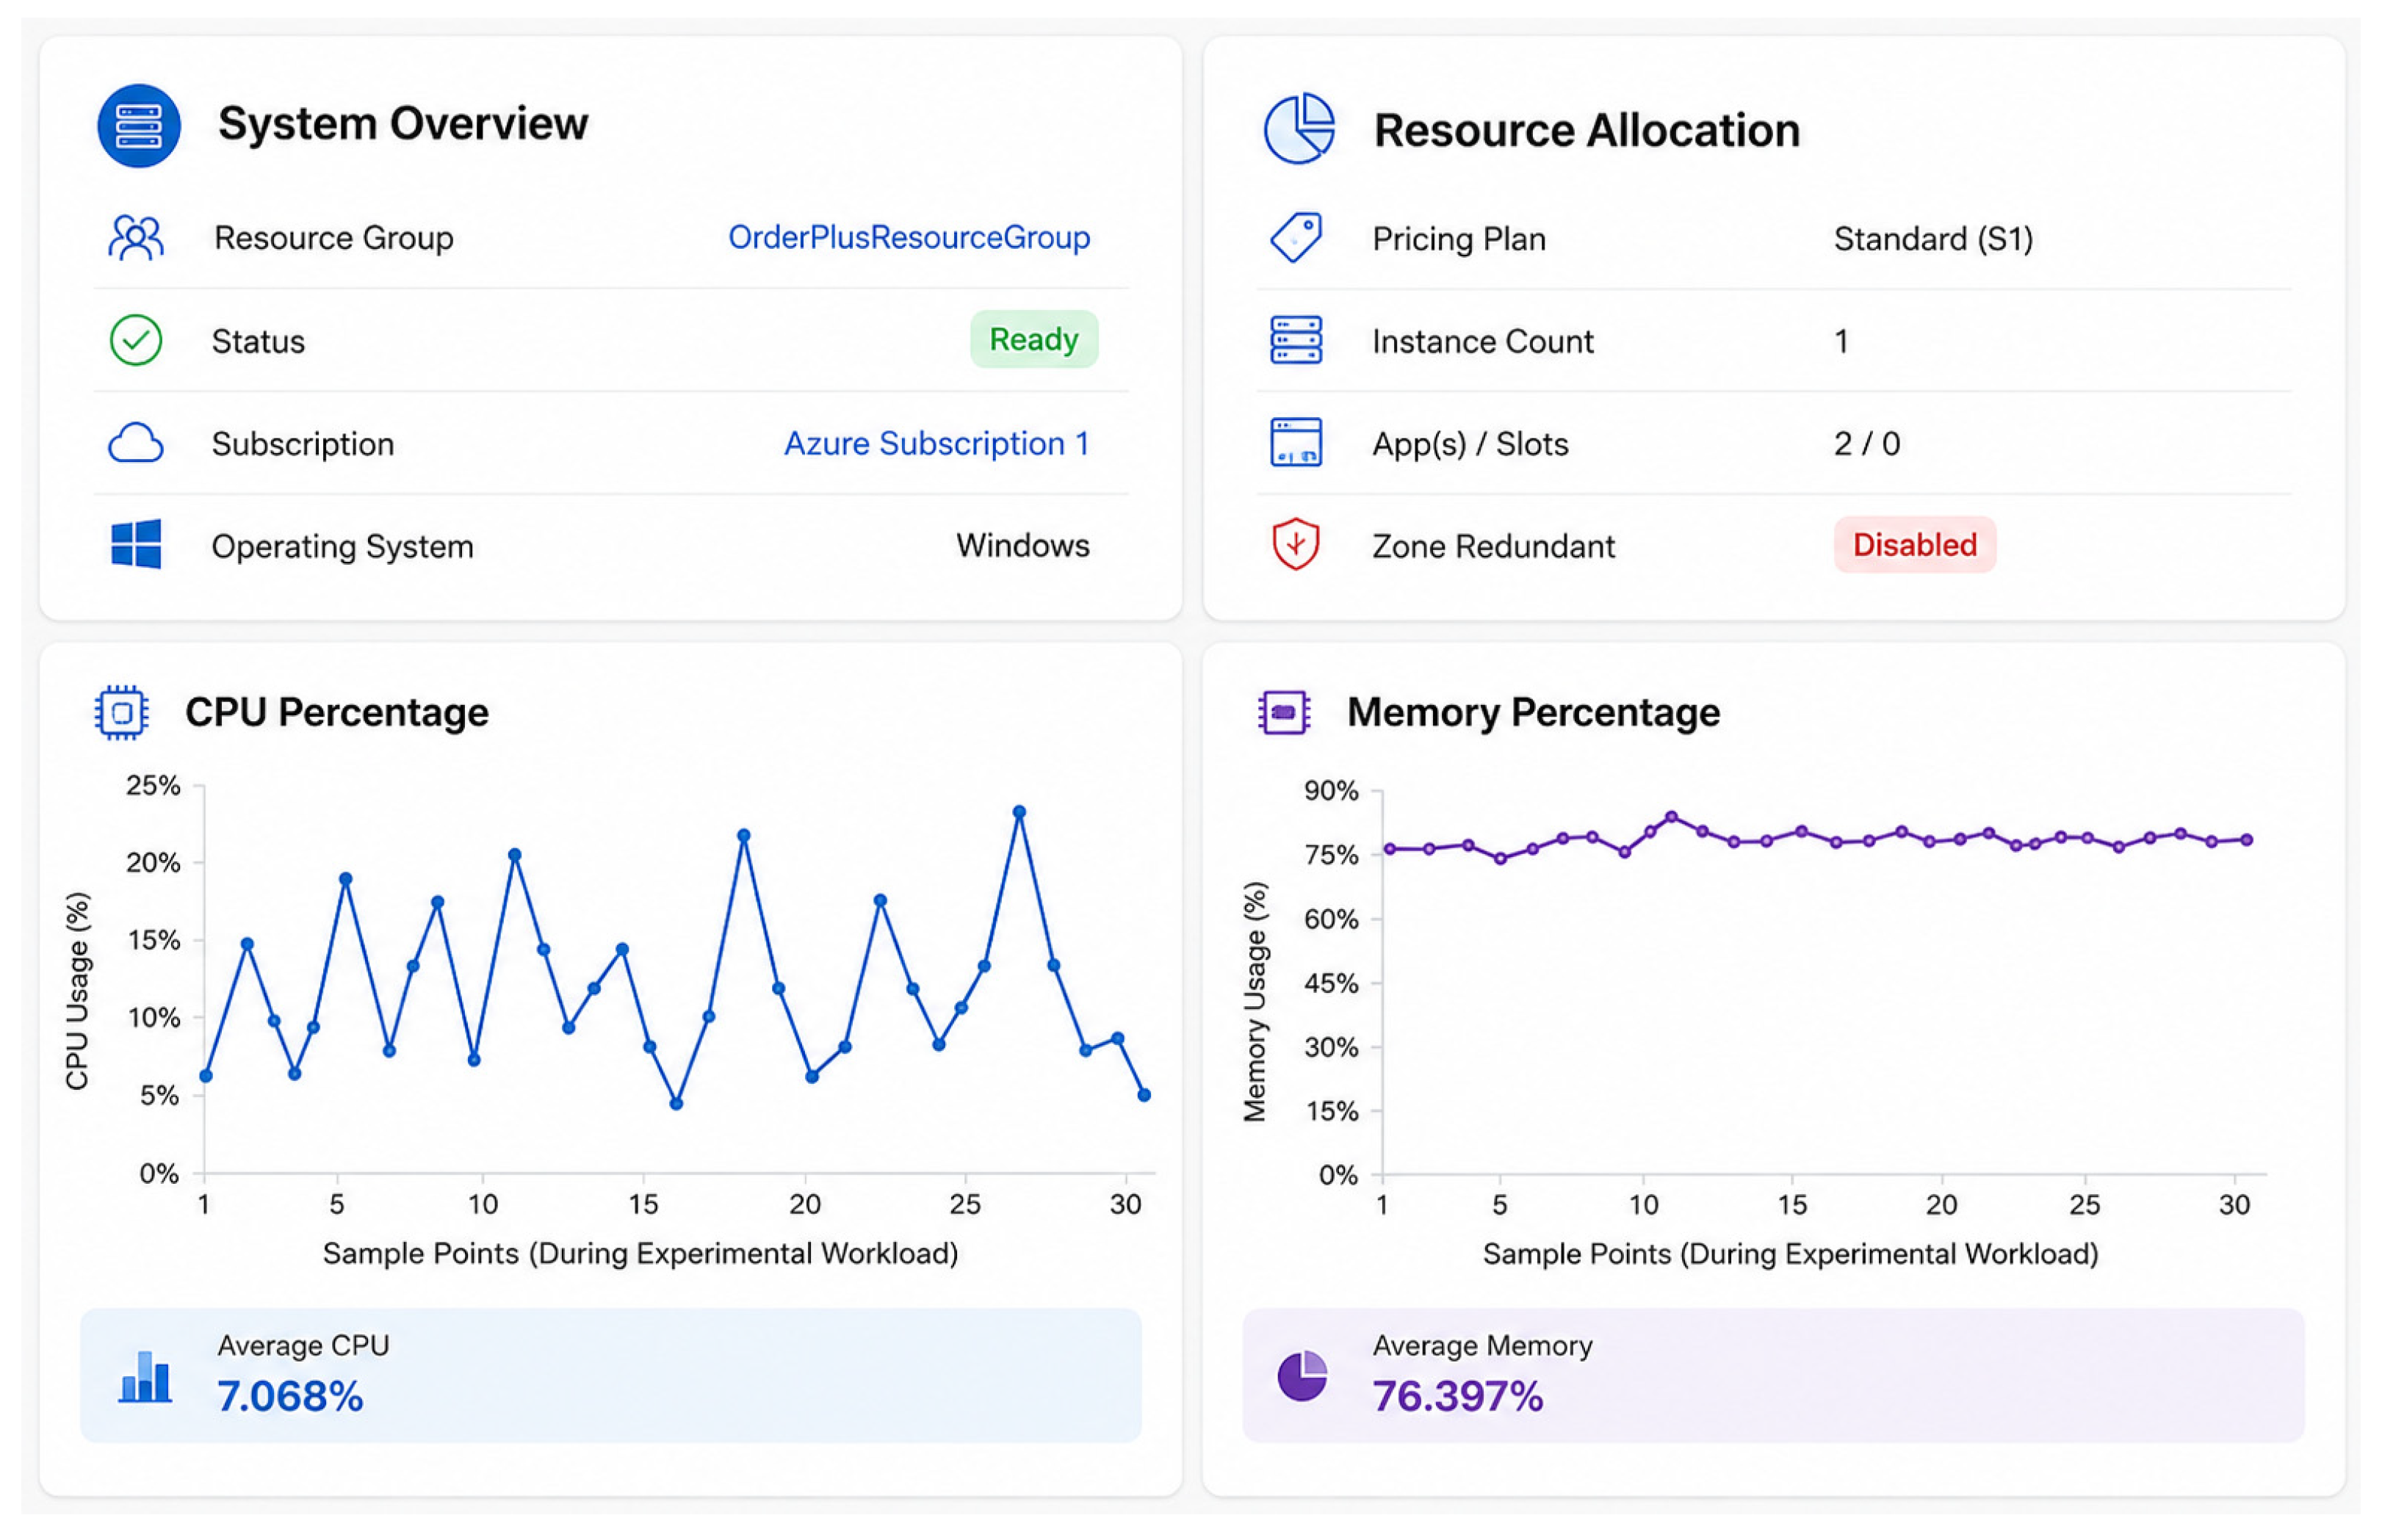
Table 5. The Azure App Service monitoring dashboard provided continuous visibility into the performance of the back end with respect to various KPIs (e.g., CPU load, memory used, resource load; see
Figure 9). Note that
Figure 9 reports the CPU utilization of the App Service hosting layer (application tier), which is distinct from the database-engine-level CPU utilization of 20.4% reported in
Table 6 for Azure SQL Database itself. These two metrics measure different components of the architecture and are not directly comparable. In addition to allowing developers to find bottlenecks, monitoring these KPIs also allowed them to observe how the system scaled to support an increasing number of users and to ensure a consistent level of service.
To ensure statistically valid results, 30 (
n = 30) repeated trials of each query and/or database operation type were used to determine a mean execution time, standard deviation, 95% confidence interval, and coefficient of variation for each of the four kinds of operations (see
Table 3). Because the 30 trials per operation type were collected as repeated measurements within the same experimental environment rather than as independent samples, a one-way repeated-measures ANOVA was used to compare execution times across the four CRUD operation types, rather than a between-subjects one-way ANOVA. Prior to the analysis, the assumption of sphericity was assessed using Mauchly’s test, which indicated a significant violation of sphericity, W = 0.24, χ
2(9) = 39.09,
p < 0.001. Accordingly, a Greenhouse–Geisser correction (ε = 0.72) was applied to adjust the degrees of freedom for the ANOVA result reported below. Normality of the within-condition distributions was assessed using the Shapiro–Wilk test; results were consistent with normality for SELECT (W = 0.97,
p = 0.61), UPDATE (W = 0.97,
p = 0.51), and DELETE (W = 0.98,
p = 0.67), while the INSERT distribution showed a mild departure from normality (W = 0.92,
p = 0.024). Given the relative robustness of repeated-measures ANOVA to moderate normality violations at this sample size (
n = 30), the parametric analysis was retained. The Greenhouse–Geisser-corrected repeated-measures ANOVA produced F(2.14, 62.19) = 991.73,
p < 0.001, and partial η
2 = 0.97, indicating a very large effect of operation type on execution time. Bonferroni-corrected pairwise post hoc comparisons (α = 0.0083, six comparisons) showed that SELECT execution time was significantly longer than INSERT, UPDATE, and DELETE (all
p < 0.001), DELETE was significantly faster than both INSERT and UPDATE (both
p < 0.001), while the difference between INSERT and UPDATE did not reach significance after correction (
p = 0.062), consistent with the more read-intensive nature of SELECT operations relative to the other CRUD operations. Each operation type (
n = 30) reflects repeated trials collected within a single test session, as described in
Section 4. Although
Figure 6 depicts a representative CPU monitoring session, CPU utilization (maximum and average) was recorded during each of the 30 repetitions of the experiment. Therefore, the mean and standard deviation reported were computed based upon all repeated data rather than based upon the results of a single monitoring session.
The average coefficient of variation (CV) across all operations ranged between 8.5% and 8.8%, indicating a moderate level of variability consistent with system-level performance testing in distributed database environments. This shows that the data from all test runs were quite uniform. There was also enough measurement error associated with each set of measurement amounts based on the measurement method(s) used in testing. Finally, all individual experiment setups and metrics conducted during testing have all produced 100% reproducibility when other people carry out performance testing with Azure SQL Database products.
5.2. Performance Analysis of Azure SQL Database
The data displayed in Figures 11–15 represent example monitoring information obtained by using Azure-based tools throughout a long development and evaluation phase, and also augment (but do not overlap) the statistical data obtained during the 30 completed tests reported in
Table 5,
Table 6 and
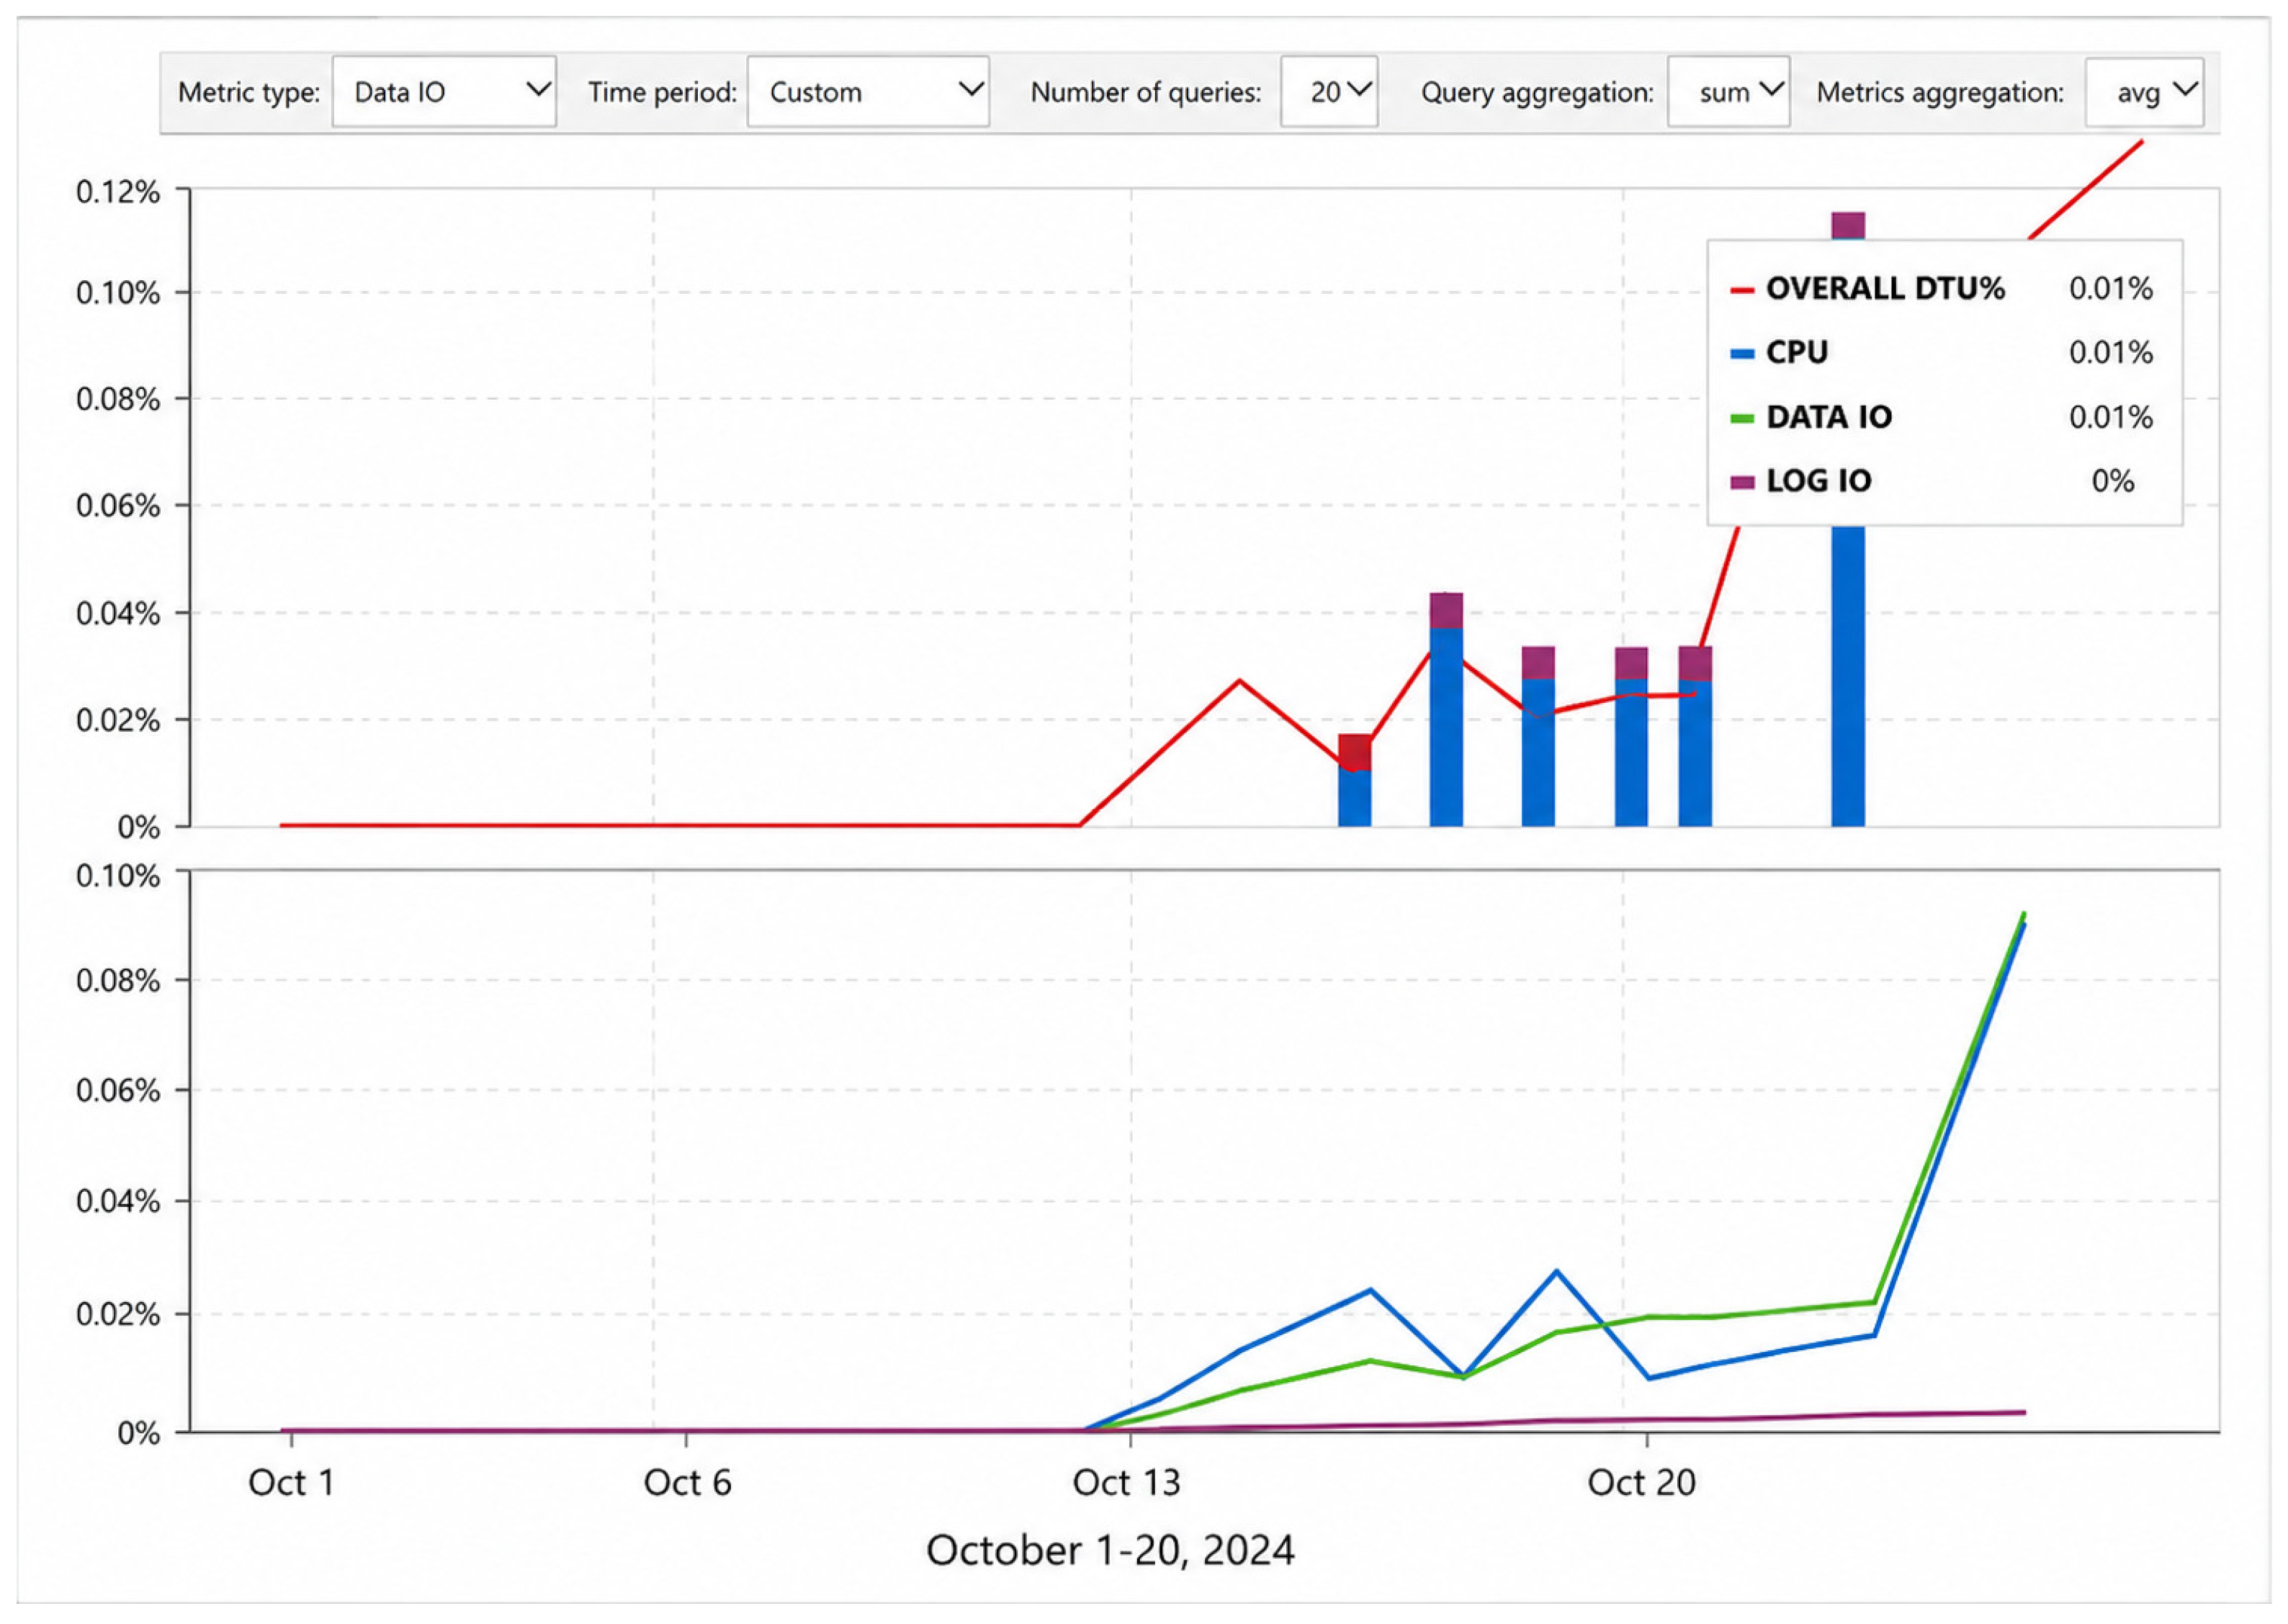
Table 7. Azure SQL Database offers a full set of tools that allow a user to observe the performance of queries and potentially identify bottlenecks in their applications. In this manner, a user can improve the effectiveness of database operations by analyzing main metrics such as data I/O, log I/O, and DTU utilization. Moreover, Azure provides metrics on successful connections and query execution—SELECT, INSERT, UPDATE, and DELETE—that will give a complete understanding of system performance. These tools help developers test the efficacy and performance of their applications [
34].
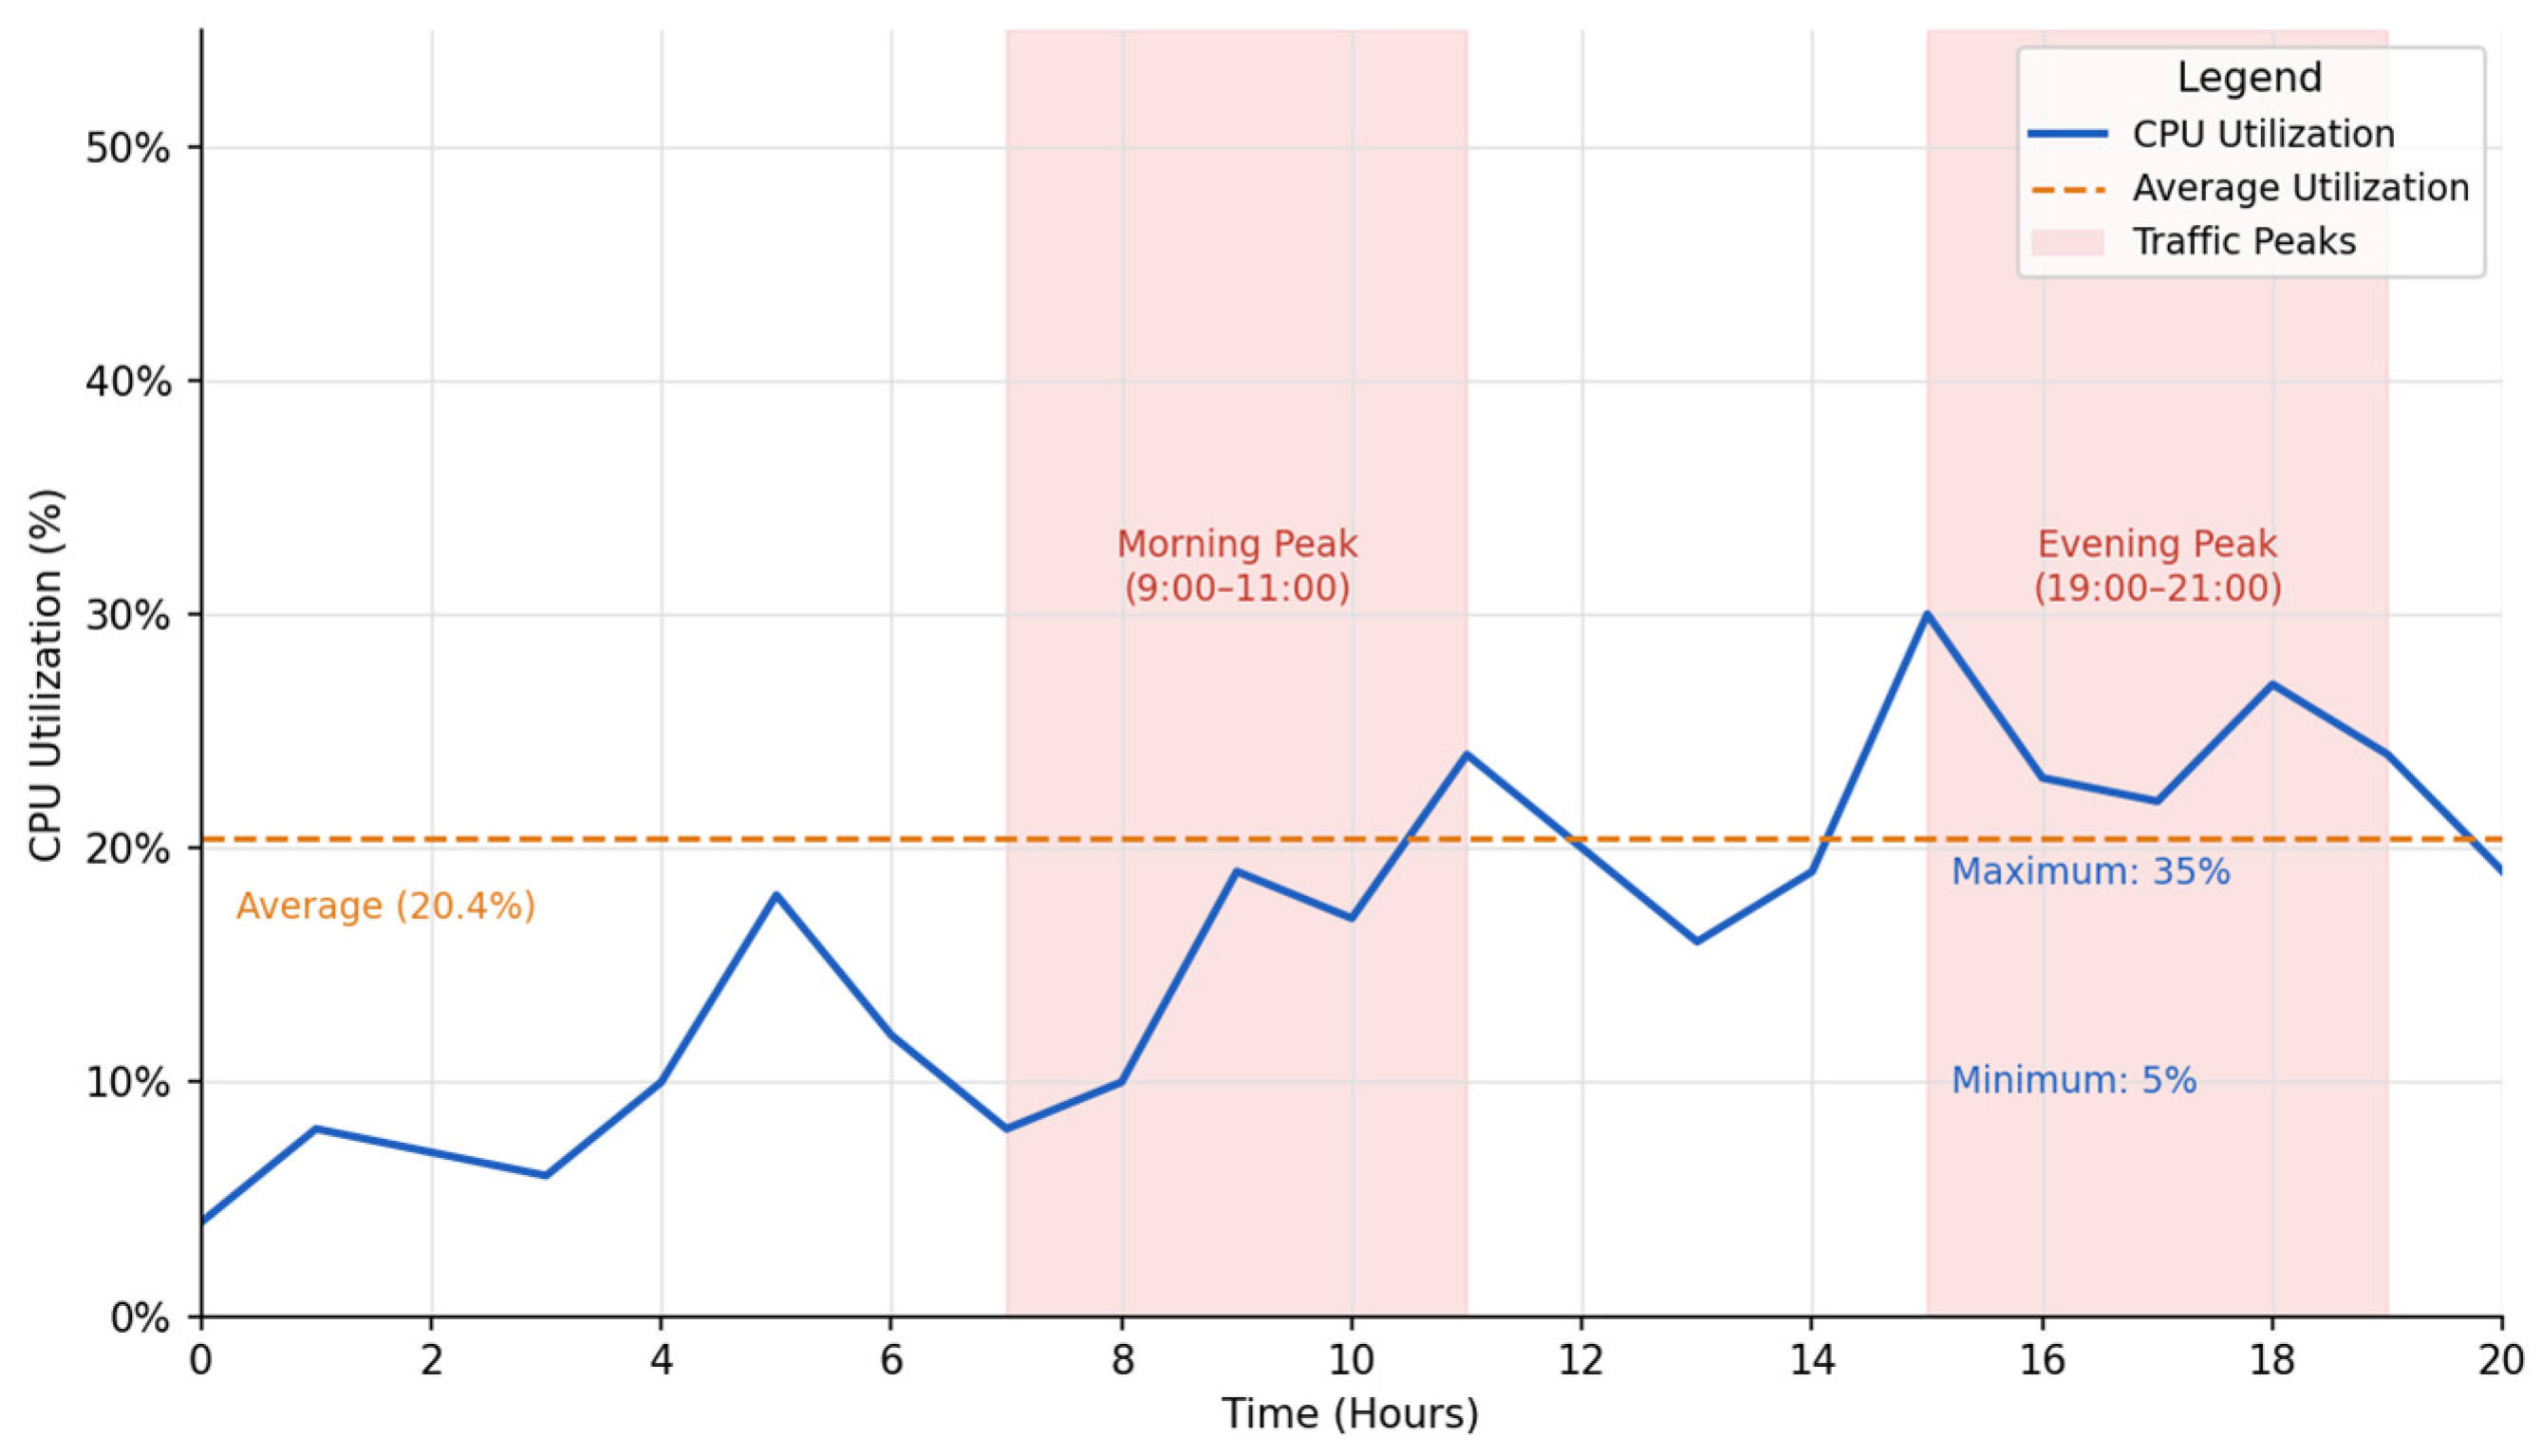
Understanding performance and responsiveness of services in cloud-based systems through measurement: The ability to measure performance metrics of services in cloud-based systems is critical to understanding performance and response time, especially when high-volume data transactions are executed in real time. For e-commerce platforms deployed on a cloud-based infrastructure, it is important to assess how well the system can handle workload capacity in varying situations when using the Microsoft Azure SQL Database. The three primary performance indicators assessed in this study are: CPU efficiency, data I/O operations, and task execution time. We will gain an enhanced perspective regarding how the system is configured to support large volumes of near-real-time transactions, as well as provide a speedy user experience when the aforementioned indicators are evaluated using a hosted e-commerce solution hosted on Microsoft Azure. As stated previously, CPU performance is the key measure by which the processor is assessed in terms of its ability to support the processing and execution of queries within the Azure SQL Database. For an e-commerce website that executes hundreds of queries in conjunction with other types of operations like inventory updates, customer searches, transaction processing, etc., effective CPU performance will dictate how quickly these operations are completed (see
Figure 10). The following figure illustrates a comprehensive assessment of the CPU performance of the Azure SQL Database. According to the graph plotted above, CPU utilization has varied between 5% and 35%, with extreme highs during peak traffic utilization. These are directly related to high demand on the e-commerce website, which would be reasonable given that user activity or engagement translates to resource consumption.
One main factor that drives this behaviour is the Azure Elastic Resource Allocation model, which provides a mechanism to dynamically adjust the scale of a CPU resource to support the overall demand for concurrent queries. While traditional on-premise systems have a fixed hardware capacity, the Azure General Purpose tier can provision additional compute resources on demand based on the query concurrency levels, thus explaining the higher average CPU utilization (20.4%) and the increased variability (CV = 28.4%) experienced from the cloud measurements. Peaks in the cloud measurements occur during periods of high SELECT query concurrency and trigger the built-in query execution plans in the Azure query store to be executed in parallel.
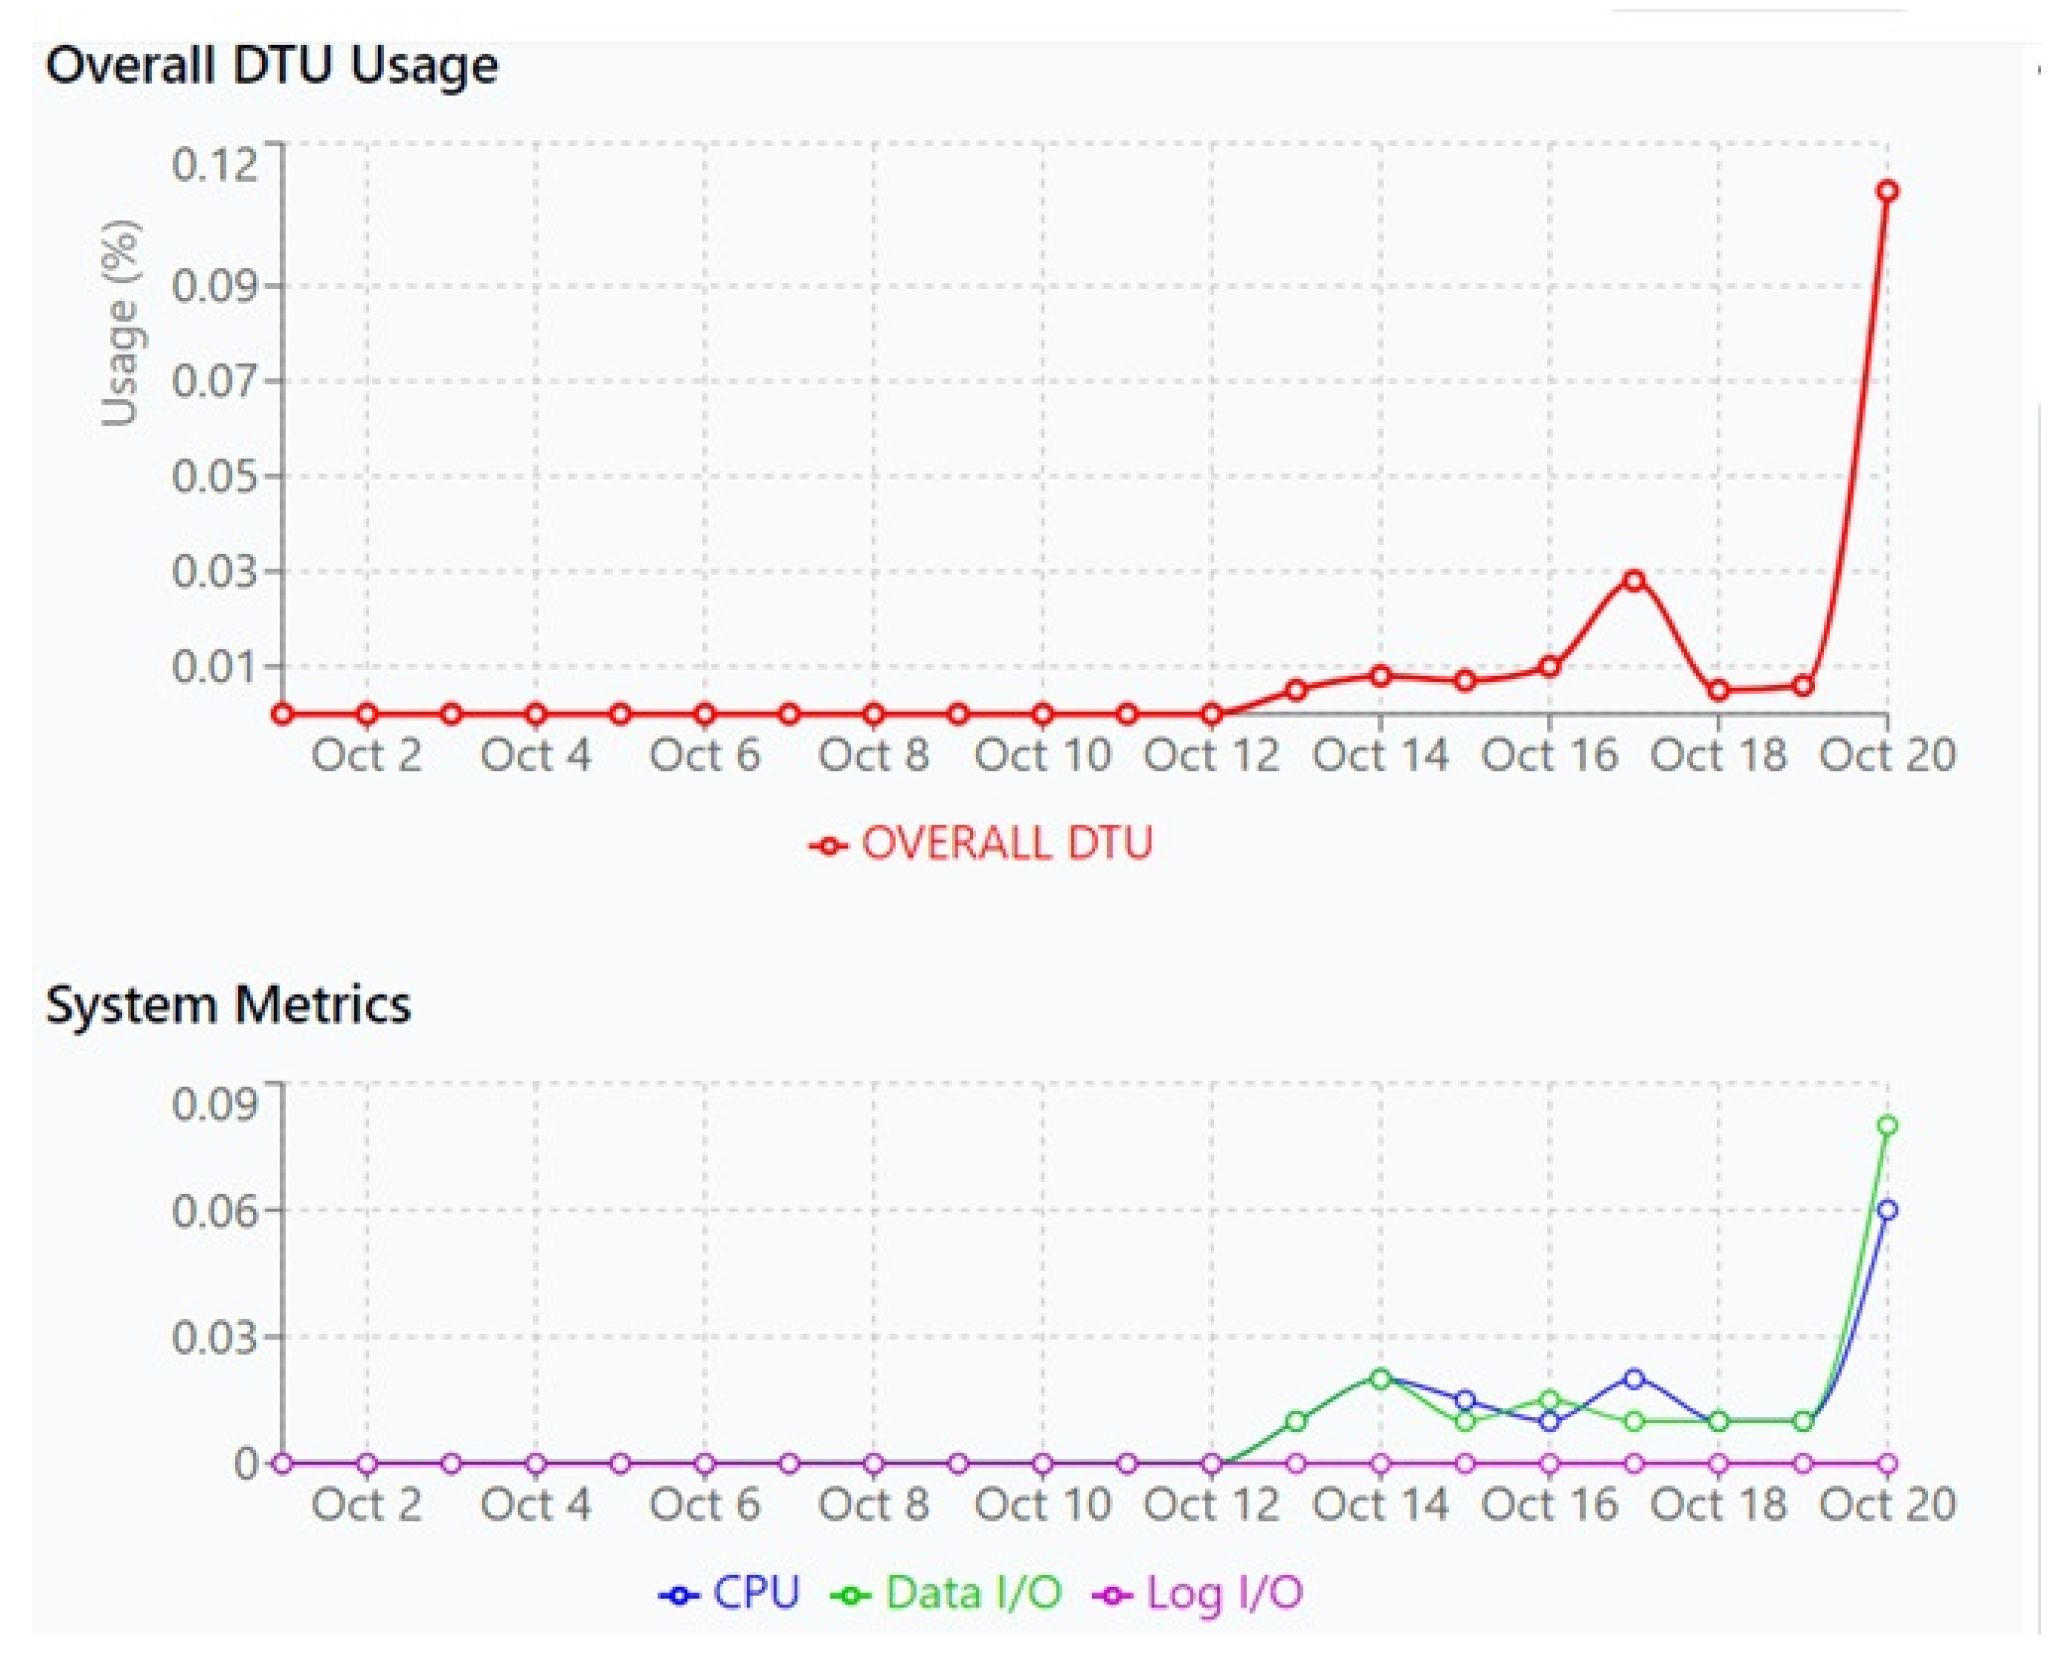
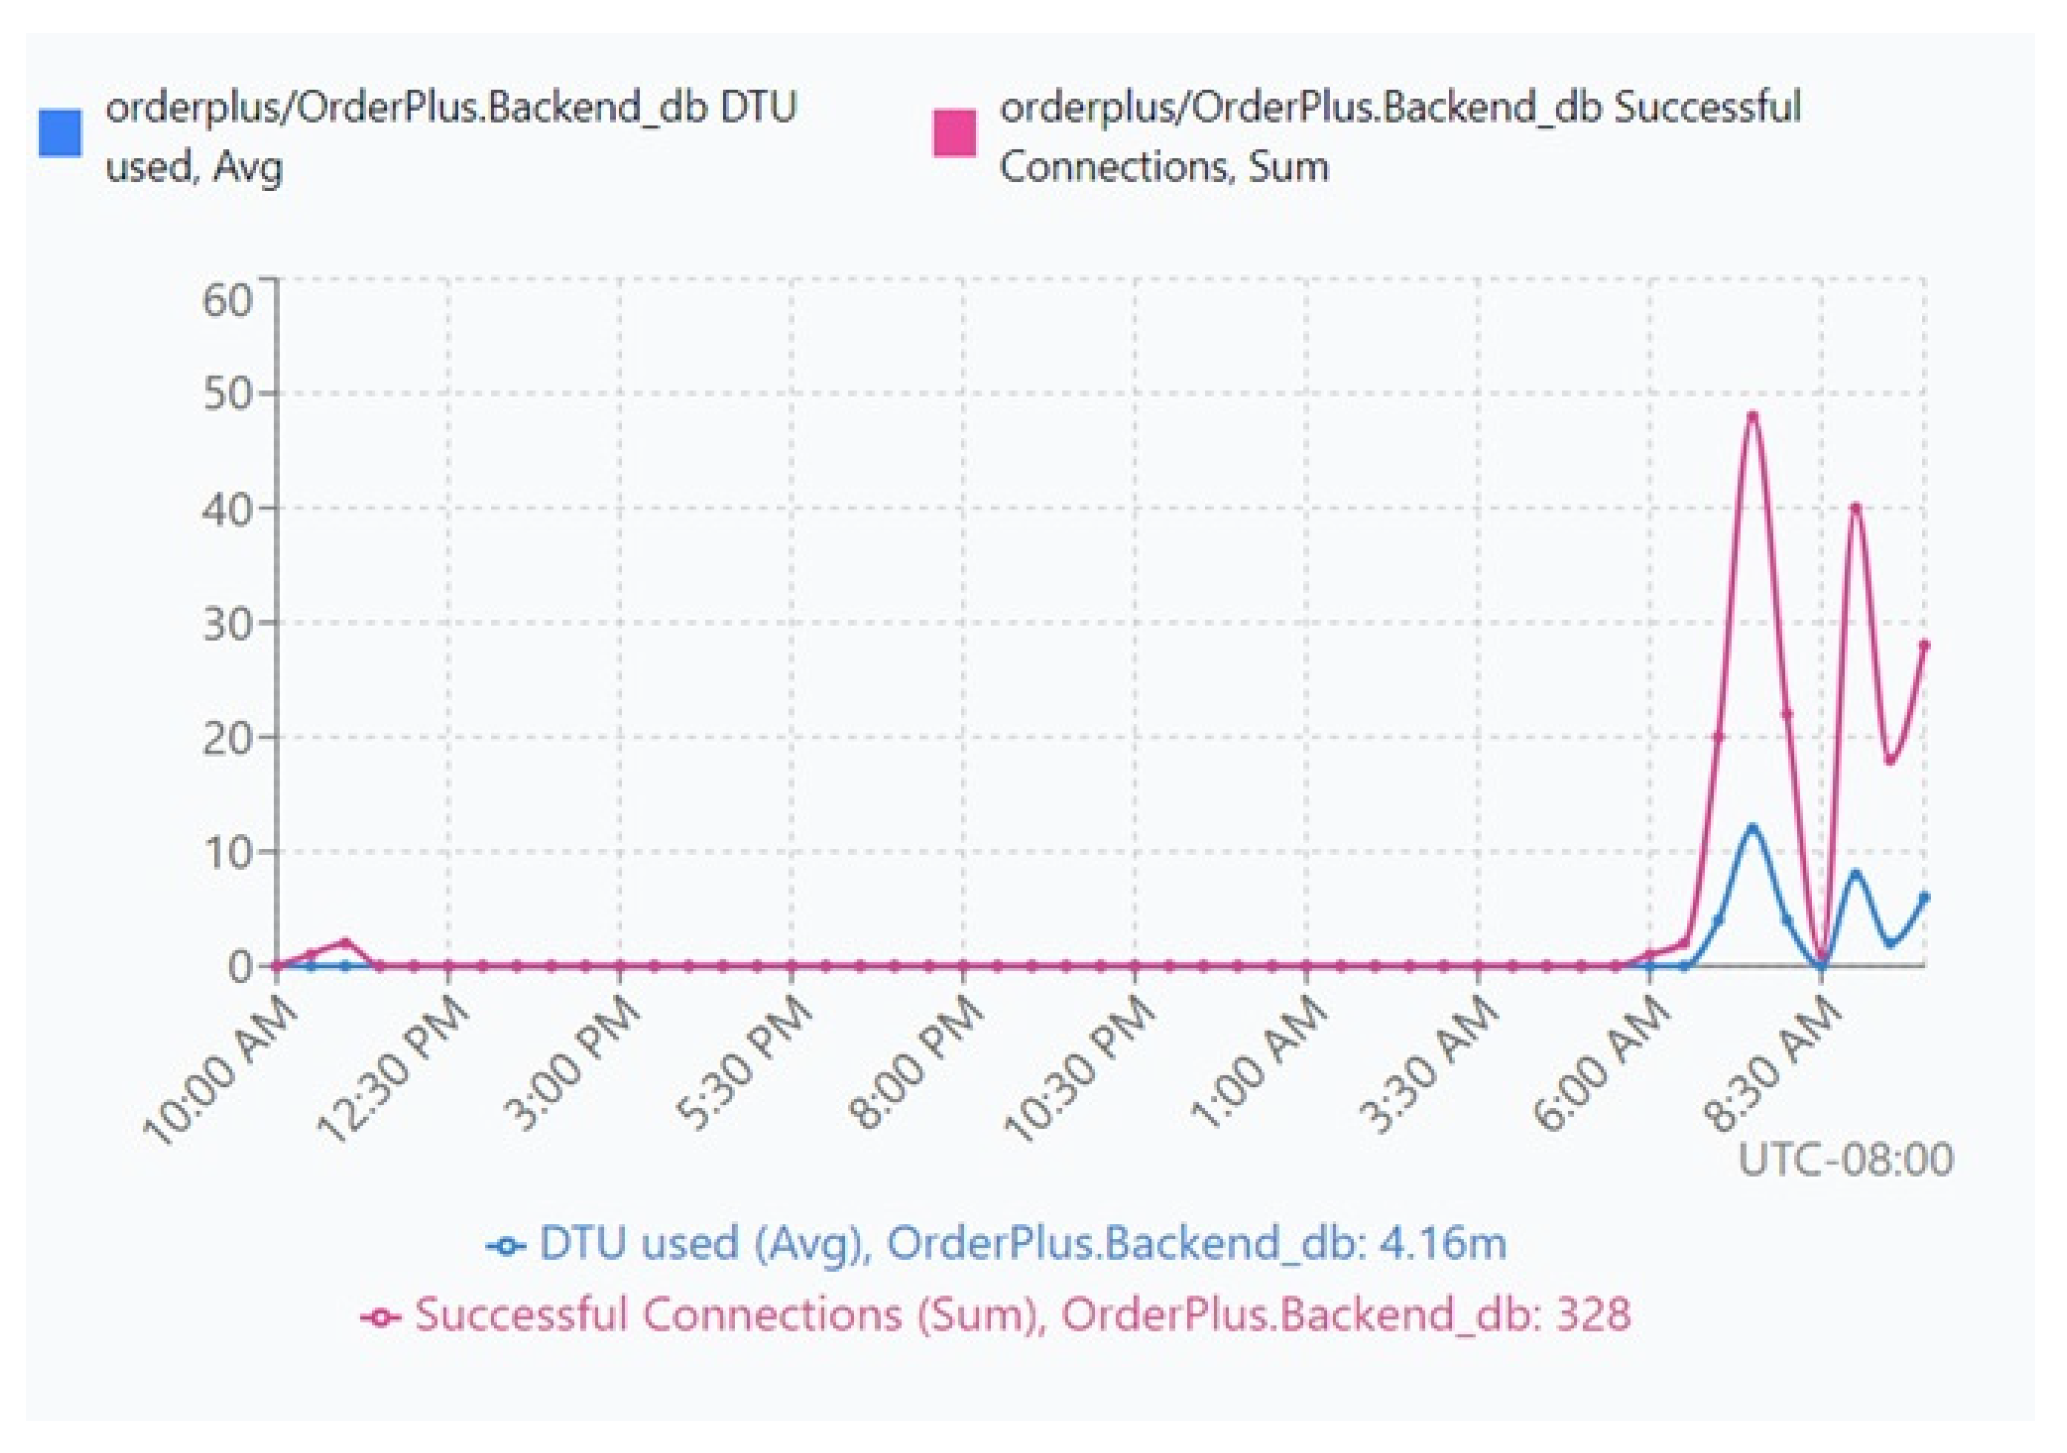
The Azure Monitor visualizations shown in
Figure 11,
Figure 12,
Figure 13 and
Figure 14 present resource utilization as normalized percentages of the maximum provisioned database capacity (DTU%), consistent with the metrics displayed by the Azure Monitor dashboard. These normalized utilization metrics should not be interpreted as absolute throughput measurements. The quantitative values reported in the accompanying text (e.g., operations per second) were obtained from application-level performance measurements collected during the workload experiments and therefore represent different, complementary performance indicators.
In the case of an e-commerce platform, the CPU should work at the top level to ensure that users experience less latency in such high-demand shopping seasons, especially around Black Friday and other big sales. The CPU controls the execution of queries and manipulates data and hence has a direct impact on response time and transaction speed. Poor-performing CPUs will easily drive slow checkouts, delayed product searches, and latency across the entire system, all impacting user satisfaction.
I/O performance is another key determining factor, especially for database-centric applications like e-commerce, which require a lot of data to be read and written into storage systems at velocity. With Azure SQL Database ensuring high-throughput transactions of data, it ensures smooth operations, ranging from adding products into a shopping cart to order processing and maintaining inventories.
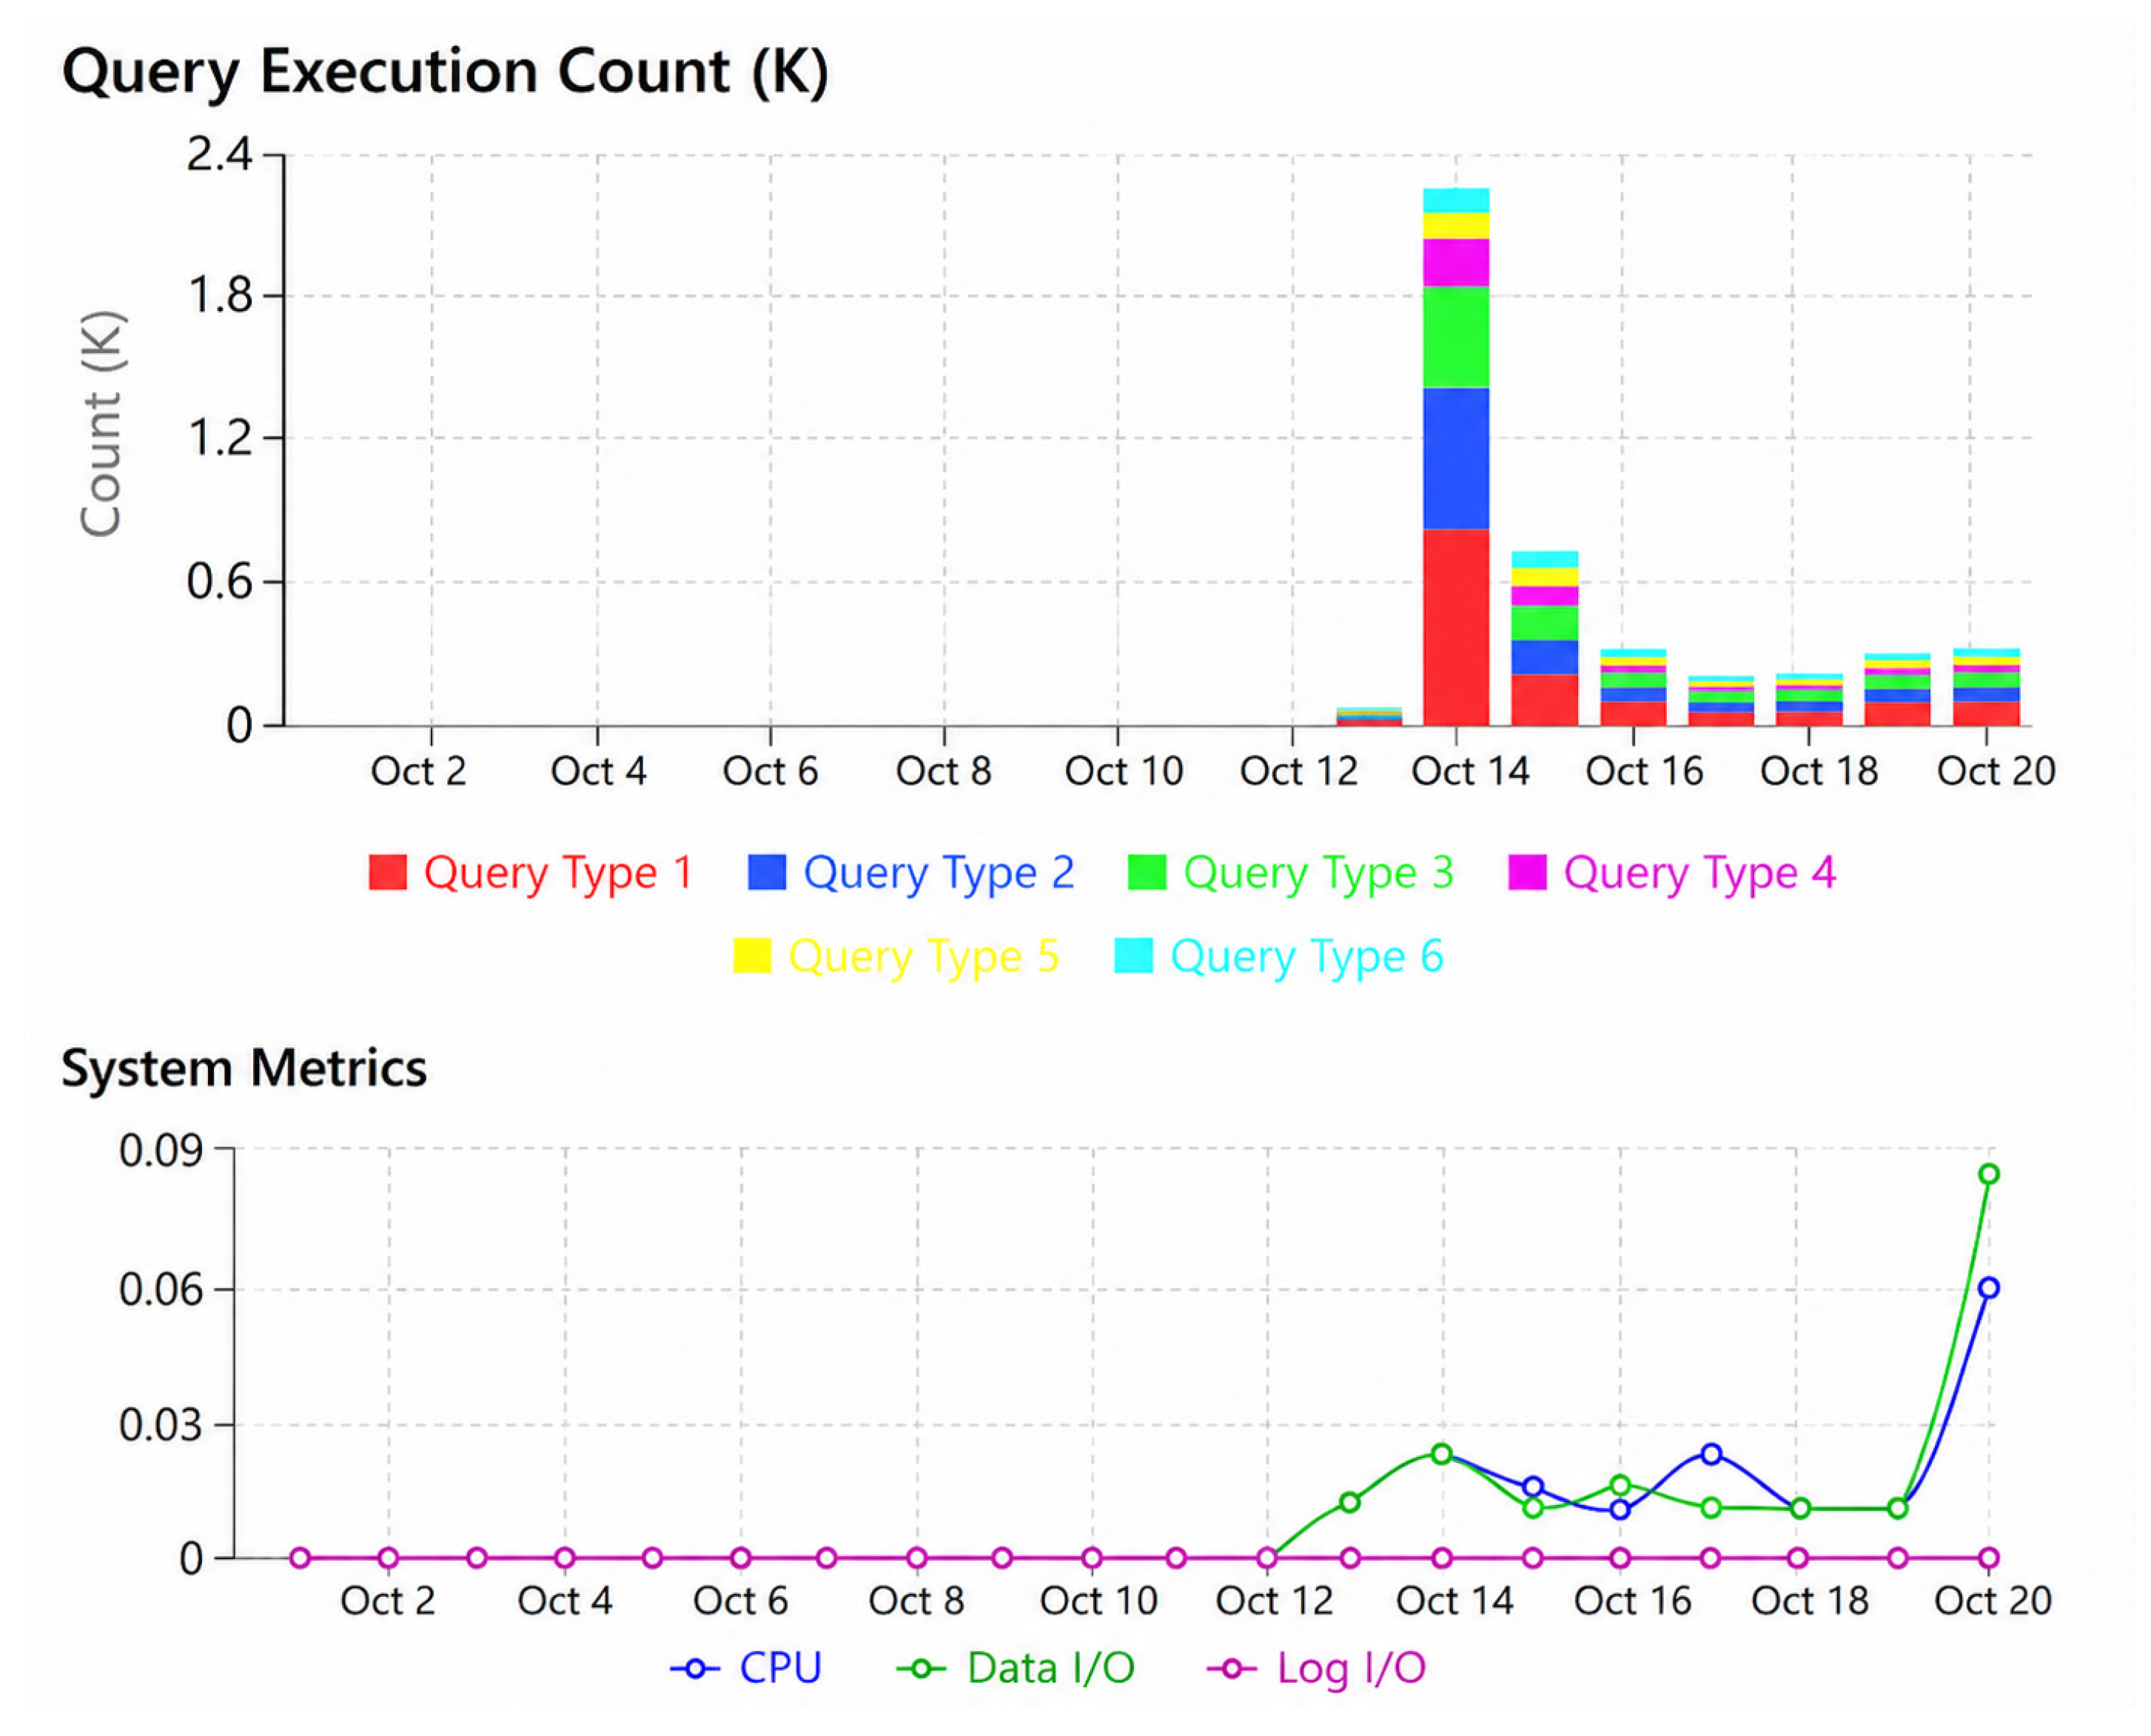
As shown in
Figure 11, read operations averaged around 650 per second while write operations remained closer to 340 per second throughout the testing period. This two-to-one ratio is consistent with what one would expect from an e-commerce workload, where customers browsing products and checking order history far outnumber those actively placing orders or modifying records at any given moment.
What is more interesting than the raw numbers, however, is why Azure SQL manages to sustain these rates without the kind of latency spikes seen in the on-premise environment. A significant part of the explanation lies in the storage layer. The managed storage backing Azure SQL operates at throughput levels comparable to Premium SSDs, which deliver noticeably higher sequential read and write speeds than the SATA SSD used in the on-premise setup. Beyond the hardware difference, Azure SQL’s buffer pool management tends to be more aggressive about keeping frequently accessed data pages in memory. In practice, this means that repeated SELECT queries hitting the same product records or transaction history tables are increasingly served from memory rather than triggering physical disk reads, which accumulates into a measurable throughput advantage over the course of a sustained workload. Together, these two factors—faster underlying storage and smarter in-memory caching—go a long way toward explaining the throughput gap between the two environments.
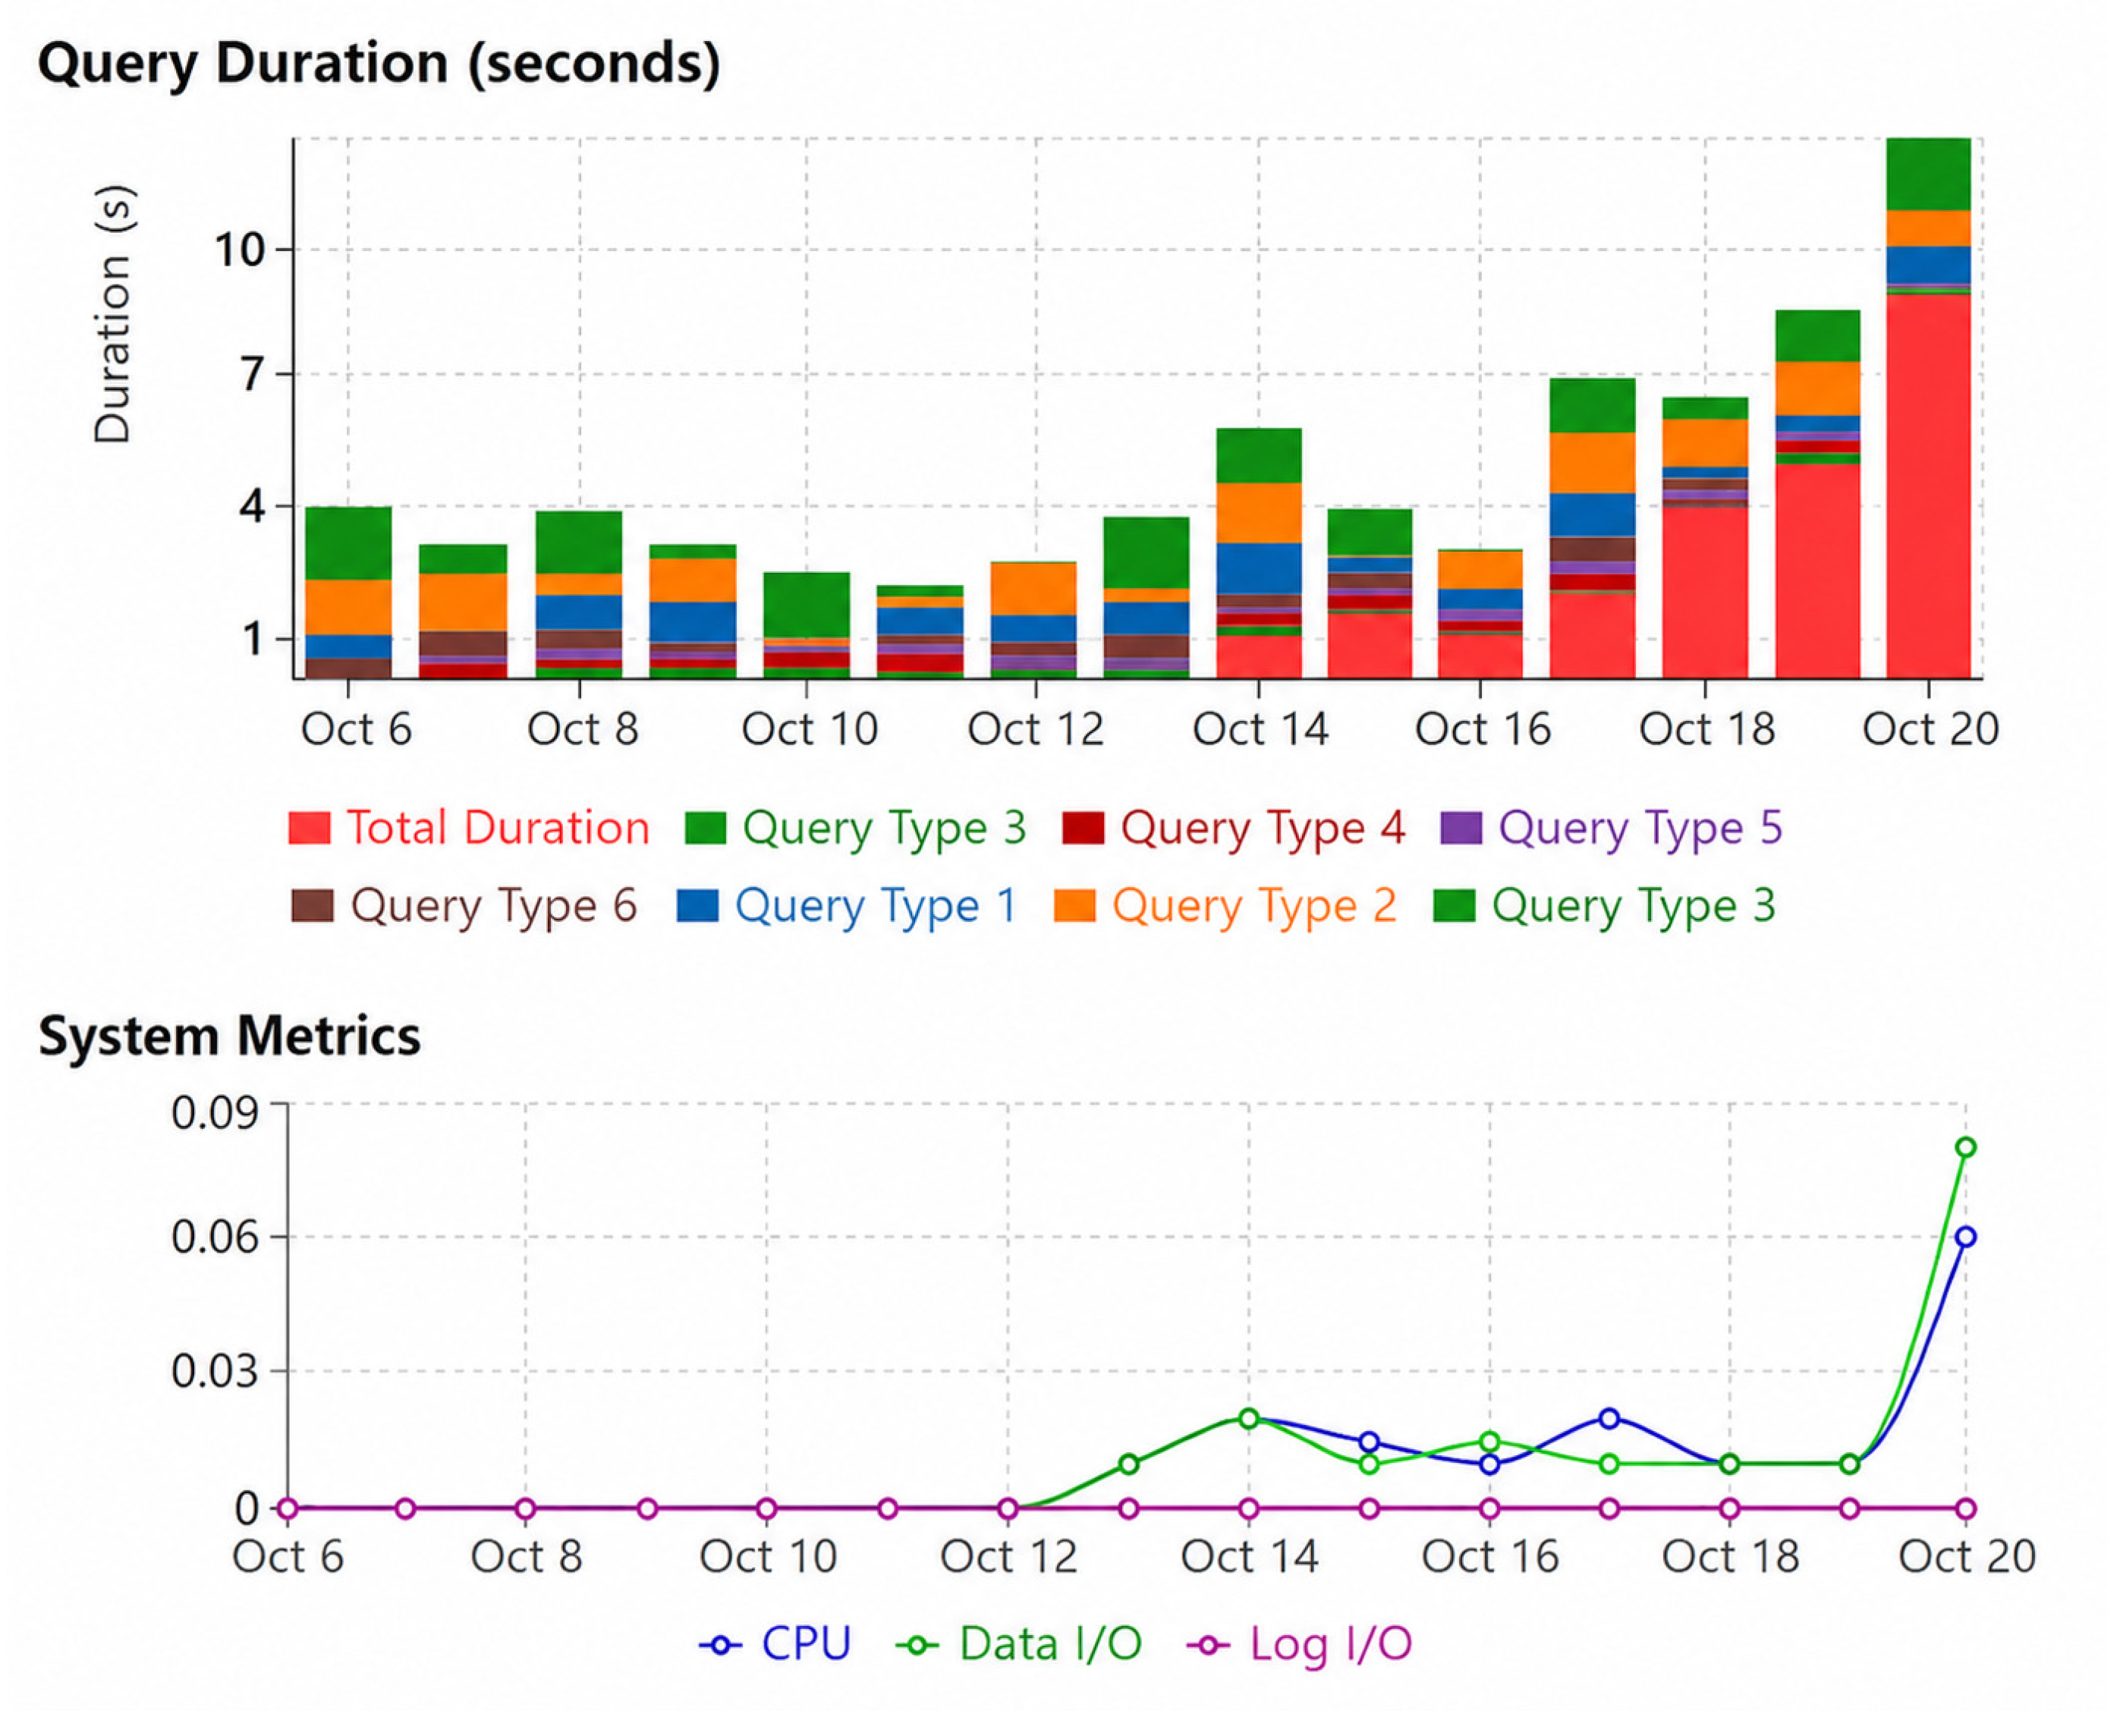
Execution times for the various database operations are shown in
Figure 12 for the duration of the test. Most of the database operations were able to be completed within two seconds when the workloads were normal and thus acceptable for e-commerce applications. Occasionally, database operations had delays of around five seconds due to multiple concurrent resource-intensive SELECT statements being executed at the same time. These increases in time are attributed to the dynamic provisioning of additional compute resources by Azure, as well as the complexity of the SELECT statements due to the number of tables that had to be joined (e.g., orders, products, and inventory). However, other than occasional delays due to the previously mentioned reasons, the execution times remained stable and returned back to normal execution times very quickly. This shows that Azure can sustain a consistent and stable performance, even with varying workloads.
The excursion times shown in
Figure 13 demonstrate the duration recorded for performing various database operations while executing queries on the Azure SQL database during the monitoring window shown (1–20 October 2024), which was part of the broader six-month system development and testing period. The formal statistical measurements reported in
Section 5 (30 trials per operation) were conducted separately within this monitoring window under the controlled protocol described in
Section 4. The majority of database transactions were completed in an appropriate time, indicating that Azure SQL has a consistent ability to sustain high-throughput query execution performance during normal (i.e., e-commerce) conditions. However, there are some outlier occurrences that demonstrate longer execution times that will be evaluated further. According to the graph, there is a peak on one of the operations that is just below the 5 s mark. This may cause a delay for users when there are very high traffic levels on the website (i.e., during holidays). Due to the fact that many complex SELECT operations with multiple table joins (e.g., orders, products, and inventory) are submitted at the same time and need to utilize all vCore capacity, resource contention may temporarily occur. In addition, the delay in loading these newly provisioned resources adds to the transient response times for executing these SQL queries. All of these situations caused SQL queries executed at that time to exceed their expected completion time for a short period.
Overall, other than these occasional isolated occurrences of performance, Azure SQL has demonstrated consistent and stable execution times for the workloads tested and can be expected to remain consistent across an extended period of time. (i.e., transient performance variances may be observed).
During the period of testing, the Azure SQL Database system was analyzed with regard to the throughput of log I/O operations by comparing both the time taken for log input and output operations shown in
Figure 14. The demarcated areas of the figure show instances when the log read and write activity faced significant delay because of high volumes of transactional workload; these delays should not be considered isolated events. Log I/O represents an essential component of the database transactional pipeline; therefore, all committed INSERT, UPDATE and DELETE transactions must be logged before they can be considered completed. Thus, if there is a bottleneck in log throughput, then this bottleneck will extend the time required to execute the write operations; it also creates an additional delay on read operations that are waiting for locks to be released by pending transactions.
The latency spikes shown in
Figure 14 correlate closely with the execution time peaks represented in
Figure 13. This correlation suggests that concurrent write-heavy workloads were impacting the log I/O subsystem very similarly during these time periods. In Azure SQL Database, the amount of log throughput allowed is based on the Azure SQL Database service tier. In this study, General Purpose is the service tier used, and the maximum speed at which logs are written to the logs is limited by the managed storage backend. Although managed storage backends can write logs much faster than the SATA SSD in the on-premise environment, there is still a finite amount of bandwidth available with which to write to logs when sustained concurrent workloads are present. As a result, latency in the log I/O subsystem may be the most likely bottleneck during peak write activity in the cloud environment, whereas CPU saturation may not be the most likely bottleneck during peak write activity in the cloud environment. This difference has implications for tuning workloads and selecting service tiers when deploying your production environment.
Figure 15 presents a consolidated view of system resource consumption and query completion times across the testing period. While average metric values remained within acceptable operational ranges, the figure reveals a clear positive correlation between demand intensity and resource consumption—as concurrent user load increased, both DTU utilization and query completion times rose proportionally. This relationship is expected in a shared cloud resource model, where each additional concurrent query competes for the same pool of vCore processing capacity and managed storage bandwidth. The practical implication is that sustained high-concurrency workloads, such as those typical during peak shopping periods, will inevitably push resource utilization toward the upper bounds of the provisioned service tier, making proactive performance monitoring and periodic service tier reassessment essential components of production deployment management for e-commerce applications on Azure SQL.
To guarantee the statistical correctness of our Azure SQL Database performance analysis, we performed 30 repeated trials per operation type, at different times of day and under different load conditions to capture natural variation in cloud resource allocation, consistent with the repeated-measures design described in
Section 4. As with the on-premise measurements, these trials represent repeated measurements within the same Azure SQL Database instance rather than fully independent observations. The statistical summary of the performance metrics of Azure SQL Database is provided in
Table 6.
The variation in CPU use—overall CV of 28.4% indicates the dynamic nature of cloud resources under widely varied load conditions, whereas stable CVs for query operations—just about 10.6–11.5%—indicate that this performance is not sensitive to elasticity.
5.3. Statistical Rationale for Between-Environment Comparisons
The manner in which different statistical techniques were utilized in this study was dictated by which type of comparison was to be performed; therefore, this explanation clarifies how to apply the appropriate statistical technique(s) for comparisons made within a specific deployment environment (i.e., one of the four CRUD operation types (SELECT, INSERT, UPDATE, DELETE) was executed on the same database instance using the same hardware/software). Because all four operations were executed on the exact same system state/connection pool/session, they should be treated as having correlated rather than independent statistics. For this reason, a one-way repeated-measures ANOVA with Greenhouse–Geisser correction was used to compare execution times across operation types within each environment, as reported in
Section 5 for the on-premise system.
In contrast, the comparison of the SQL Server and Azure SQL Database in
Table 7 (
Section 6) was performed on two structurally different and independently provisioned systems: the on premise SQL Server instance and the Azure SQL Database instance. Neither system shares any hardware, operating system, storage subsystem, or query engine, and therefore the 30 trials performed in each environment were conducted in totally separate, non-overlapping experimental sessions on separate physical infrastructures. Under these conditions, each environment has 30 independent trials (one for each category per environment), and each environment meets the requirement for independence needed to use an independent-samples
t-test; therefore, no trial from the Azure sample shares an experimental unit (server instance session or Database Engine) with any trial from the on-premise sample. The repeated measures design is only applicable to the comparisons within an environment (across operation types) and not to the comparisons between the two environments; thus, two different types of inferential designs were utilized in this study: repeated measures ANOVA for within-environment comparisons and independent-samples
t-tests for between-environment comparisons.
Prior to conducting the independent-samples
t-tests reported in
Table 7, the underlying assumptions of normality and homogeneity of variance were assessed for each of the four compared metrics (SELECT query time, data throughput, peak CPU usage, and average CPU usage). The Shapiro–Wilk test indicated no significant departure from normality for the Azure SQL samples (SELECT: W = 0.96,
p = 0.34; throughput: W = 0.97,
p = 0.48; CPU average: W = 0.94,
p = 0.09) or the on-premise samples (SELECT: W = 0.97,
p = 0.61; throughput: W = 0.96,
p = 0.41; CPU average: W = 0.95,
p = 0.18), supporting the use of a parametric test. Levene’s test for equality of variances indicated a significant violation of the homogeneity assumption for all four metrics (all
p < 0.01), which was expected given the structurally different variance behavior of a fixed-hardware system versus an elastically scaling cloud system (reflected in the substantially higher coefficient of variation for Azure CPU usage, 28.4%, relative to on-premise, 16.3%). Accordingly, Welch’s
t-test, which does not assume equal variances and adjusts the degrees of freedom accordingly, was used in place of the standard Student’s
t-test for all between-environment comparisons reported in
Table 7.
6. Comparative Performance in Azure SQL and On-Premise Systems
The technical measure of comparative performance between Azure SQL Database and on-premise SQL systems is through four parameters: peak CPU usage, average CPU usage, time taken by any SELECT query, and throughput capacity. The statistical comparison between these environments is presented in
Table 7.
To assess the statistical significance of any differences that existed between the two deployment types of Azure SQL Database and an on-premise SQL Database,
t-tests for independent samples were conducted on all four performance metrics, with degrees of freedom being adjusted according to the Welch–Satterthwaite method for unequal variances.
Table 7 shows the results of the independent-samples
t-tests, including values for the t-statistics and degrees of freedom used in the analysis to derive the
p-values.
Four performance metrics were analyzed independently by means of independent samples
t-tests and established that statistically significant differences (
p ≤ 0.001) existed between the two systems in all instances; therefore, Cohen’s d for unequal variances was computed as the difference between the two groups’ means (M
1 & M
2) divided by their pooled standard deviation (SD); the pooled standard deviation from the SQL database was calculated using the following formula:
M
1 and SD
12 refer to the mean and standard deviation, respectively, of the Azure SQL sample, while M
2 and SD
22 refer to those same values for the on-premises SQL sample. The effect sizes obtained were −7.95 for SELECT query time, 5.67 for data throughput, 2.80 for peak CPU usage, and 3.74 for average CPU usage. Based on [
35] criterion, all effect sizes exceed the traditional cutoff for a very large effect (d ≥ 0.8) and are therefore considered practical as well as statistically significant. The highest relative impact calculated was the average CPU utilization, which had a 316.3% increase with Azure SQL as compared to the on-site system. Additionally, it demonstrates that typical on-site system resources were more effectively utilized when compared to the Azure SQL configuration during this analysis. Based on experimental measurements, Azure SQL Database exhibited lower SELECT query execution times and higher throughput than the tested on-premise SQL Server environment. The observed performance difference remained evident despite the average network round-trip latency of approximately 85 ms recorded during testing. Since the engine-level measurements also favored Azure, the results indicate that network latency did not account for the observed performance difference. Instead, the experimental data demonstrates that Azure provided more efficient query processing under the workload evaluated in this study.
Also consistent with the test results displayed in
Table 8 is that the engine-level SELECT response times of the Azure SQL Database were quicker than those from the on-premise SQL Server configuration tested, even though the network round-trip latency was measured at approximately 85 ms for the tests. Therefore, this result supports the experimental conclusion that the observed performance improvement was consistently evident across all experiments and could not have been primarily caused by network latency.
6.1. Regarding Caching and Buffer Pool Management
The differences in buffer pool performance between two deployment environments cannot be explained by engine-level execution time alone. The on-premise SQL Server buffer pool was limited to 12 GB of system RAM (for use by the operating system and SQL Server), and during the workloads that included 50 concurrent users executing complex SELECT queries (including multiple table joins), the working set repeatedly exceeded the maximum capacity of the buffer pool. As a result, this led to physical disk I/O being performed on the SATA-based SSD. Conversely, in the Azure SQL Database deployment, the SQL Database was provisioned with approximately 20.4 GB of memory for the database workloads and used Premium SSD storage. Therefore, the Azure SQL Database environment produced a substantially larger effective working set that could be held in memory versus on-premise SQL Server, resulting in less reliance on physical disk access when compared to the SQL Server environment.
The ratio of physical I/O required to execute SELECT queries will decrease over time because frequently accessed data pages are continuously present in the buffer pool. When each test session began, there were minimal differences between the two deployment environments’ performance due to the unpopulated cache. However, once the buffer pool was filled with frequently accessed data, the performance differences between the two systems steadily increased. The average performance improvement of approximately 55% was achieved through gradual accumulation over the course of the sustained workload session, rather than being immediately or consistently achieved as a performance advantage.
6.2. Regarding Indexing Behavior Under Concurrent Load
Both environments employed the same indexing mechanisms (i.e., clustered primary key indexes in conjunction with non-clustered unique indexes on frequently queried columns); however, despite that similarity between environments, there was a noticeable difference in performance when handling concurrent workloads. In an on-premise SQL Server (SQL Server) environment, 50 concurrent users were all trying to access the same index structures from within the 12 GB buffer pool. The increase in indexed column searches (e.g., Product.Name and Category.Name) due to the number of concurrent users searching these columns resulted in contention for index pages, requiring the requests to wait for the index pages to be released to complete their search operations.
In contrast, Azure SQL Database has a managed storage architecture with greater I/O capacity than SQL Server, allowing for more efficient processing of index lookups. As a result, index lookups with Azure SQL Database were completed in a shorter period, resulting in a shorter length of time during which shared resources were being utilized when executing concurrent queries. The performance metrics support this behavior; Azure achieved 101.6% greater throughput than SQL Server and reduced the average query response time by 55.0%. To summarize, the throughput advantage of Azure (101.6%) demonstrates a greater proportion than its latency advantage (55%). This indicates that throughput is more sensitive to both the contention caused by having multiple processes competing to access locks on the same resource (such as a database or file) and to how data is accessed concurrently by multiple users when executing queries at the same time (i.e., the way users execute multiple queries concurrently). Therefore, Azure’s storage system successfully addresses the concurrency-related bottleneck for its storage system much more so than it reduces the overall processing cost per individual query execution.
6.3. Scalability and Stress Testing Under Enterprise-Level Loads
It is important to understand the extent of the performance advantage already observed in this analysis before expanding its findings to the cases of enterprise-level applications. The observed 55.0% decrease in latency and 101.6% improvement in throughput for Azure SQL Database is specific to the General Purpose service tier evaluated in this study and cannot be interpreted as a permanent performance gap. As stated in the previous studies [
14,
15], the magnitude of the performance advantage can vary depending on the service selected, showing it is dependent on the configuration used rather than existing as a specified gap between Azure SQL and on-premise deployments. Since only the General Purpose tier was evaluated, the effect sizes reported cannot be generalized for other tiers of Azure SQL services, and the workload configuration’s use of 60% SELECT operations gives advantages to Azure’s buffering and caching efficiency, whereas a higher proportion of write operations may reduce the observed performance advantage, as heavy write loads create pressure on the log I/O subsystem of Azure rather than affecting CPU or memory load (
Section 6.2,
Figure 14). Therefore, the scalability results provided in the following sections should not serve as a judgment about the advantages of cloud databases in all circumstances.
To evaluate enterprise-level scalability, a large-scale experimental framework was developed using a dataset containing at least 100,000 product records and 500,000 transaction records. The system was further evaluated under varying concurrency levels, ranging from 10 to 500 simultaneous users, to identify its performance thresholds and scalability characteristics.
Illustrated in
Table 9, Azure SQL Database provides excellent elastic scaling capabilities. Both environments showed comparable performance at low loads (10 users), being 185.2 ms for Azure and 198.5 ms for on-premise, with a significant performance separation when concurrency increased. At 500 users, the average SELECT latency of 580.4 ms for Azure SQL was within acceptable limits, while the average latency for the on-premises system increased dramatically to 4850.7 ms, or an approximate latency degradation factor of 24.4× (relative to the 10-user test, compared to 3.1× for Azure SQL). During the 500-user test, no connection timeouts occurred, as all requests completed within the 600 s command timeout period.
The vast majority of the massive increase in latency occurs at an on-premise/local implementation due to both queuing of threads trying to be processed through the same four physical processors and exhaustion of available resources from a fixed 4-core hardware architecture. This occurs as the (concurrent) users exceed 500, as the system will attempt to process each of the threads through each of the four physical processors at the same time, along with accessing the shared 12 GB buffer in the same manner (i.e., they are all fighting for the same resource) and causing CPU saturation (as one would expect), with no capacity to alleviate CPU saturation in an elastic manner. When using Azure’s dynamic resource allocation, maintaining peak load throughput at 5950.2 ops/s for this application means it is more than five times higher than the on-premise throughput of 1150.4 ops/s.
As discussed in
Section 5’s baseline data, Azure SQL has a 55% reduction in latency when compared with other technologies supporting 50 concurrent users. Furthermore, as the number of concurrent users increases to enterprise-class levels, the benefits of Azure SQL become even greater. These findings are further indication that on-premise systems will continue to support stable, low-concurrency workloads, but in order to accommodate the high-frequency transactional workloads associated with large-scale e-commerce platforms, a cloud-based solution is necessary.
Beyond statistical significance, the observed differences carry direct practical implications for e-commerce operations. A reduction in SELECT response time from 452.3 ms to 203.5 ms is operationally meaningful in e-commerce contexts: prior research has shown that page-load and response latency directly influence customer satisfaction and e-commerce conversion rates [
36]. Likewise, the throughput advantage (987.6 vs. 489.8 ops/s) becomes particularly consequential during demand surges such as promotional events or seasonal sales, where the scalability results in
Section 6.3 show the on-premise system degrading by a factor of 24.4× at 500 concurrent users, compared to only 3.1× for Azure SQL. In practical terms, this means the on-premise configuration tested here would likely become a bottleneck—or fail to meet acceptable response-time thresholds—precisely during the high-traffic periods when reliable performance matters most to revenue, whereas the Azure deployment maintained sub-second latency throughout. This distinction between statistical significance and operational consequence is central to translating the present findings into actionable migration guidance for practitioners.
6.4. Cost–Performance Analysis
Economic factors in combination with technical performance metrics should be included in a comprehensive assessment of the database deployment strategies to assess the impact of cloud migration as one of the primary reasons for cost savings to corporations [
1,
3]. This section includes how the operational costs associated with the database deployment strategies assessed will be discussed, along with the throughput measured based on the concurrency of the system under evaluation. For this evaluation of the cloud environment, we evaluated the Azure SQL Database’s General Purpose (GP) service tier with 4 virtual CPUs (vCores), 20.4 gigabytes (GB) of managed memory, and 64 GB of managed storage. In regard to the estimated operational cost for this configuration, calculated using the Microsoft Azure Pricing Calculator, it is estimated to be roughly USD 793.34 per month under Microsoft’s Pay-As-You-Go (PAYG) pricing model. However, if organizations take advantage of the Azure reserved pricing model, they will see a significant reduction in their monthly cost per month, approximately USD 557.87 for a one-year subscription and USD 388.63 for a three-year subscription. This represents a reduction of approximately 30% compared to PAYG pricing for a one-year subscription and a reduction of 51% when compared to PAYG pricing for a three-year subscription.
The experimental setup for the on-premises environment was based on a workstation running on an AMD Ryzen 7 3750H processor, 16 GB RAM, and a 64 GB SATA SSD, which cost approximately USD 1150 to build. Unlike a subscription-based cloud model (e.g., Azure SQL Database), the on-premises deployment requires an initial upfront capital cost to build the infrastructure and absorb the entire cost of hardware/software/maintenance, security updates, backups, and system administration when using an on-premises infrastructure. In addition, when scaling an on-premises infrastructure to support significantly higher loads, it usually requires purchasing additional hardware, while the Azure SQL Database provides the ability to scale the resources elastically without purchasing additional hardware. A summary of the cost analysis and deployment comparison is presented in
Table 10.
An operational performance-per-dollar ratio was developed to create a standardized cost to operate. The number of operations per second was divided by the corresponding monthly operating cost to derive the operations-per-second-per-dollar metric. The intent was to provide only a comparative measure of cost to operate, not an overall Total Cost of Ownership (TCO) analysis, which would include personnel, utility, and other facility expenses and organizational maintenance overhead.
As shown in
Table 11, the on-premise environment achieves a higher operational performance-per-dollar ratio at the evaluated workload levels because of its relatively low monthly operational cost after hardware amortization. However, this metric should be interpreted together with the experimental performance results. Under high-concurrency workloads, Azure SQL Database consistently maintained substantially lower response times and significantly higher throughput than the on-premise deployment.
For example, at 500 concurrent users, Azure SQL Database achieved a throughput of 5950.2 operations per second with an average SELECT latency of 580.4 ms, whereas the on-premise deployment achieved 1150.4 operations per second with a latency of 4850.7 ms under the same workload conditions. These results indicate that Azure SQL Database sustained considerably higher performance while providing managed services such as automated backup, high availability, infrastructure maintenance, and elastic scalability.
When contemplating the use of Azure reserved pricing, the impact of reduced operational costs will significantly enhance the operational performance per dollar ratio of the application running in the cloud. Therefore, while on-premise solutions still could be economically feasible for applications with steady workloads and little scalability demands, Azure SQL Database can be very cost-competitive for applications that may require high concurrency, operational resilience, and elastic resource scaling over time. Consequently, the selection of infrastructure should consider both measured performance characteristics and long-term operational needs rather than simply the acquisition cost associated with that infrastructure.
7. Limitations
Despite the value of this study, it has certain limitations that need to be recognized. It is also important to contextualize these findings within the broader trade-offs that characterize each deployment model. The on-premise environment retains clear advantages for organizations with stable, predictable workloads, owing to its lower recurring operational cost once the initial capital investment has been amortized, its full administrative control over hardware and data locality, and its independence from network connectivity. However, it is constrained by fixed compute capacity, requiring costly hardware upgrades to accommodate growth, and exhibits substantially higher latency degradation under high-concurrency conditions in this study. Conversely, Azure SQL Database offers elastic scalability, managed infrastructure, and consistently superior throughput and latency under concurrent load, but at the expense of a higher recurring subscription cost and a degree of dependency on network reliability and provider-managed resource allocation. These trade-offs should inform deployment decisions according to an organization’s workload predictability, growth trajectory, and budgetary structure.
First, the results of the study only relate to Microsoft Azure SQL Database and thus do not necessarily apply to other providers of cloud-based services, such as AWS or GCP. Although the performance of SQL Database on Microsoft Azure may have improved, no assumption can be made that SQL Database would perform similarly in similar cloud environments. While the evaluation framework is based on one type of industry, e-commerce, this will not be an accurate representation of all other sectors (for example, healthcare, finance, and manufacturing) that fall outside the e-commerce scope. In addition, the first evaluation was based on a total of 5000 products and 10,000 transaction records. Extensive testing using 100,000 products and 500,000 transactions at up to 500 concurrent users has partially proven the scalability of an enterprise application. However, due to the limitations of this research, future research should focus on testing large (greater than one million) datasets to verify scalability at an enterprise-scale level. The present study only compares total on-premise with total cloud-based deployments while neglecting the many hybrid cloud architecture deployments that have emerged as enterprises shift their operations to a cloud computing environment. In addition, while on-premise systems are typically less expensive to operate than cloud-based systems when workloads are stable, a preliminary cost–performance analysis is provided in
Section 6.4; this analysis is based on standard list pricing and does not constitute a comprehensive Total Cost of Ownership (TCO) evaluation, as it excludes personnel costs, electricity, and facility expenses, which should be addressed in future research. Even though the differences between the average latency, throughput, and CPUs were very carefully measured, the differences in resiliency characteristics, such as recovery time, fault tolerance, and the impact of failures on data integrity, were not properly measured, and exhibit a lack of practical applicability for systems that are mission critical.
This study evaluated practical deployment scenarios as opposed to establishing hardware-equivalent benchmarks. Accordingly, the focus was on conducting a comparative analysis of on-premise and Azure SQL Database deployments by utilizing similar application software, database schema, workload generation methodology, and datasets as opposed to matching the underlying hardware specifications. This approach was adopted to represent deployment scenarios commonly encountered by small and medium-sized organizations while maintaining a consistent experimental setup throughout the study.
However, this design choice introduced an important limitation. The on-premise deployment in this study was hosted on a mobile-class processor (AMD Ryzen 7 3750H) with consumer-grade SATA storage, rather than enterprise-grade hardware comparable to the datacenter infrastructure underlying Azure SQL Database, resulting in partial confounding between the deployment model and hardware generation. Therefore, differences in the hardware configuration may have contributed to the measured performance in addition to the deployment architecture. Future studies should replicate this evaluation using equivalent-generation enterprise-grade server hardware (e.g., Xeon/EPYC processors with enterprise NVMe storage.
Future research will address these limitations by using multiple cloud computer systems, exploring hybrid systems, and modifying the metrics used to measure workload performance across many different types of industries. Long-term studies will produce research on scalability and operational efficiency, as well as on the use of emerging technologies such as AI-based query optimization, serverless computing, edge computing, etc. Researchers can then utilize these technologies to evaluate the effect of various types of technology on system performance. In order to increase the real-world applicability of their findings, researchers should provide a variety of cost–performance data and conduct additional analyses to assess the resilience of the respective systems studied. These findings will provide businesses with an extensive set of guidelines for the safe adoption of cloud computing systems, for the distribution and allocation of resources, and for achieving their strategic objectives.
8. Conclusions
This study presented a comprehensive empirical comparison between on-premise Microsoft SQL Server and Azure SQL Database using a realistic .NET Core 8 e-commerce system. By employing a controlled factorial benchmarking methodology—systematically varying variables such as data size and concurrent users while keeping other factors constant—the research successfully isolated the performance impact of the deployment environment. The experimental results demonstrate a clear performance advantage for cloud-based infrastructure under high-concurrency scenarios. Azure SQL Database reduced average SELECT query response time by 55% and improved data throughput by 101.6%.
Furthermore, extended scalability testing under enterprise-level loads confirmed that this advantage amplifies significantly with scale, with Azure SQL maintaining stable latency at 500 concurrent users (580.4 ms) while on-premise systems experienced a 24.4× latency degradation relative to the 10-user baseline (from 198.5 ms to 4850.7 ms) under the same conditions, compared to only 3.1× for Azure SQL over the same range.
Average CPU utilization in Azure was also higher (20.4% vs. 4.9% on-premise), representing a relative increase of approximately 316.3%, while peak CPU utilization reached 35.2% in Azure versus 23.9% on-premise (a relative increase of 47.3%), both reflecting Azure’s dynamic resource allocation mechanism, which scales compute resources elastically in response to workload demand. The performance advantage is further supported by Azure’s superior storage I/O subsystem, intelligent query plan optimization, and efficient multi-threaded connection management—factors that collectively explain why cloud infrastructure outperforms fixed on-premise hardware under high-concurrency e-commerce workloads. Despite these benefits, on-premise solutions remain effective for predictable and stable workloads and may offer lower operational costs in certain contexts.
This research addresses the gap in quantitative evaluations using realistic transactional workloads rather than synthetic benchmarks. It provides organizations with empirical evidence to make informed, data-driven decisions regarding cloud migration. Additionally, it validates the effectiveness of modern technology stacks combining .NET 8, ASP.NET Core Web API, and Blazor WebAssembly, showing their capability to support scalable and productive e-commerce applications. The proposed evaluation framework also serves as a reference for researchers and practitioners assessing database deployment strategies in contemporary cloud-enabled systems.
Building on these findings, the insights from this study can guide enterprises in designing hybrid cloud strategies, optimizing resource utilization, and planning future migrations. Moreover, the methodology can be extended to other cloud platforms, database systems, or enterprise applications to study scalability, cost-efficiency, and performance under realistic workloads. The results also inform best practices for database configuration, workload management, and application architecture in cloud environments.
Overall, this research highlights the tangible benefits of cloud-based databases while recognizing the continued relevance of on-premise solutions for specific workloads. By combining rigorous empirical evaluation with realistic workloads, the study provides actionable insights for industry, strategic planning, and policy-making, while establishing a solid foundation for future academic investigations on cloud database performance and deployment strategies.
9. Future Work
The findings in this study highlight several promising areas of future research as a result of the hybrid deployment model, including understanding how to measure performance across clouds and on-premises; assisting organizations with making a transition to cloud environments; expanding this research to include industry-specific workloads from retail/internet to healthcare, financial services and manufacturing; and the need for longitudinal studies to investigate how performance will change over time, primarily as data size increases and workloads shift. This includes evaluating the infrastructure performance based on efficiency and scalability, and studying the features of each architecture with regard to recovery time and data integrity in disaster recovery scenarios, comparing on-premises to cloud solutions. Potential research could also include studying the integration of emerging technologies such as AI-driven query optimization, serverless computing, and edge computing with both models. In addition, comparisons to providers other than Azure could allow for an even better view of the cloud-based architecture and solutions.