Article

Efficient Deep Learning Models Integrated with a Smart Web Application for Classifying Heart Diseases Based on ECG Signals


1
Department of Electronics and Communications Engineering, Al-Madinah Higher Institute for Engineering and Technology, Giza 12947, Egypt
2
Department of Artificial Intelligence Engineering, Faculty of Computer Science and Engineering, King Salman International University (KSIU), El Tor, South Sinai 46511, Egypt
3
College of Arts and Sciences, Umm Al Quwain University, Umm Al Quwain P.O. Box 536, United Arab Emirates
4
Information Systems Department, Faculty of Computers and Informatics, Suez Canal University, Ismailia 41522, Egypt
5
Department of Computer Science, College of Sciences and Humanities in Jubail, Imam Abdulrahman Bin Faisal University, Dammam 34212, Saudi Arabia
6
Department of Basic Sciences, Faculty of Computer and Information Sciences, Ain Shams University, Cairo 11566, Egypt
*
Author to whom correspondence should be addressed.
Computers 2026, 15(3), 191; https://doi.org/10.3390/computers15030191
Submission received: 14 February 2026 / Revised: 11 March 2026 / Accepted: 13 March 2026 / Published: 16 March 2026
(This article belongs to the Special Issue AI in Bioinformatics)

Abstract

Recent advancements in the accuracy of deep learning (DL) hold significant promise for improving the classification of heart patients. Nevertheless, continued refinement is essential to achieve even greater levels of precision in DL techniques. This paper proposes three efficient DL models: Swin Transformer (Swin-T), Visual Geometry Group (VGG)-19, and Vision Transformer (ViT), which are implemented to classify different types of heart patients. The three DL models are learned on a balanced dataset comprising 600 electrocardiogram (ECG) samples. This dataset contains three classes: Arrhythmia Patient, Myocardic Patient, and Normal Patient. The DL models are applied using a PyTorch framework v2.10.0, with fine-tuning for the models’ hyperparameters to maximize the classification accuracy, and data augmentation techniques are implemented for the ECG samples. Additionally, a smart web application is designed for classifying heart patients into three different diagnostic categories. The performance of the three models is assessed by several metrics such as area under precision-recall (AUPR) curves and normalized confusion matrices (NCMs). The proposed three models achieve high testing accuracy for the classification of heart patients. Regarding testing loss (TL) rates for the Swin-T, VGG-19, and ViT achieve rates of 0.0707, 0.4138, and 0.0015, respectively. Also, the ViT achieves an F1-score, true positive rate (TPR), and AUPR curves of 100%.

1. Introduction

According to a report by the World Health Organization (WHO), heart disease accounted for approximately 17.9 million deaths worldwide in 2019 alone [1]. Heart diseases such as arrhythmia, angina, and acute coronary syndrome are critical issues that lead to heart attacks or strokes [2]. Moreover, these issues are major causes of mortality worldwide; thus, it is essential to detect heart diseases in individuals through early and accurate methods, which can help effectively in treatment. Therefore, it is important to reduce deaths. Furthermore, classifying and predicting heart patients utilizing deep learning can aid doctors in providing an accurate and quick method for classification between different types of diseases, such as Arrhythmia, Myocardic, and Normal [3,4], and also can assist the physician in the diagnosis of chronic heart diseases, e.g., coronary artery disease (CAD) [5]. In this regard, DL techniques have an essential ability to recognize and classify heart patients and could be employed for intelligent diagnosis [6,7]. Heart patients’ classification based on ECG has become a crucial issue for research due to its contribution in many applications, i.e., intelligent healthcare, smart hospitals, and medical monitoring devices [8,9,10].
Several biomedical devices are used in hospitals to measure and classify heart patients based on ECG signals [11,12,13]. However, there is a low accuracy of these medical devices, which represents a challenging issue. Many classical machine learning techniques were presented for the accurate classification of heart patients [14,15,16], but these techniques occasionally achieve an acceptable level of testing accuracy. Deep learning models, for example, Vision Transformer, VGG-19, and Swin-T, introduce robust solutions to solve the issue of low accuracy [17,18,19]. These models are effective in different applications, e.g., electrocardiogram prediction [20] and photoplethysmogram identification [21], and are applicable for classifying heart patients.
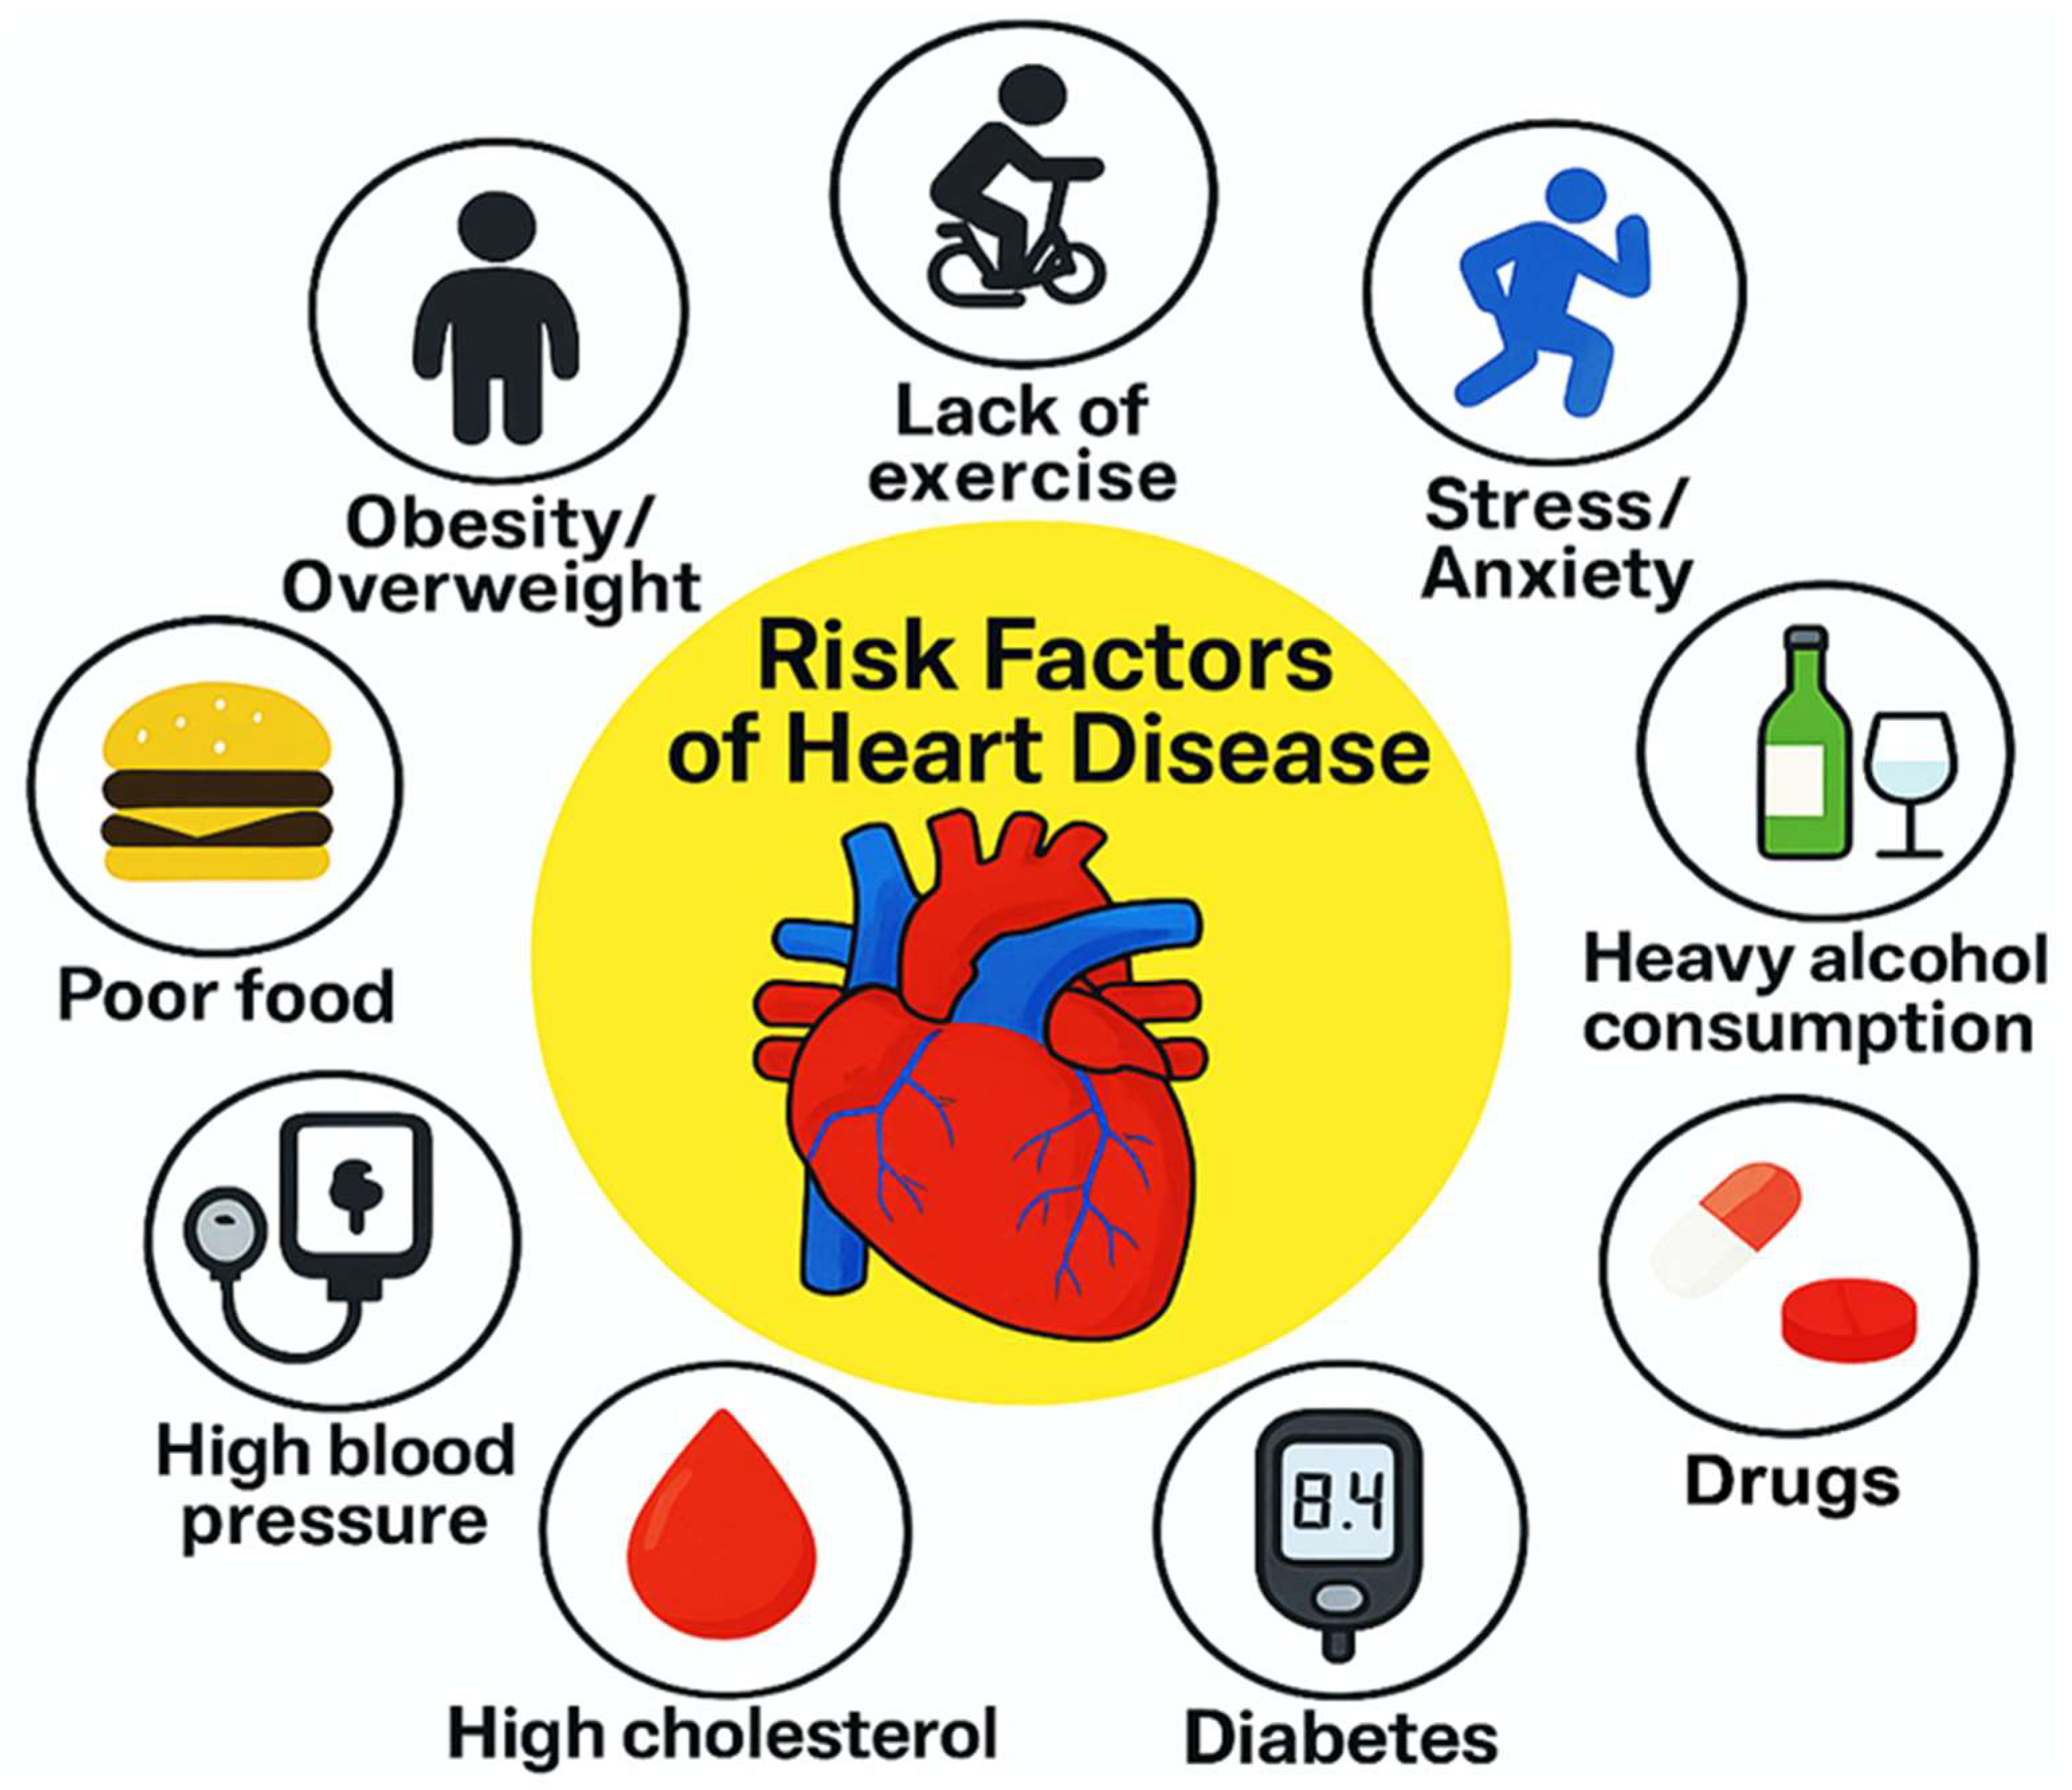
Figure 1 shows the main risk factors for heart disease [22] and emphasizes how some lifestyle choices and medical disorders can raise the possibility of acquiring cardiovascular problems. Nine main risk factors are shown here. First of all, one of the main issues is either being overweight or obese. Excess weight causes extra stress on the heart, raises blood pressure and cholesterol levels, and usually results in other problems, including diabetes—all of which greatly increase the risk of heart disease. Another important element is a lack of physical activity. A sedentary lifestyle weakens cardiovascular fitness, leads to weight gain, and disrupts the body’s metabolism, all of which contribute to heart-related issues. Stress and anxiety also play a major role. Ongoing emotional stress can elevate blood pressure and promote unhealthy habits such as overeating or smoking, while also potentially disrupting normal heart rhythms. Excessive alcohol use can harm the heart by increasing blood pressure and causing irregular heartbeats. Excessive drinking can raise the risk of stroke or cause heart failure over time. There are significant risks to one’s heart health when using drugs, particularly recreationally. These substances can raise heart rate and blood pressure rapidly and may cause direct damage to heart tissue.
Diabetes, shown with a glucose monitor, is another major risk factor. High blood sugar can damage the blood vessels and nerves that support heart function, making people with diabetes more vulnerable to heart disease. High cholesterol, depicted as a drop in blood, can cause fatty deposits to accumulate in the arteries. This restricts blood flow, which increases the chances of a heart attack or stroke. High blood pressure (BP) forces the heart to work harder over time. This extra effort can weaken the heart and damage vessels, leading to serious cardiovascular conditions. Finally, poor dietary habits are a major contributor. Diets high in unhealthy fats, salt, and sugar promote weight gain, raise cholesterol and BP levels, and increase the overall risk of heart disease. Therefore, there are many heart disease risks linked to lifestyle that can be managed or prevented through healthier choices [22].
This paper presents a classification approach to categorize heart patients into three distinct categories. It is based on ECG signal images obtained from the utilized dataset and employs three deep learning (DL) models: Swin-T, VGG-19, and ViT. The performance of these models is evaluated using multiple metrics. The objective of this paper is to enhance the testing accuracy of the three DL models via fine-tuning for some hyperparameters. Therefore, the purpose of the models’ development is to attain excellent accuracy in classifying three cases of heart patients. The models are learned on balanced ECG images using the Kaggle environment [23], and these data are preprocessed by applying data augmentation.
The main contributions of this article are the following:
  • Proposing Swin-T, VGG-19, and ViT models to classify different types of heart patients based on ECG Images.
  • Developing a smart web application integrated with the three models based on a dash framework for heart patients’ prediction.
  • Achieving maximum classification accuracy of the three models based on fine-tuning for particular hyperparameters using a grid search technique with training on a high graphics processing unit (GPU).
  • Applying different data augmentation techniques as a preprocessing step to improve the performance of the generalization phase for the models.
  • Evaluating the performance of the three proposed models according to the testing dataset, using several evaluation measurements such as the normalized confusion matrix (NCM), TPR, and AUPR curves.
  • Comparing the findings obtained from the models for heart patients’ classification against various state-of-the-art (SOTA) models.
The structure of the article is as follows: Section 2 reviews related works, while Section 3 outlines the proposed methodology, including the three architectures of the three models and the used dataset for classification. Section 4 explains the several evaluation metrics for the performance of the three models. The results are illustrated in Section 5. Section 6 presents the discussion of the results obtained based on different experiments. Finally, a conclusion is presented in Section 7.

2. Related Works

In the literature, several models were presented to classify heart diseases [24,25,26,27,28,29,30,31,32,33,34,35,36,37]. In ref. [24], Yahya and Edan focused on the development of a heartbeat classification system from adult ECGs using machine learning and deep learning techniques. Machine learning models like Random Forest achieved 96.08% accuracy, while deep learning models, particularly the hybrid LSTM-CNN with Adam activation and a kernel size of 5, reached the highest accuracy of 98.75%. The choice of kernel size and activation function significantly impacted model performance, and deep learning approaches outperformed traditional ML methods in both accuracy and stability.
Hasan et al. [25] proposed a prediction of four cardiovascular abnormalities using a lightweight CNN for feature extraction and an optimized weighted ensemble model for classification. The proposed model achieved the highest accuracy of 99.29% on real ECG datasets, outperforming traditional transfer learning models. The ensemble of GNB, DT, XGB, and RF classifiers significantly improved performance, demonstrating the model’s effectiveness for accurate and scalable CVD detection.
The authors of [26] applied an improvement of ECG-based CVD classification using a hybrid CNN-VAE model trained on the PTB-XL dataset. This technique reached an accuracy of 98.51%, outperforming traditional deep learning models, and showed strong potential for early CVD detection through automatic feature extraction and interpolation.
According to [27], the study presented early heart disease detection using a Keras-based deep learning model with dense neural networks tested across multiple heart disease datasets. The proposed model achieved higher specificity compared to ensemble methods, demonstrating deep learning’s effectiveness for precise heart disease diagnosis.
In ref. [22], the authors focused on early heart disease prediction through the development of a Hybrid Deep Neural Network (HDNN) combining CNN, LSTM, and dense layers. Tested on Cleveland and comprehensive HD datasets, the proposed model achieved superior performance, with the highest accuracy of 98.86%, outperforming traditional ML and existing deep learning methods.
The authors of ref. [28] developed a heart disease classification approach using a Deep Jordan Recurrent Neural Network (DJRNN), combining ECG and PCG signals with advanced noise removal and feature selection techniques. The proposed model achieved 97.33% classification accuracy, demonstrating superior performance in recall, clustering accuracy, and noise robustness across diverse datasets.
The review in ref. [29] explored the evolution of deep learning, particularly CNNs, RNNs, and hybrid models, to enhance ECG-based cardiovascular health monitoring and authentication. It highlighted improvements in diagnostic accuracy, real-time processing, and privacy, while also addressing challenges like dataset limitations and EHR integration, offering future directions for advancing clinical applications.
In ref. [30], Lee and Kim proposed a single-lead ECG measurement system integrated into a vehicle’s steering wheel and developed an algorithm to ensure stable signal acquisition under noisy conditions. Using a two-stage machine learning structure with optimized feature selection, the system classified heart conditions in real-time with a robust performance, reaching an F1-score of 0.7898 and fast prediction times, demonstrating its potential for daily heart health monitoring in vehicles.
In ref. [31], the authors implemented a method combining Particle Swarm Optimization (PSO)-based feature selection with ML classifiers for efficient ECG classification in IoT-enabled, 5G-powered health monitoring systems. The approach reduced ECG dataset dimensionality, improving classification accuracy to 98% with PSO-SVM, outperforming existing methods. It demonstrated enhanced computational efficiency, making it suitable for real-time, resource-constrained environments like remote cardiac health monitoring.
The study in ref. [32] introduced a hybrid machine learning approach, Hybrid RF with a Linear Model (HRFLM), to predict heart disease by processing raw healthcare data. The model achieved an accuracy of 88.7%, improving prediction performance by combining the strengths of Random Forest and Linear methods. It highlighted the potential of ML in early heart disease prediction and emphasized the need for further research using real-world datasets and advanced feature selection techniques to enhance prediction accuracy.
As noted in ref. [33], the study enhanced arrhythmia detection using a deep learning model optimized by Cephalous Wolf Optimization (CWO opt NN). It processed ECG signals, applying feature extraction techniques to improve accuracy. The model achieved high detection efficiency with an F1-score of 96.10%, precision of 97.08%, and recall of 95.14% at an 80% training percentage, and similar results with an 8-fold cross-validation.
A. Ahmad [34] introduced a DL deep learning model combining CNNs to extract spatial features and XGBoost for prediction to improve heart failure (HF) detection from ECG data. The model achieved remarkable performance, with an average accuracy of 99.95% using 2 s ECG segments. This approach outperformed CNN-only models, demonstrating its potential for enhanced clinical applications in automatic HF detection.
As reported in ref. [35], the study proposed a DL technique utilizing 1D convolutional layers and fully connected layers to classify ECG, aiming to overcome the limitations of traditional ML methods that rely on hand-crafted features. This technique provided a maximum accuracy of 86% on validation data, demonstrating its effectiveness for unstructured and unbalanced ECG data without feature engineering. Future improvements could include enhanced preprocessing and dataset balancing techniques, like GAN networks, to increase classification accuracy.
According to ref. [36], the study introduced a wearable ECG monitoring system enhanced with ML to predict cardiovascular diseases. The system, built on ADS1298 and STM32L151XD, included real-time ECG data transmission, signal filtration, and anomaly detection using ML algorithms. A comparative analysis of various methods revealed that CNNs achieved 92.6% accuracy in predicting cardiac diseases. While effective in detecting ECG abnormalities, the system still needs further refinement to differentiate between types of heart diseases for broader clinical application. In ref. [37], L. Ma and F. Zhang presented a novel real-time detection and classification method for ECG signal images based on deep learning. K. Fatema et al. [38] proposed a robust framework combining image processing and a deep learning hybrid model to classify cardiovascular diseases using complex ECG images. A. Staffini et al. [39] designed a VAE-BiLSTM Model for heart rate anomaly detection.
Although the previously mentioned methods demonstrated essential research efforts into classifying types of heart diseases based on the various datasets used, challenges and enhancements are still required for more effective and accurate approaches.

3. Methodology

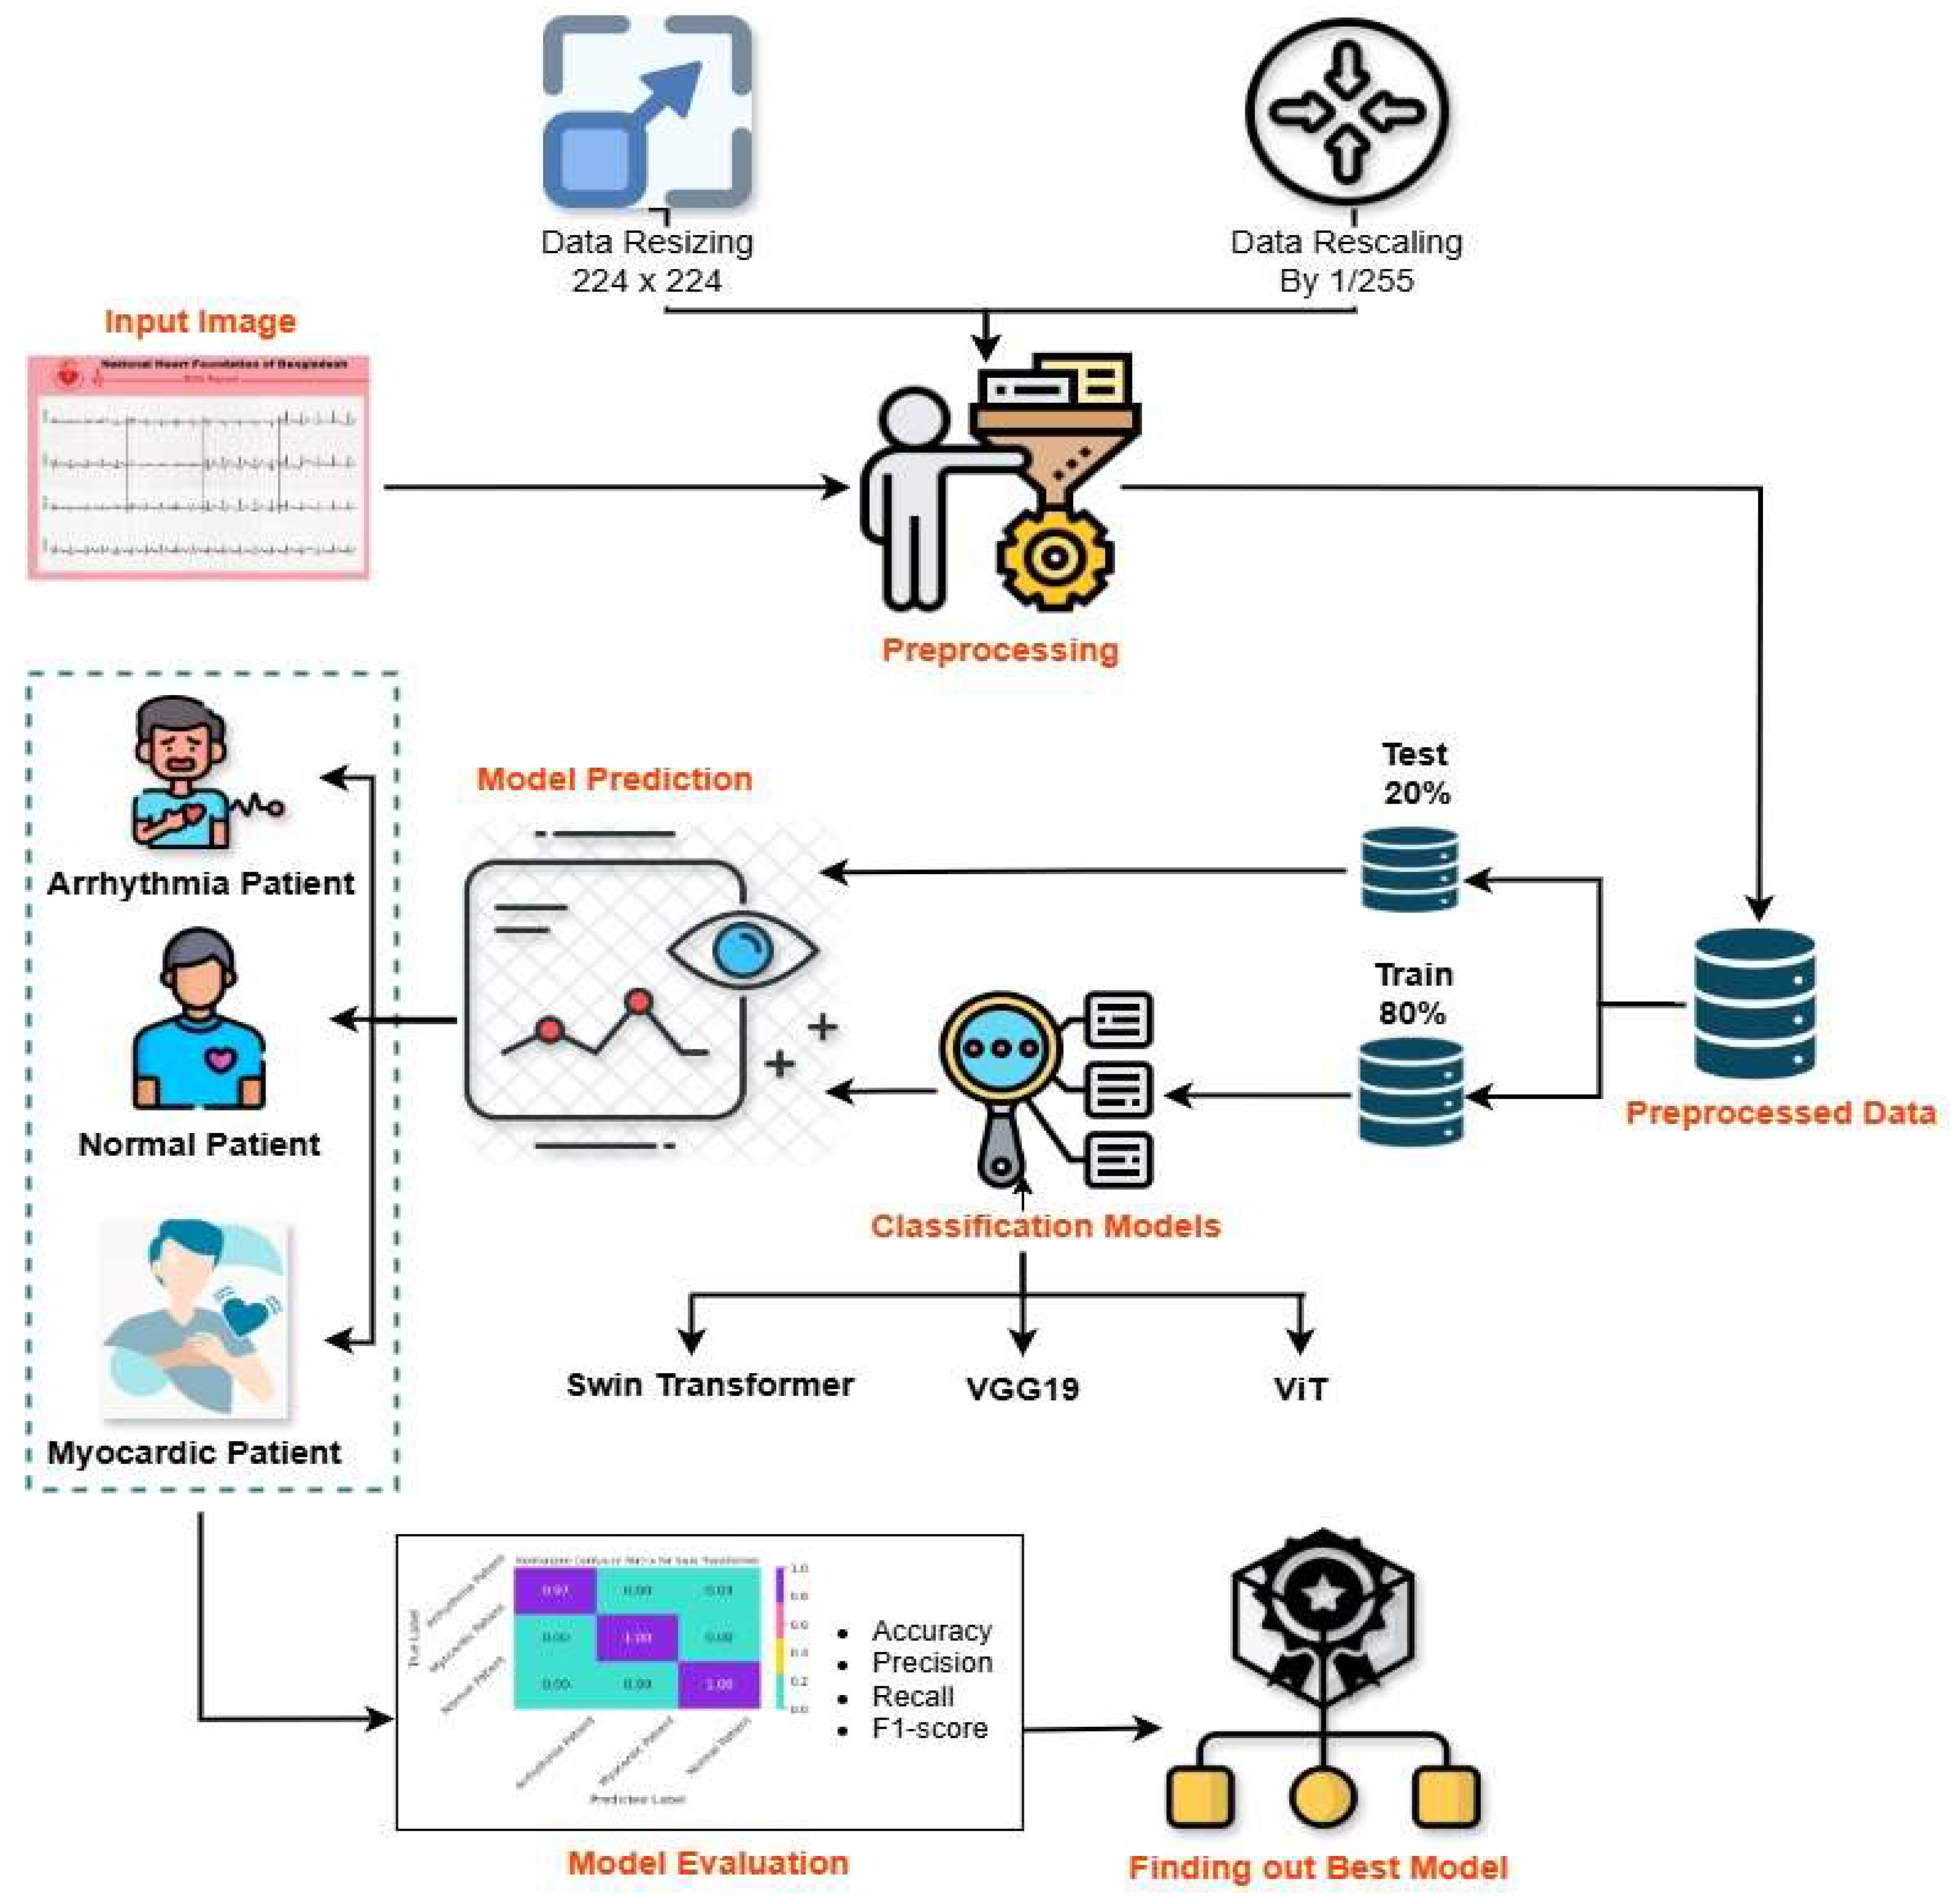
In this section, three different DL models: Swin-T, VGG-19, and ViT are presented to classify heart patients based on the electrocardiogram (ECG) images dataset. Figure 2 illustrates a complete workflow for classifying three categories using the proposed three DL models. It demonstrates a structured and effective approach to leveraging AI for medical ECG image processing and analysis, offering a valuable tool in modern healthcare diagnostics. The process begins with the collection of raw ECG images, which serve as the input data for the classification pipeline. Before these images can be used for model training, they must undergo preprocessing. This involves two main steps: resizing and rescaling. Each ECG image is resized to a standard resolution of 224 × 224 pixels, which ensures consistency across the dataset and compatibility with the models’ architecture. Then, the pixel values are rescaled by dividing each by 255, which normalizes the data into a range between 0 and 1. This normalization step is applied to improve models’ performance and convergence during training. The resized and normalized images are then saved as preprocessed data for training and evaluation.
Once the preprocessing techniques are complete, the preprocessed data is split into two subsets: 80% of the data is applied for learning classification models, while 20% is reserved to test the performance. This separation is critical to evaluate the generalization ability of the models on unseen data. The training data are fed into three different DL models: Swin-T, VGG19, and ViT. These models are convenient for learning the complex features of image datasets. Each model represents a different approach to image classification—VGG19 is a known type of pre-trained network, which is derived from a classical convolutional neural network, while the Swin-T and ViT are both transformer-based architectures that have shown promising results in vision classification tasks. The Swin Transformer uses hierarchical feature maps, while the ViT processes images by converting them into patch sequences, suitable for capturing global patterns in image data.
After training, the trained models are evaluated using the test data to analyze the ECG images and generate predictions to classify ECG images into the three target categories: Arrhythmia, Normal, or Myocardial (Myocardiac) condition. Thus, the main goal is to determine whether a patient falls into one of these three categories. The performance of each model is assessed based on several key metrics, e.g., accuracy and F1-score. These metrics are calculated via a confusion matrix, which provides insights into how well the model is performing in each class.
Finally, the best-performing model is selected based on the evaluation results among the three (Swin-T, VGG19, and ViT). This chosen model is expected to provide the most reliable and accurate classifications and can be used in real-world applications to assist healthcare professionals in diagnosing heart conditions from ECG reports.

3.1. The Proposed Swin-T Model

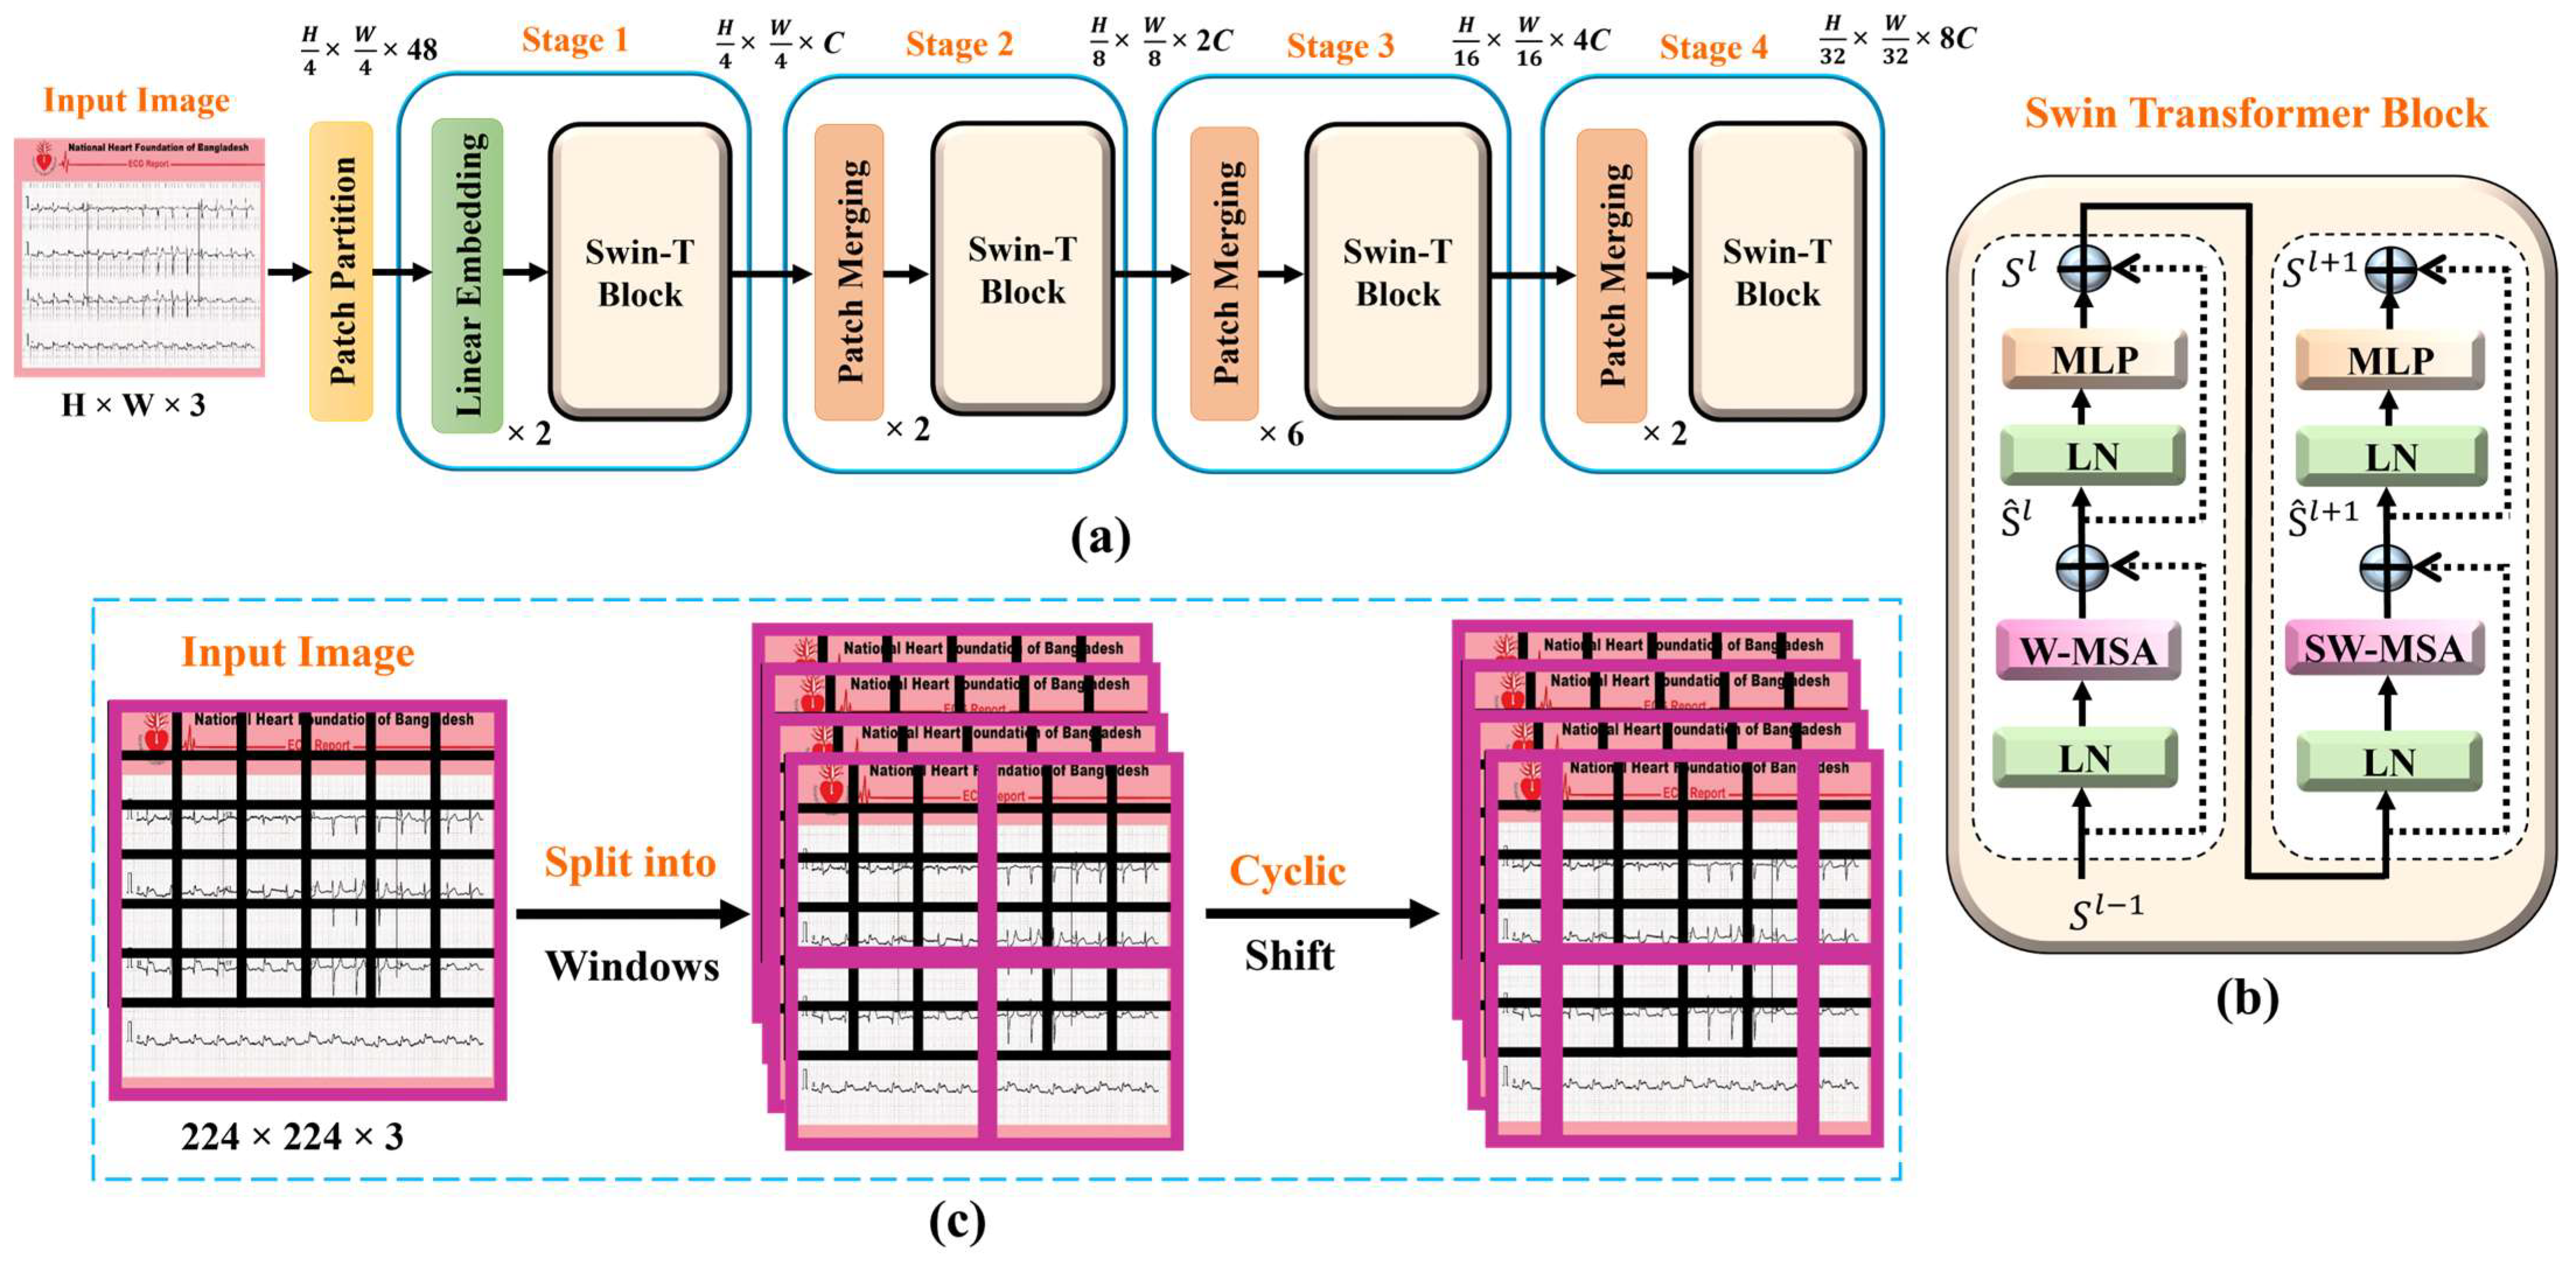
Figure 3a provides an overview of the Swin Transformer (Swin-T) architecture used in this study. The workflow begins with a medical input image, which is first divided into small, non-overlapping patches through a patch partitioning step. Each patch is then flattened and passed through a linear embedding layer, converting raw pixel values into numerical feature vectors suitable for transformer-based processing. These embedded patches act as the initial input tokens to the Swin-T network. The architecture is composed of four hierarchical stages, each containing a Swin-T Block.
Followed by a patch merging module. The Swin-T Block applies self-attention within local windows rather than across the entire image, enabling efficient processing of high-resolution inputs. Patch merging progressively reduces spatial resolution while increasing feature dimensionality, functioning similarly to pooling operations in CNNs but using learnable transformations. As the network progresses from Stage 1 to Stage 4, it extracts increasingly abstract representations, analogous to deeper layers in CNNs. Ultimately, Stage 4 captures high-level semantic information necessary for the final classification task.
Figure 3b illustrates the internal structure of a Swin-T Block, which consists of two consecutive attention sub-blocks. The first uses window-based multi-head self-attention (W-MSA), where attention is restricted to fixed, non-overlapping windows (e.g., 7 × 7). This significantly reduces computational costs compared with global self-attention. The second sub-block employs shifted window multi-head self-attention (SW-MSA), where the window positions are shifted between layers. This shift enables interactions across adjacent windows, addressing the limitation of W-MSA, which cannot inherently capture cross-window dependencies.
Both attention mechanisms are wrapped with Layer Normalization (LN) and a Multi-Layer Perceptron (MLP), and each sub-block includes a residual connection to stabilize and deepen training. The MLP typically consists of two fully connected layers with a GELU activation, enabling the model to learn non-linear transformations. The mathematical operations for feature extraction across consecutive Swin-T Blocks are defined in Equations (1)–(4), where Sl+1 and Sl denote the outputs of W-MSA and SW-MSA (including their MLP layers), respectively. By combining W-MSA and SW-MSA, the Swin-T Block effectively captures both local details and long-range dependencies while maintaining computational efficiency. This dual-attention design is a key innovation of the Swin Transformer, supporting its scalability to high-resolution images and strong performance across vision tasks. Consequently, the Swin-T architecture is well-suited for ECG analysis, offering a hierarchical, efficient, and powerful approach for modeling both local structural information and broader contextual patterns.
S l = M L P L N   Ŝ l + Ŝ l
S l + 1 = M L P L N   Ŝ l + 1 + Ŝ l + 1
Ŝ l = W M S A ( L N (   S l 1 ) ) + S l 1
Ŝ l + 1 = SW M S A ( L N (   S l 1 ) + S l 1 )
Figure 3c presents two key visualization concepts used in the Swin-T architecture: window partitioning and window shifting. These mechanisms are central to the network’s efficiency and strong performance in visual classification tasks. Initially, the input image related to heart disease is divided into small, non-overlapping square patches. These patches are then processed using a cyclic shifting strategy, in which the window positions are shifted between layers. This shifting enables each patch to interact with neighboring patches across window boundaries during the SW-MSA operation. As a result, the model gradually establishes connections between different regions of the image across layers, effectively overcoming the limitations of fixed, isolated windows and enhancing the network’s ability to capture long-range dependencies.
The term “cyclic” refers to the padding technique used to maintain window alignment after shifting, ensuring that all shifted windows stay within the original image boundaries. Swin-T, as a hierarchical Vision Transformer, leverages this shifted window-based attention mechanism to combine the strengths of localized self-attention with multi-scale feature extraction. This design allows the network to efficiently process high-resolution images—an essential requirement in medical imaging—while still capturing both fine-grained local patterns and broader contextual information.
Overall, the Swin-T architecture offers an effective balance between computational efficiency and representational power. Its ability to model local and global structures makes it a compelling alternative to traditional CNN-based approaches, particularly for medical image analysis and heart disease interpretation.
The settings of the Swin-T model are selected with the Adam optimizer, while the cost function is set to cross-entropy loss, and the learning rate of this model is 0.00001 with training epochs of 20. Also, the batch size is chosen to be 32 with shuffling of the data. The trainable parameters of the Swin-T model are 27,521,661, which consumed a training time of 552.16 s. and a prediction time of 7 s.

3.2. The Proposed VGG-19 Model

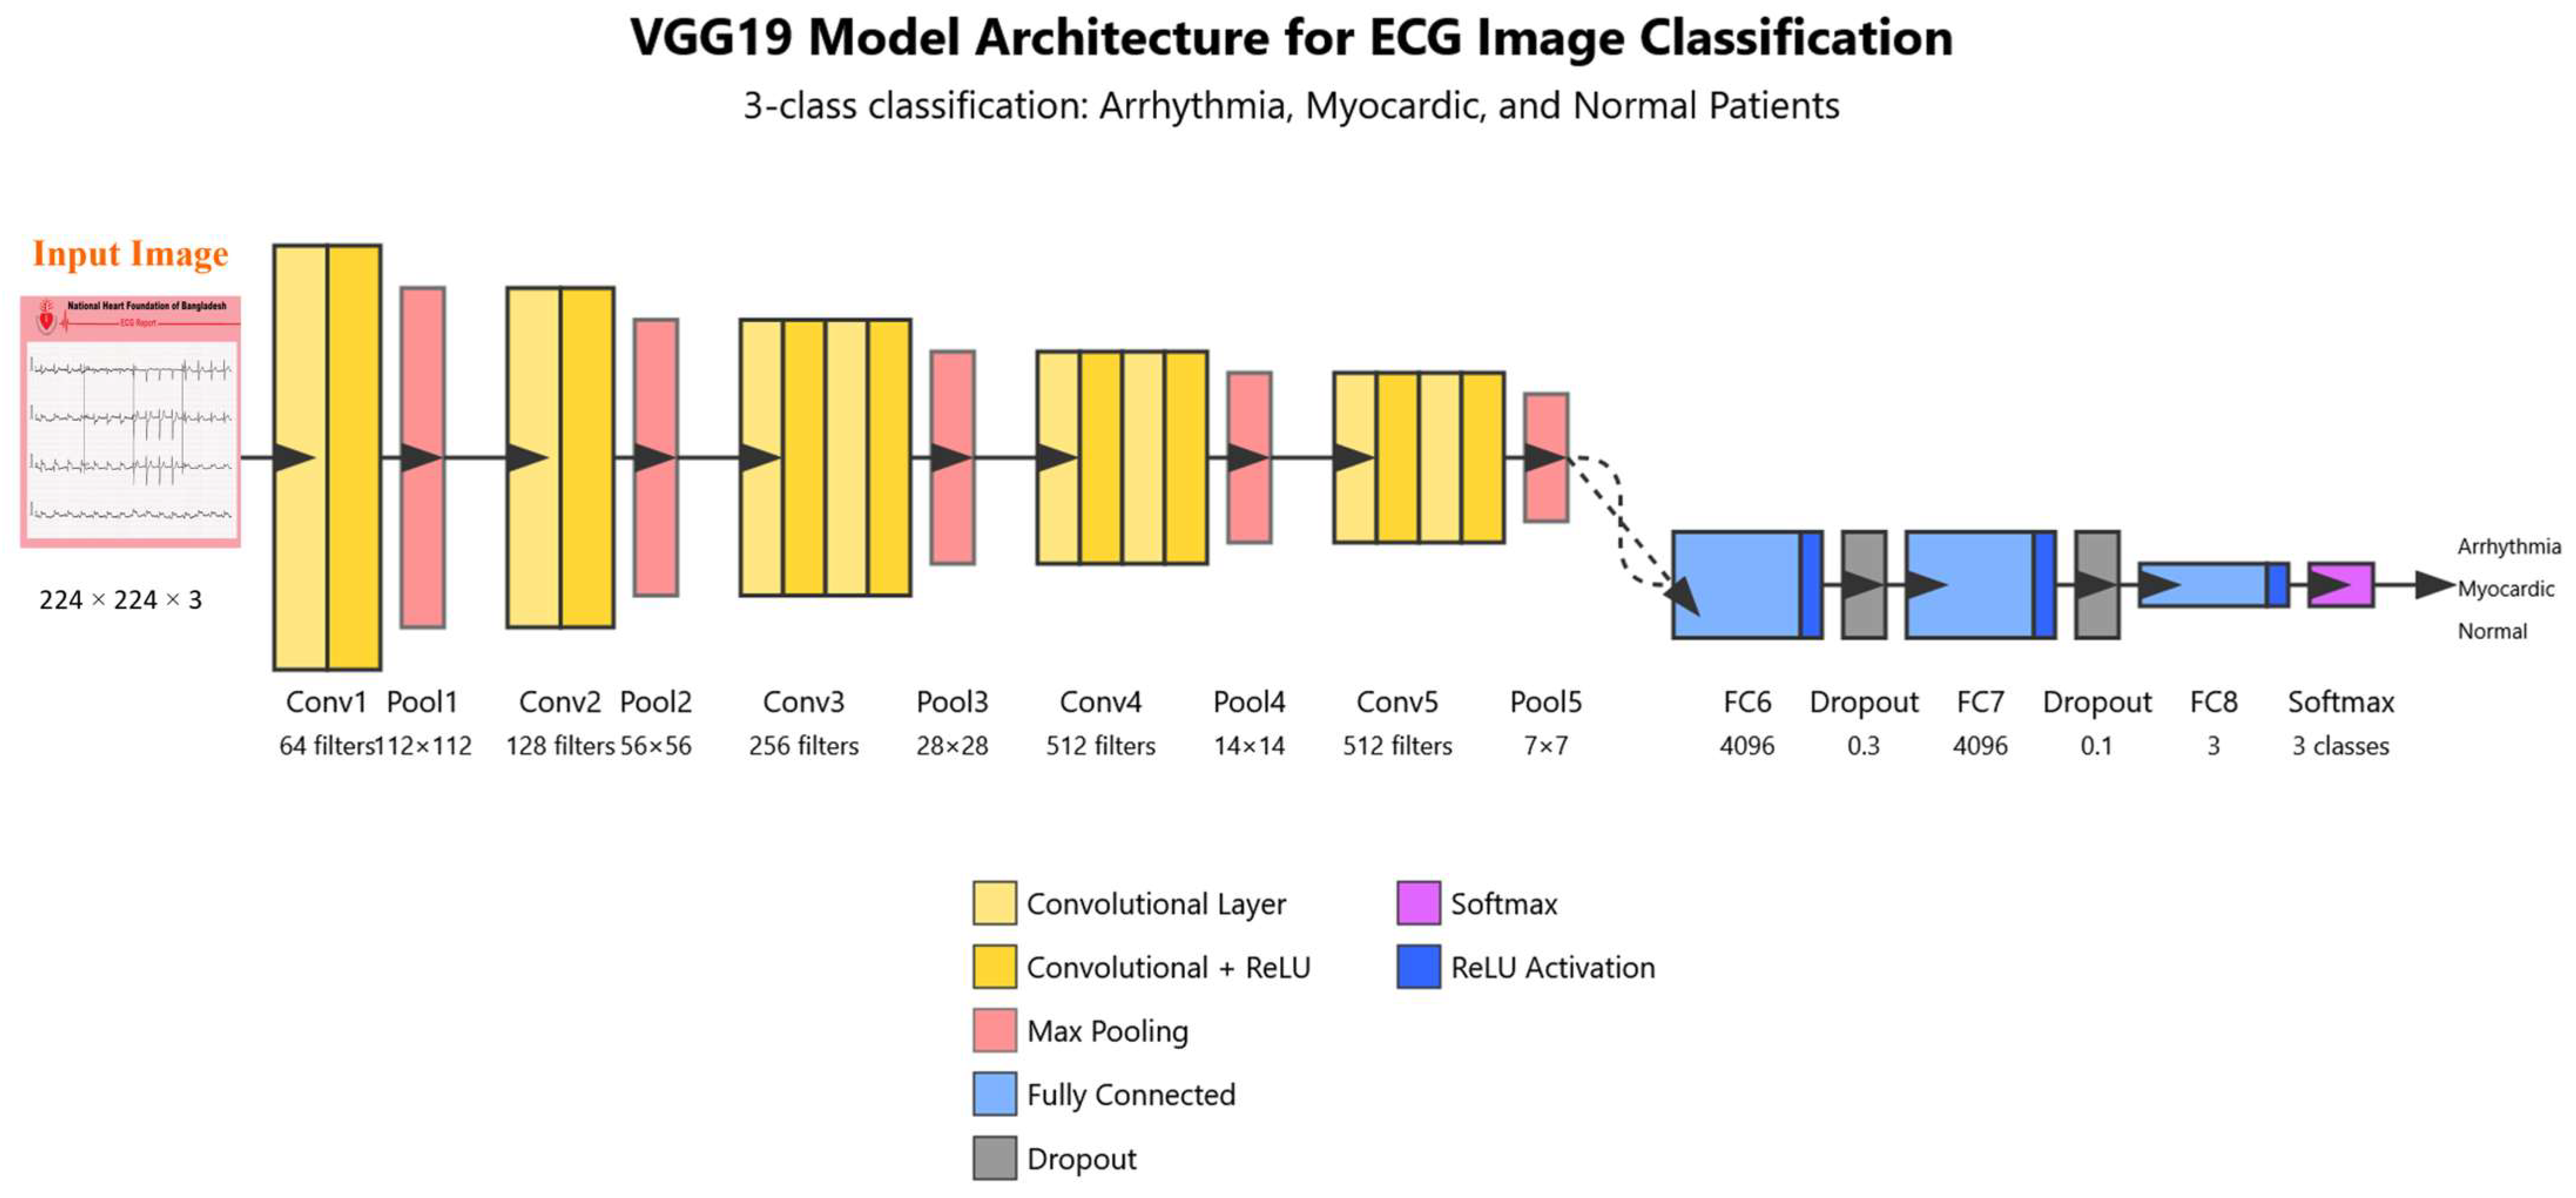
Figure 4 illustrates the VGG-19 architecture designed to classify three cases of heart patients. It includes nineteen layers: sixteen convolutional and three fully connected. This model begins with an input layer; it is applied to receive the raw image data. This layer does not perform any computations for the model’s weights, but it acts as the entry point, passing the images forward to the subsequent layers for processing. Following the input layer, the model comprises multiple convolutional layers (CLs) interleaved with Rectified Linear Unit (ReLU) activations, which are highlighted in yellow. These CLs are a highly structured pattern using small 3 × 3 convolution filters throughout and are utilized to extract important features from the input image, such as edges, textures, shapes, and higher-level patterns. The convolution operation involves sliding filters over the input to produce feature maps. The ReLU activation introduces non-linearity, enabling the model to learn complex patterns rather than just linear relationships. The first two convolutional layers each have 64 filters.
Interspersed throughout the convolutional layers are several max-pooling layers, shown by the pink color. These layers are applied to reduce the spatial dimensions (width and height) of the feature maps by a factor of two, which decreases the computational complexity and helps prevent overfitting. The max-pooling operation works by selecting the maximum value from a set of values within a specified window; the pool size is 2 × 2. This operation retains the most important features while discarding redundant information. Then, the number of filters is increased to 128 with the other two consecutive 3 × 3 convolutional layers.
The repetition of convolution layers allows the model to capture more complex and abstract features at higher levels. Then, four convolutional layers with 256 filters each, to obtain a deeper model’s capacity to learn intricate spatial hierarchies. Then, four convolutional layers with 512 filters for deeper capacity. These layers are particularly useful for learning high-level semantic features in the input data. This hierarchical pattern of increasing depth and complexity is effective in visual classification tasks.
Finally, the VGG-19 model transitions from convolutional layers to three fully connected (FC) layers. We see the first two fully connected layers with ReLU activations, which are highlighted in blue; each layer contains 4096 neurons. These layers are employed to connect every neuron in the previous layer to every neuron in the current layer, allowing the model to combine features learned in earlier layers and make more abstract decisions. The ReLU activation continues to add non-linearity at this stage, enhancing the network’s decision-making capability.
The last layer is the output, which is integrated with a softmax activation to classify the three classes, as shown by the purple color. This layer is applied to convert the outputs into probabilities, corresponding to three different classification classes: Arrhythmia, Myocardic, and Normal. The highest probability for a class is chosen as the final prediction.
The trainable parameters of the VGG-19 model are 28,577,283, which consumed a training time of 314.01 s and a prediction time of 5 s. Overall, this model is a powerful feature extractor and classifier, and its deep structure makes it suitable for applications based on ECG medical images.
Table 1 presents the selected hyperparameters for the proposed VGG-19 model. The learning rate is initially set to 0.0001, while the training iterations are set to 20 epochs, and the batch size is set to 32. To optimize this model, an Adaptive Moment Estimation (Adam) algorithm is applied to obtain the best weight values during the training phase, therefore minimizing the loss of the model, which is calculated via the difference between the true and predicted output values. We selected this algorithm due to its speed in the training phase and its high performance [40]. It is computed via Equation (5). The cost function is set to categorical cross-entropy loss L, which is calculated using Equation (6).
θ t + 1 = θ t η × m ^ t v ^ t + ε
L = 1 N i = 1 N k = 1 K y k i l o g 2 y ^ k i + 1 y k i log 2 1 y ^ k i
For this model, a data augmentation technique is implemented to extend the number of images during training. Also, a dropout layer is utilized to overcome the overfitting issue. This dropout is configured with a rate of 0.1.

3.3. The Proposed ViT Model

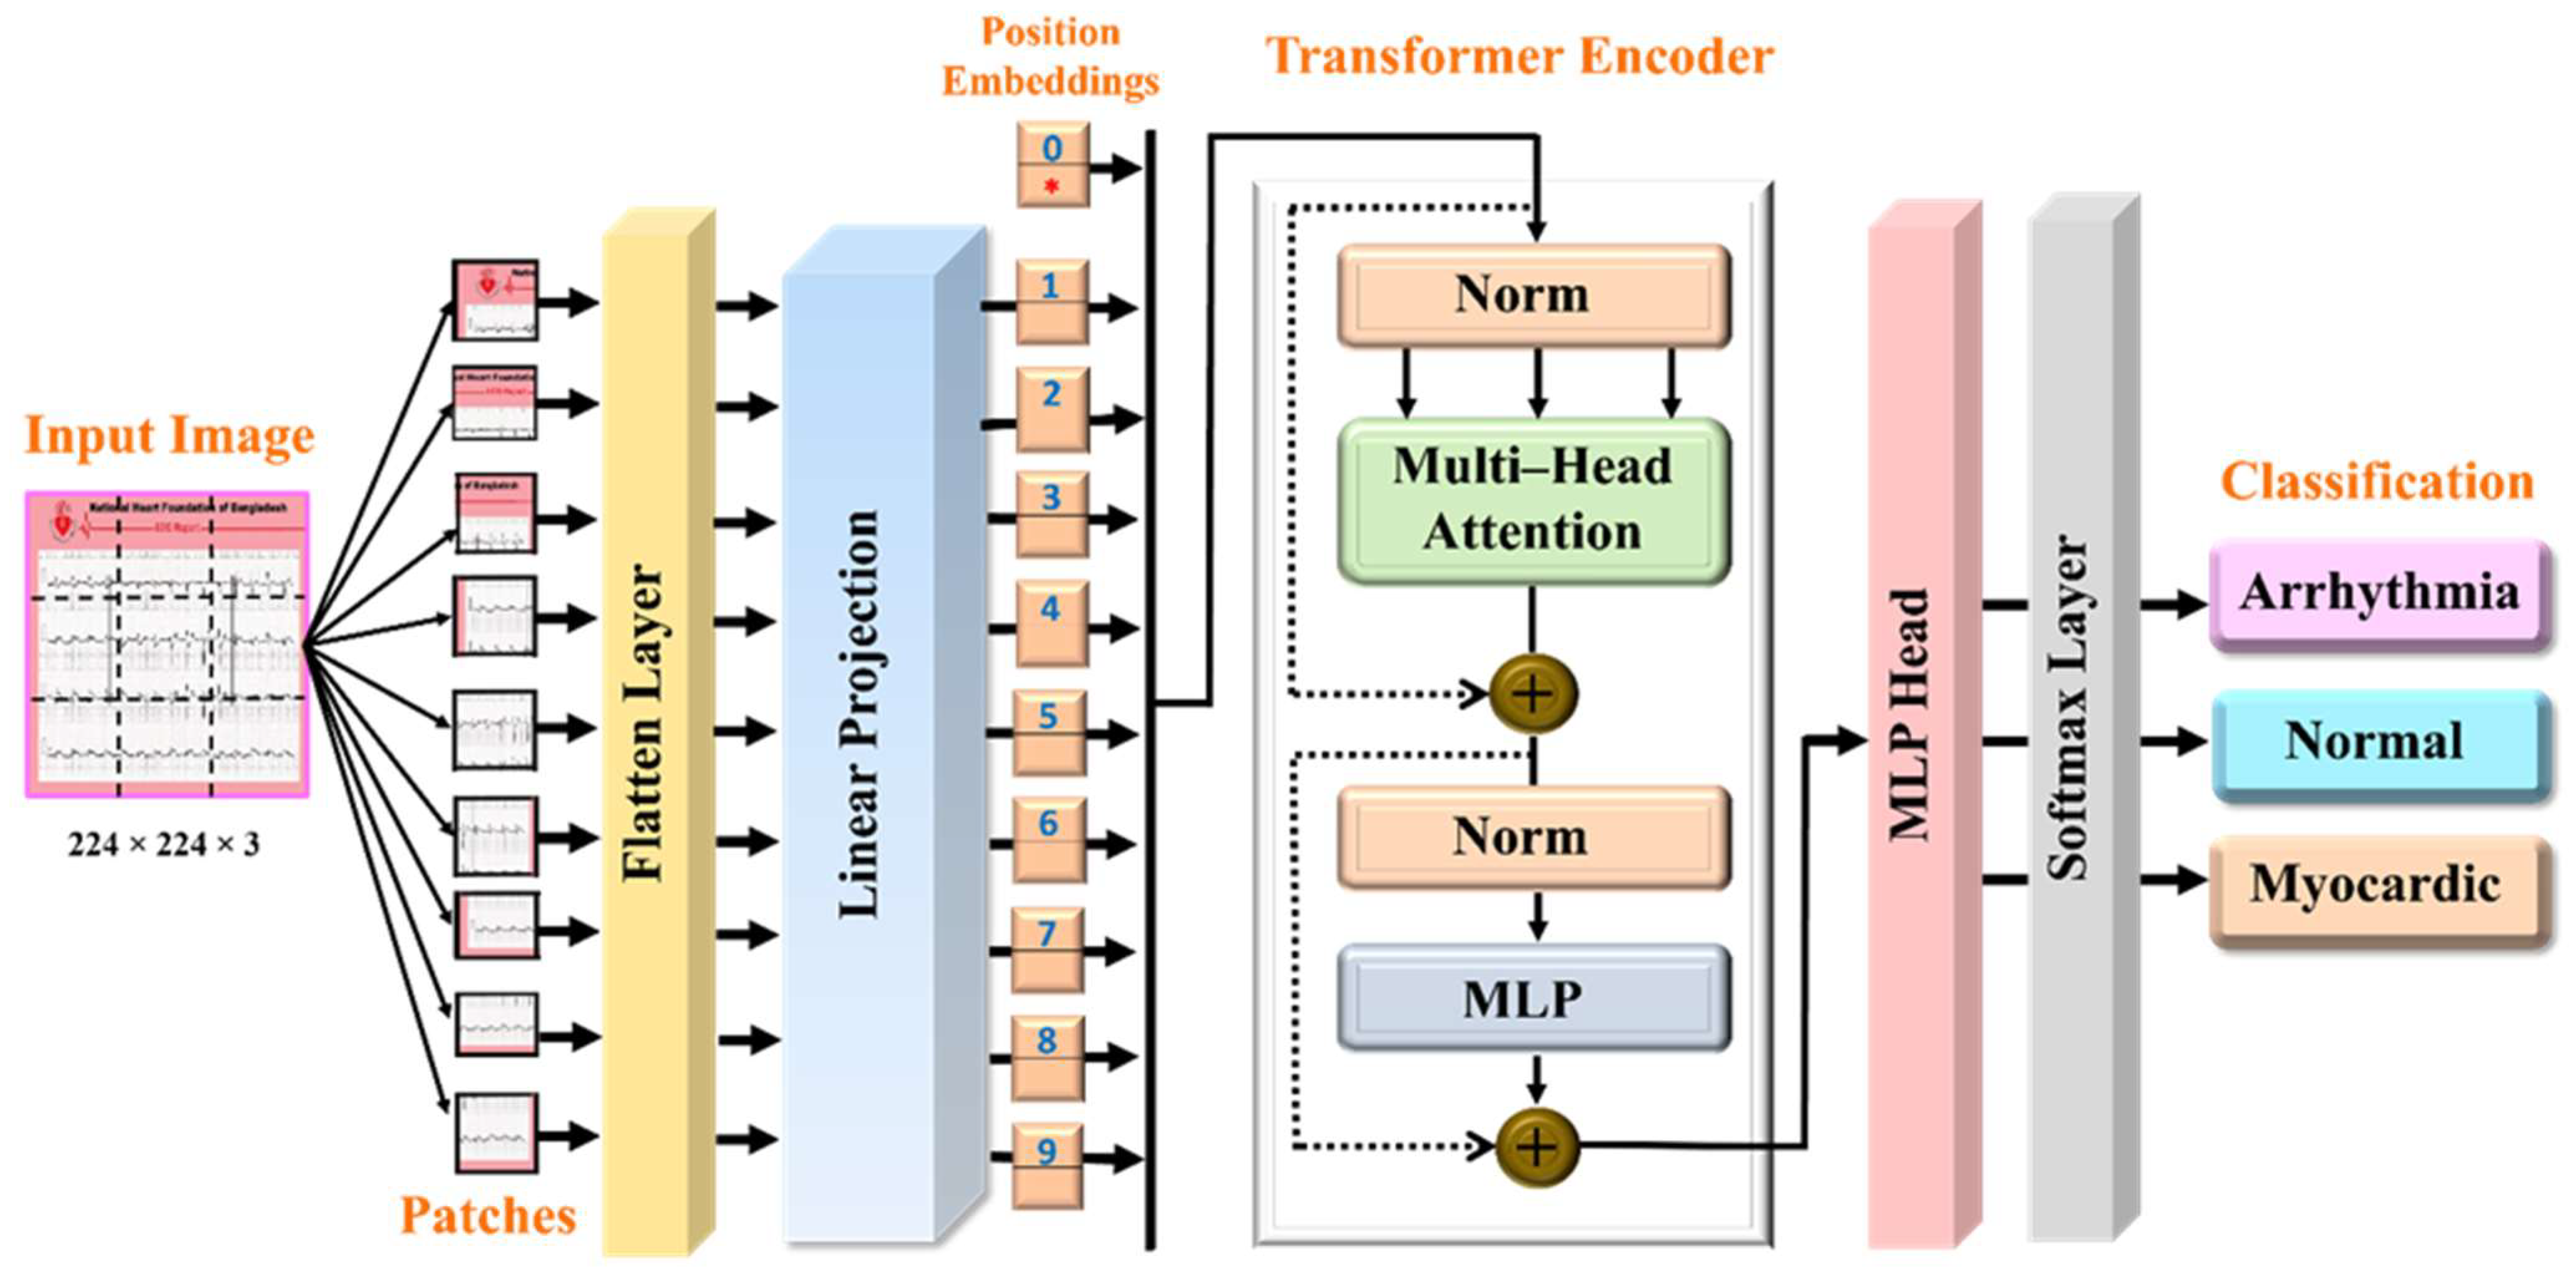
Figure 5 illustrates the proposed Vision Transformer (ViT) architecture, which is used to classify ECG images into three medical categories: Arrhythmia, Normal, and Myocardic “Myocardial infarction”. The process includes several steps, which begin with the input of an ECG report image, which has a size of H × W, here, (224 × 224), and contains graphical representations of heart activity. The first step in the process involves dividing the input image into a number of small sections known as patches that have size P × P. For this architecture, we selected 196 patches that have a smaller fixed size than the input ECG image, which is 16 × 16, where the number of patches N is calculated via Equation (7).
N = H × W P 2
Initially, each patch is processed like a “token” in language models, capturing a specific portion of the image. Then, these image patches are passed through a flattening layer, which converts the 2D small image data into 1D vectors to be suitable for further processing. Then, each flattened patch undergoes a linear projection as a dense layer that transforms each 1D vector into a fixed-size embedding. This dense layer is used to reduce dimensions to represent important features, while these embeddings are employed as inputs to the transformer encoder.
To retain spatial information, which is inherently lost when an image is split into independent patches, positional encodings are added to each patch embedding. This step allows the ViT model to understand the relative positions of each patch in the original image, ensuring that spatial relationships are preserved within the model’s attention mechanism. In other words, position embeddings are added to give the ViT model information about the order of the patches.
The important component of this model is the transformer encoder, which consists of several layers. This encoder includes a normalization layer, which is used to normalize the input for stability and faster convergence. This layer is followed by a multi-head self-attention (MSA) mechanism. This mechanism enables the ViT model to focus and attend to different patches simultaneously, capturing complex dependencies and interactions across the image. Equations (8) and (9) present the MSA and Head, respectively, as follows.
M S A Q , K , V = C o n c a t H e a d 1 , H e a d 2 , H e a d n W O
H e a d n = S e l f A t t e n t i o n ( Q . W n Q , K . W n K , V . W n V )
where the Q, K, and V represent query, key, and vector, respectively, while the WQ, WK, and WV are the corresponding weights, and n is the number of heads. The output of the self-attention “one Head” layer Z is determined from Equation (10). Where dk represents the normalization value.
Z = S o f t m a x Q K T d k V
The attention mechanism and patch-based processing of the ViT are utilized to provide an effective method for analyzing and classifying medical ECG images, potentially aiding in automated diagnosis. The output of the attention layer is added to the original input using a residual connection, promoting gradient flow during training, and adding the input of a layer to its output to help with training deeper models. Another normalization step is applied, followed by a multi-layer perceptron (MLP) that further processes the features. Another residual connection is added after this step as well. In this architecture, six transformer encoder blocks are stacked to build a deeper and more powerful model.
After passing through the transformer encoders, the output is fed into an MLP head layer, which aggregates the encoded features and prepares them for classification. The result is then passed through a softmax layer, which converts the raw output into probabilities across the target three classes. The calculation for the output of this softmax layer f(z) is calculated using Equation (11).
f ( z ) = e y i j = 0 k e y j
Finally, the ViT model produces a prediction indicating whether the input ECG image represents a case of arrhythmia, “abnormal heart rhythm”, or a normal case of “normal heart activity”, or a myocardial condition, which is called a heart attack.
The settings of the ViT model are selected with the Adam optimizer, the cost function is set to a cross-entropy loss, and the learning rate of this model is 0.00001. Also, the batch size is chosen to be 32 with shuffling of the data. The trainable parameters are 85,800,963, which consume a training time of 660.45 s. for 20 epochs and a prediction time of 10 s. The advantage of this ViT, can collect global information and complex features from the input patches, and long-range dependencies within images, which makes the model more effective for image processing [41].

3.4. The Proposed Smart Web Application

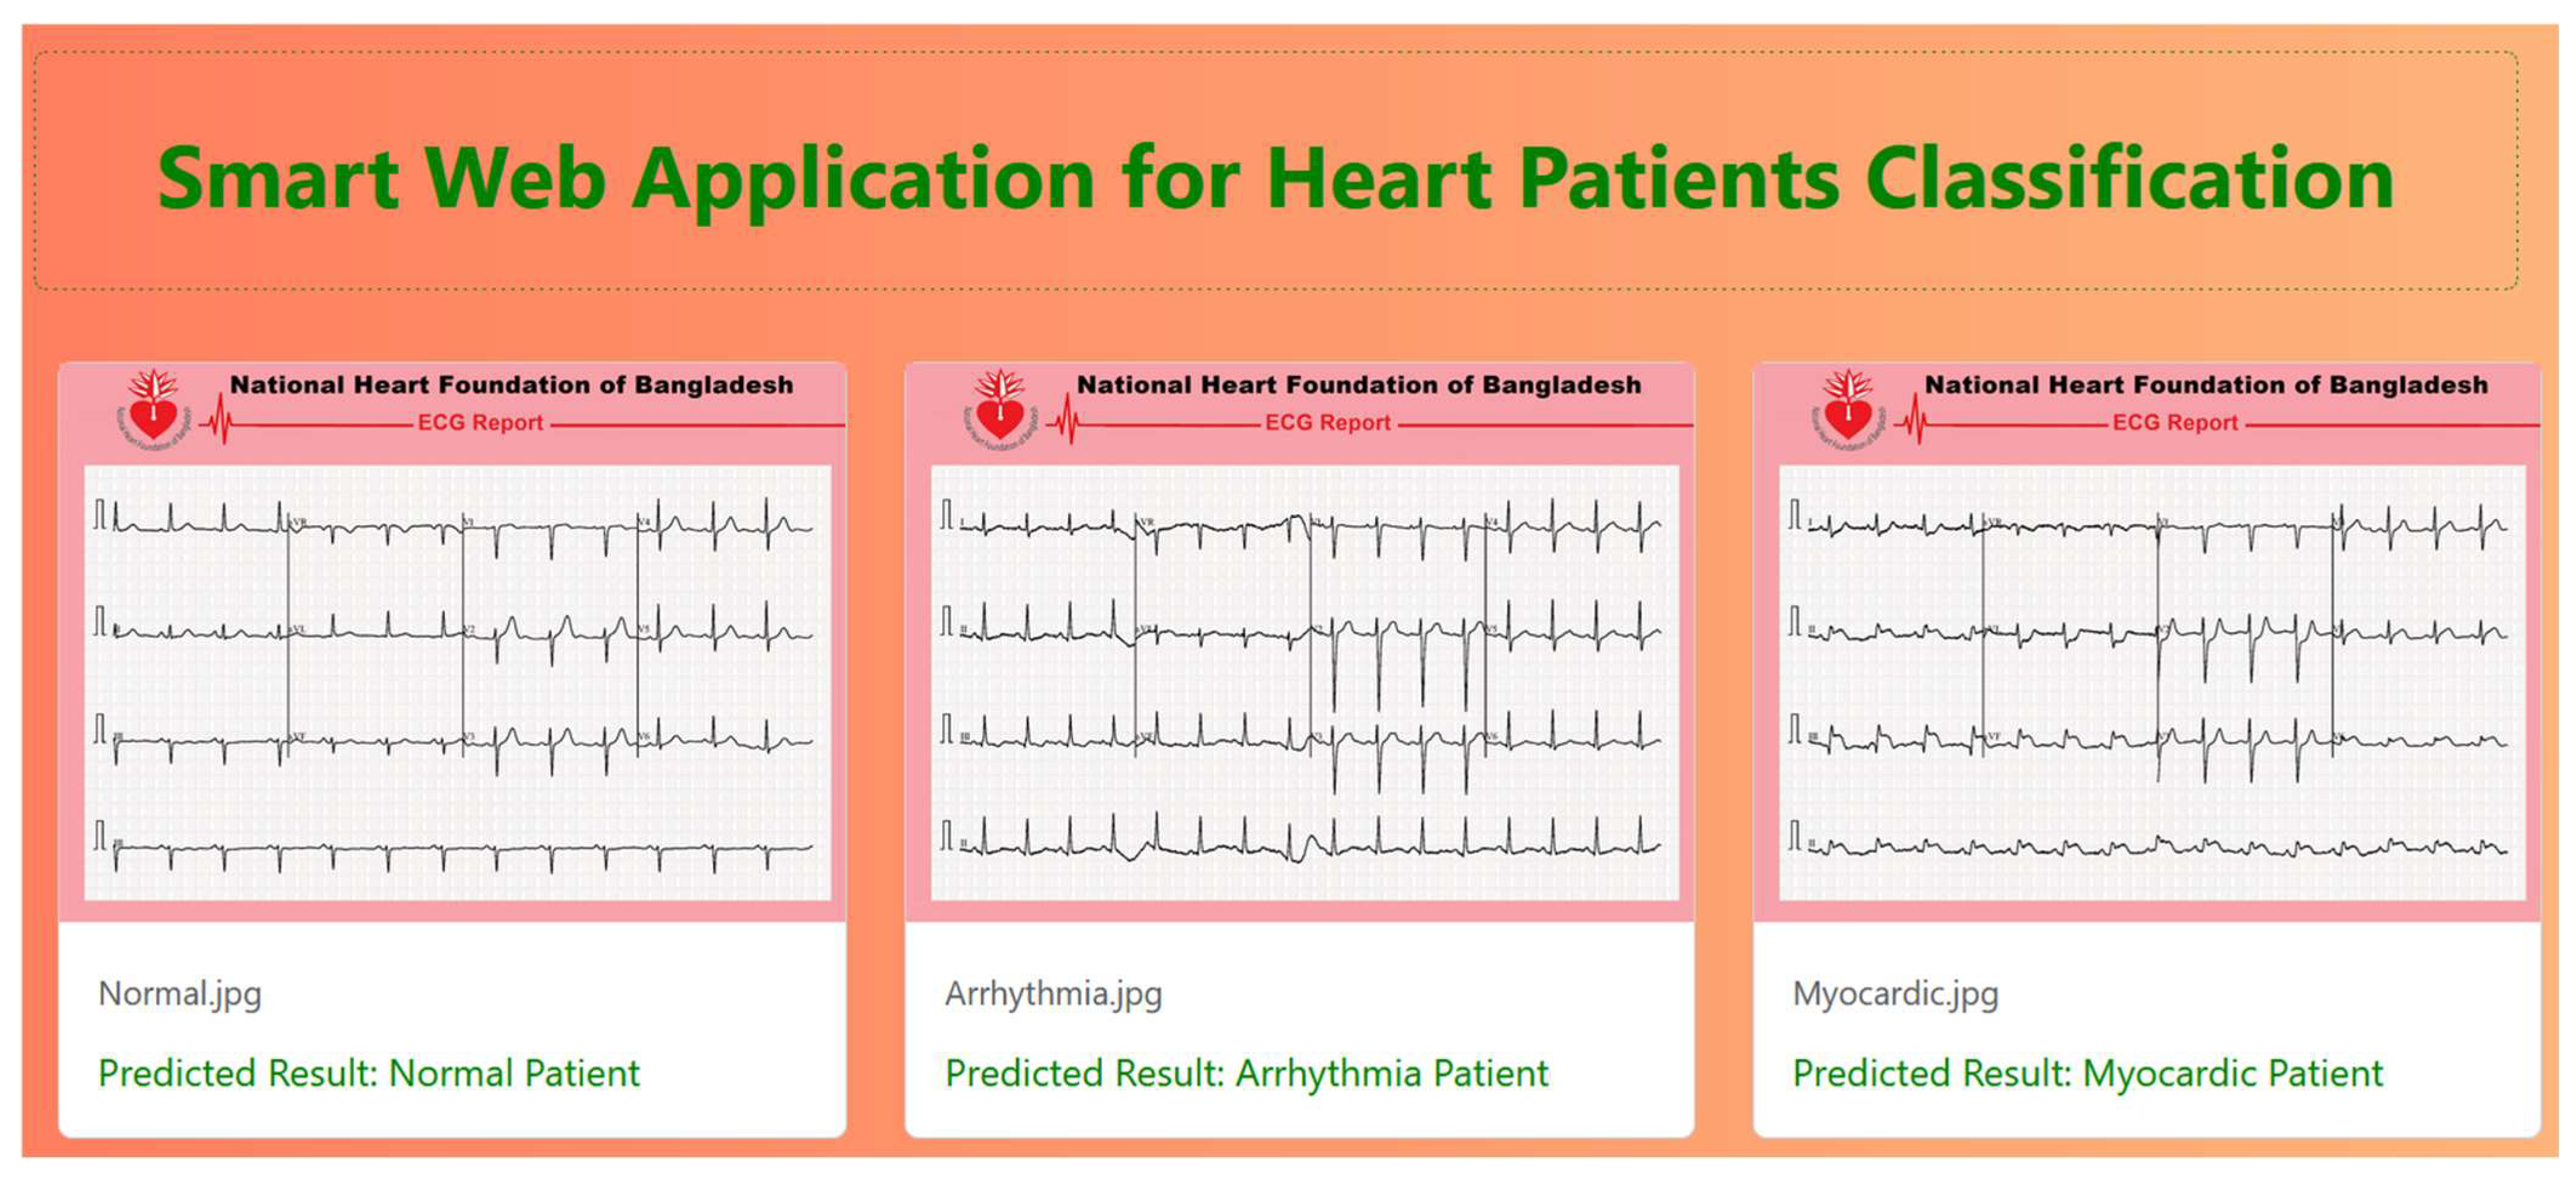
Figure 6 shows a smart web application designed for classifying heart patients into three different diagnostic categories. This app is developed based on a Dash framework and integrates the three intelligent deep learning models that can interpret electrocardiogram (ECG) patterns and categorize the heart condition of a patient. Therefore, the application represents a classification report based on the ECG waveform to use as an automated classification. This report demonstrates distinct deviations in the ECG waveform, potentially reflecting issues like myocardial infarction or ischemia. This application is designed to monitor and predict three distinct categories of heart conditions. It is clear that the predicted result for each class achieved correct predictions, whether it be Normal Patient, Arrhythmia Patient, or Myocardic Patient. To ensure a user-friendly experience, a graphical user interface (GUI) has been developed using a Python-based dashboard, allowing users to easily input and navigate through various features of the web application. The front-end interface is built based on a combination of HTML, CSS, and JavaScript, offering an interactive and dynamic user experience. The HTML structure adheres to standard web development practices, including elements such as <html>, <head>, and <body>. Styling is handled through CSS, which implements a visually appealing and responsive layout using Flexbox (display: flex) to enhance adaptability across devices. JavaScript plays a vital role in this application, managing tasks such as data retrieval, invoking prediction functions powered by deep learning models, and dynamically displaying the results. The prediction application utilizes probability-based calculations derived from multiple ECG properties to estimate the likelihood of various heart disease types. On the backend, the application integrates three advanced deep learning models—Swin-T, VGG-19, and ViT—to train and classify the monitored ECG data accurately. These models enhance the application’s ability to provide reliable diagnostic support for heart patients.

3.5. Dataset

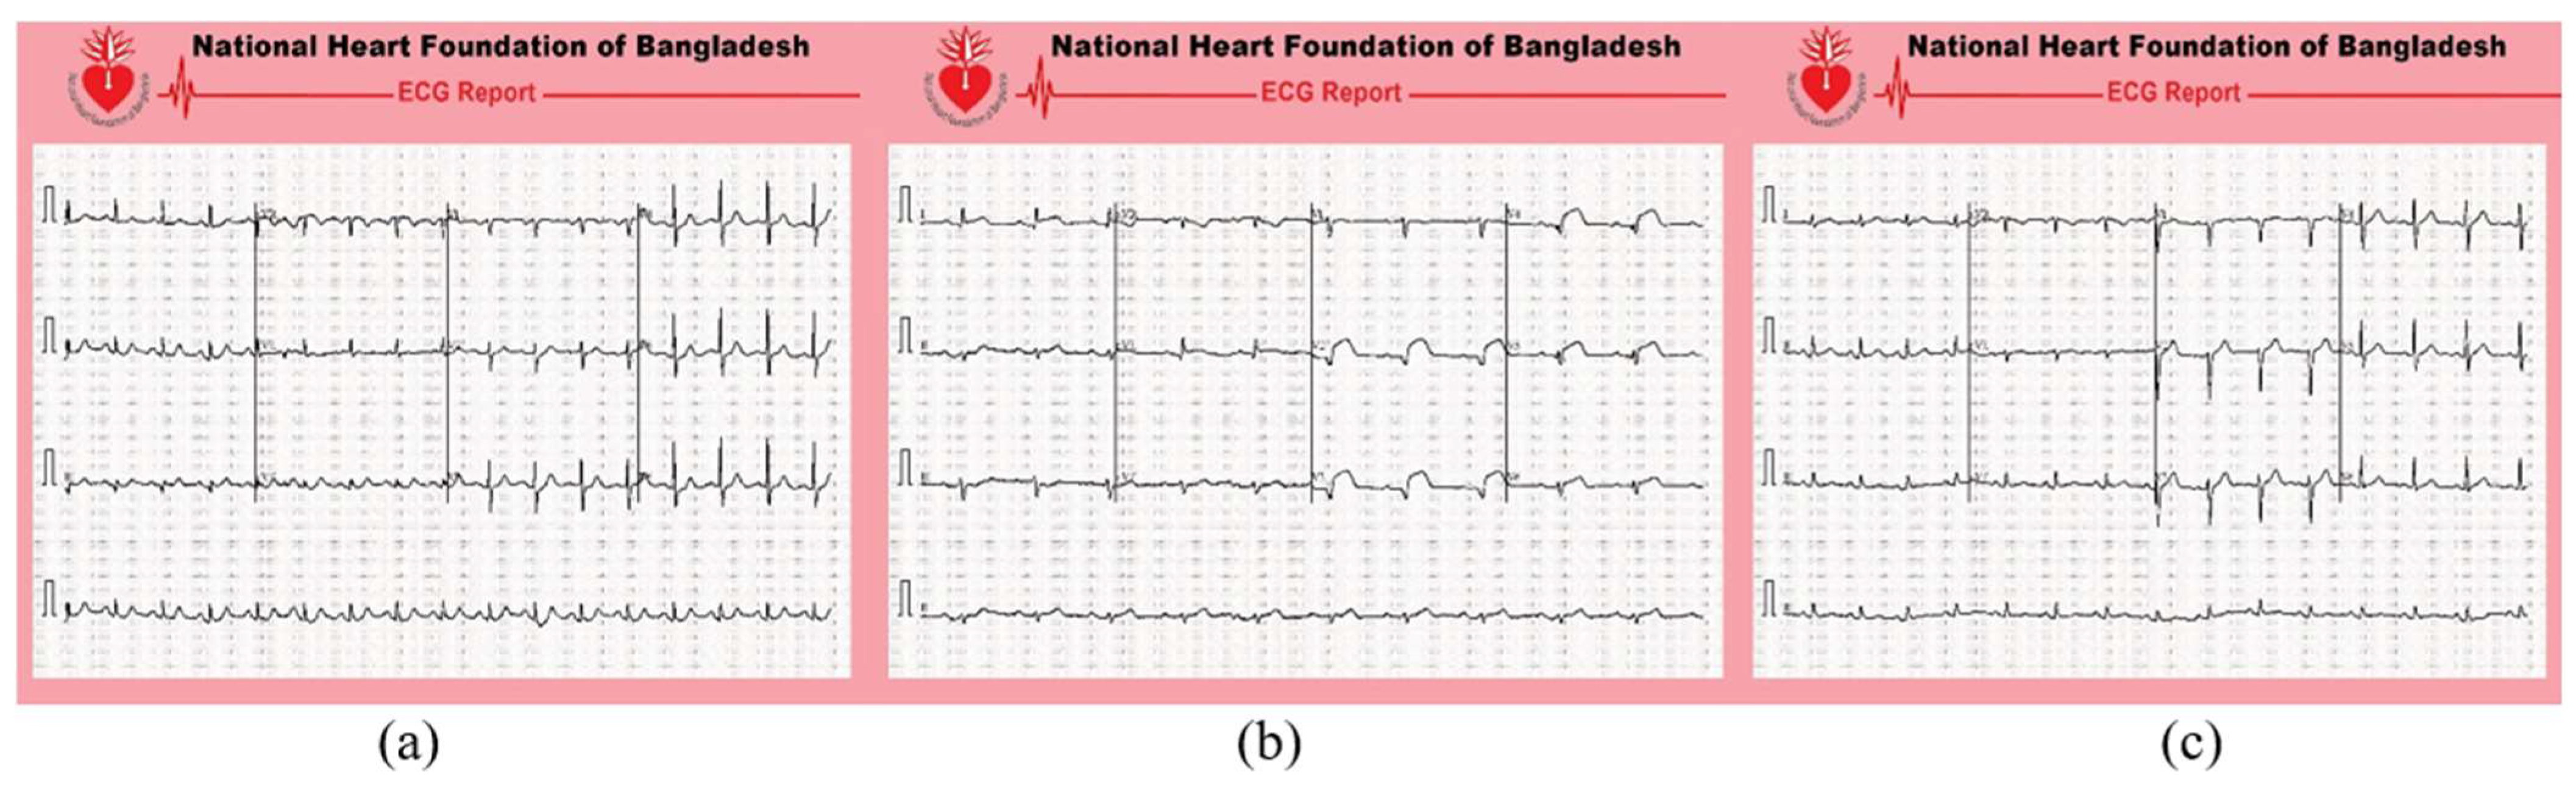
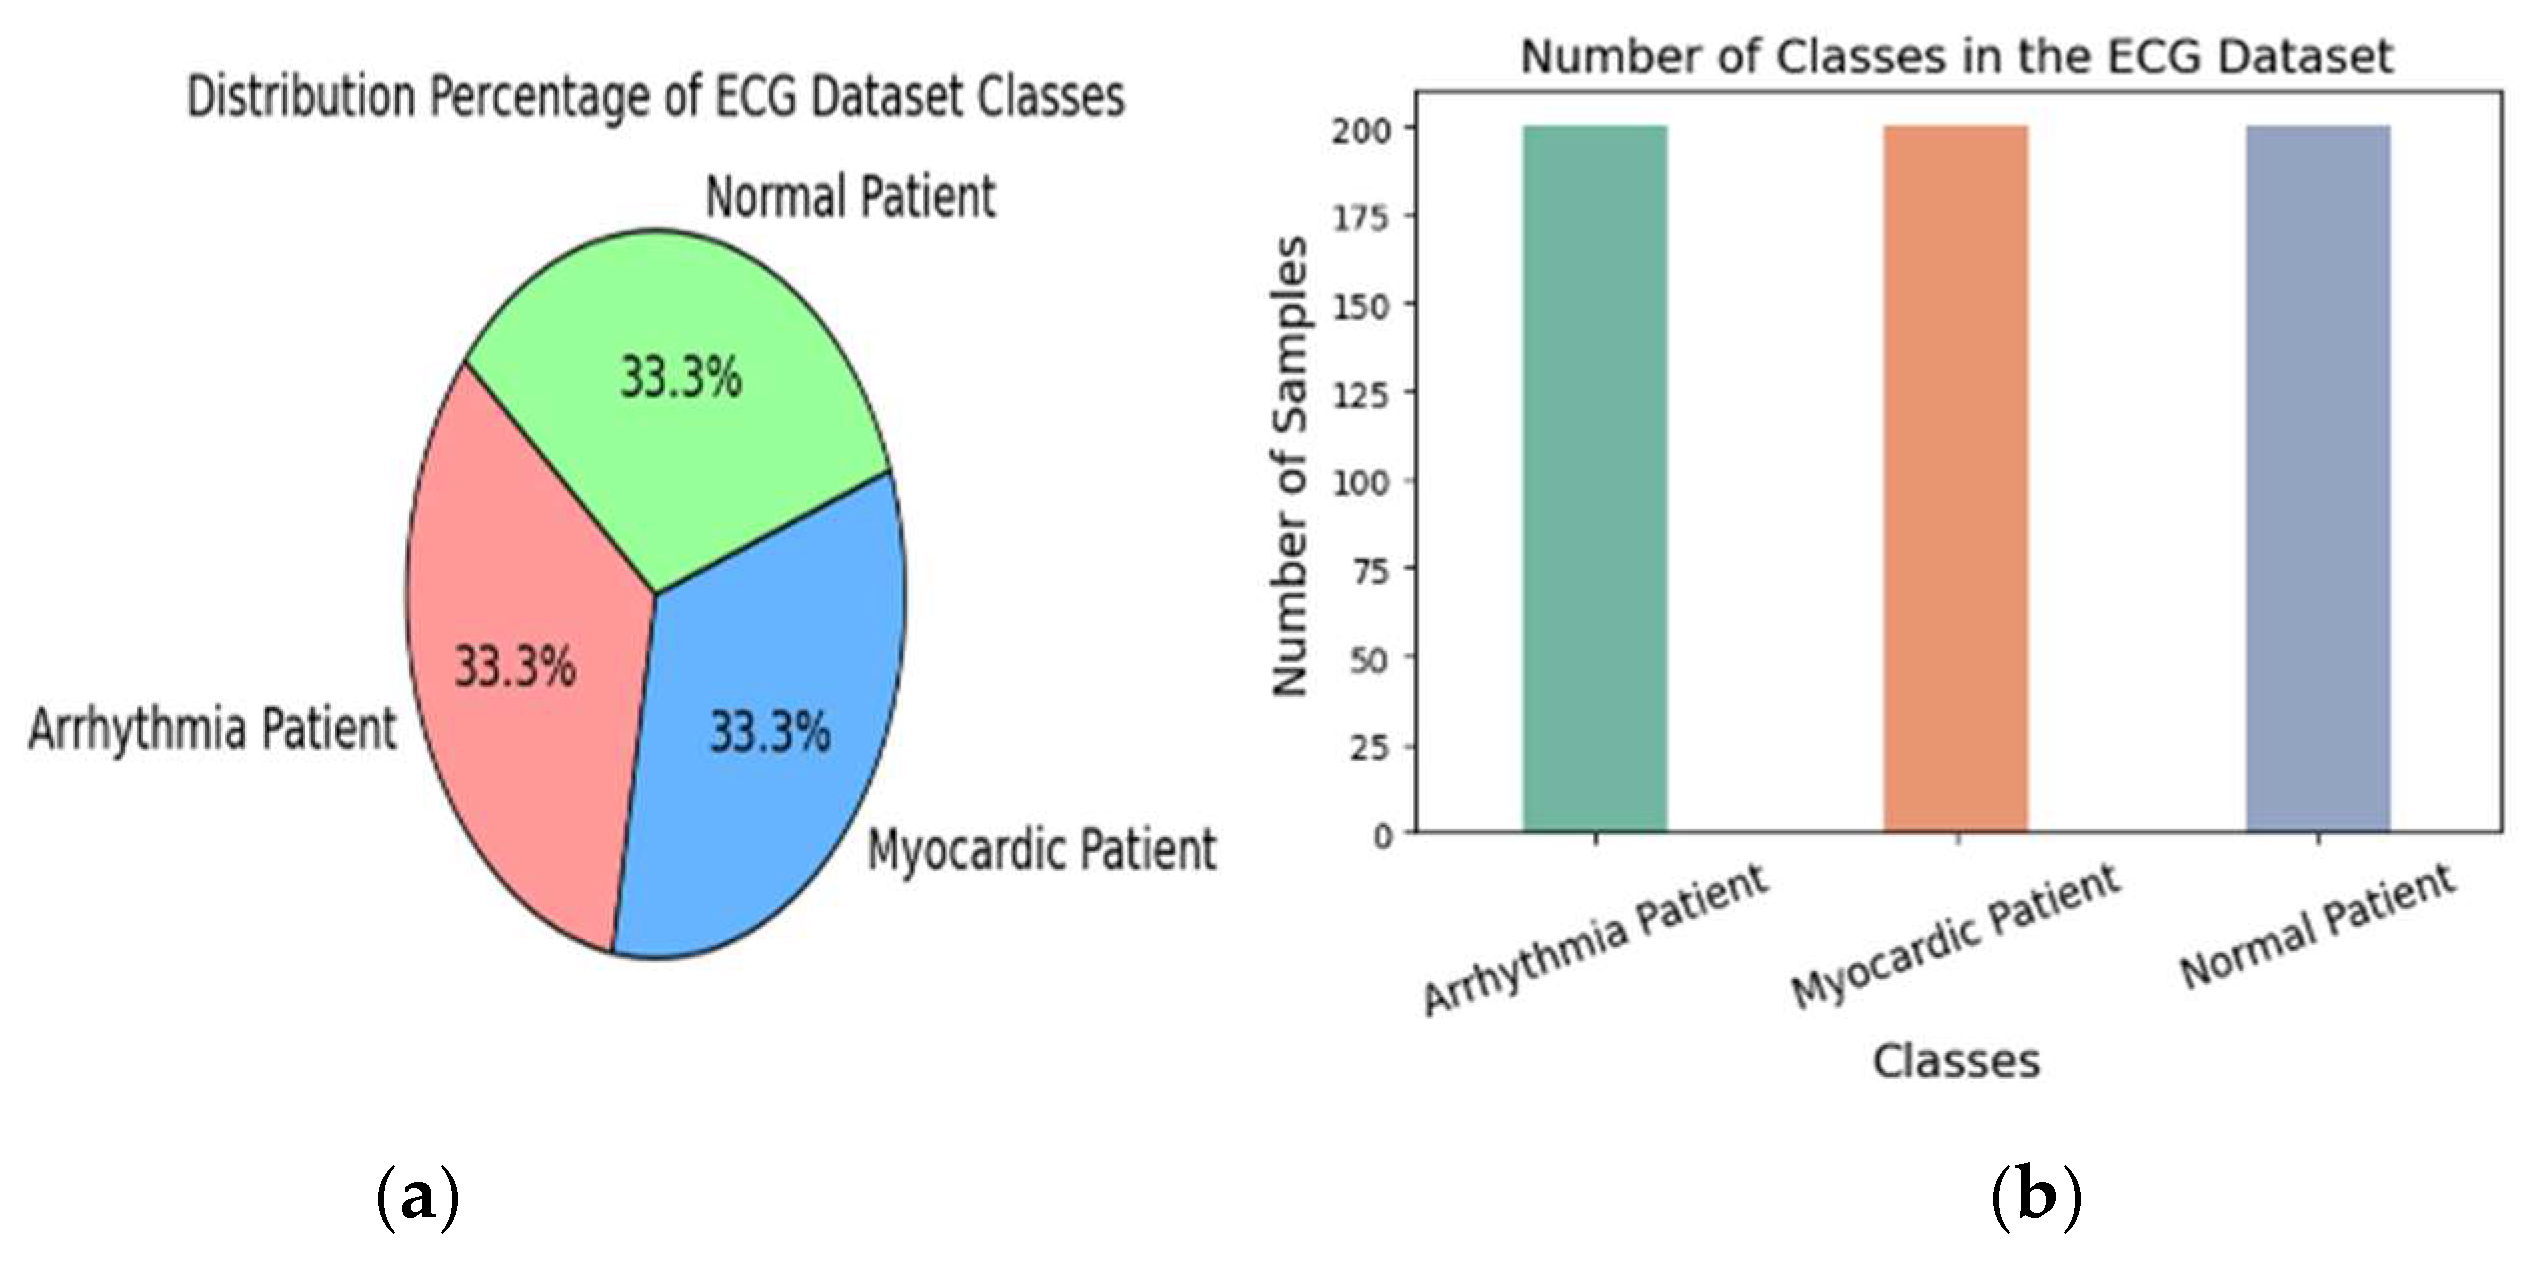
The used dataset has 600 RGB images/samples to classify different types of heart patients, which are available on the Kaggle website [23]. These images have original dimensions of 2213 × 1572 related to ECG signals from different persons, which are monitored in a medical center of the National Heart Foundation of Bangladesh (NHFB). The data are resized to 224 × 224 before the training phase. The dataset is distributed into three classes/categories: Arrhythmia Patient, Myocardic Patient, and Normal Patient, and the samples’ percentage for each category is 33.3%. Therefore, it is balanced data. Figure 7 demonstrates some different samples of the utilized ECG dataset. Figure 8 illustrates the statistical distribution of the three ECG classes in the dataset. Figure 8a shows the percentage for each ECG category. It is clear that the three classes used in the dataset are described via statistical distributions. The used dataset is trained on the three models: Swin-T, VGG-19, and ViT.
A probability technique is applied to distribute the dataset, which improves the three models’ efficiency [42]. First, the images are collected using a unique patient ID. The dataset is then split at the patient level into training and test sets. This means that all images belonging to a single patient are assigned exclusively to either the training set or the test set, with no overlap. This approach ensures that the model is evaluated on unseen patients.
Figure 8b illustrates the number of ECG samples for each category in the data. We see that each class has 200 samples (160 images are used for the training, and the remaining 40 samples for the testing phase). These samples are expanded during the training by applying different data augmentation techniques, including rotation of 45 degrees and right shifting of 0.1. In this Figure, the green bar represents the Arrhythmia Patient, while the orange bar represents the Myocardic Patient, and the purple bar represents the Normal case.

4. Evaluation Metrics

Several evaluation metrics/measurements are applied after the learning process to evaluate the performance of three models: Swin Transformer, VGG-19, and ViT [43]. These metrics, like recall, precision, accuracy, and F1-score, are based on a number of statistics: True-Positives (TPi), True-Negatives (TNi), False-Positives (FPi), and False-Negatives (FNi). The TP refers to positively predicted classes, while TN represents the negative. The mentioned metrics are applied to measure the quality of the three models to classify three types of heart patients in a precise method with the DL models based on the testing data.
The first measurement is accuracy, computed using Equation (12). The second measurement, precision, is obtained from Equation (13). The third measurement is the true positive rate (TPR), also called recall, which is estimated via Equation (14). The fourth measurement is the F1-score, determined using Equation (15). The least possible value of the four assessing measurements is 0, and the largest is 1.
A c c u r a c y i = T P i + T N i T P i + T N i + F P i + F N i
P r e c i s i o n i = T P i F P i + T P i  
R e c a l l i = T P i F N i + T P i  
F 1 s c o r e i = 2 × R e c a l l i × P r e c i s i o n i R e c a l l i + P r e c i s i o n i
Equation (16) presents the area under the receiver operating characteristic (AUROC) curve, which is calculated via the integration of the TPR multiplied by the differentiation of the FPR metric. This FPR is determined from Equation (17). The AUROC has a percentage value from 0% to 100%. A high level of AUROC means that a model can separate the different categories of heart patients. Furthermore, a DL model has the highest AUROC, which means the best model for a specific classification. The evaluation measurements are set based on their effectiveness in analyzing the performance of the models.
A U R O C = 0 1 T P R   d ( F P R )  
F P R = F P F P + T N

5. Experimental Results

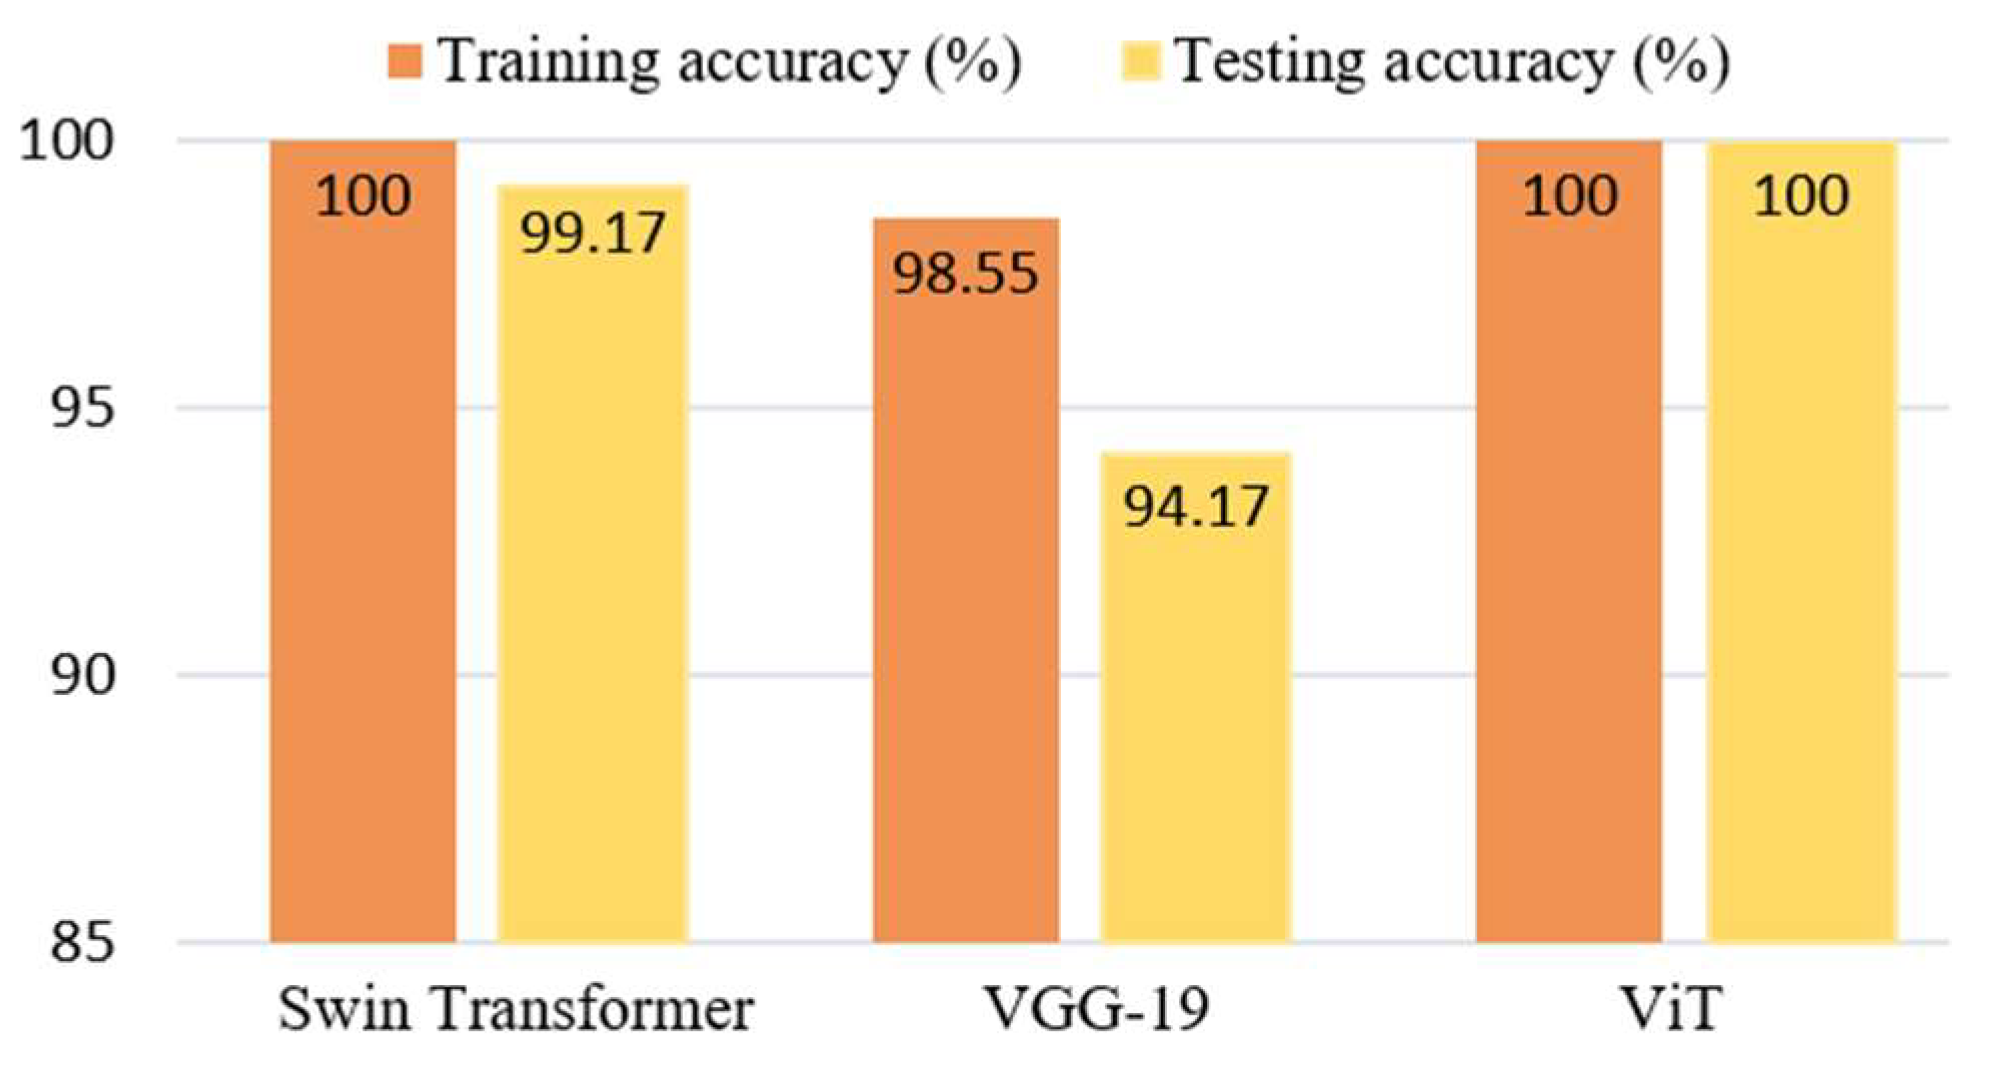
The DL models are applied using Python (version 3.10.0) programming with the Kaggle environment. The models are operated on a server that has a GPU “NVIDIA Tesla P100” with 16 GB VRAM. This server also has an Intel Xeon CPU (2.3 GHz, 46 MB Cache) and a system memory of 16 GB. Figure 9 demonstrates the training and testing accuracies of the three models. The training and testing accuracy for the Swin Transformer is 100% and 99.17%, respectively, while for VGG-19, 98.55% and 94.17%, respectively. The obtained accuracy of ViT is 100% for both testing and training, demonstrating that ViT attains the best accuracy.
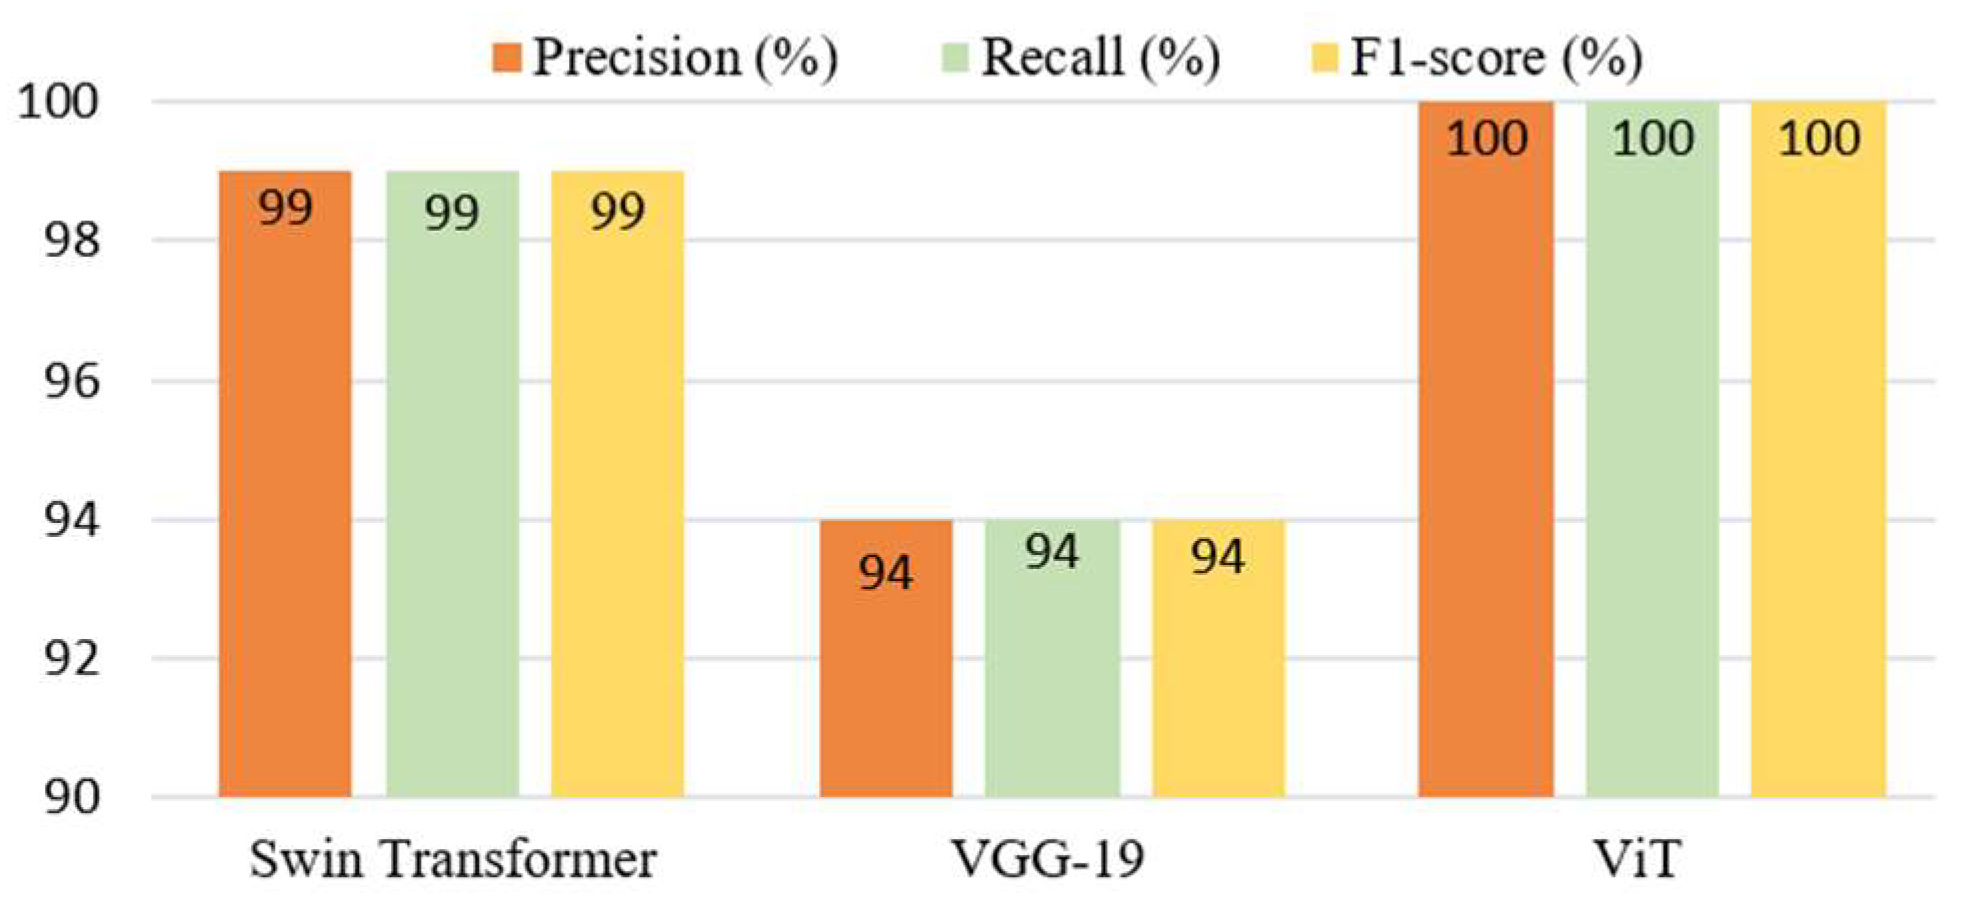
Table 2 presents the error rate of training and testing for the three models. For the Swin Transformer, the errors are 0.0707 and 0.0002 for test and train, respectively. For VGG-19, the errors are 0.3493 and 0.4138. The ViT achieved 0.0003 and 0.0015, demonstrating that the ViT presents the lowest error for testing. Table 3 shows three different evaluation metrics for the models’ performance: precision, TPR, and F1-score of the developed models, to measure their performance in classifying heart patients. The precision, TPR, and F1-score for the Swin Transformer are 99%. For VGG-19, the three metrics are 94%. In comparison, the ViT achieved 100% for each. Figure 10 shows a bar chart to compare the evaluation metrics for these proposed models.
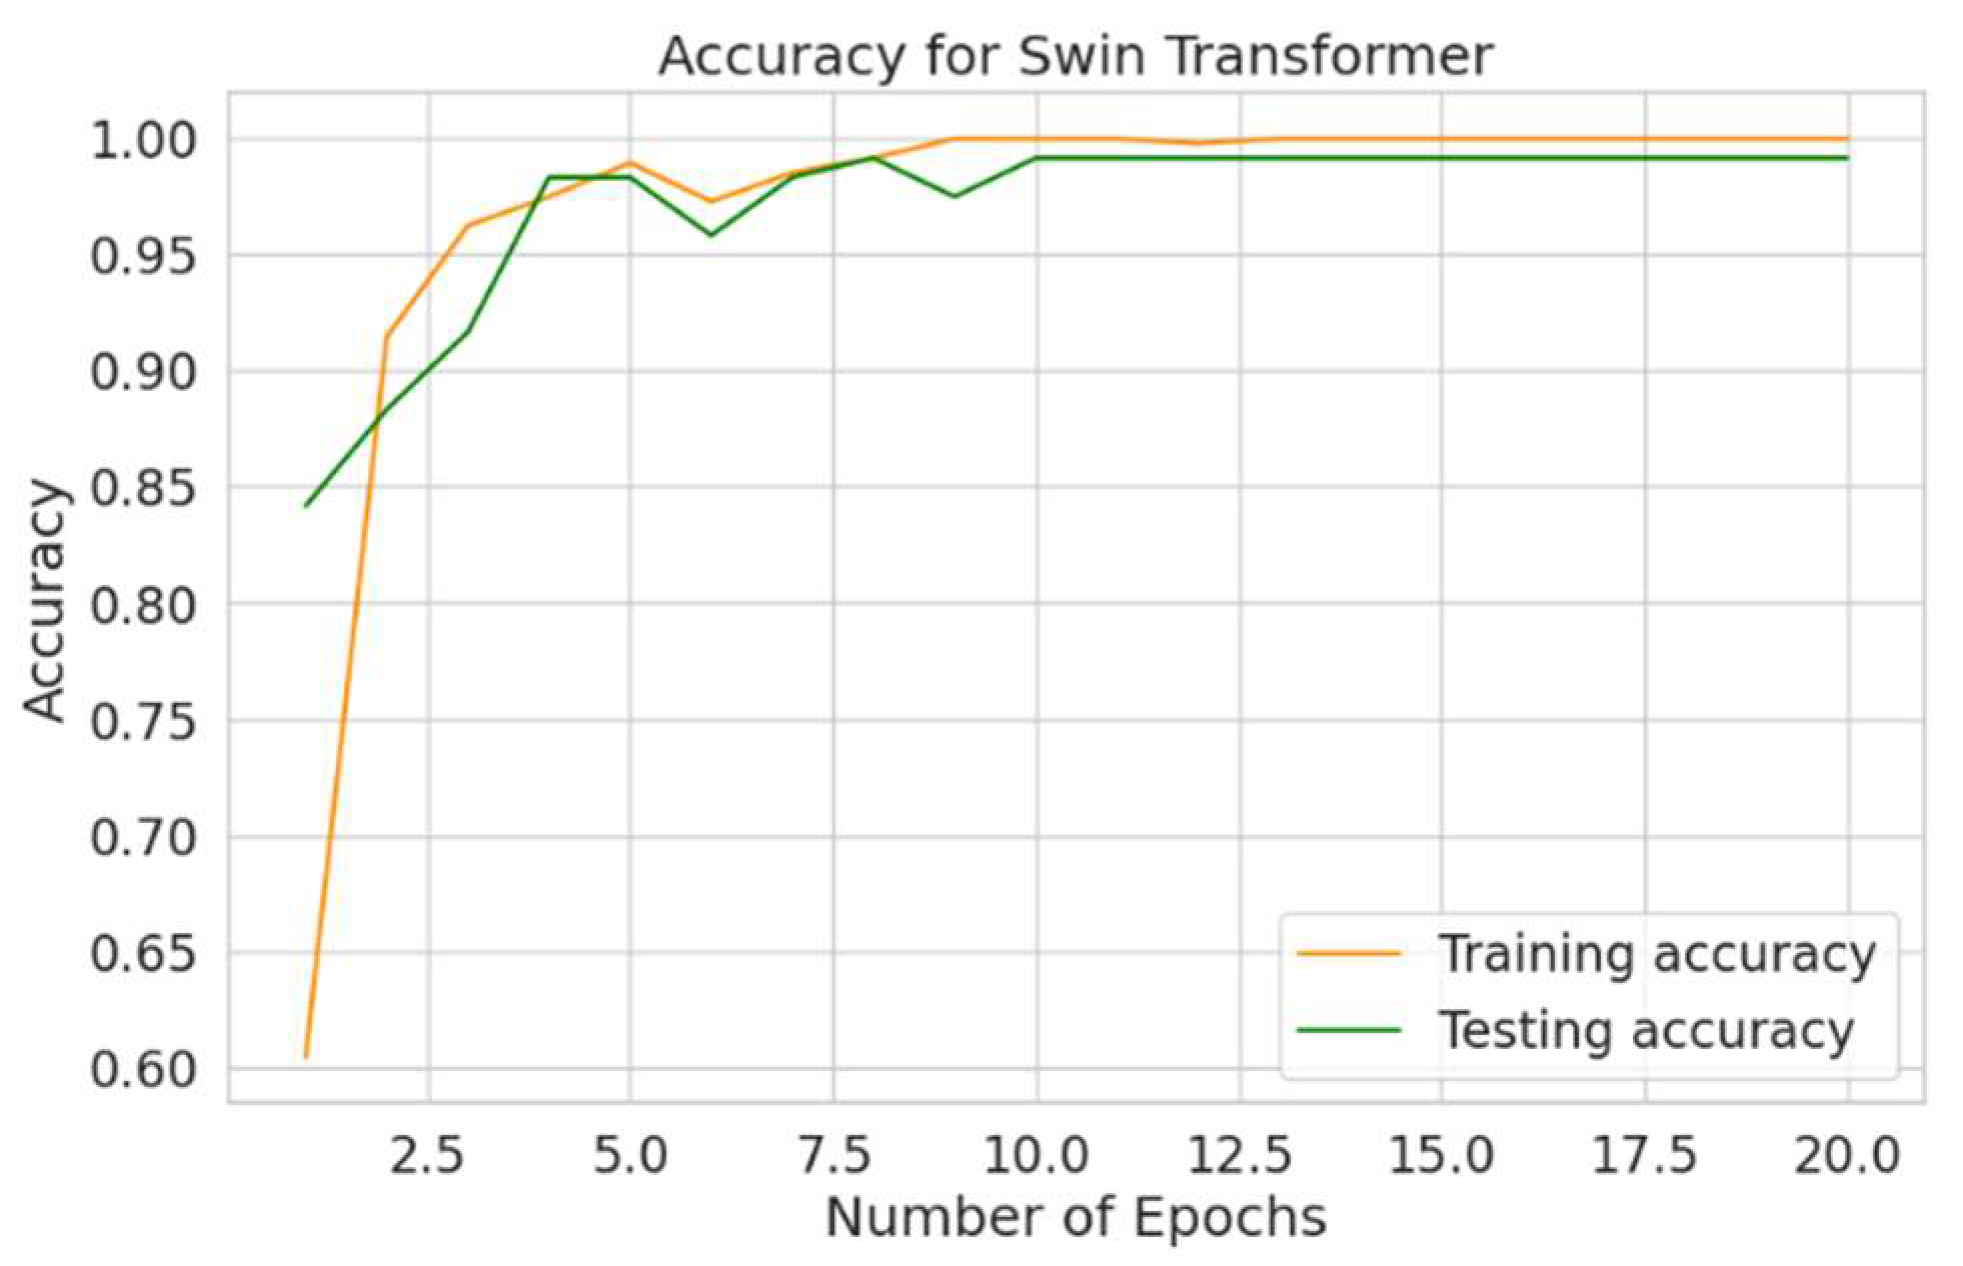
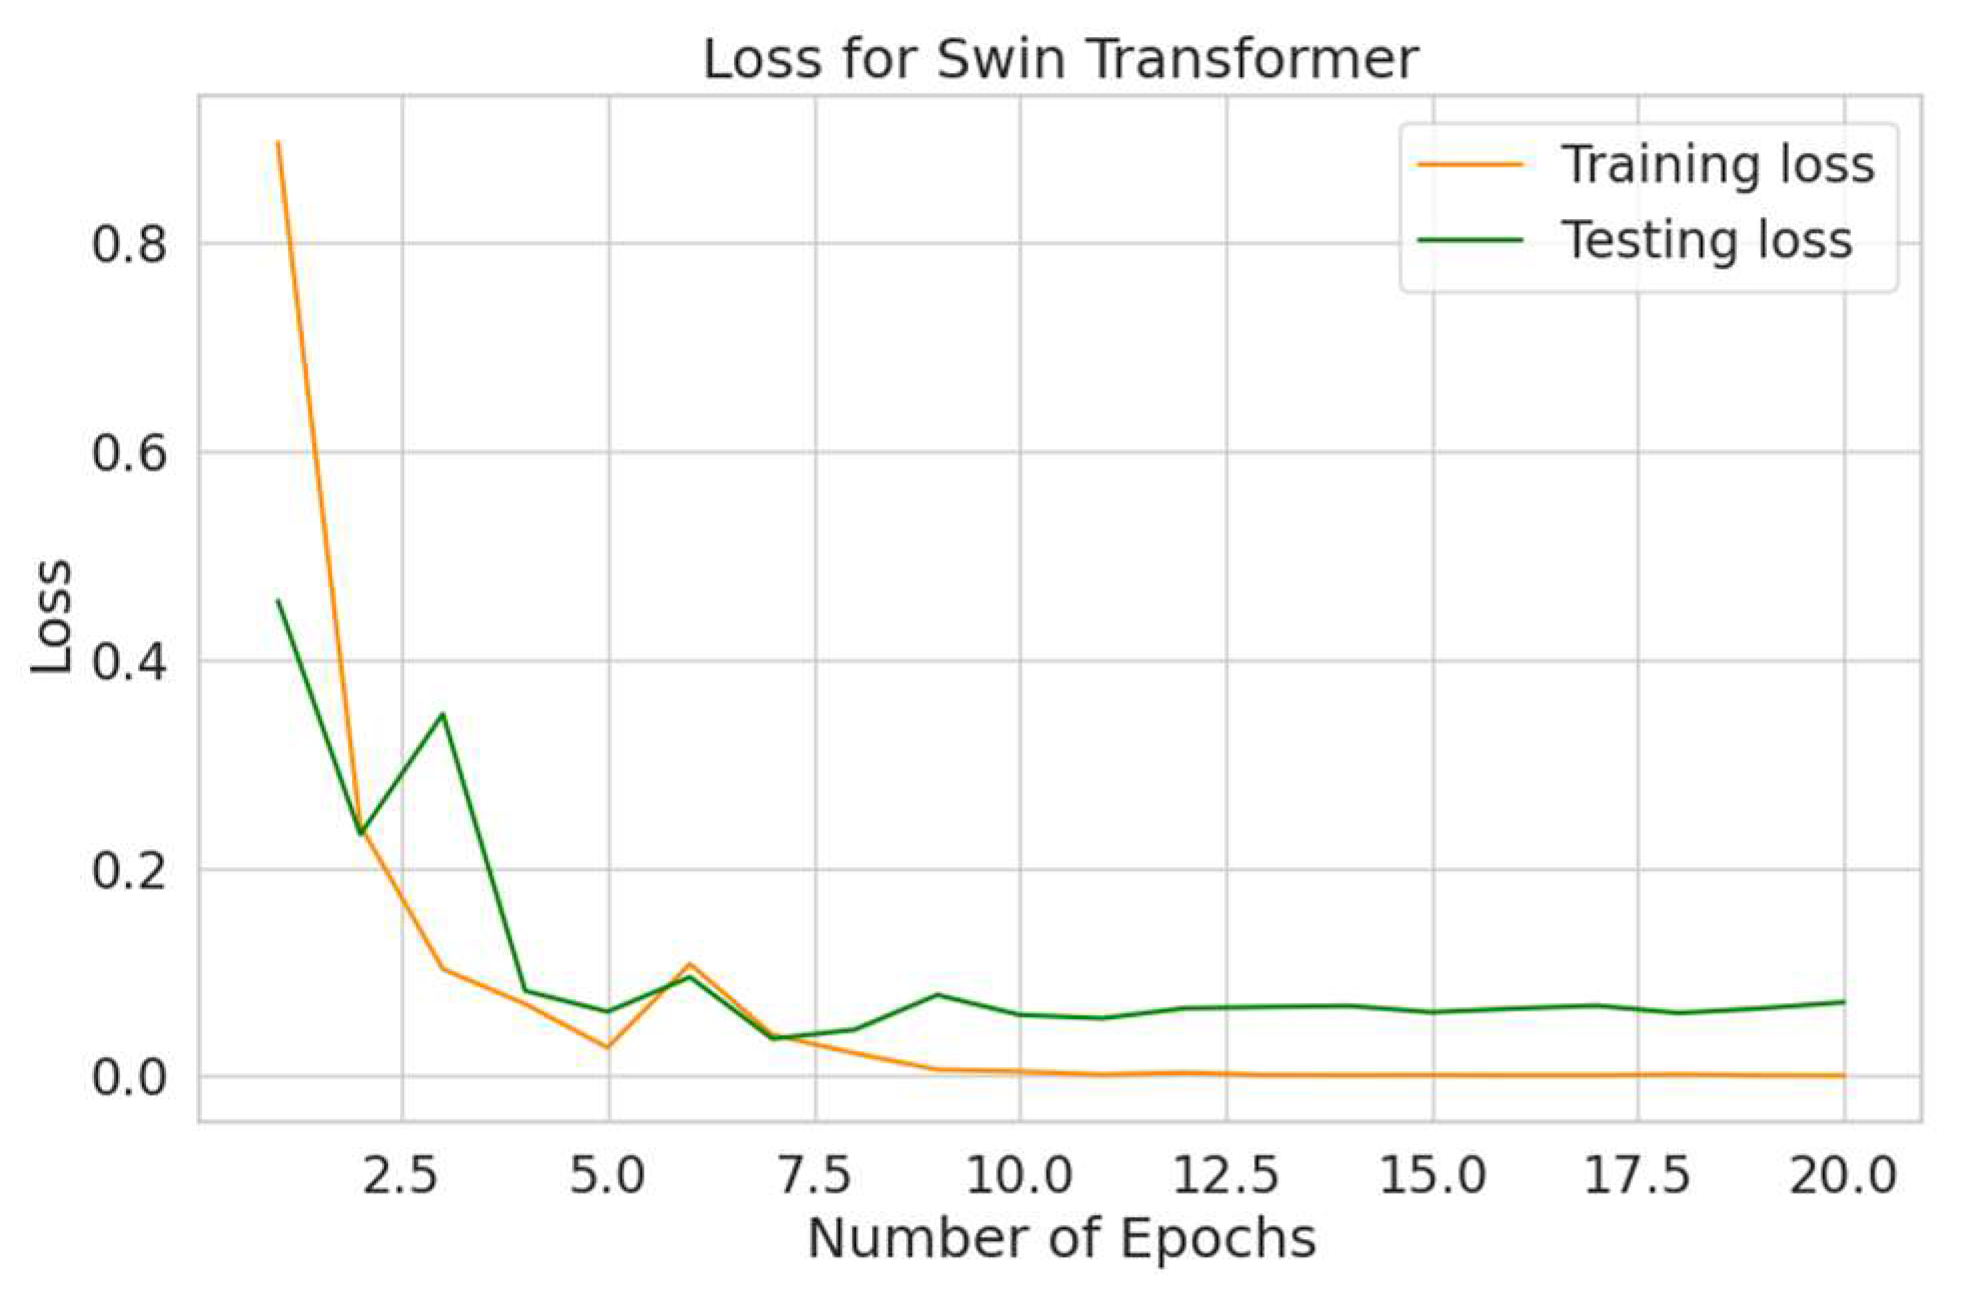
Figure 11 illustrates two curves of training and testing phases for the Swin Transformer. The green curve is testing accuracy, which finally reached a percentage of 99.17% at 20 epochs, while the orange curve shows that the training accuracy starts at 60.42% and finally achieved a percentage of 100% at 20 epochs. Figure 12 presents the loss rate (LR) for the Swin Transformer utilizing the training and testing data. The LR decreases as the number of epochs increases. For the learning phase, the LR starts at 0.8960 and attains 0.0002 at 20 epochs, while the LR for the test phase begins at 0.4563 and declines to 0.0707.
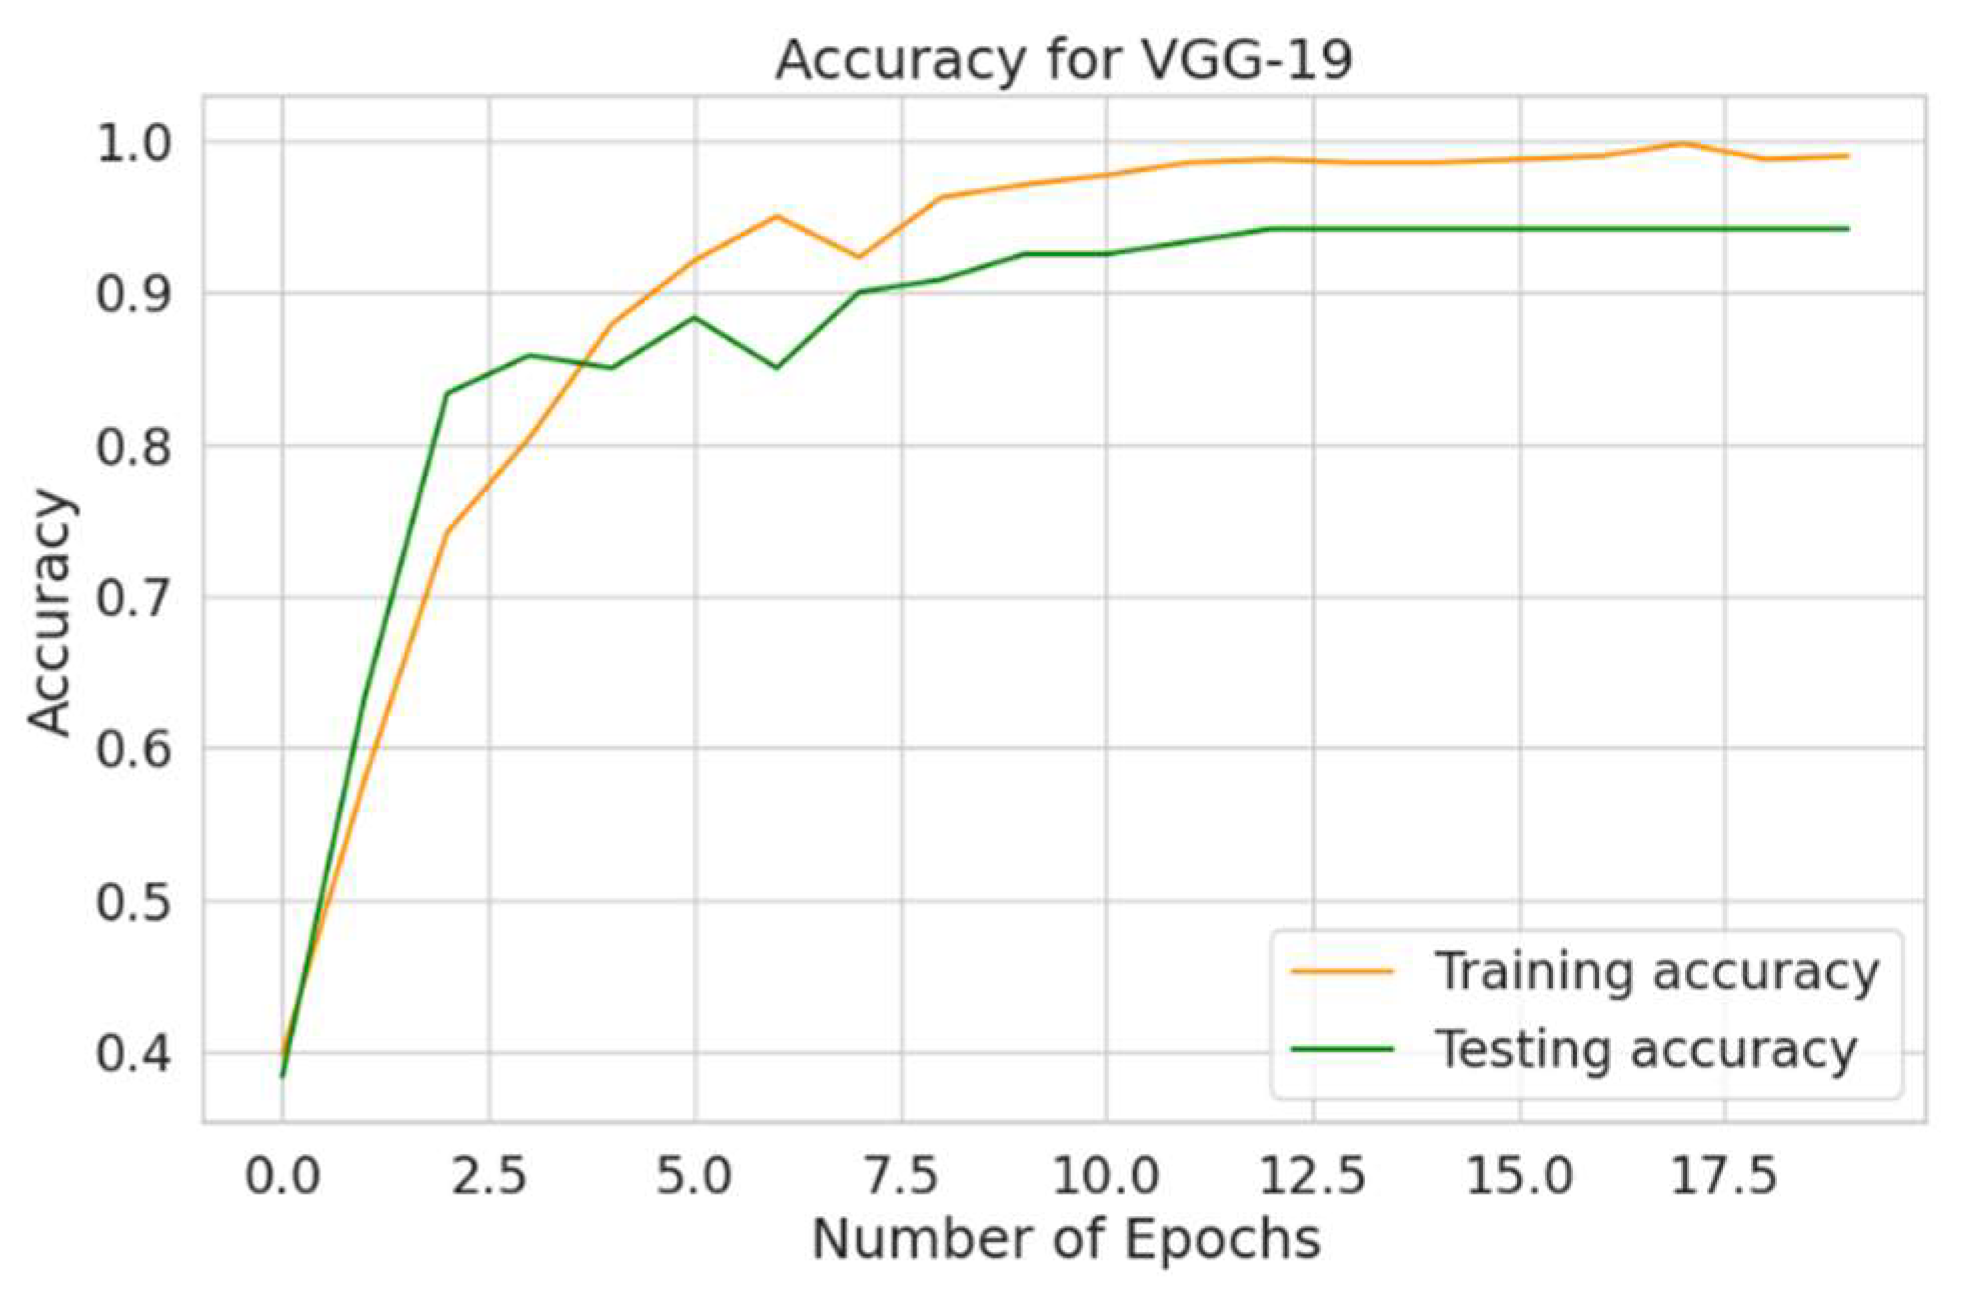
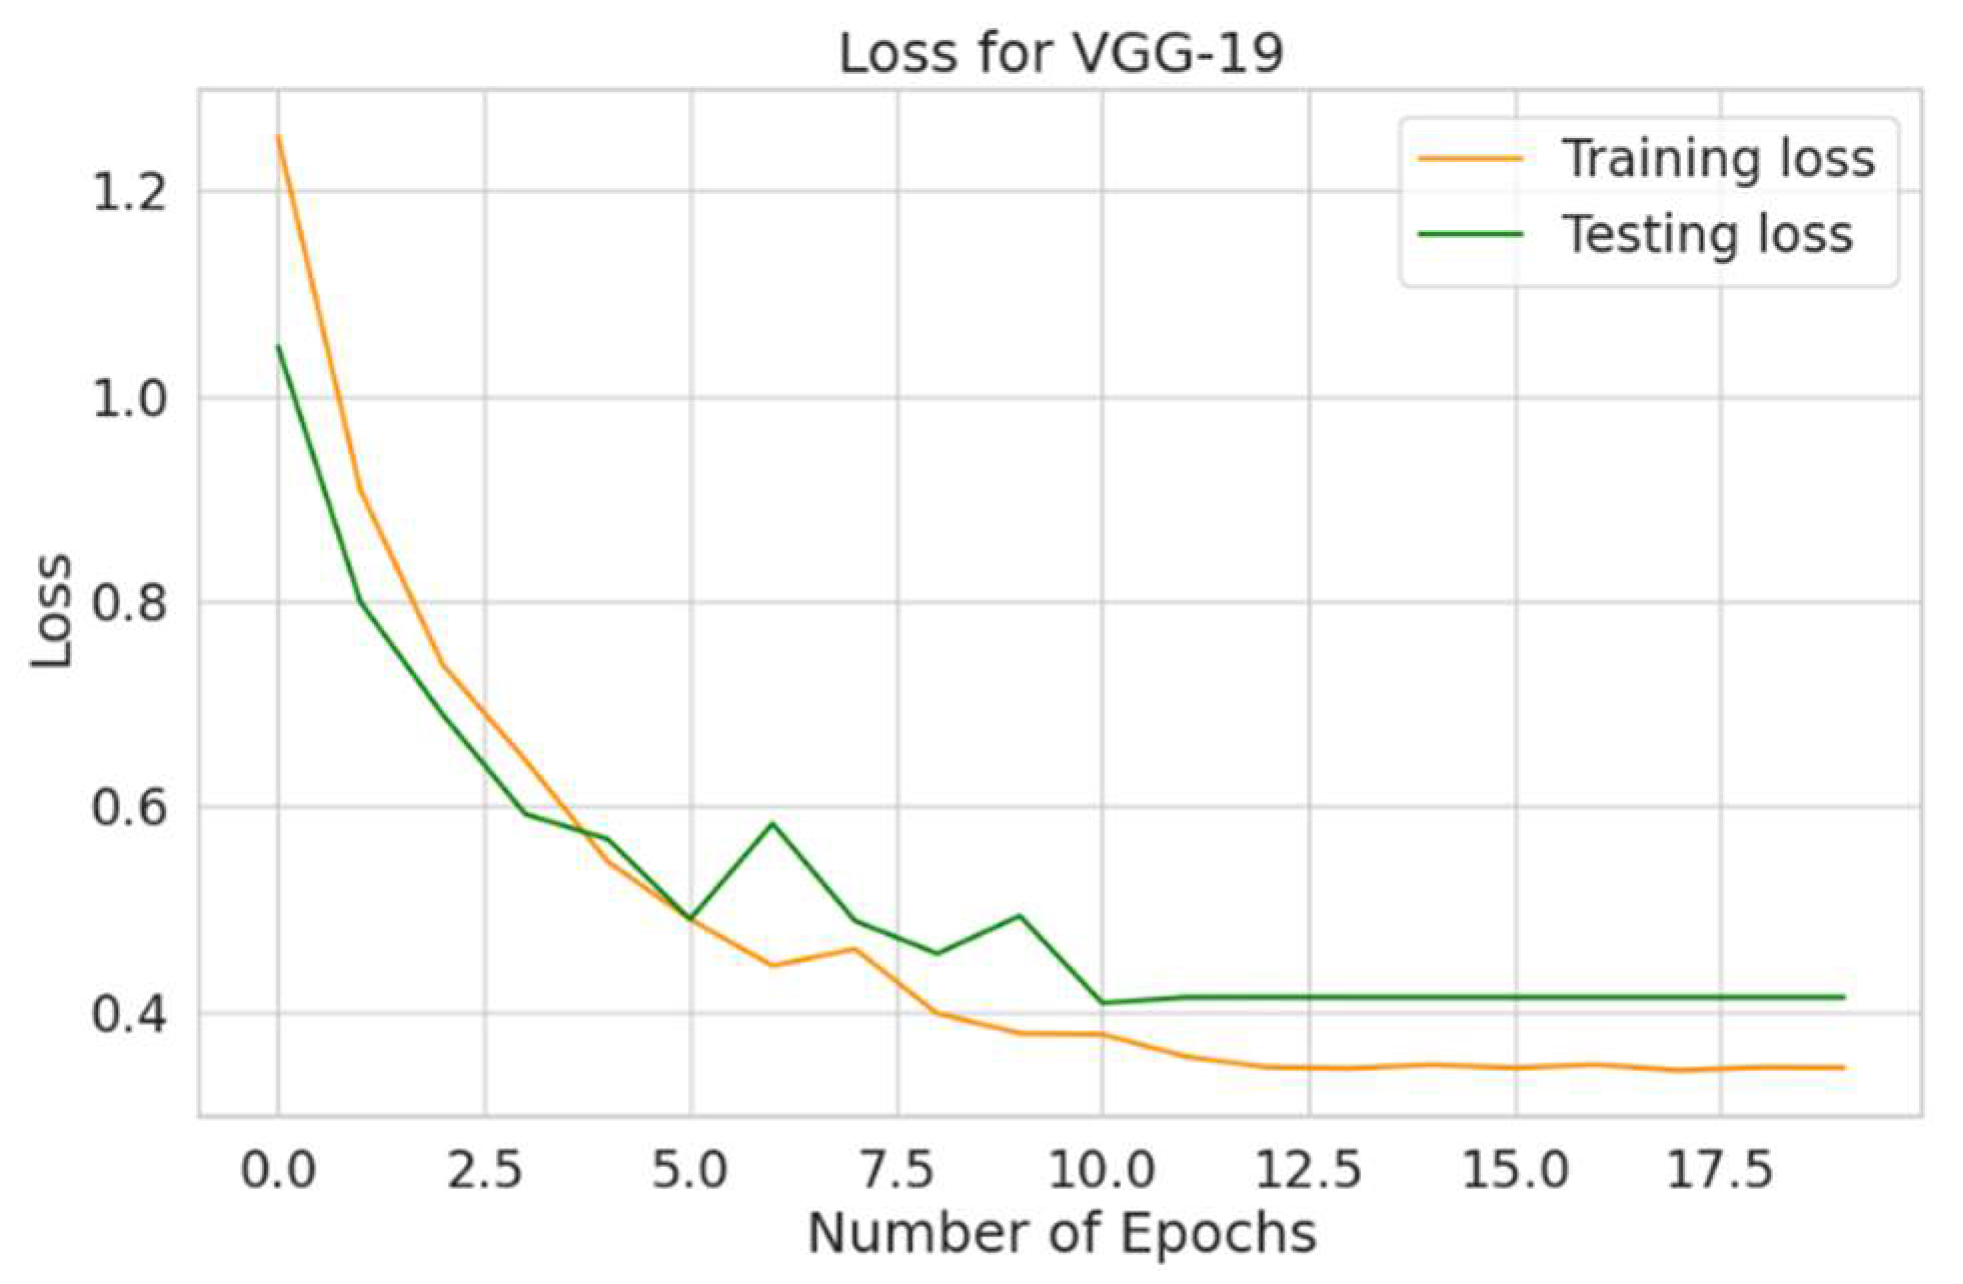
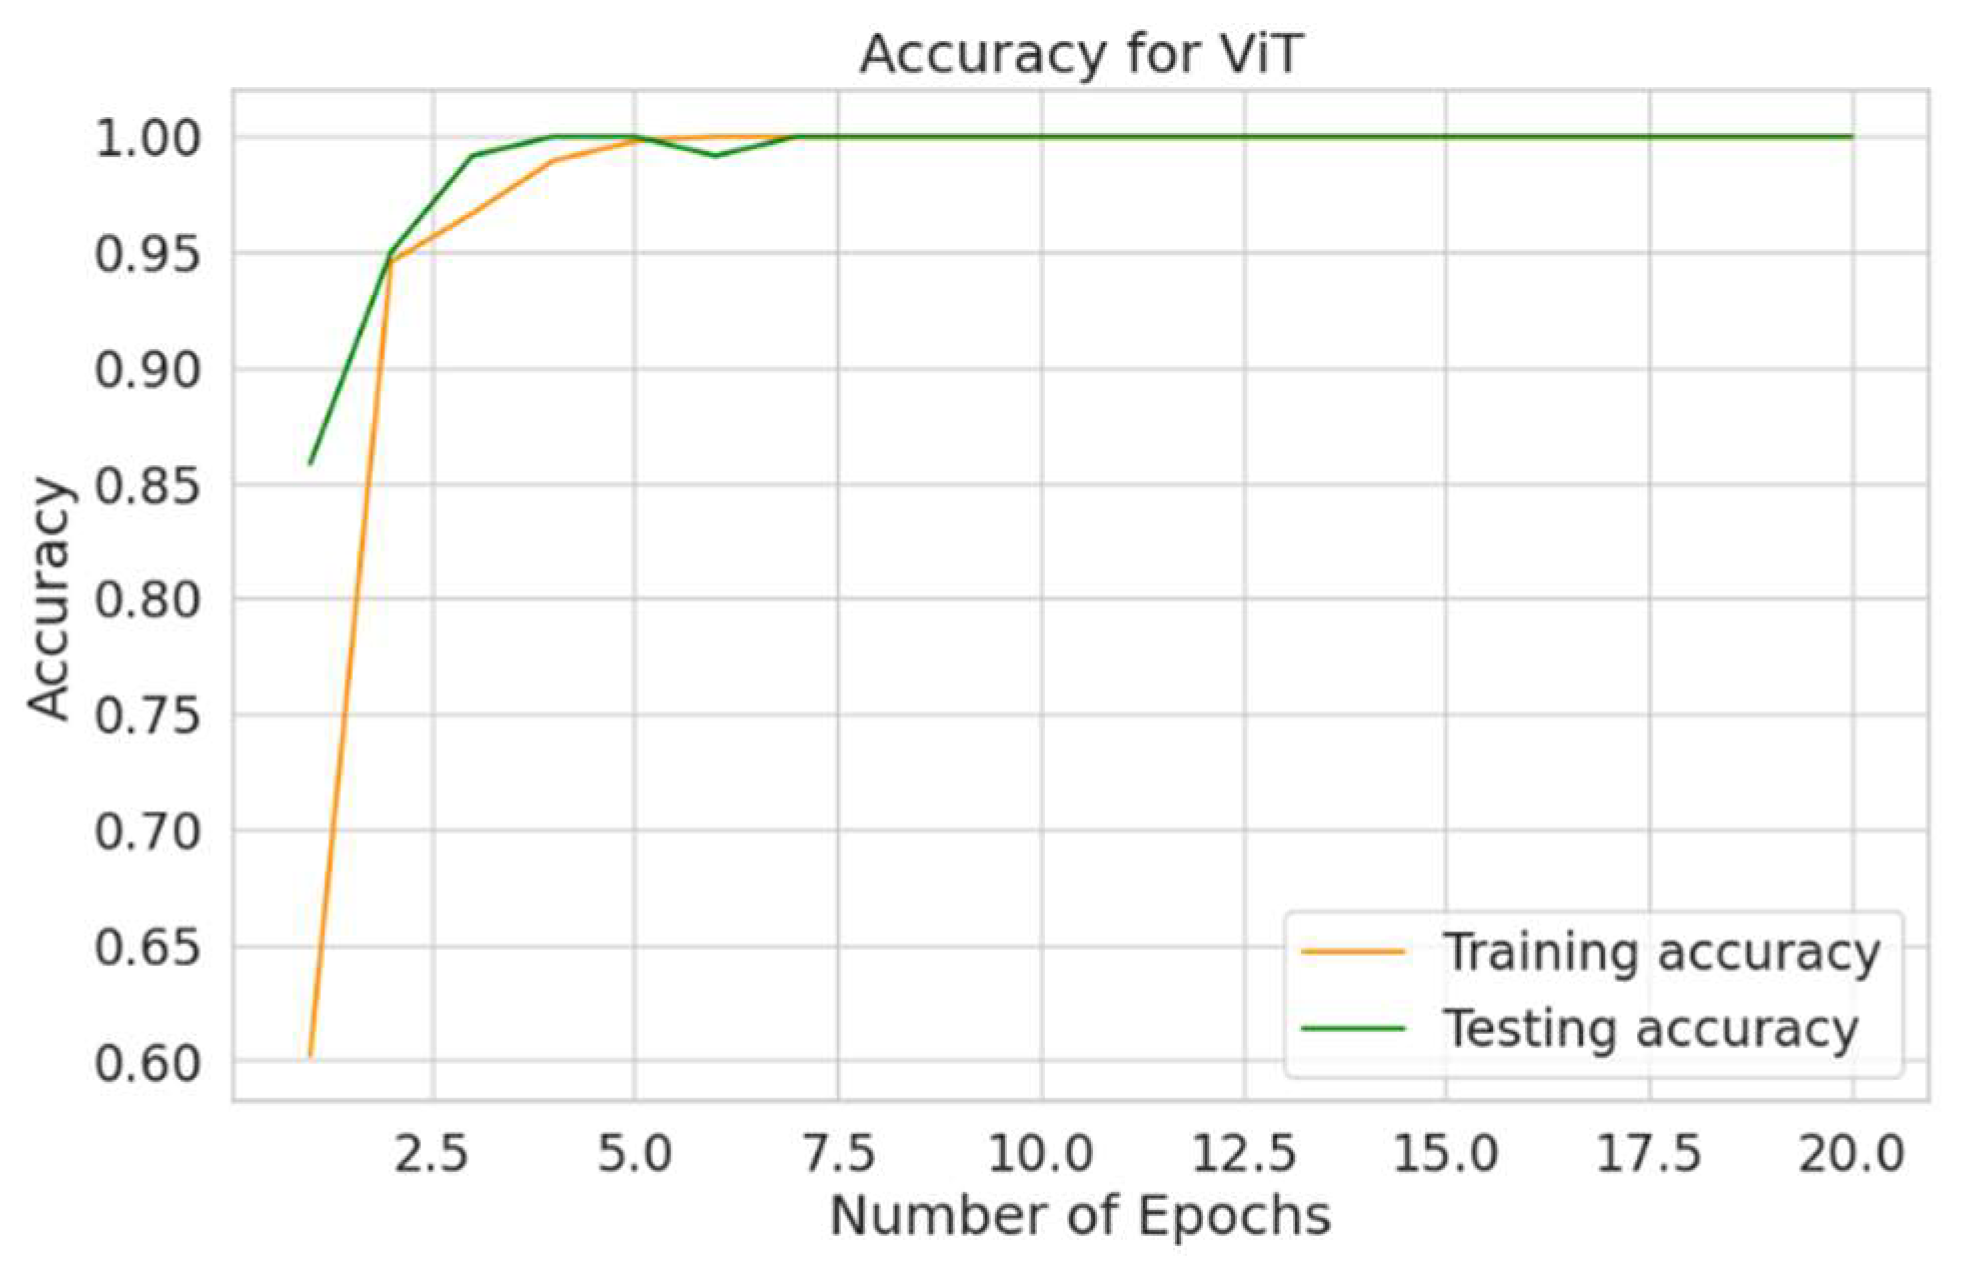
Figure 13 shows the accuracy of VGG-19 at 20 epochs. The orange training curve starts at 38.08% and ends at 98.55%. The green testing curve begins at 38.33% and reaches 94.117%. Figure 14 reveals the LR for VGG-19. The loss of training starts at 1.3848 and reduces to 0.3493 at 20 epochs, while the curve of testing starts at 1.0478 and declines to 0.4138. Figure 15 presents the accuracy of ViT. The curve of training starts at 60.21% and attains 100% at 20 epochs. Also, the green curve starts at 85.83% and reaches 100%.
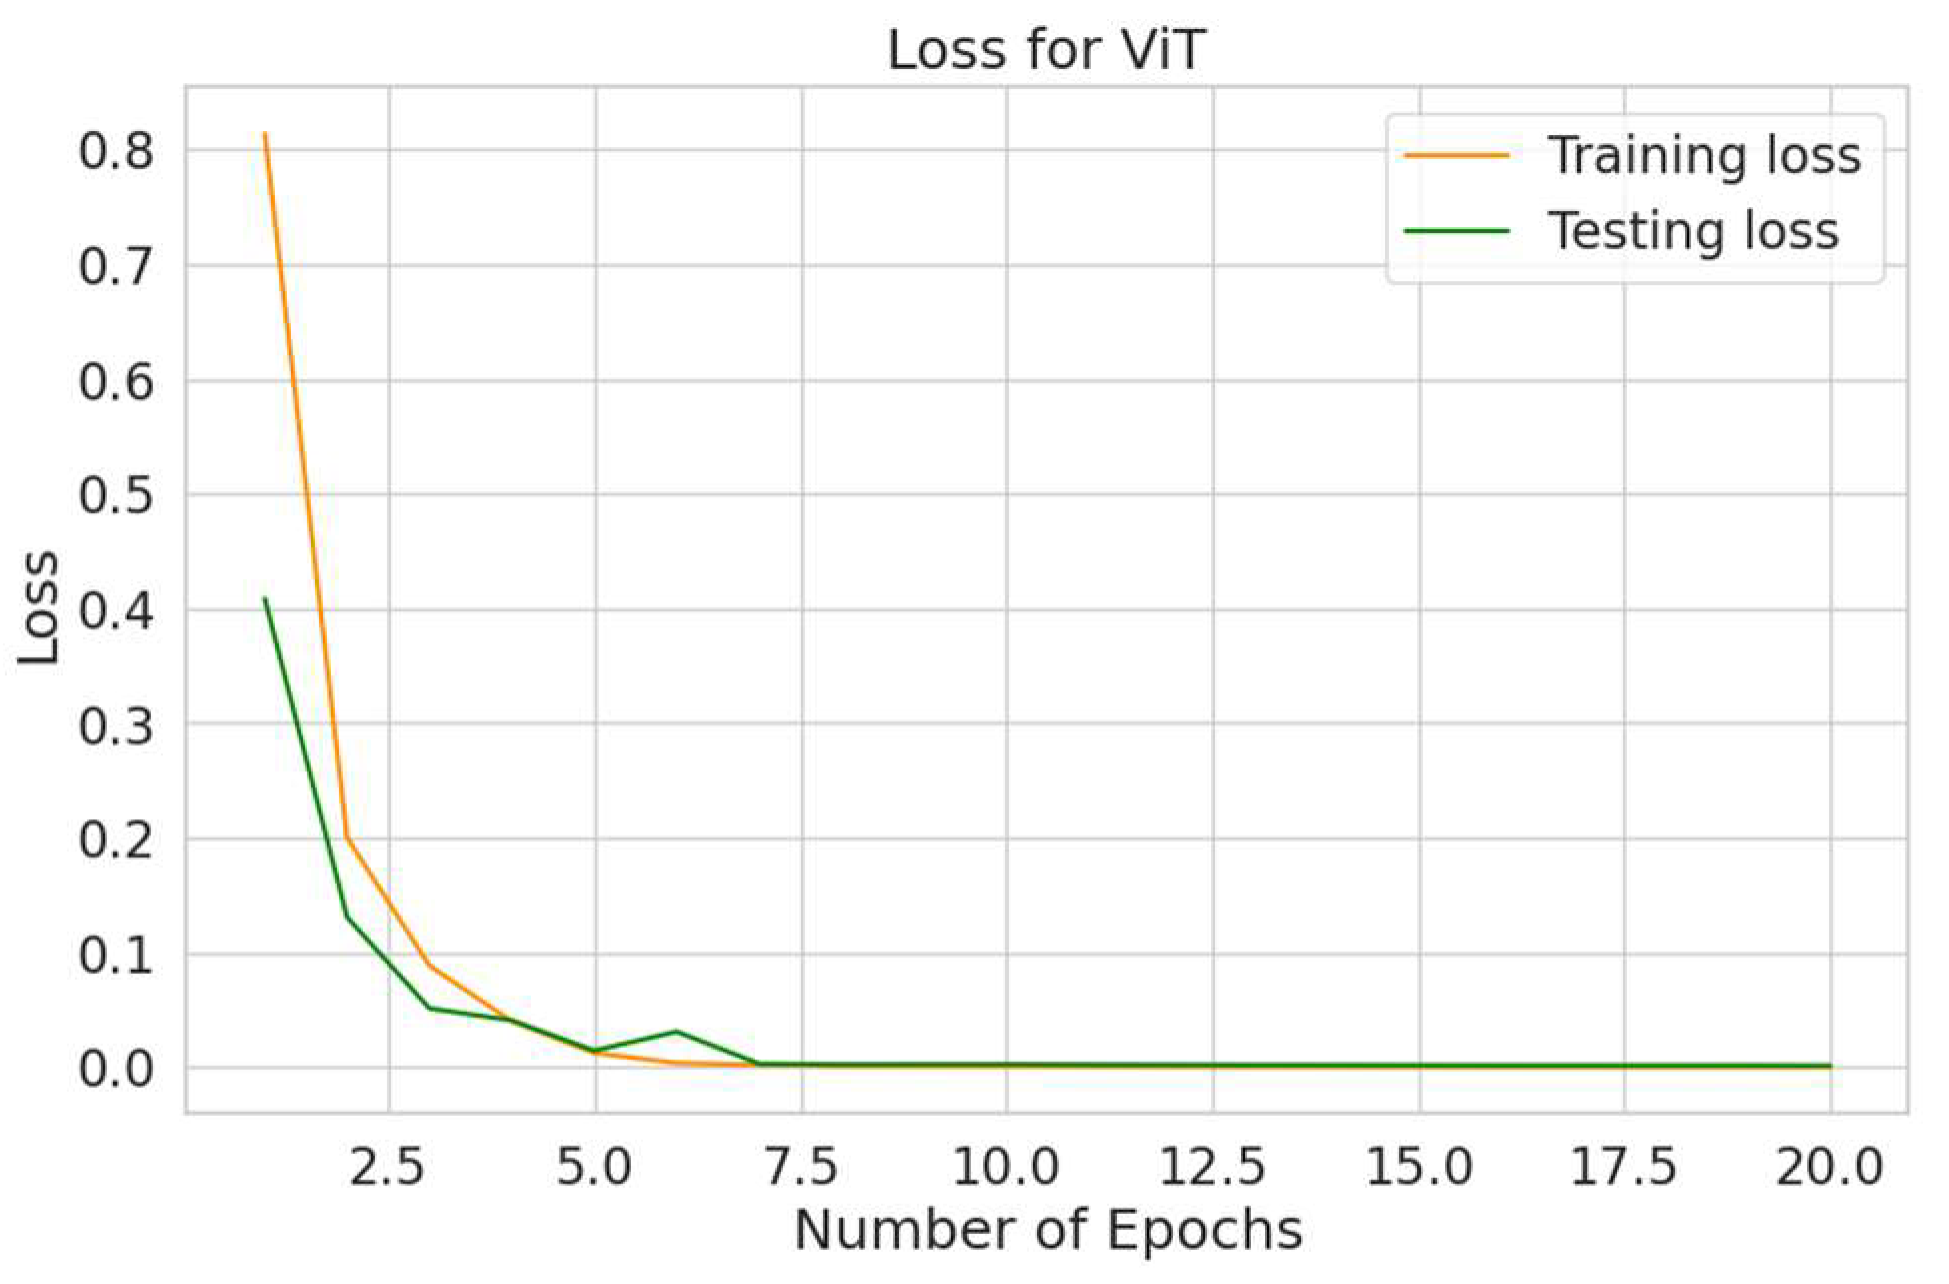
Figure 16 shows the loss in training and testing phases for ViT. The LR of training starts at 0.8136 and terminates at 0.0003, and the LR of testing commences from 0.4085 and reduces to 0.0015.
Table 4 illustrates two metrics: specificity and sensitivity, which are essential in the medical field for evaluating the performance of the models to diagnose heart patients. The macro averages of specificity and sensitivity for the Swin Transformer are 99.58% and 99.16%, respectively. For VGG-19, the macro averages of the two metrics are 97.08% and 94.17%, respectively, for specificity and sensitivity. The ViT achieved 100% for both metrics.
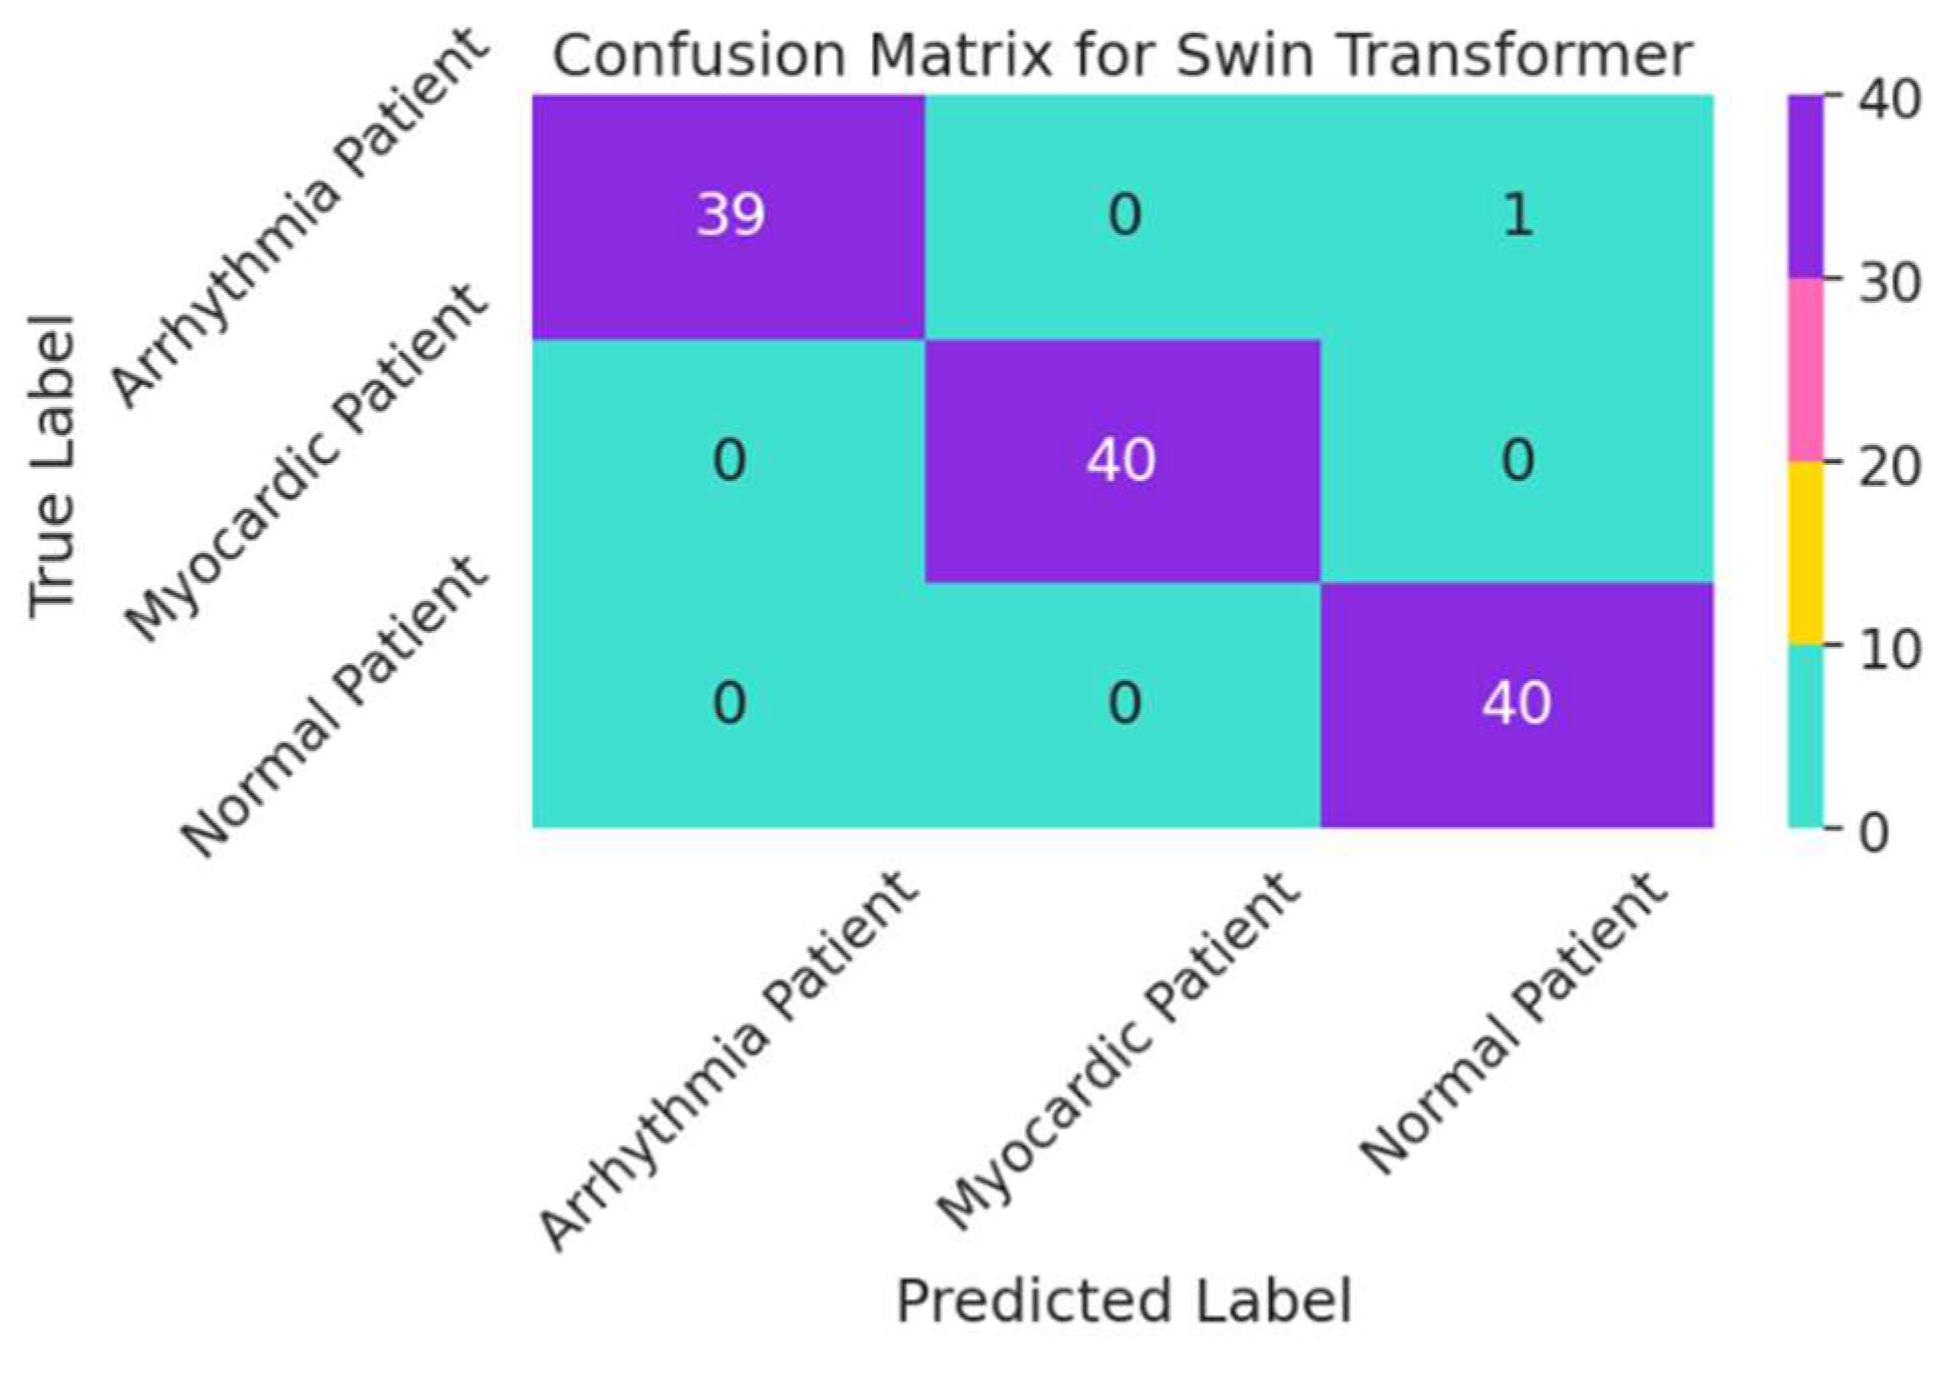
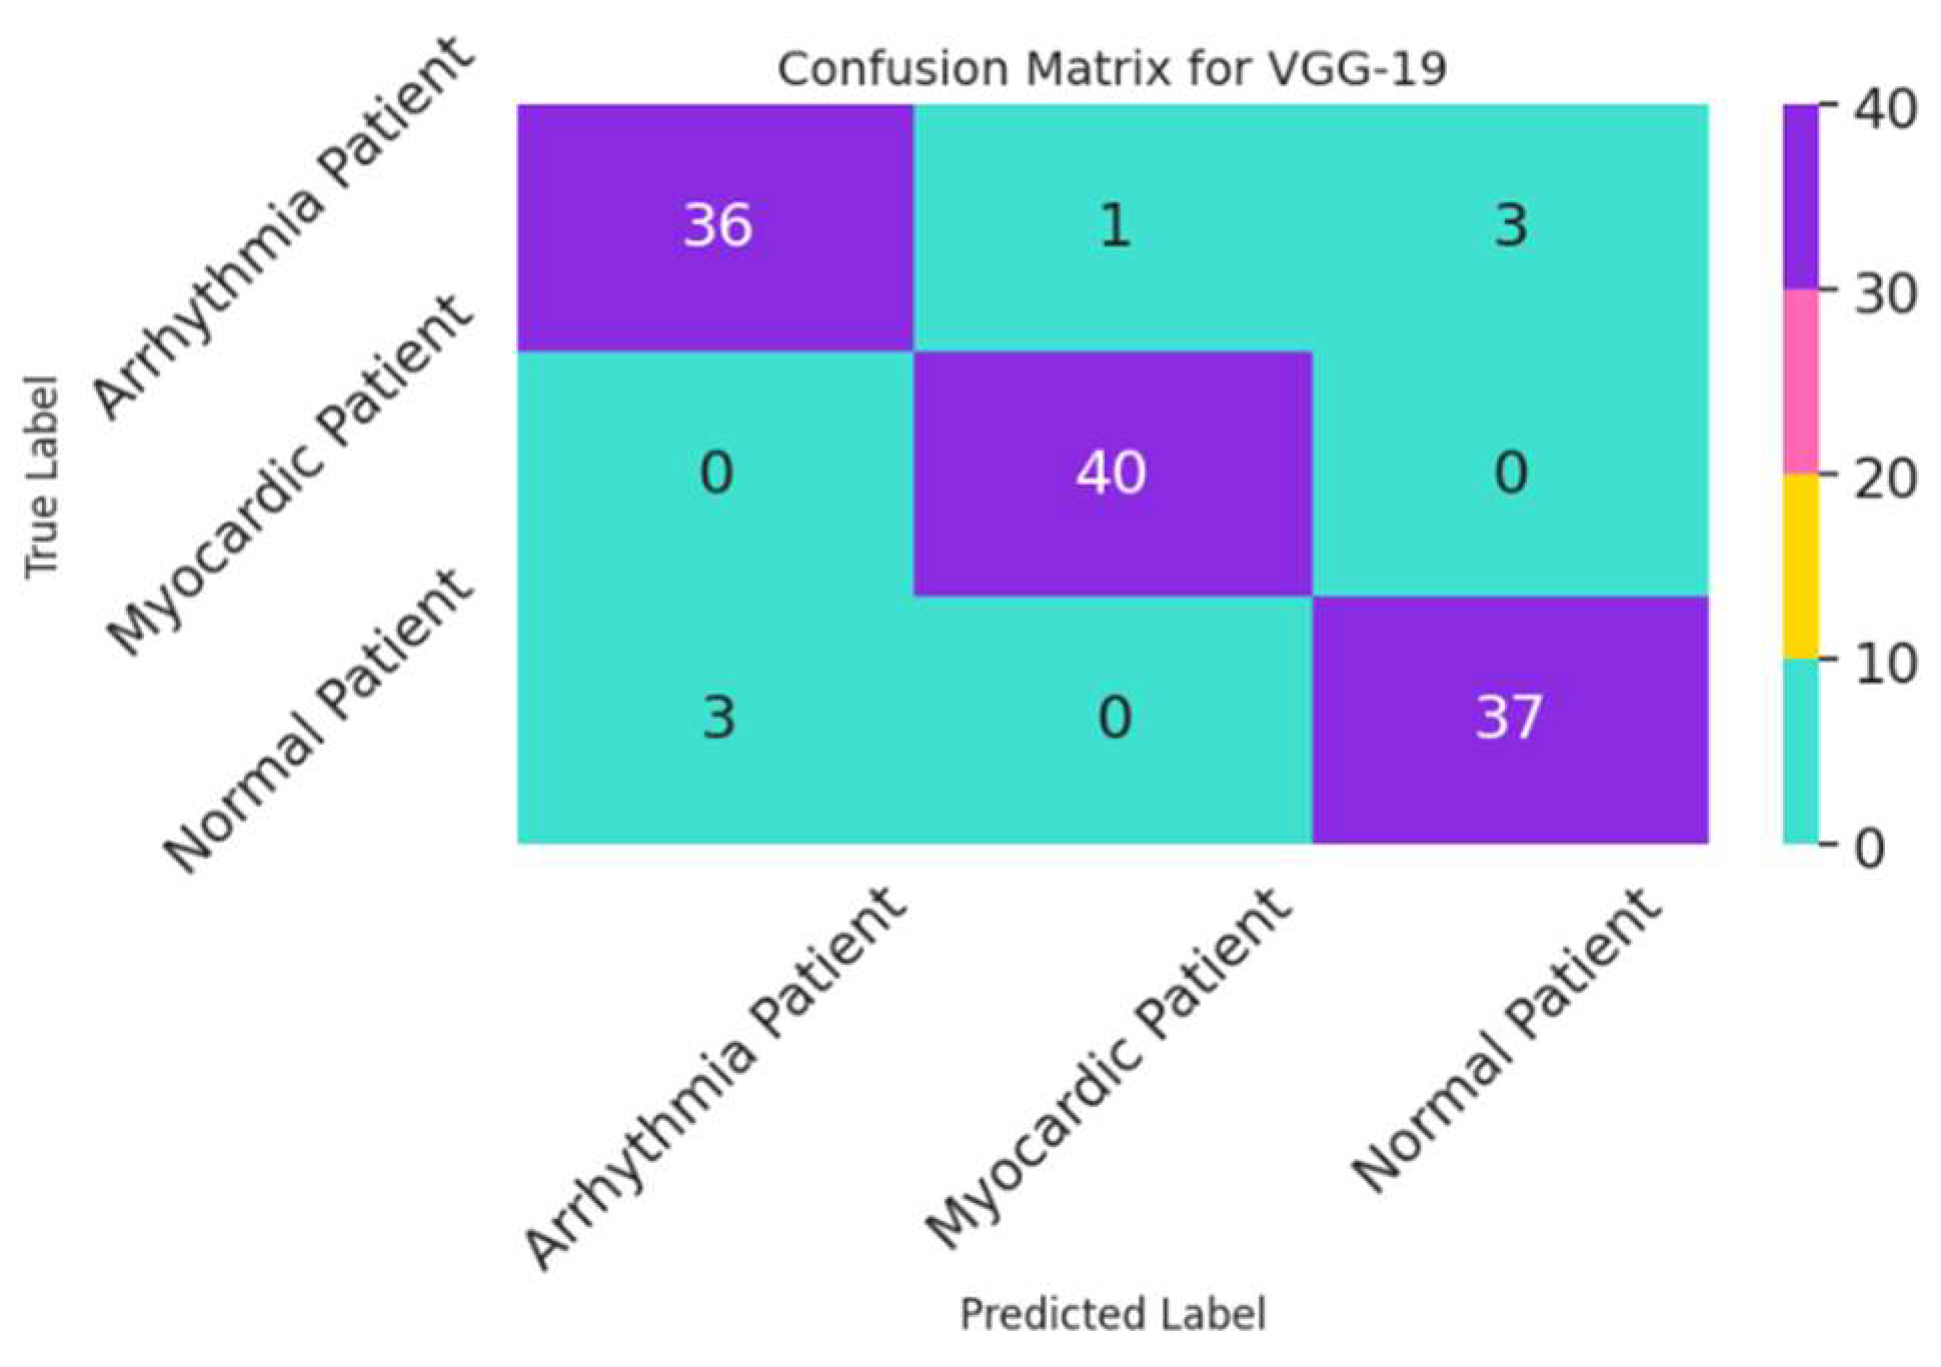
Figure 17 presents a confusion matrix (CM) of the Swin Transformer. This CM predicts data of 39, 40, and 40 as true positives for the three categories: Arrhythmia Patient, Myocardic Patient, and Normal Patient, respectively. Figure 18 shows the testing data via the CM of the VGG-19, illustrating 113 samples in the test dataset that are accurately classified. The true label matched a predicted label for Arrhythmia Patient, Myocardic Patient, and Normal Patient in 36, 40, and 37 samples, respectively.
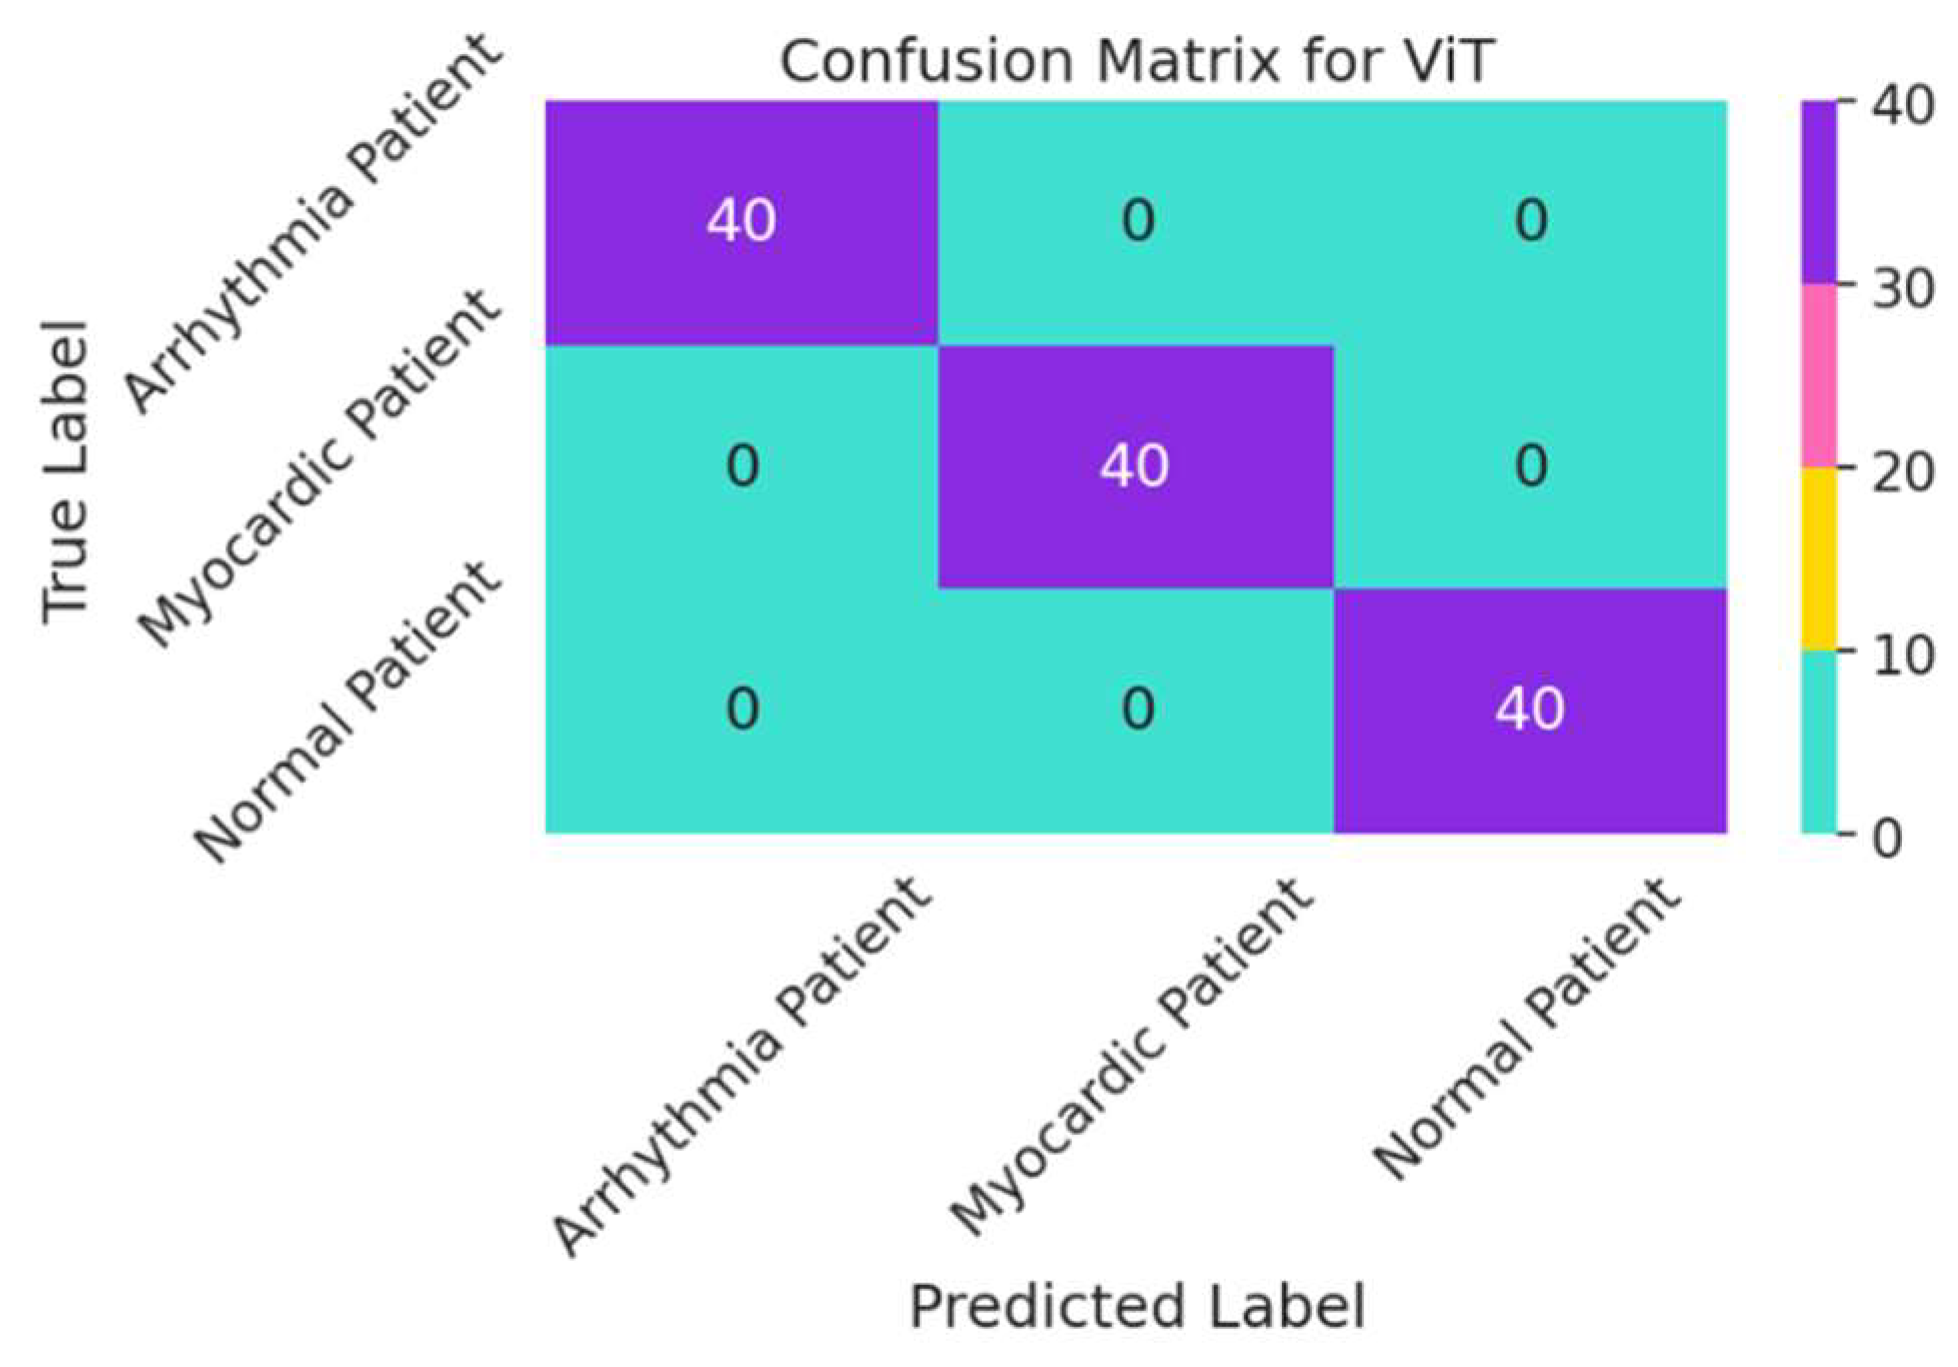
The CM for the ViT is presented in Figure 19. In this figure, the ViT operates with the highest accuracy, and there is no error obtained below and above the diagonal of this CM. In other words, the predicted values are zero.
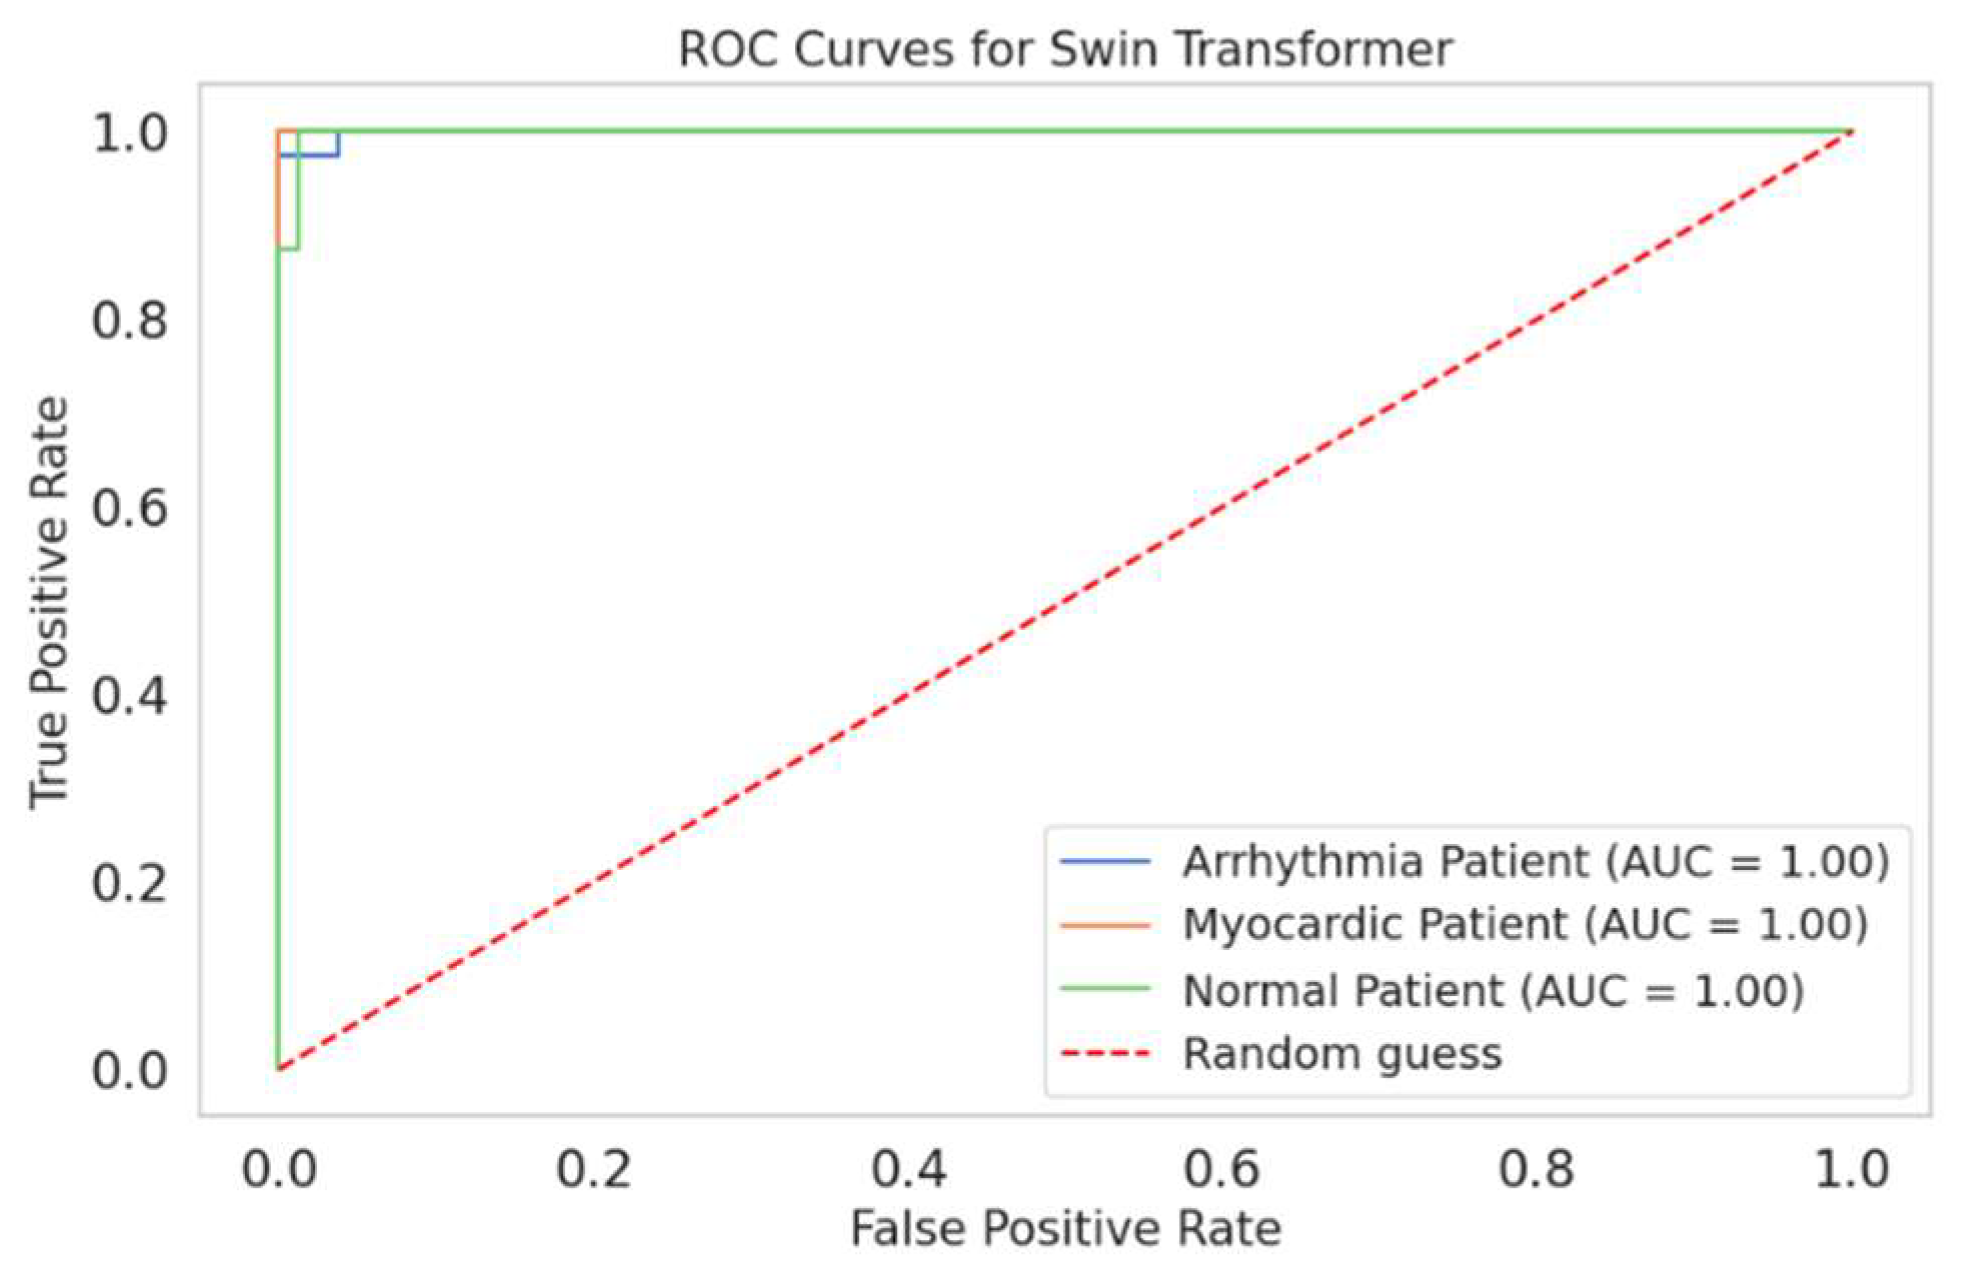
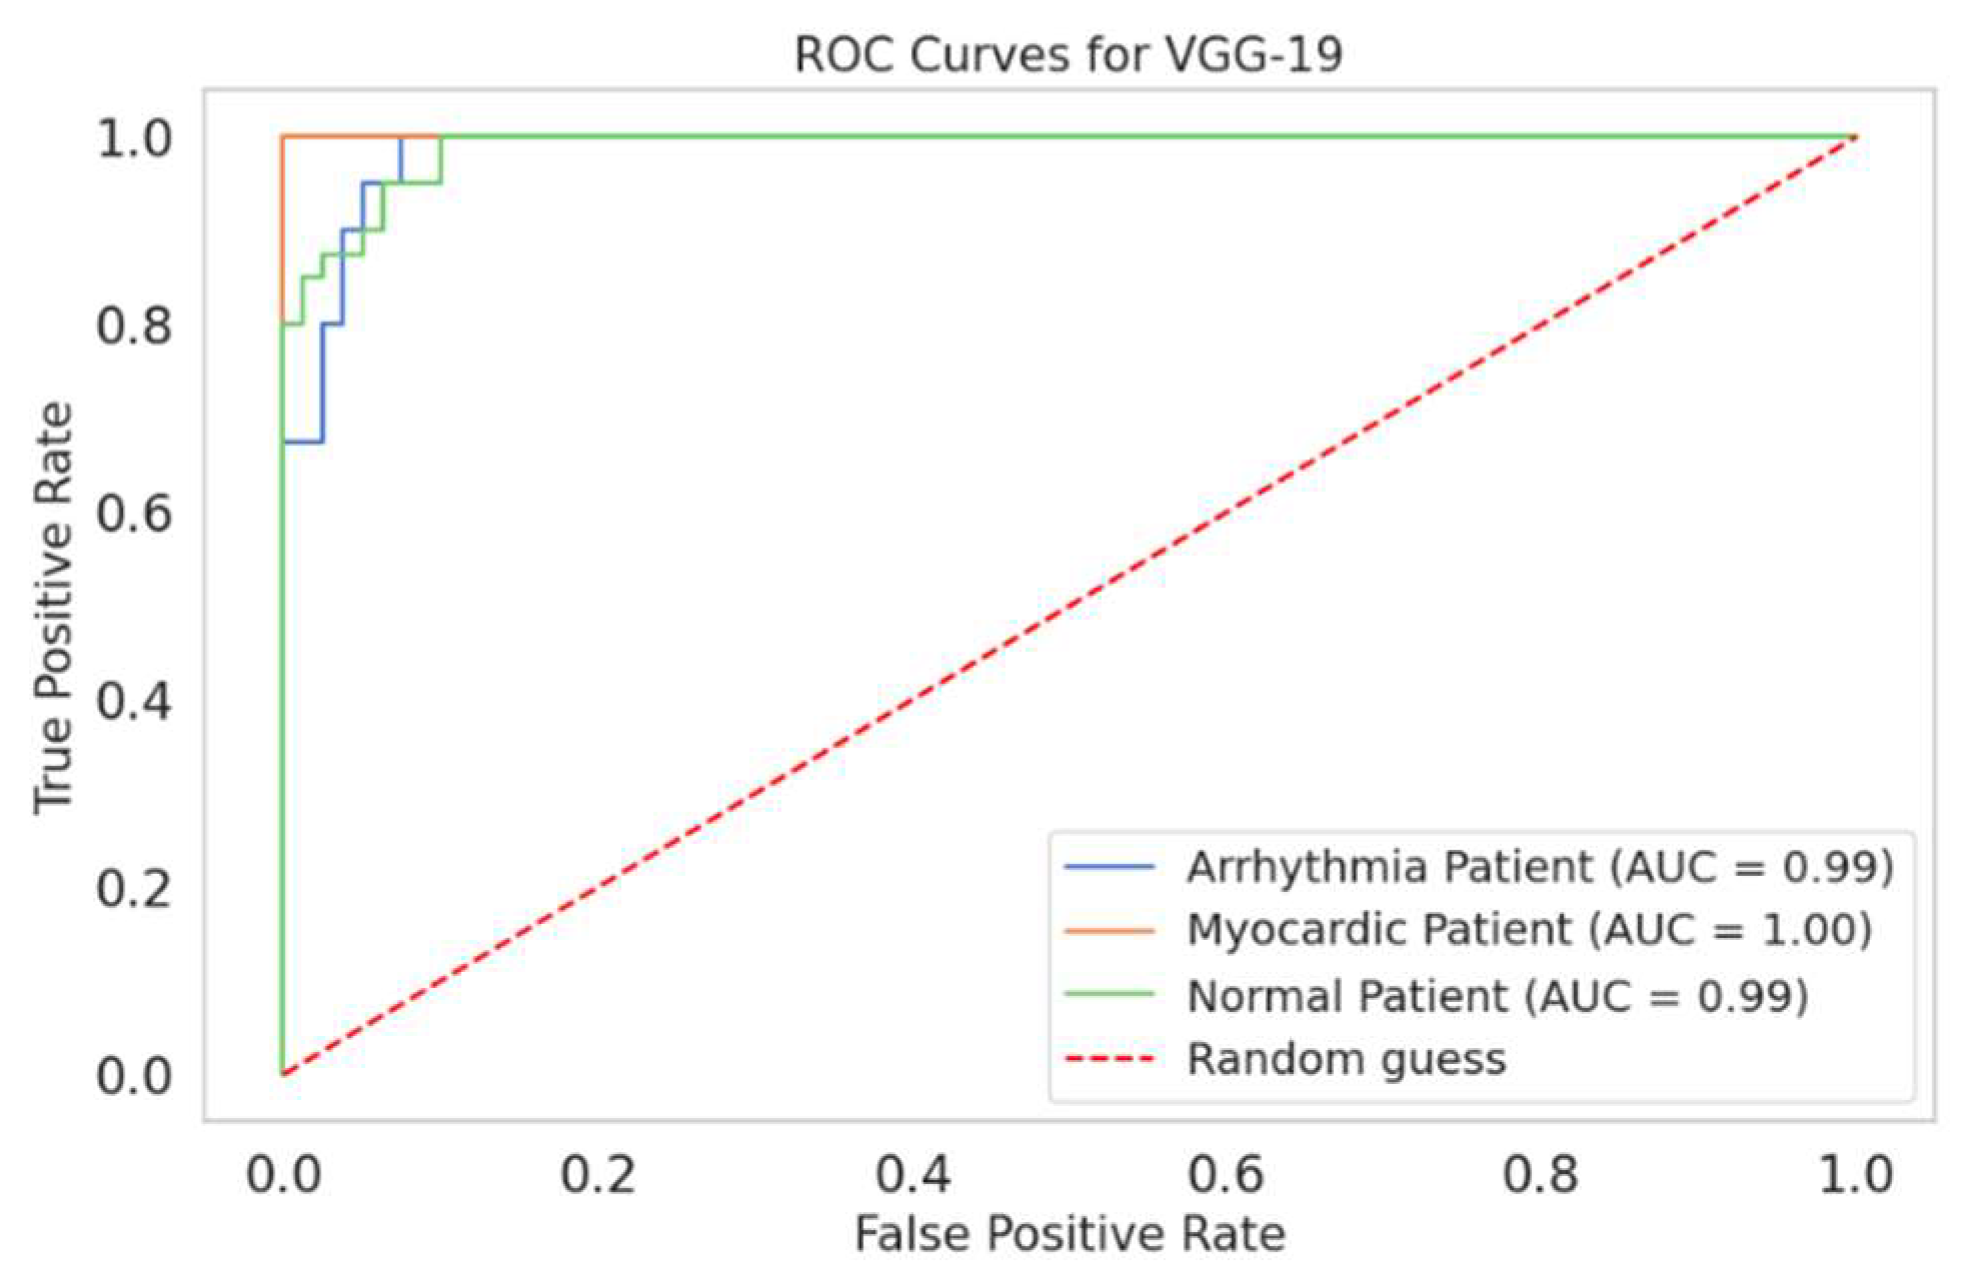
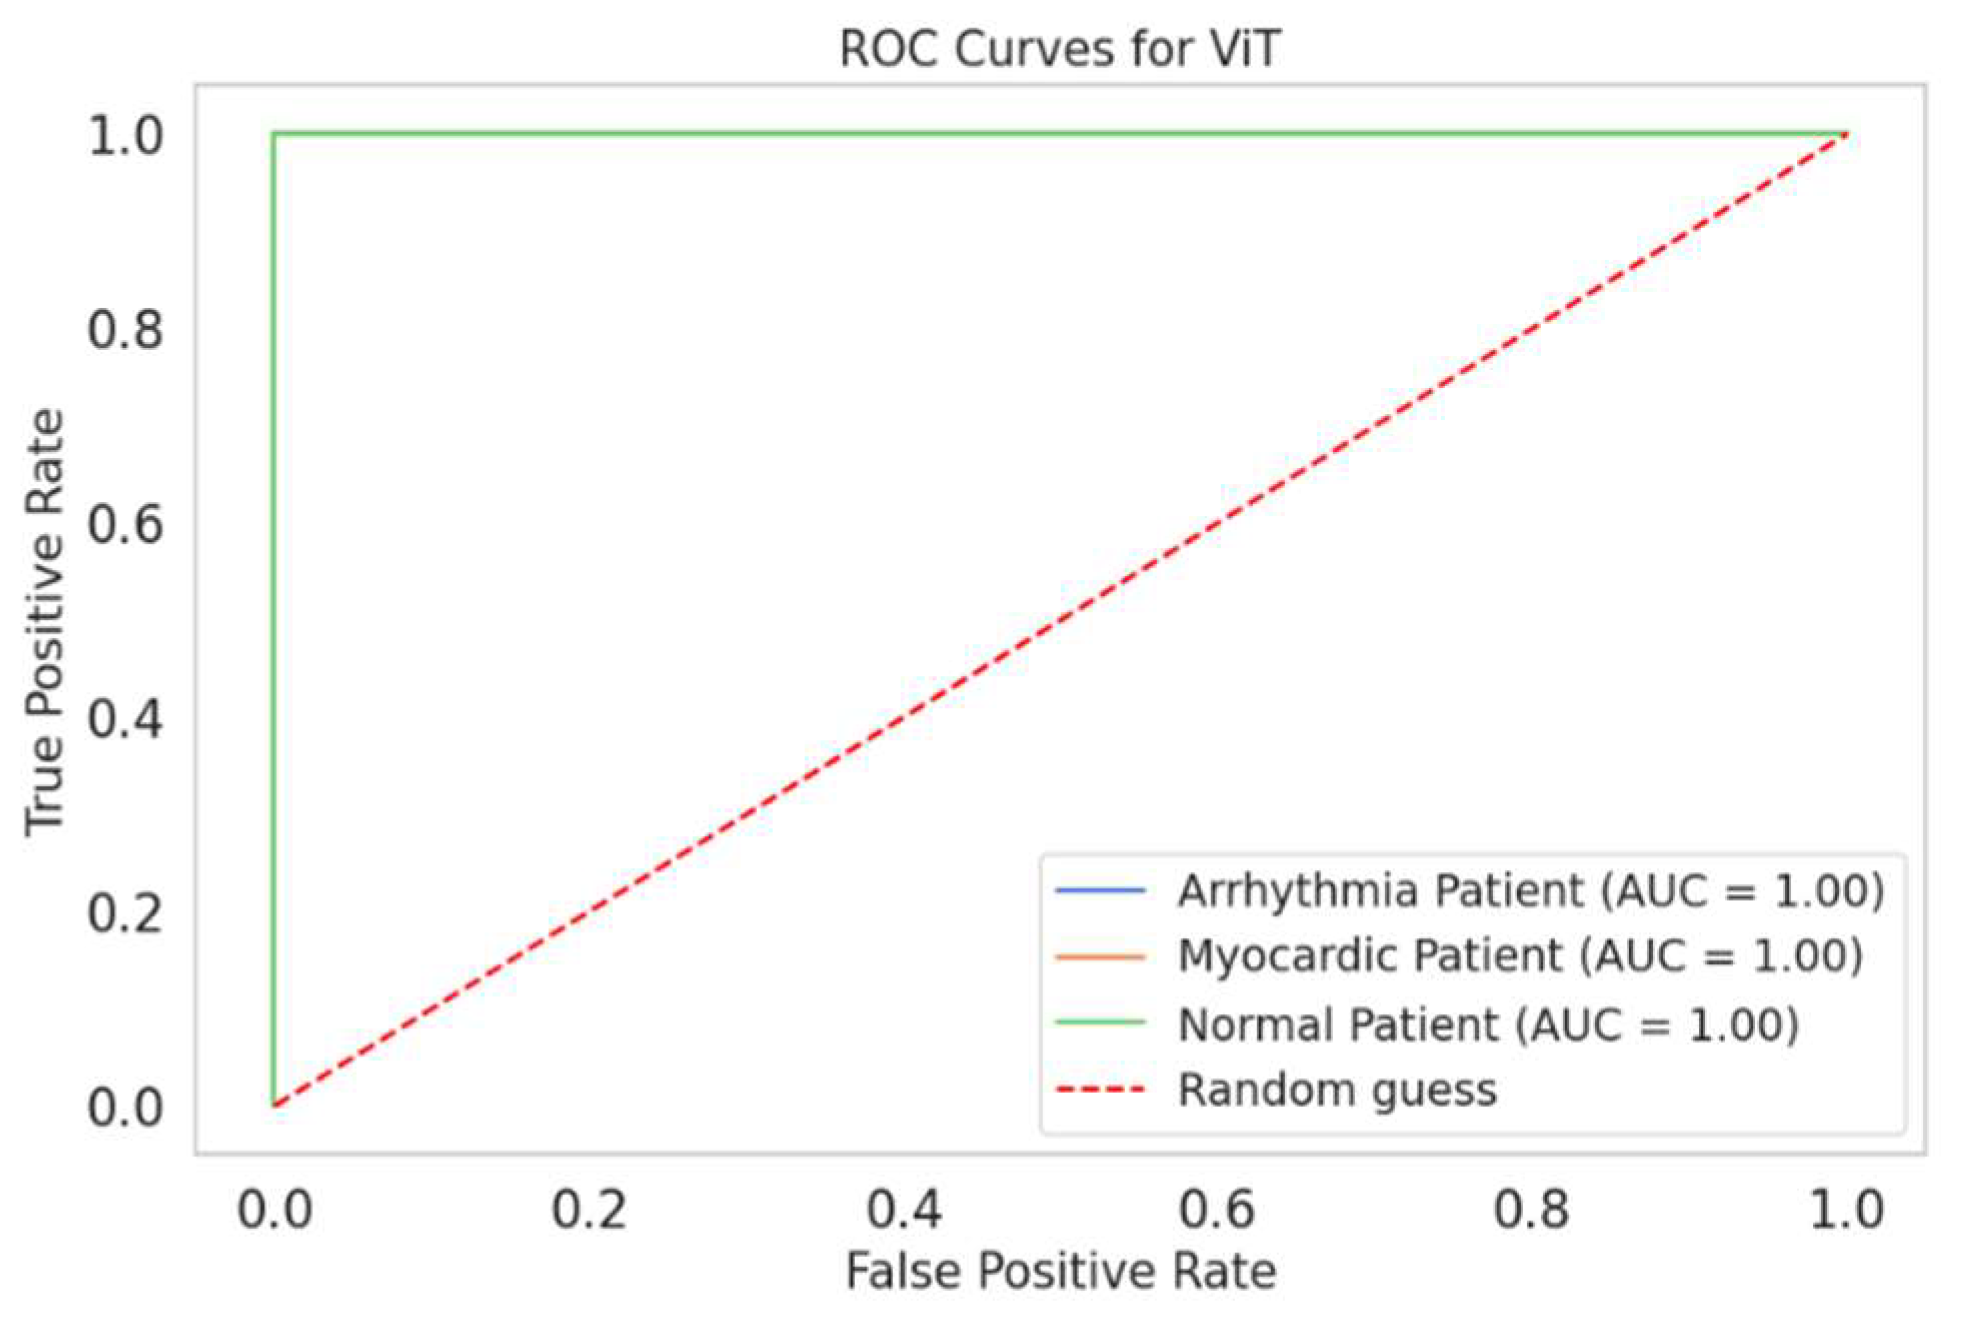
ROC curves are revealed in Figure 20, Figure 21 and Figure 22. The curves represent many likelihoods used to judge the Swin Transformer, VGG-19, and ViT. Figure 20 demonstrates the area under the ROC curves of the Swin Transformer for the three classes: Arrhythmia Patient, Myocardic Patient, and Normal Patient, which have areas of 1.00 (100%). Therefore, the average macro and micro areas for the three classes are 1.00. Figure 21 presents the ROC for VGG-19. This Figure has the values for the Arrhythmia Patient, Myocardic Patient, and Normal Patient classes, which provide areas of 0.99, 1.00, and 0.99, respectively. Figure 22 reveals the ROC for ViT, providing area values of 1.00 for the three categories. Hence, the mean area under this curve is 1.00. This obtained result ensures that the ViT and Swin Transformer provide the highest performance in classification compared to the VGG-19. The micro-average value of area is computed via the area summation of each class divided by the number of classes (three classes in this case), while the macro-average value is computed by taking the area metric value for each class independently and then taking the average of all three classes.
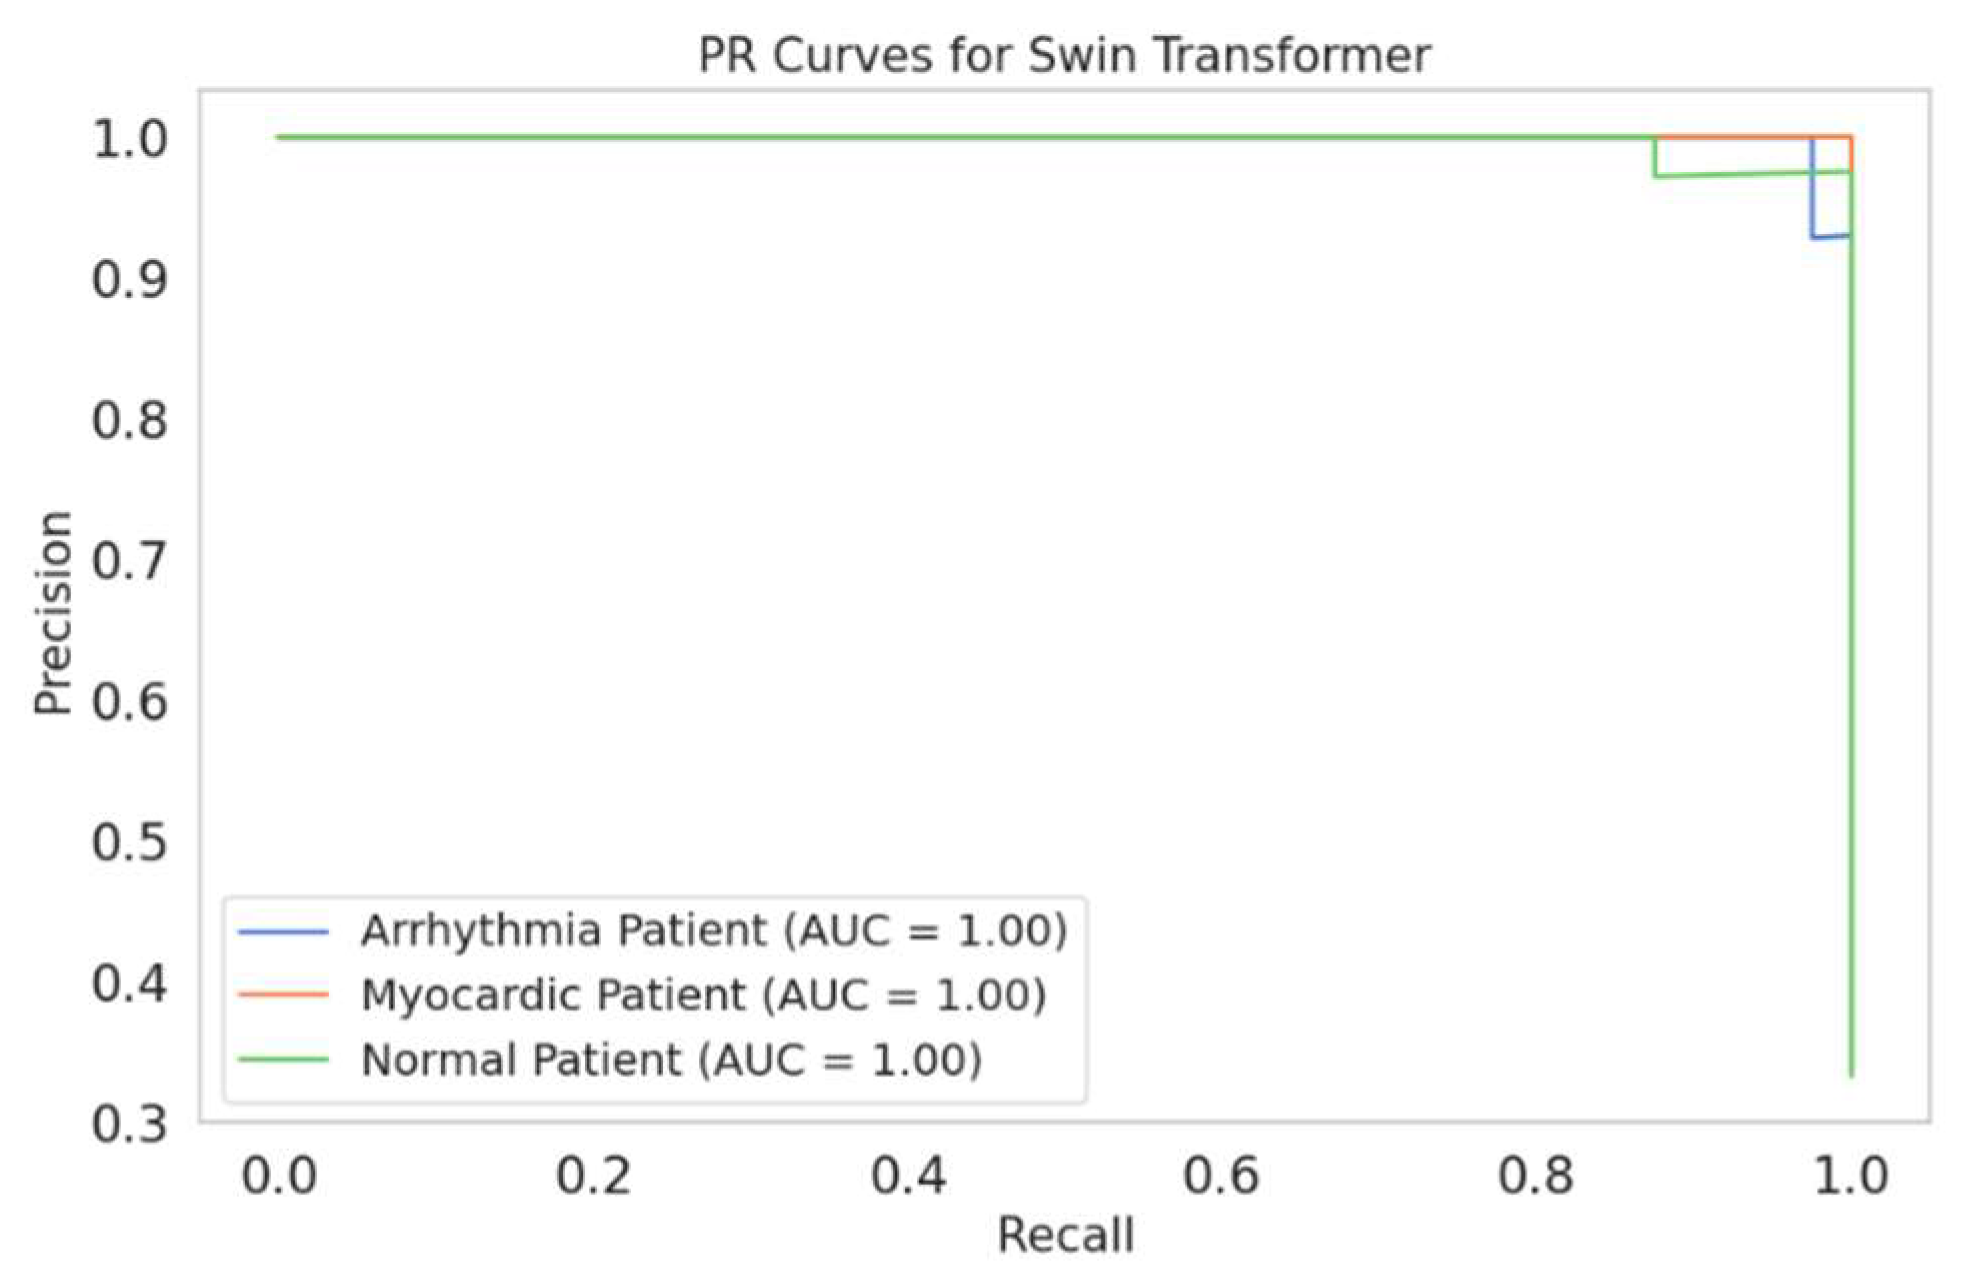
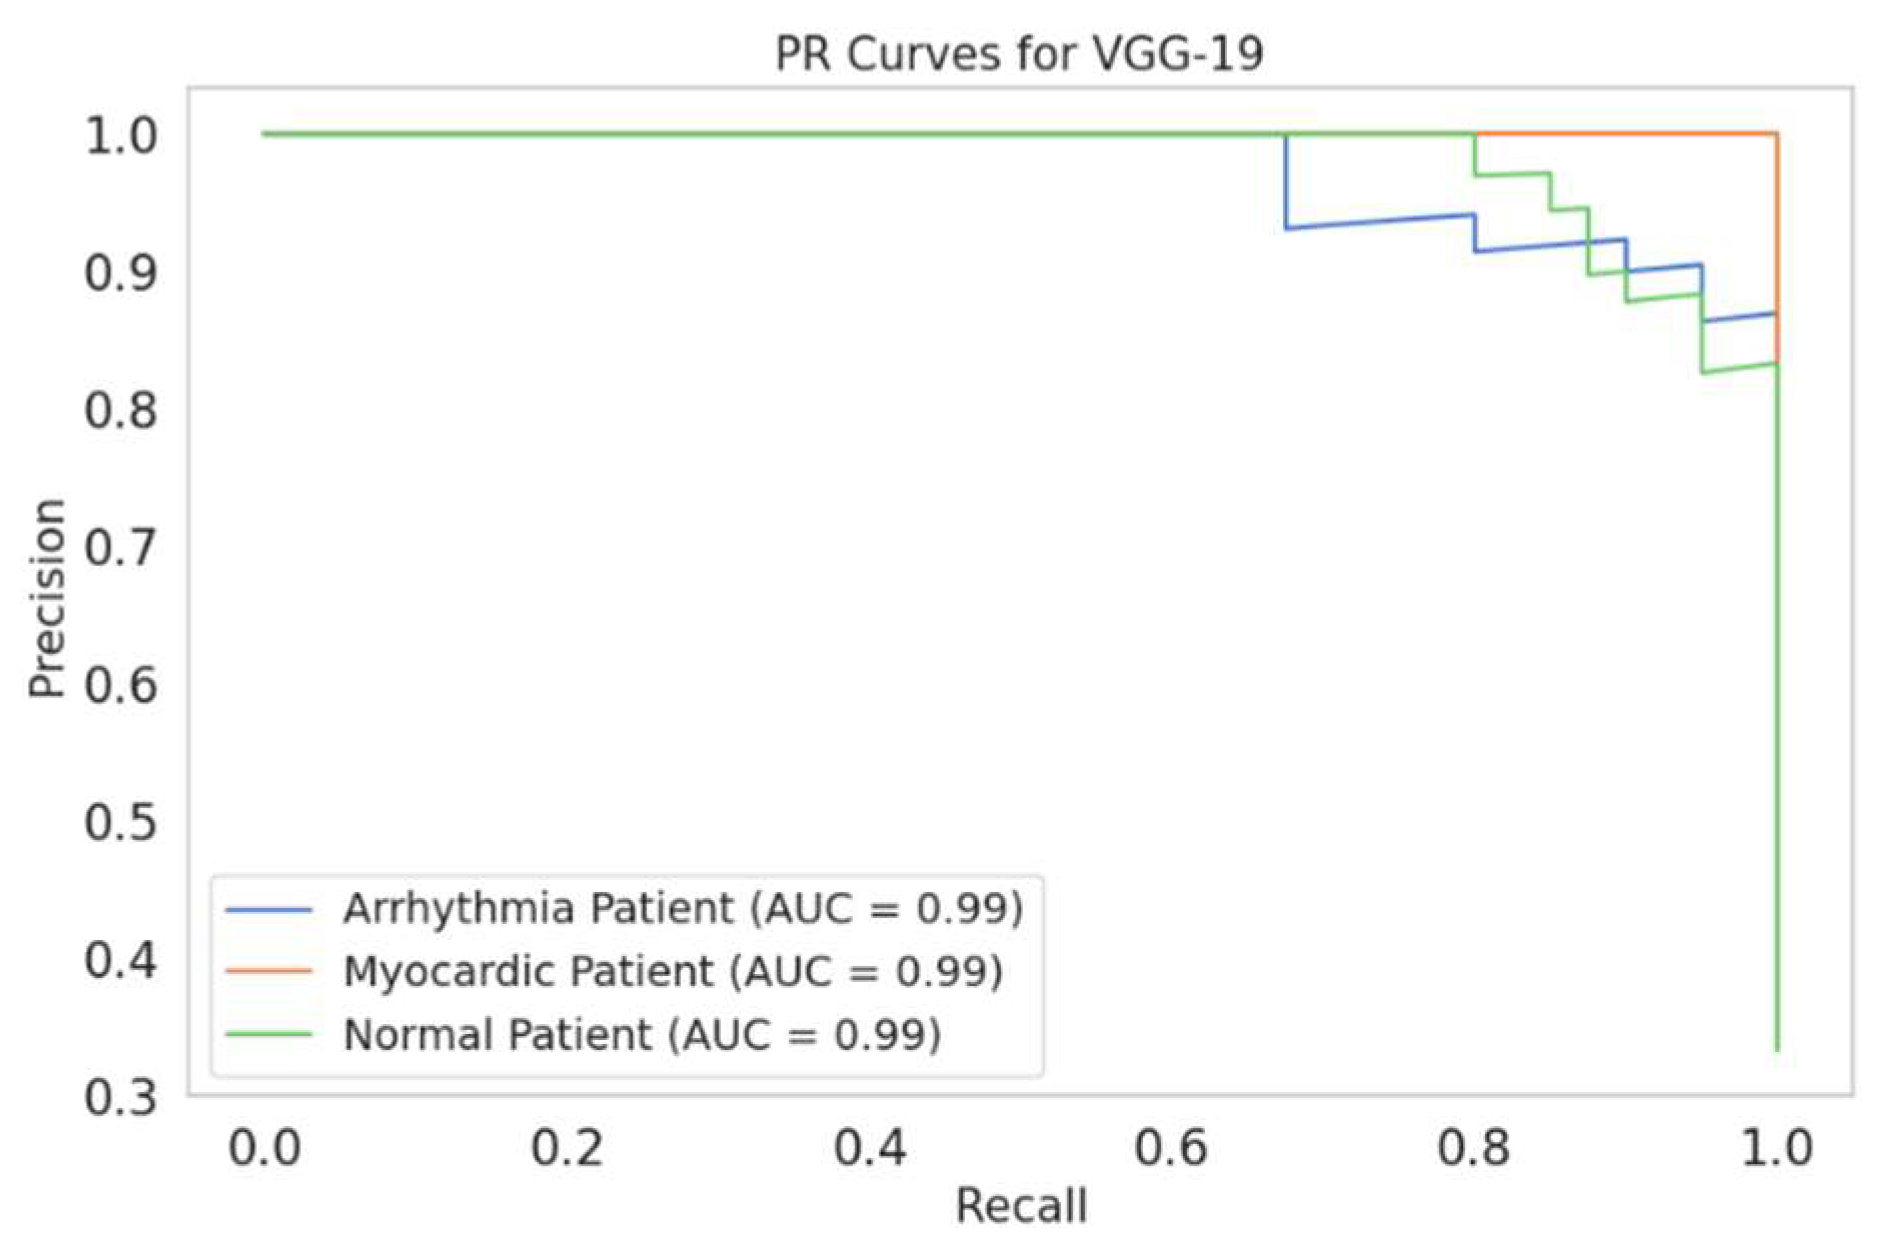
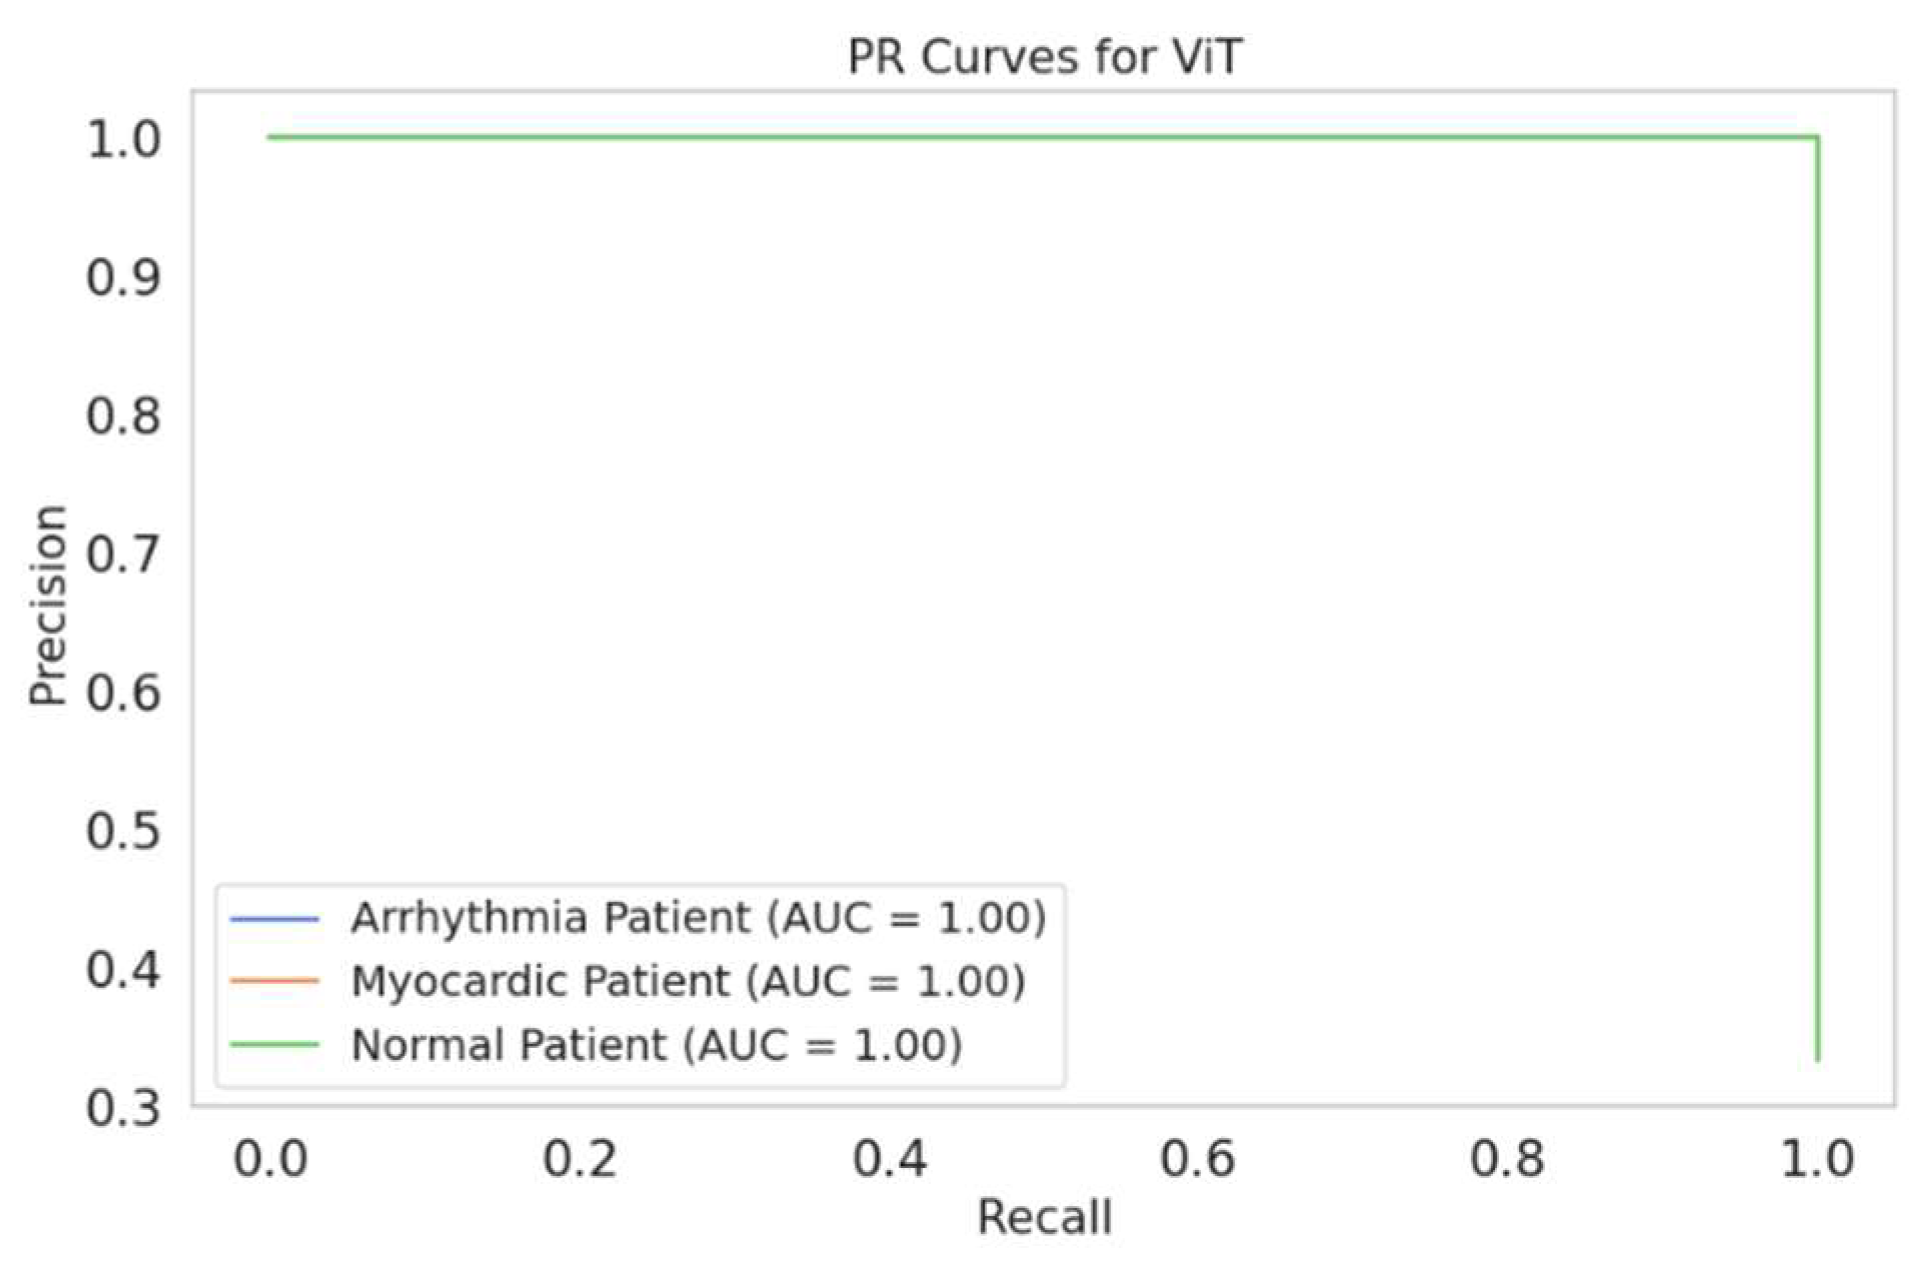
Figure 23 demonstrates PR curves for the proposed Swin Transformer for each class. Arrhythmia Patient, Myocardic Patient, and Normal Patient achieve an area under the precision–recall (AUPR) curves of 1.00 (100%). Therefore, the average area is 1.00 for the three classes. Figure 24 illustrates the AUPR curves for the VGG-19. In this figure, the area values are given for all classes of 99%. Therefore, the VGG-19 has a mean area is 99%. Figure 25 presents the AUPR curves for the ViT; all areas achieved 1.00 for the three classes. This means that the average area is 1.00 (100%). Hence, ViT and Swin Transformer achieved the highest performance in classification compared to the VGG-19.
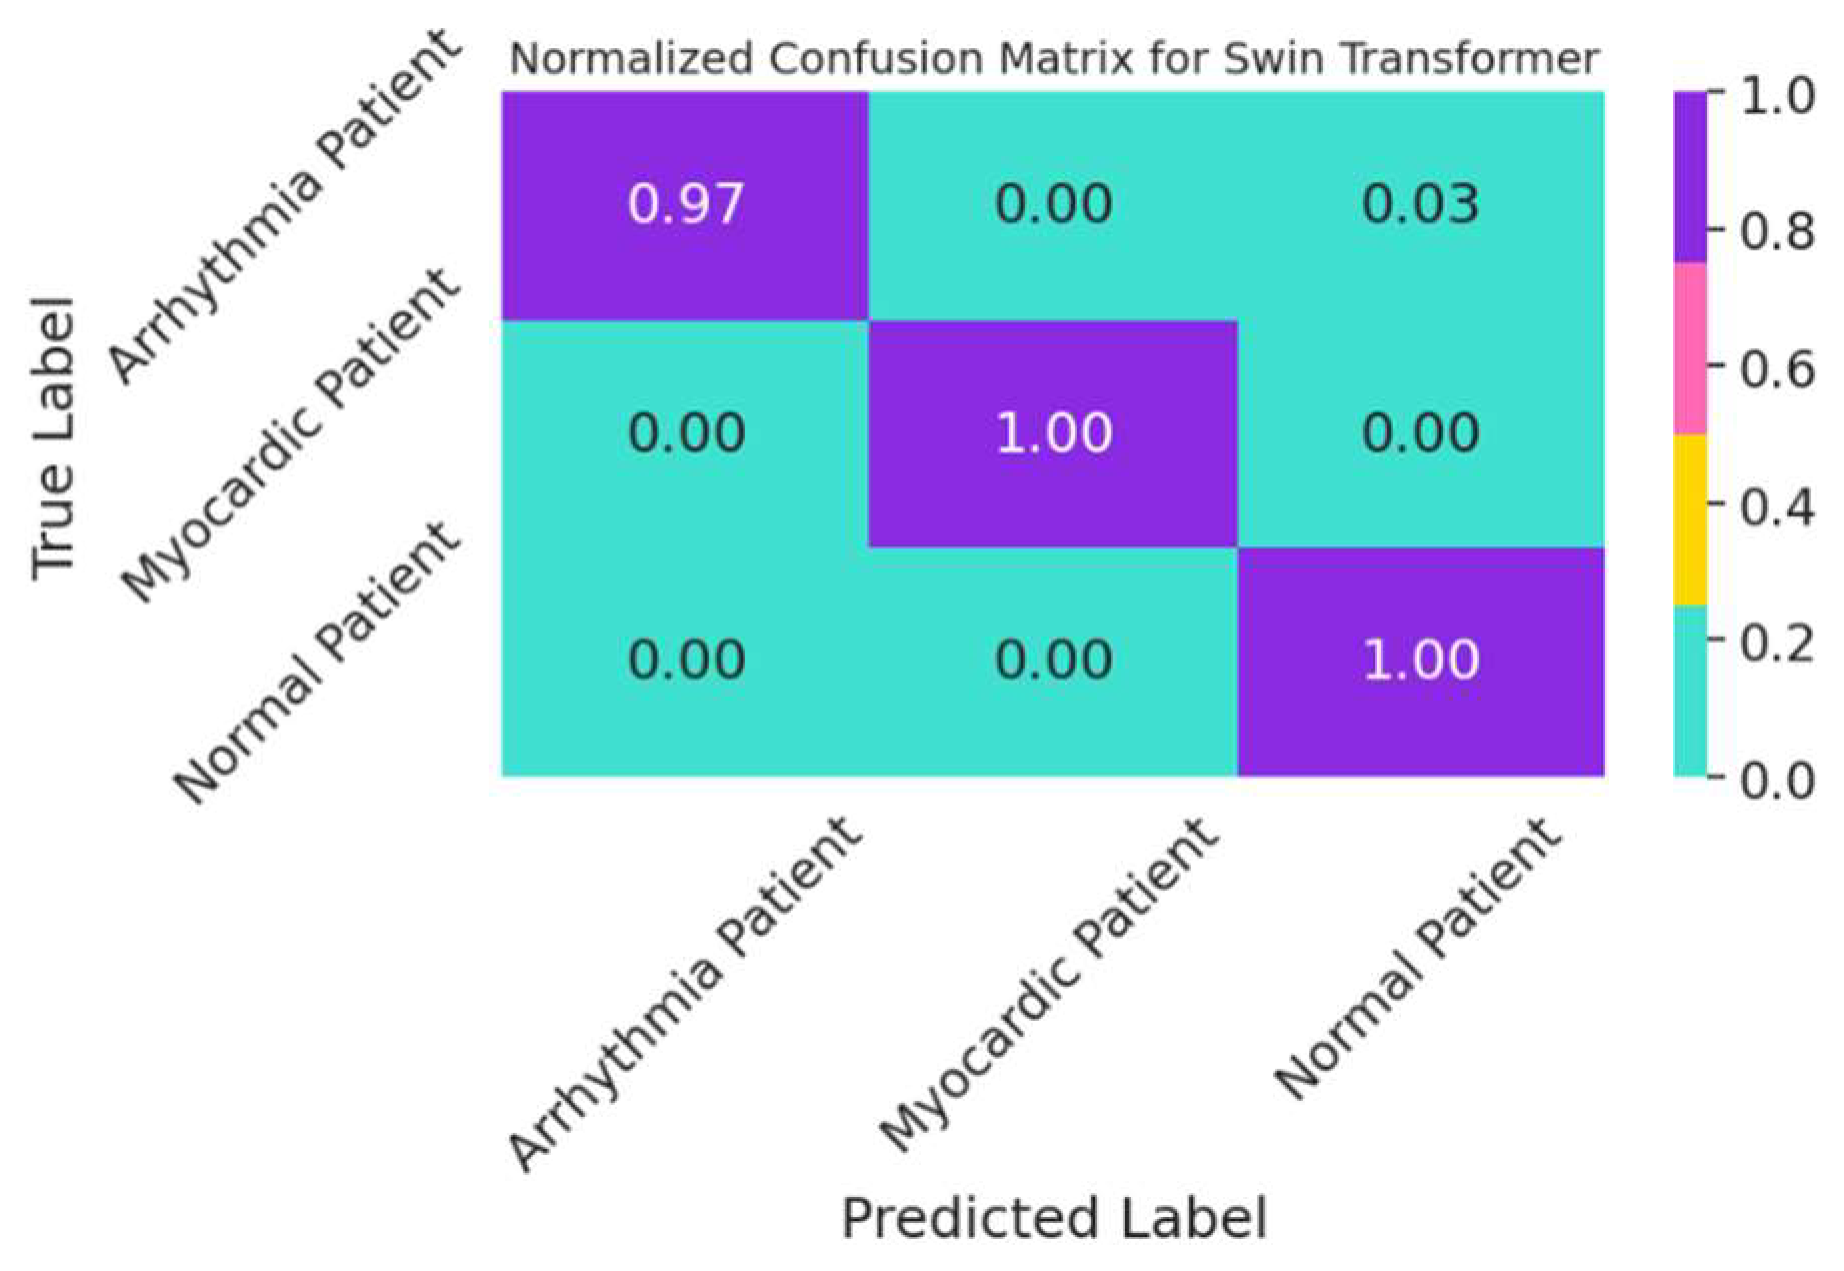
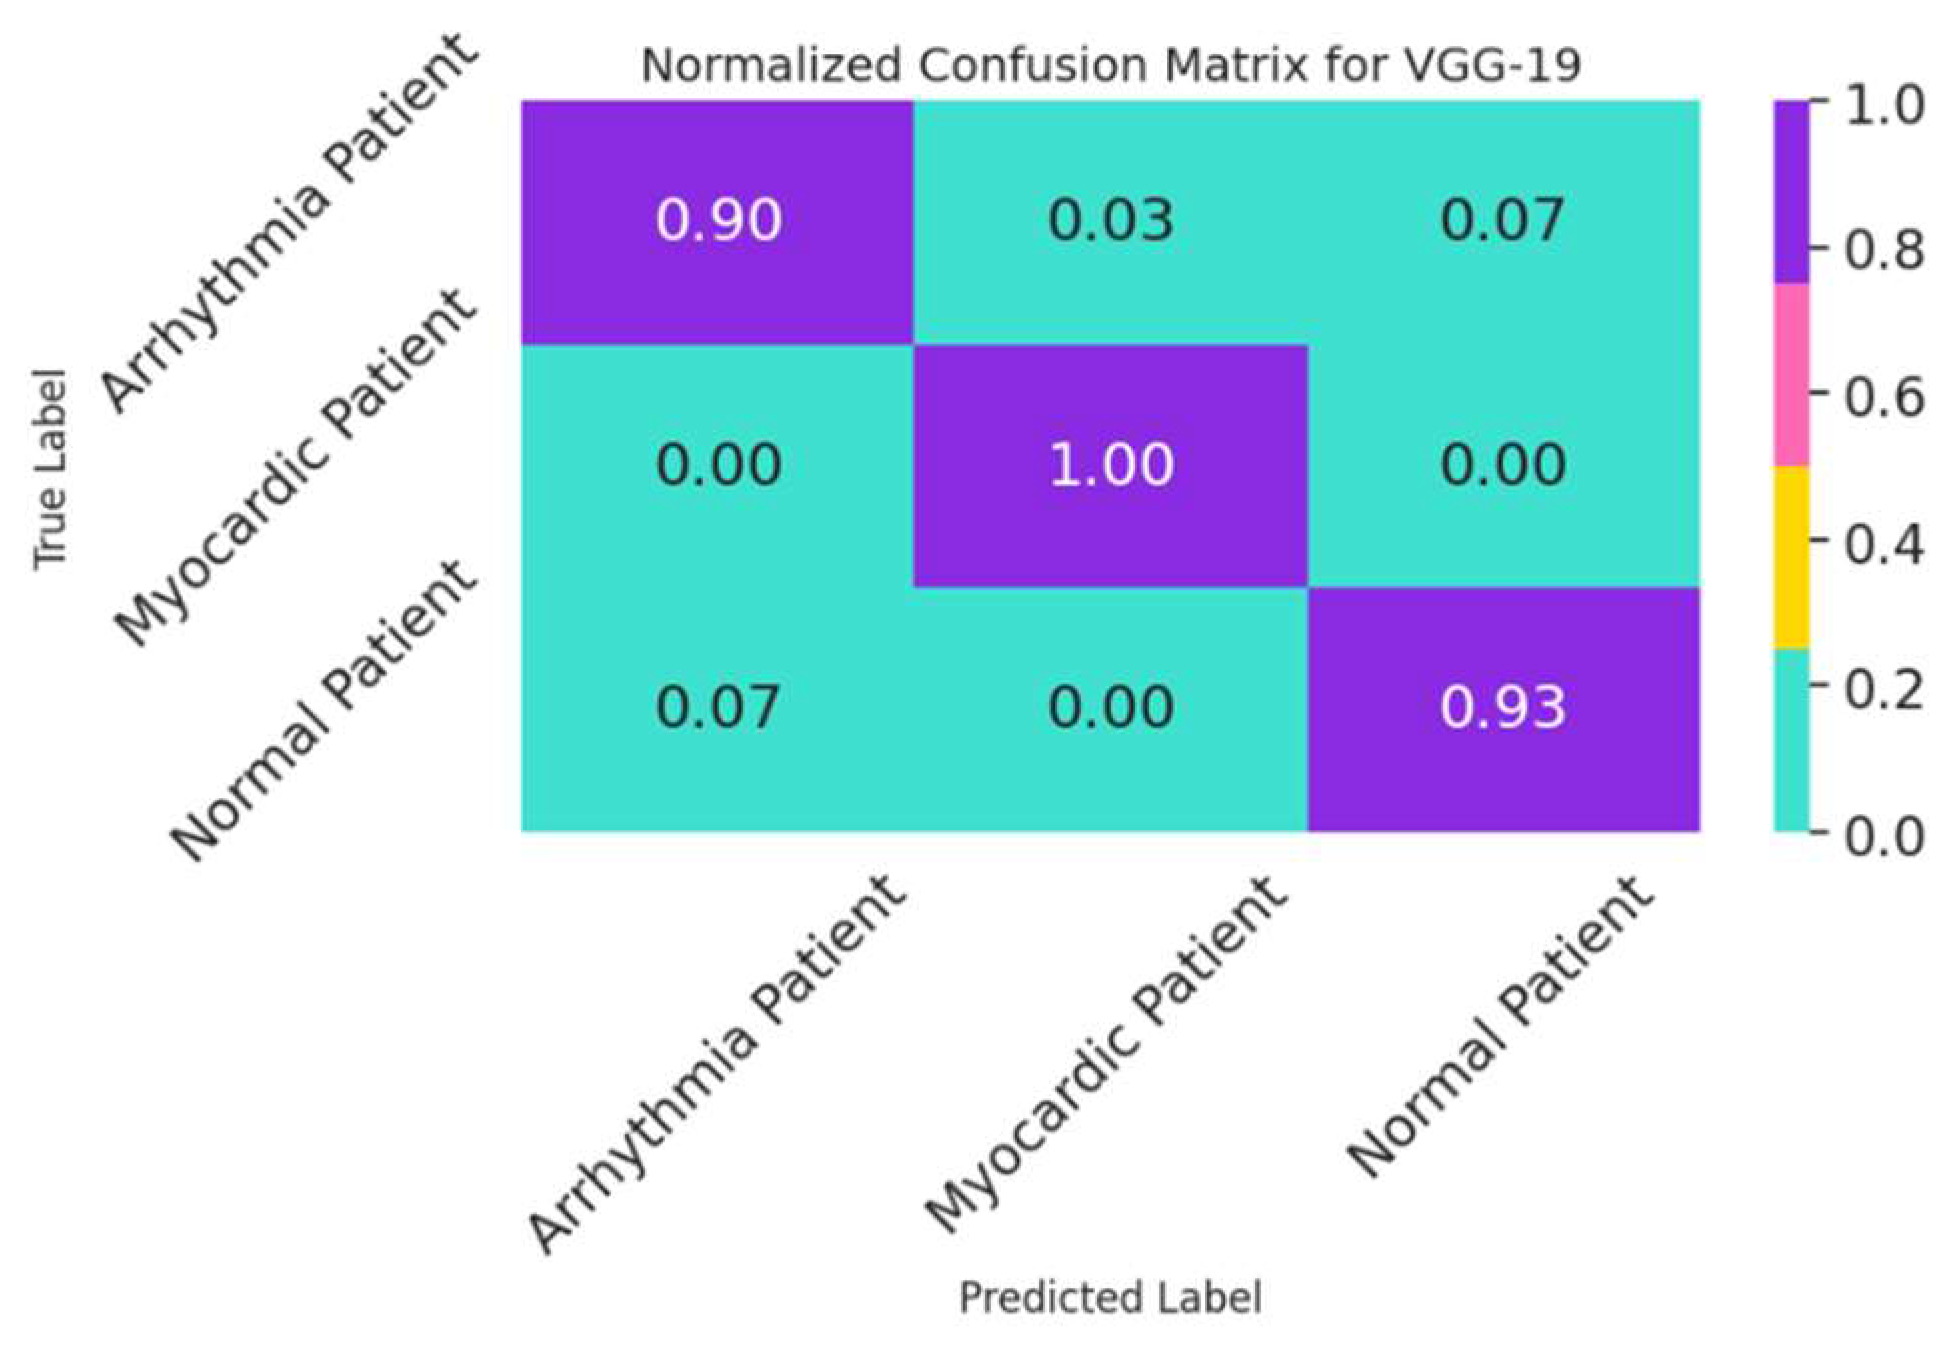
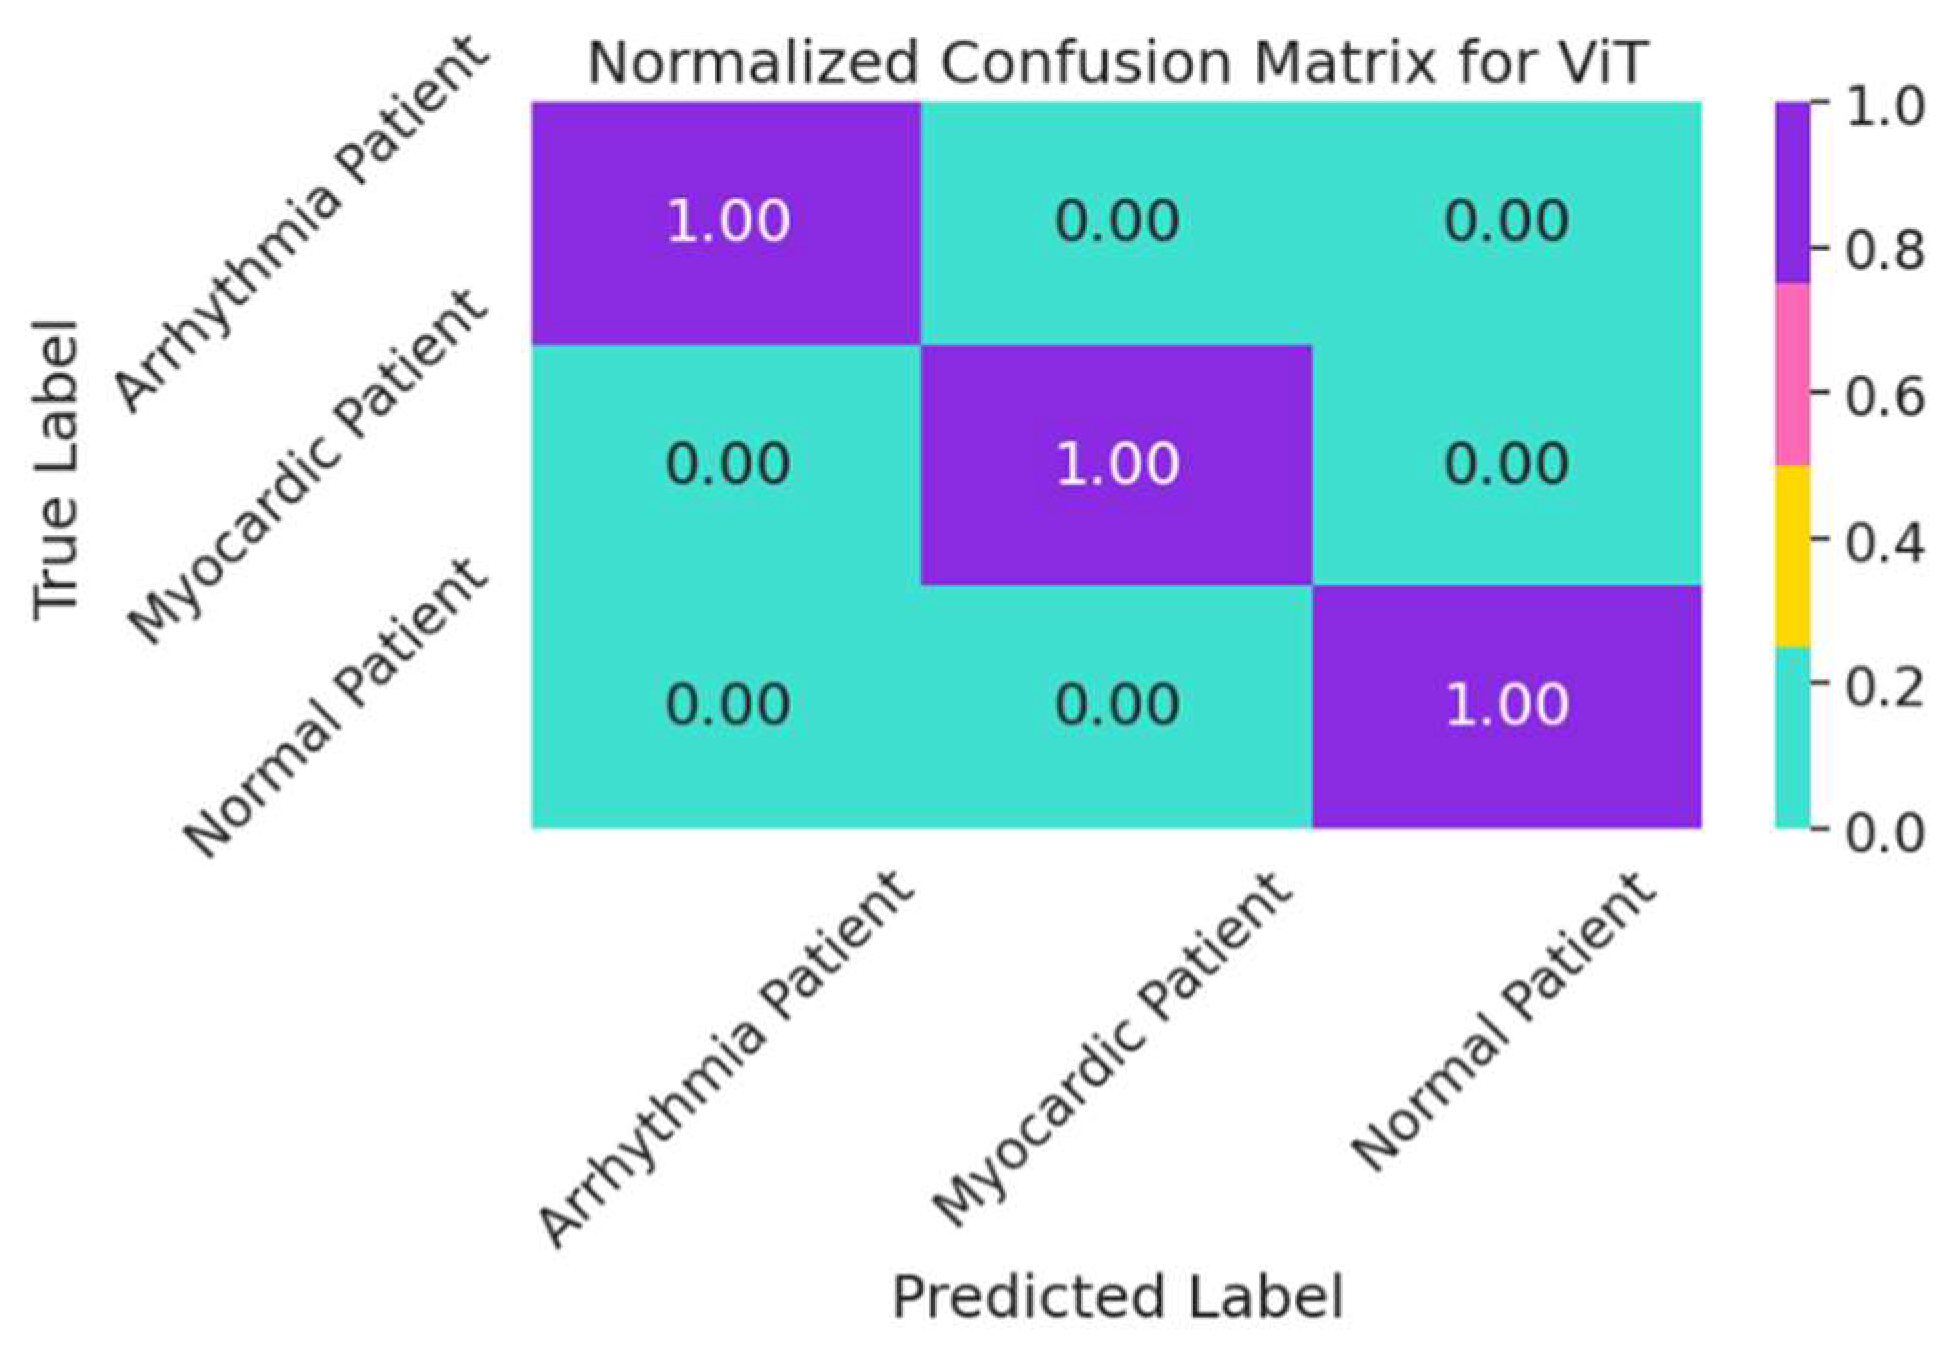
Figure 26, Figure 27 and Figure 28 illustrate the classification performance of the models via normalized confusion matrices (NCMs). Figure 26 and Figure 27 show prediction error rates of the Swin Transformer and VGG-19, respectively. The purple squares in these matrices show the accuracy of classification based on the testing dataset, while the values outside the purple diagonal illustrate errors in classification.
In Figure 26, the accuracy for the Arrhythmia Patient class is 0.97, while the accuracy for both Myocardic and Normal classes is 1.00. In Figure 27, the prediction error rate for the Arrhythmia Patient class is 0.90, the Myocardic Patient has no errors (0%), and the Normal Patient class has a few errors. The NCM for ViT is demonstrated in Figure 28. It has a classification accuracy of 1.00 “100%” for the three categories, with zero errors.
Thereby, the ViT has the highest performance in classification, with no errors. Therefore, the NCM ensures the three models’ efficiency using the testing dataset.
Table 5, Table 6 and Table 7 demonstrate classification reports of the Swin Transformer, VGG-19, and ViT, respectively. These reports present the precision, true positive rate (TPR), and F1-score.
As shown in Table 6, for ViT, the values of precision, TPR, and F1-score are 1.00 (100%), while the classification accuracy is also 1.00 across all three categories: Arrhythmia Patient, Myocardic Patient, and Normal Patient.

6. Discussion

The results present that the proposed ViT has the lowest error rate for training and testing phases and also has the highest precision for the three classes. The three models provided accurate classifications for the three heart categories based on the confusion matrix and PR curves. Figure 11 and Figure 13, and 15 illustrate the performance of the Swin Transformer, VGG-19, and ViT models in terms of the accuracy for training and testing phases. Figure 17, Figure 18 and Figure 19 show the error rates for the three classes. The ViT has the highest performance compared to the proposed Swin Transformer and VGG-19. Table 8 shows a comparison in terms of the testing accuracy (TA) percent between the proposed three models and the previous existing techniques.
The high performance of the models depended on a fine-tuning of some hyperparameters for these models, for instance, iterations of learning, the number of layers, loss and activation functions, batch-size (BS), the step size in the learning phase, optimizer type, and number of nodes in each layer for the proposed three models.
For the Swin Transformer and ViT, when the batch size (BS), number of epochs, and step size were selected to be 16, 15, and 0.002, respectively, through a softmax activation function, the Swin Transformer and ViT achieved a TA of 96.89% and 97.76%, respectively. When the BS was set to 32, the learning rate was alternated to 0.00001, the number of training iterations was selected to 20, with a softmax function, the TA of Swin Transformer and ViT achieved 99.17% and 100%, respectively.
However, the VGG-19 provides a TA of 93.24% when using a softmax function, and based on the same configured values 16, 15, and 0.002, for batch-size, number of training iterations, and step size, respectively. It provides a TA of 94.17%, at a batch size of 32, 0.0001 step size, and 20 training iterations, and also the same softmax was applied for the three classes in the output layer.
Eventually, the best settings of these hyperparameters enhance the findings. Therefore, the highest performance of models is determined at a BS of 32 and training iterations of 20, a learning rate of 0.00001, while the Adam optimizer is chosen during the training phase to optimize the weights of the models with a cross-entropy loss formula applied. The hyperparameters of the three models are fine-tuned via a grid search technique that calculates the optimum values of the hyperparameters to obtain the highest accuracy for the models. The comparison in Table 7 is qualitative and should be interpreted cautiously due to differences in the datasets.
Deep learning models are trained on small datasets, and these models can be used as clinical decision support tools by identifying patterns and generating preliminary predictions from medical data. Despite the limited dataset size, these models can still provide valuable insights that enhance diagnostic accuracy. When combined with physicians’ expertise, these models help support more informed clinical decisions. Table 9 presents comparisons in terms of the methodology, limitations, strengths, key results, contributions, and dataset between the proposed models and previously published works.

7. Conclusions

This paper proposes three architectures of deep learning models: Swin-T, VGG-19, and ViT to classify heart patients based on ECG signals. The proposed deep structures of the three models are highly effective and suitable for the task of medical ECG image classification. Experiments are implemented to assess the efficiency of the three models based on the TA. Swin Transformer, VGG-19, and ViT reached a TA of 99.17%, 94.17%, and 100%, respectively; a TL of 0.0707, 0.4138, and 0.0015, respectively; and training errors (TEs) of 0.0002, 0.3493, and 0.0003, respectively. The highest performance model is the ViT, with a testing accuracy of 100% for both training and testing phases.
The AUROC and AUPR curves are utilized to assess the DL models’ performance in the generalization phase. Moreover, both the AUPR and AUROC reached 100% for the ViT model. The VGG-19 scored the least precision (94%), while the Swin-T has average precision (99%), and the ViT attained the highest precision (100%).
The obtained TPRs are 99%, 94%, and 100% for Swin Transformer, VGG-19, and ViT, respectively, while they achieved F1-scores of 99%, 94%, and 100%. The hyperparameters of the three models, such as the activation and loss functions, step size in the learning phase, optimizer type, batch size, iterations of learning, and number of layers in the implemented three models, are utilized to fine-tune the performance of these models. The high testing efficiencies achieved are related to the best settings adjusted.
As a conclusion, this ViT model is based on the transformer architecture that is mainly applied in natural language processing, which was adapted for medical image data. Moreover, referring to biomedical applications, the proposed Swin Transformer, VGG-19, and ViT models can precisely differentiate the three types of heart patients. Finally, these three models can be applied in healthcare to assist with automated diagnosis and improve clinical decision-making. In future work, the three models can be trained on large ECG datasets, such as PTB-XL and MIT-BIH. Additionally, one could present various DL architectures, for instance, using data-efficient image transformer (DeiT) and Detection Transformer (DETR) models.

Author Contributions

S.M., A.F.I., O.F.H., N.A. (Norah Alnaim), N.A. (Noorah Albehaijan), and M.A.-A. contributed to writing the original draft of the manuscript, conceptualization, methodology, resources, visualization, similarity reduction, editing of the manuscript, review of the writing and grammatical errors of the manuscript, and supervision of the proposed work. All authors have read and agreed to the published version of the manuscript.

Funding

This research received no external funding.

Data Availability Statement

The original data presented in the study are openly available in [Kaggle Repository] at [https://www.kaggle.com/datasets/drsaeedmohsen/ecg-images-national-heart-foundation-of-banglades (accessed on 14 May 2025)].

Conflicts of Interest

All authors declare that there are no conflicts of interest.

References

  1. Ramesh, S.; Kosalram, K. The burden of non-communicable diseases: A scoping review focus on the context of India. J. Educ. Health Promot. 2023, 12, 41. [Google Scholar] [CrossRef] [Scilit]
  2. Kauferstein, S.; Kiehne, N.; Neumann, T.; Pitschner, H.-F.; Bratzke, H. Cardiac gene defects can cause sudden cardiac death in young people. Dtsch. Arztebl. Int. 2009, 106, 41. [Google Scholar] [CrossRef] [Scilit] [PubMed]
  3. Nechita, L.C.; Tupu, A.E.; Nechita, A.; Voipan, D.; Voipan, A.E.; Tutunaru, D.; Musat, C.L. The Impact of Quality of Life on Cardiac Arrhythmias: A Clinical, Demographic, and AI-Assisted Statistical Investigation. Diagnostics 2025, 15, 856. [Google Scholar] [CrossRef] [Scilit]
  4. Syahrul Ulum, A.M.; Mandala, S. Detection myocardial infarction with deep learning algorithms using MRI data. In Proceedings of the 3rd International Conference on Intelligent Cybernetics Technology & Applications (ICICyTA), Denpasar, Bali, Indonesia, 13–15 December 2023; IEEE: New York, NY, USA, 2023; pp. 6–11. [Google Scholar] [CrossRef] [Scilit]
  5. Desai, U.; Martis, R.J.; Janapati, R.; Rajesh, K.N.V.P.S. Coronary artery disease (CAD) heart beats classification using recurrence plots. In Proceedings of the 3rd International Conference on Artificial Intelligence and Signal Processing (AISP), Vijayawada, India, 18–20 March 2023; IEEE: New York, NY, USA, 2023; pp. 1–5. [Google Scholar] [CrossRef] [Scilit]
  6. Ayano, Y.M.; Schwenker, F.; Dufera, B.D.; Debelee, T.G.; Ejegu, Y.G. Interpretable hybrid multichannel deep learning model for heart disease classification using 12-lead ECG signal. IEEE Access 2024, 12, 94055–94080. [Google Scholar] [CrossRef] [Scilit]
  7. Vásquez-Iturralde, F.; Flores-Calero, M.J.; Grijalva, F.; Rosales-Acosta, A. Automatic classification of cardiac arrhythmias using deep learning techniques: A systematic review. IEEE Access 2024, 12, 118467–118492. [Google Scholar] [CrossRef] [Scilit]
  8. Aggarwal, L.; Goswami, P.; Batra, S.; Alam, S.; Kumar, A.; Srivastava, P. An intelligent healthcare system for diagnosis based on machine learning technique. In Proceedings of the 2nd IEEE Delhi Section Flagship Conference (DELCON), Rajpura, India, 24–26 February 2023; IEEE: New York, NY, USA, 2023; pp. 1–6. [Google Scholar] [CrossRef] [Scilit]
  9. Bansal, M.; Gandhi, B. IoT & big data in smart healthcare (ECG monitoring). In Proceedings of the International Conference on Machine Learning, Big Data, Cloud and Parallel Computing (COMITCon), Faridabad, India, 14–16 February 2019; IEEE: New York, NY, USA, 2019; pp. 390–396. [Google Scholar] [CrossRef] [Scilit]
  10. Vijaipriya, K.; Priya, C.; Sivanandan, S.; Krishnaswamy, R. ECG monitoring system using IoT for health care applications. In Proceedings of the Second International Conference on Augmented Intelligence and Sustainable Systems (ICAISS), Trichy, India, 23–25 August 2023; IEEE: New York, NY, USA, 2023; pp. 1611–1615. [Google Scholar] [CrossRef] [Scilit]
  11. Hodrob, R.; Obaid, M.; Abdulsalam Mansour, A.M.; Sawahreh, A.; Naghnagheah, M.; AbuShanab, S.S. An IoT based healthcare using ECG. In Proceedings of the 21st International Arab Conference on Information Technology (ACIT), Giza, Egypt, 28–30 November 2020; IEEE: New York, NY, USA, 2020; pp. 1–4. [Google Scholar] [CrossRef] [Scilit]
  12. Shaown, T.; Hasan, I.; Mim, M.M.R.; Hossain, M.S. IoT-based portable ECG monitoring system for smart healthcare. In Proceedings of the International Conference on Advances in Science, Engineering and Robotics Technology (ICASERT), Dhaka, Bangladesh, 3–5 May 2019; IEEE: New York, NY, USA, 2019; pp. 1–5. [Google Scholar] [CrossRef] [Scilit]
  13. Çelebi, M. Portable ECG monitoring device design based on Arduino. In Proceedings of the Medical Technologies Congress (TIPTEKNO), Antalya, Turkey, 19–20 November 2020; IEEE: New York, NY, USA, 2020; pp. 1–4. [Google Scholar] [CrossRef] [Scilit]
  14. Chulde-Fernández, B.; Enríquez-Ortega, D.; Guevara, C.; Navas, P.; Tirado-Espín, A.; Vizcaíno-Imacaña, P.; Villalba-Meneses, F.; Cadena-Morejon, C.; Almeida-Galarraga, D.; Acosta-Vargas, P. Classification of Heart Failure Using Machine Learning: A Comparative Study. Life 2025, 15, 496. [Google Scholar] [CrossRef] [Scilit]
  15. Baghdadi, N.A.; Abdelaliem, S.M.F.; Malki, A.; Gad, I.; Ewis, A.; Atlam, E. Advanced machine learning techniques for cardiovascular disease early detection and diagnosis. J. Big Data 2023, 10, 144. [Google Scholar] [CrossRef] [Scilit]
  16. Li, J.P.; Haq, A.U.; Din, S.U.; Khan, J.; Khan, A.; Saboor, A. Heart disease identification method using machine learning classification in e-healthcare. IEEE Access 2020, 8, 107562–107582. [Google Scholar] [CrossRef] [Scilit]
  17. Fan, C.; Su, Q.; Xiao, Z.; Su, H.; Hou, A.; Luan, B. ViT-FRD: A vision transformer model for cardiac MRI image segmentation based on feature recombination distillation. IEEE Access 2023, 11, 129763–129772. [Google Scholar] [CrossRef] [Scilit]
  18. Muthumeena, S.; Priya, L.; Vishnu Priya, M.R. Deep learning framework for cardio vascular disease prediction using ECG images. In Proceedings of the International Conference on Smart Systems for Electrical, Electronics, Communication and Computer Engineering (ICSSEECC), Coimbatore, India, 28–29 June 2024; IEEE: New York, NY, USA, 2024; pp. 244–249. [Google Scholar] [CrossRef] [Scilit]
  19. Yang, R.; Liu, K.; Liang, Y. A fusion-attention swin transformer for cardiac MRI images image segmentation. IET Image Process. 2024, 18, 105–115. [Google Scholar] [CrossRef] [Scilit]
  20. Khalid, M.; Pluempitiwiriyawej, C.; Abdulkadhem, A.A.; Afzal, I.; Truong, T. ECGConVT: A hybrid CNN and vision transformer model for enhanced 12-Lead ECG images classification. IEEE Access 2024, 12, 193043–193056. [Google Scholar] [CrossRef] [Scilit]
  21. Liu, S.-H.; Liu, H.-C.; Chen, W.; Tan, T.-H. Evaluating quality of photoplethymographic signal on wearable forehead pulse oximeter with supervised classification approaches. IEEE Access 2020, 8, 185121–185135. [Google Scholar] [CrossRef] [Scilit]
  22. Al Reshan, M.S.; Amin, S.; Zeb, M.A.; Sulaiman, A.; Alshahrani, H.; Shaikh, A. A Robust heart disease prediction system using hybrid deep neural networks. IEEE Access 2023, 11, 121574–121591. [Google Scholar] [CrossRef] [Scilit]
  23. ECG Images, National Heart Foundation of Bangladesh. Kaggle Repository. Available online: https://www.kaggle.com/datasets/drsaeedmohsen/ecg-images-national-heart-foundation-of-banglades (accessed on 14 May 2025).
  24. Yahya, A.S.; Edan, N.M. ECG signal classification using hybrid and non-hybrid learning technologies. Int. J. Percept. Cogn. Comput. 2025, 11, 114–121. [Google Scholar] [CrossRef] [Scilit]
  25. Hasan, M.N.; Hossain, M.A.; Rahman, M.A. An ensemble based lightweight deep learning model for the prediction of cardiovascular diseases from electrocardiogram images. Eng. Appl. Artif. Intell. 2025, 141, 109782. [Google Scholar] [CrossRef] [Scilit]
  26. Selvam, I.J.; Madhavan, M.; Kumarasamy, S.K. Detection and classification of electrocardiography using hybrid deep learning models. Hell. J. Cardiol. 2025, 81, 75–84. [Google Scholar] [CrossRef] [Scilit]
  27. Almazroi, A.A.; Aldhahri, E.A.; Bashir, S.; Ashfaq, S. A clinical decision support system for heart disease prediction using deep learning. IEEE Access 2023, 11, 61646–61659. [Google Scholar] [CrossRef] [Scilit]
  28. Chandrasekhar, N.; Narahari, S.C.; Kollem, S.; Peddakrishna, S.; Penchala, A.; Chapa, B.P. Heart abnormality classification using ECG and PCG recordings with novel PJM-DJRNN. Results Eng. 2025, 25, 104032. [Google Scholar] [CrossRef] [Scilit]
  29. Sumalatha, U.; Prakasha, K.K.; Prabhu, S.; Nayak, V.C. Deep learning applications in ECG analysis and disease detection: An investigation study of recent advances. IEEE Access 2024, 12, 126258–126284. [Google Scholar] [CrossRef] [Scilit]
  30. Lee, C.H.; Kim, S.H. ECG measurement system for vehicle implementation and heart disease classification using machine learning. IEEE Access 2023, 11, 17968–17982. [Google Scholar] [CrossRef] [Scilit]
  31. Kailan, S.L.; Madhloom Kurdi, W.H.; Najim, A.H.; Kadhim, M.N. Efficient ECG classification based on machine learning and feature selection algorithm for IoT-5G enabled health monitoring systems. Int. J. Intell. Eng. Syst. 2025, 18, 1187–1199. [Google Scholar] [CrossRef] [Scilit]
  32. Mohan, S.; Thirumalai, C.; Srivastava, G. Effective heart disease prediction using hybrid machine learning techniques. IEEE Access 2019, 7, 81542–81554. [Google Scholar] [CrossRef] [Scilit]
  33. Hambarde, S.; Paithane, A.; Lambhate, P.; Hambarde, A.S.; Kalyankar, P.A. Smart arrhythmia detection using single lead ECG signal and hybridized deep neural network model. Web Intell. 2025, 23, 155–171. [Google Scholar] [CrossRef] [Scilit]
  34. Ahmad, A. Heart failure detection using deep learning and gradient boosting classifier. El Cezeri J. Sci. Eng. 2025, 12, 1–8. [Google Scholar] [CrossRef] [Scilit]
  35. Pyakillya, B.; Kazachenko, N.; Mikhailovsky, N. Deep learning for ECG classification. J. Phys. Conf. Ser. 2017, 913, 012004. [Google Scholar] [CrossRef] [Scilit]
  36. Alimbayeva, Z.; Alimbayev, C.; Ozhikenov, K.; Bayanbay, N.; Ozhikenova, A. Wearable ECG device and machine learning for heart monitoring. Sensors 2024, 24, 4201. [Google Scholar] [CrossRef] [Scilit]
  37. Ma, L.; Zhang, F. A novel real-time detection and classification method for ECG signal images based on deep learning. Sensors 2024, 24, 5087. [Google Scholar] [CrossRef] [Scilit]
  38. Fatema, K.; Montaha, S.; Rony, M.A.H.; Azam, S.; Hasan, M.Z.; Jonkman, M. A robust framework combining image processing and deep learning hybrid model to classify cardiovascular diseases using a limited number of paper-based complex ECG images. Biomedicines 2022, 10, 2835. [Google Scholar] [CrossRef] [Scilit]
  39. Staffini, A.; Svensson, T.; Chung, U.-i.; Svensson, A.K. A disentangled VAE-BiLSTM model for heart rate anomaly detection. Bioengineering 2023, 10, 683. [Google Scholar] [CrossRef] [Scilit]
  40. Kingma, D.P.; Ba, J. Adam: A method for stochastic optimization. arXiv 2015, arXiv:1412.6980. [Google Scholar] [CrossRef] [Scilit]
  41. Papa, L.; Russo, P.; Amerini, I.; Zhou, L. A survey on efficient vision transformers: Algorithms, techniques, and performance benchmarking. IEEE Trans. Pattern Anal. Mach. Intell. 2024, 46, 7682–7700. [Google Scholar] [CrossRef] [Scilit] [PubMed]
  42. Pengfei, J.; Chunkai, Z.; Zhenyu, H. A new sampling approach for classification of imbalanced data sets with high density. In Proceedings of the International Conference on Big Data and Smart Computing (BIGCOMP), Bangkok, Thailand, 15–17 January 2014; IEEE: New York, NY, USA, 2014; pp. 217–222. [Google Scholar] [CrossRef] [Scilit]
  43. Hassan, A.M.A.; Mohsen, S. Compression of electrocardiogram signals using compressive sensing technique based on curvelet transform toward medical applications. Multimed. Tools Appl. 2025, 84, 11203–11219. [Google Scholar] [CrossRef] [Scilit]
Figure 1. Risk factors of heart disease [22].
Computers 15 00191 g001
Figure 2. A complete workflow for classifying ECG images using the proposed three DL models.
Computers 15 00191 g002
Figure 3. The architecture of Swin-T: (a) Overall architecture; (b) Structure of Swin-T block; and (c) Window partitioning and window shifting.
Computers 15 00191 g003
Figure 4. The architecture of VGG-19.
Computers 15 00191 g004
Figure 5. The architecture of the ViT model.
Computers 15 00191 g005
Figure 6. A smart web application designed for classifying heart patients into three different diagnostic categories.
Computers 15 00191 g006
Figure 7. Some samples of the utilized ECG signals datasets for different patients: (a) Arrhythmia; (b) Myocardic; and (c) Normal.
Computers 15 00191 g007
Figure 8. Statistical distribution of the three ECG classes in the dataset: (a) percentage for each class; and (b) number of samples.
Computers 15 00191 g008
Figure 9. Accuracy of the three models.
Computers 15 00191 g009
Figure 10. Comparison of the Swin Transformer, VGG-19, and ViT.
Computers 15 00191 g010
Figure 11. Accuracy of Swin-T.
Computers 15 00191 g011
Figure 12. Loss for Swin-T.
Computers 15 00191 g012
Figure 13. Accuracy for VGG-19.
Computers 15 00191 g013
Figure 14. Loss for VGG-19.
Computers 15 00191 g014
Figure 15. Accuracy for the Vision Transformer.
Computers 15 00191 g015
Figure 16. Loss for the Vision Transformer.
Computers 15 00191 g016
Figure 17. Confusion matrix for Swin-T.
Computers 15 00191 g017
Figure 18. Confusion matrix for VGG-19.
Computers 15 00191 g018
Figure 19. Confusion matrix for the Vision Transformer.
Computers 15 00191 g019
Figure 20. ROC curves for Swin-T.
Computers 15 00191 g020
Figure 21. ROC curves for VGG-19.
Computers 15 00191 g021
Figure 22. ROC curves for ViT.
Computers 15 00191 g022
Figure 23. PR curves for Swin-T.
Computers 15 00191 g023
Figure 24. PR curves for VGG-19.
Computers 15 00191 g024
Figure 25. PR curves for the Vision Transformer.
Computers 15 00191 g025
Figure 26. NCM of Swin-T.
Computers 15 00191 g026
Figure 27. NCM of VGG-19.
Computers 15 00191 g027
Figure 28. NCM of the Vision Transformer.
Computers 15 00191 g028
Table 1. Hyperparameters for the proposed VGG-19.
StageHyperparametersSelected Values
ArchitectureKernel size of convolution_13 × 3
Number of filters for convolution_164
The stride of the convolution operation1
Max-Pooling size for Max-Pooling_12 × 2
The stride of the max-pooling operation2
Number of neurons for the first FC layer4096
Number of neurons for the second FC layer4096
Dropout rate of neurons0.1
TrainingBatch Size32
OptimizerAdam
Number of Epochs20
Learning Rate0.0001
Table 2. Error rates of the models.
ModelTraining ErrorTesting Error
Swin Transformer0.00020.0707
VGG-190.34930.4138
ViT0.00030.0015
Table 3. Evaluation metrics for the models.
MetricsSwin TransformerVGG-19ViT
Precision (%)9994100
Recall (%)9994100
F1-score (%)9994100
Table 4. Evaluation metrics of the models.
ModelMacro-Average Specificity%Macro-Average Sensitivity%
Swin Transformer99.5899.16
VGG-1997.0894.17
ViT100100
Table 5. Report for the Swin Transformer.
ClassPrecisionTPRF1-Score
Arrhythmia Patient 1.00 0.970.99
Myocardic Patient1.001.001.00
Normal Patient0.981.000.99
Accuracy--0.99
Macro average0.990.990.99
Weighted average0.990.990.99
Table 6. Report for VGG-19.
ClassPrecisionTPRF1-Score
Arrhythmia Patient 0.92 0.900.91
Myocardic Patient0.981.000.99
Normal Patient0.930.930.93
Accuracy--0.94
Macro average0.940.940.94
Weighted average0.940.940.94
Table 7. Report on the Vision Transformer.
ClassPrecisionTPRF1-Score
Arrhythmia Patient 1.00 1.001.00
Myocardic Patient1.001.001.00
Normal Patient1.001.001.00
Accuracy--1.00
Macro average1.001.001.00
Weighted average1.001.001.00
Table 8. A comparison of the three models and previously existing published techniques.
ReferenceTechniqueTesting Accuracy (%)
[24]Hybrid LSTM-CNN with Adam activation98.75
[25]Lightweight CNN with ensemble (GNB, DT, XGB, RF)99.29
[26] Hybrid CNN-VAE98.51
[27]Dense neural networks83
[22]Hybrid Deep Neural Network (CNN, LSTM, Dense)98.86
[28]PJM-DJRNN (ECG + PCG signals)97.33
[30]Two-stage machine learning0.7898
[31]PSO-based feature selection + SVM98
[32]HRFLM (Random Forest + Linear Model)88.7
[33]CWO-optimized deep learning96.1
[34]CNN + XGBoost99.9
[35]1D CNN + Fully connected layers86
[36]CNN-based anomaly detection92.6
The proposed workSwin-T
VGG-19
ViT
99.17
94.17
100
Table 9. Comparisons between the proposed models and previously published works.
ReferenceMethodologyKey Results and ContributionsDatasetStrengthsLimitations
[23]Random Forest, LSTM-CNN hybrid for Heartbeat classification from ECGs Hybrid LSTM-CNN outperforms traditional machine learning methods in accuracy and stability; kernel size and activation impact performance.Adult ECG dataOutperformed ML modelsKernel size and activation function sensitivity
[24]Lightweight CNN, Weighted Ensemble (GNB, DT, XGB, RF) models for predicting cardiovascular abnormalities, highlighting CVD predictionThe optimized ensemble model provided high scalability and, with weighted classifiers, achieved the highest accuracy in CVD detection.Real ECG datasetsOutperformed traditional modelsLimited to specific datasets
[25]Hybrid CNN with Variational Autoencoder (VAE) for CVD classificationHybrid CNN-VAE outperforms traditional models for CVD early detection through automatic feature extraction.PTB-XL ECG datasetSuperior to traditional DLLimited dataset application
[26]Dense Neural Networks for early heart disease detection using KerasDeep learning model showed improved accuracy, sensitivity, and specificity for heart disease diagnosis, outperforming individual and ensemble methods.Multiple heart disease datasetsNo detailed performance comparison with other modelsLimited evaluation metrics and low performance in generalization
[27]Hybrid Deep Neural Network (HDNN): CNN, LSTM, Dense layers for early heart disease predictionThe HDNN model has a superior performance compared to traditional ML and deep learning methods.Cleveland and HD datasetsStrong performance across datasetsLack of clarity on generalizability
[22]Polynomial Jacobian Matrix (PJM), Deep Jordan Recurrent Neural Network (DJRNN) for heart disease classification using ECG + PCG Novel methods with ECG and PCG signals outperformed other techniques in classification and noise robustness, with high recall and accuracy, and robust noise removal and feature selection.Diverse ECG datasetsRobust against noiseLimited to certain datasets
[28]Review of deep learning models in ECG-based cardiovascular health monitoring, such as CNNs, RNNs, and Hybrid modelsFocus on improvements in accuracy, real-time processing, privacy issues, and integration with clinical applications.General ECGAddressed real-time monitoring, privacyData limitations, EHR integration challenges
[29]Two-stage ML structure with optimized feature selection for single-lead ECG measurement in vehicles for heart health monitoring and real-time ECG classificationReal-time heart condition classification with fast prediction times for daily vehicle monitoring, with a stable signal acquisition under noise, showing potential. Real-time vehicle ECG measurementsPotential for daily health monitoring in vehiclesSignal stability under noisy conditions
[30]PSO-based feature selection, and ML SVM classifiers for IoT and ECG classification for IoT health systemsPSO-SVM model improved classification accuracy with reduced dataset dimensionality for real-time, resource-constrained ECG monitoring.5G-enabled IoT health monitoring systems-based ECGOutperformed existing methodsLimited real-world deployment
[31]Hybrid RF with a Linear Model to predict heart diseaseThe HRFLM combined Random Forest and Linear methods for early heart disease detection.Raw healthcare dataEarly detection potentialLow accuracy compared to others
[32]Arrhythmia detection using Cephalous Wolf Optimization (CWO), Deep Neural NetworksHigh detection performance with precision and recall on ECG signals, optimized for signal analysis.MIT-BIH arrhythmia signals datasetStrong performance with feature extractionNeeds more training data for robust generalization
[33]Implementing a CNN and XGBoost for heart failure detectionCNN-XGBoost model outperforms CNN-only models in detecting heart failure from ECG data.2 s ECG segmentsOutperformed CNN-only modelsPotential for clinical applications
[34]1D Convolution with fully connected layers for ECG classificationEffective for unstructured ECG data, but future improvements are needed in preprocessing and balancing, unbalanced data without feature engineering.Unstructured ECG dataNo feature engineering neededAccuracy is limited and needs enhanced preprocessing
[35]Wearable ECG monitoring for early CVD prediction using CNN, real-time signal filtration, and anomaly detectionA wearable system with CNNs effectively detects ECG abnormalities but requires refinement for broader clinical use.Real-time ECG dataHigh potential for wearable techNeeds more refinement for disease differentiation
The proposed workIntegrating a framework of efficient three DL models: Swin-T, VGG-19, and ViT to classify ECG images between Arrhythmia, Normal, and Myocardic patients with a smart web applicationAchieved high accuracy 99.17% for Swin-T, 94.17% for ViT, and 100% for ViT, applying prediction with a smart web application.A total of 600 images: 200 Arrhythmia, 200 Myocardic, 200 Normal imagesEfficient models: areas under the AUROC and AUPR are 100% for the Swin-T and ViT. Also, the testing accuracy, Precision, Recall, and F1-score are 100% for ViTLimited to 600 ECG samples
Disclaimer/Publisher’s Note: The statements, opinions and data contained in all publications are solely those of the individual author(s) and contributor(s) and not of MDPI and/or the editor(s). MDPI and/or the editor(s) disclaim responsibility for any injury to people or property resulting from any ideas, methods, instructions or products referred to in the content.