1. Introduction
In recent years, Higher Education Institutions (HEIs) have faced increasing pressure to reduce student dropout rates, a complex issue with personal, academic, and financial implications. Students who withdraw prematurely often face long-term academic and career setbacks, while institutions experience lower graduation rates, lost funding, and reputational damage [
1].
Conventional methods rely on error-prone indicators, such as grades or socio-economic status. In contrast, modern predictive models can process large amounts of data. These models can capture complex risk factors in both structured and unstructured data using traditional Machine Learning (ML) and Deep Learning (DL) approaches, drawing on student information systems, learning management platforms, and behavioural logs [
2,
3]. They have also enabled more fine-grained identification of dropout-related patterns and improved predictive capability in institutional settings. However, as these models become more sophisticated, their implementation presents new challenges. Accuracy alone does not guarantee institutional adoption. For dropout prediction systems to be effective, they must also be transparent, ethical, and aligned with institutions’ needs. Essential features of practical solutions include interpretable outputs, actionable insights, and equitable treatment of diverse student populations [
3,
4].
At the same time, the current evidence base still has practical limitations. Most of the results come from single-institution datasets, which limit generalisability, and open datasets remain rare, making replication and comparison between studies difficult [
5,
6]. These gaps motivate the need for a synthesis that goes beyond performance values and clarifies which data are being used, which modelling choices are most common, and what the literature reports on interpretability, deployment feasibility, and ethical considerations in real HEI.
This paper synthesises evidence from 61 studies and summarises the data sources and modelling approaches used to predict student dropout from HEI. It also brings together what the literature reports about interpretability, practical deployment, and ethical considerations. Unlike many prior works that mainly catalogue algorithms and compare performance, this paper emphasises what makes these models usable in practice, what inputs are available in real institutions, how results are explained to stakeholders, and the limitations that repeatedly appear across studies. The work is structured around three guiding Research Questions (RQs):
RQ1—What types of data and predictive models, using traditional ML and DL approaches, are most effective for identifying at-risk students in HEI?
RQ2—How do existing studies address interpretability and usability to support institutional decision-making?
RQ3—What are the main limitations and challenges reported in the literature, and what directions can guide future research?
The remainder of this paper is structured as follows.
Section 2 describes the review methodology.
Section 3 synthesises the data sources and feature engineering practices.
Section 4 presents the predictive modelling approaches adopted in the literature.
Section 5 discusses interpretability practices and practical deployment considerations.
Section 6 summarises the main limitations and challenges identified across the studies.
Section 7 discusses the results, connecting them directly to the defined research questions.
Section 8 outlines future research directions. Finally,
Section 9 concludes this paper.
2. Methodology
This study followed a structured review methodology based on Kitchenham’s guidelines for systematic reviews, adapted here for educational data science research [
7]. The process was designed to ensure methodological rigour, reproducibility, and relevance by clearly defining search strategies, selection criteria, and screening procedures.
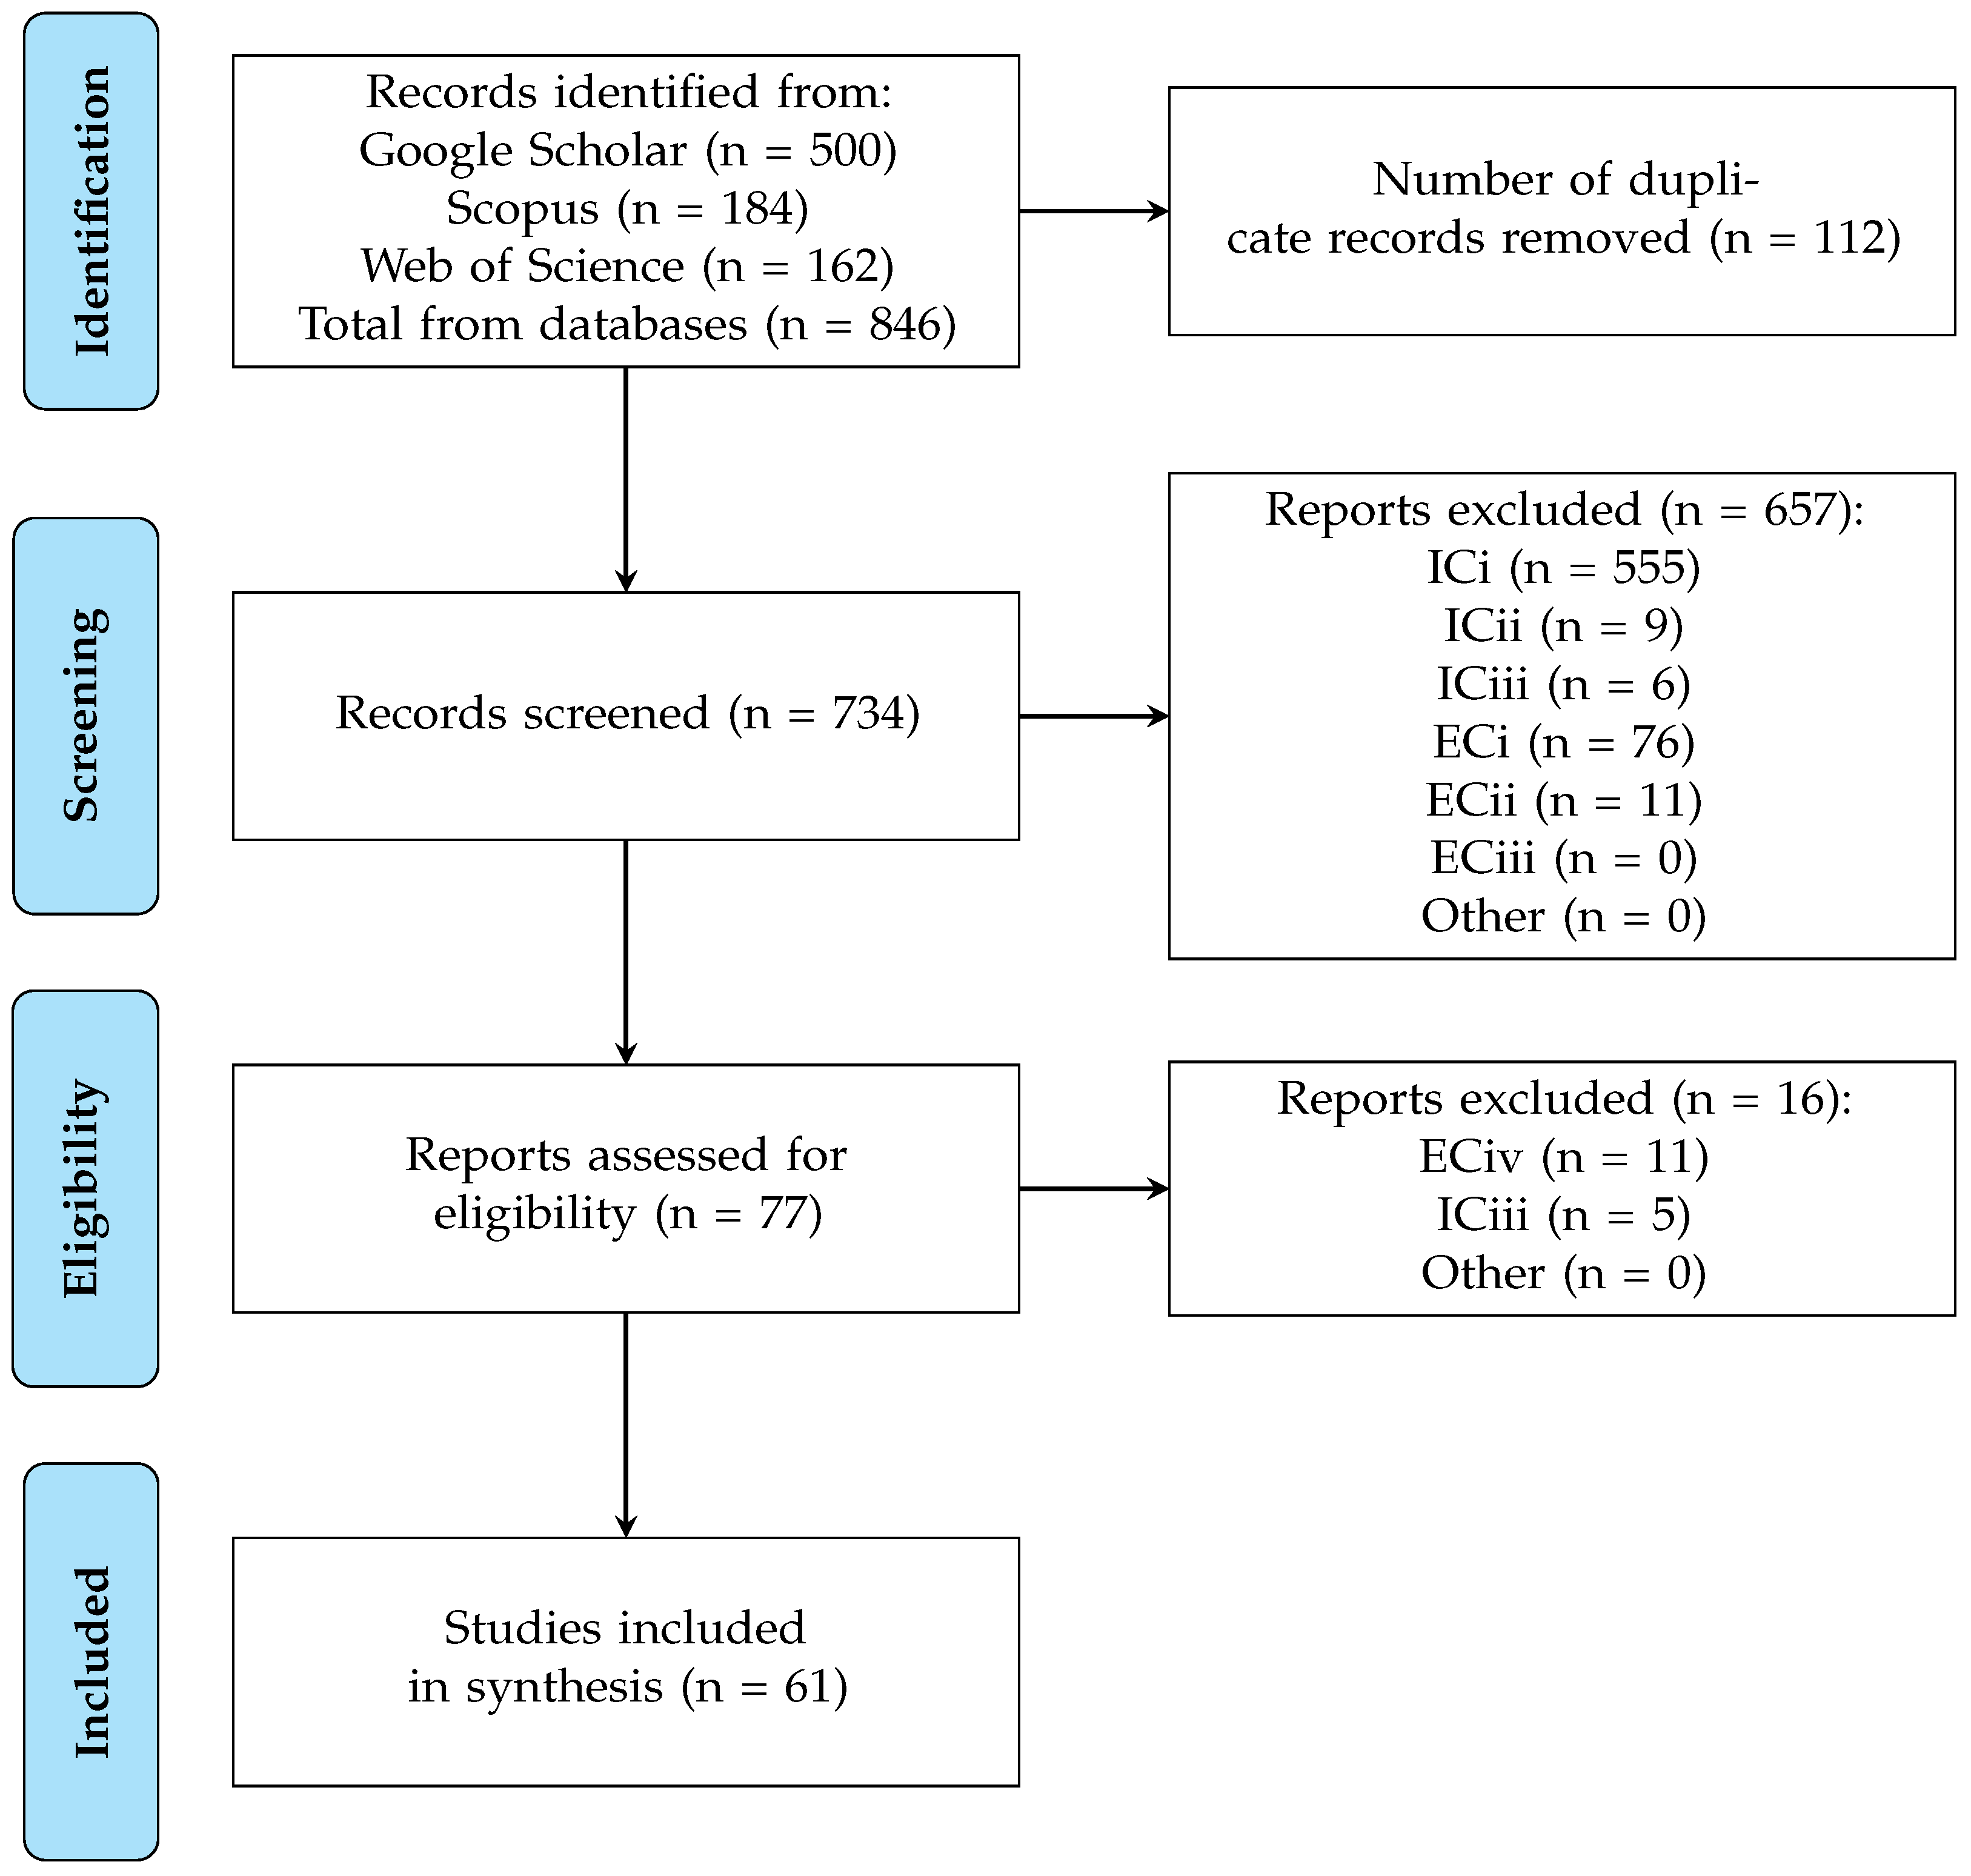
Figure 1 summarises the main stages of the study selection process, including the number of records excluded under each criterion.
2.1. Literature Search Strategy
To capture a comprehensive set of studies applying predictive modelling to student dropout in HEI, a query was made using the Publish or Perish tool [
8] across three widely used academic databases: Scopus, Web of Science, and Google Scholar. These sources were chosen for their extensive coverage of peer-reviewed research and multidisciplinary content. The search string used was: (predict) AND (dropout OR attrition) AND (“higher education” OR university OR polytechnic) AND (“machine learning” OR “deep learning”). In addition, results were restricted to studies published between 2018 and 2025 and written in English. We selected 2018 as the starting point to keep the synthesis focused on recent and practically relevant developments in dropout prediction, reflecting the rapid evolution of learning analytics infrastructures and the growing availability of digital student trace data in institutional settings. This year marks the period when deep learning architectures began to be more consistently applied in educational data mining and dropout prediction contexts.
2.2. Inclusion and Exclusion Criteria
Predefined criteria guided the selection process to ensure that only relevant and comparable studies were retained. Before the administration of the screening procedure, two pre-conditions (PC) were implemented to ensure the currency and concordance of the evidence base. The first condition (PC1) stipulated that studies should be written in English. The second condition (PC2) stipulated that studies should be published between 2018 and 2025.
We consolidated records from all sources and removed duplicate entries before the eligibility assessment. The remaining studies were then assessed using explicit inclusion criteria (IC) and exclusion criteria (EC). The inclusion criteria were defined as follows: ICi: studies must address student dropout prediction in a higher education context; ICii: studies must apply predictive modelling using traditional ML and/or DL methods; ICiii: studies must present results using real-world data and report at least one quantitative evaluation metric.
The following criteria serve as the basis for exclusion: ECi: literature reviews or conceptual/position papers without predictive model evaluation; ECii: studies focusing on non-higher education settings (e.g., primary or secondary education); ECiii: papers that did not evaluate predictive models and/or did not report performance results; ECiv: studies whose full text was inaccessible after reasonable attempts to retrieve it. These criteria were applied consistently during title/abstract screening and full-text screening.
2.3. Screening and Selection Process
The screening process was conducted in five sequential stages to ensure transparency and consistent application of the predefined criteria. Stage 1 consisted of consolidating records retrieved from all sources and removing duplicate entries. In Stage 2, titles were screened to exclude papers that were clearly out of scope. In Stage 3, abstracts were reviewed to confirm that the study focused on student dropout prediction in a higher education context and employed predictive modelling using traditional ML and/or DL, with an evaluation component. In Stage 4, the full texts of the remaining articles were assessed against the pre-conditions (PC1–PC2) and the full set of inclusion/exclusion criteria (ICi–ICiii, ECi–ECiv), with particular attention to whether models were evaluated on real-world HEI data and at least one performance metric was reported (ICiii). Finally, in Stage 5, all eligible studies were retained for data extraction and synthesis.
This multi-stage procedure resulted in the selection of 61 primary studies, which form 111 the foundation of this review.
Figure 1 summarises the number of records retained and excluded at each stage of the selection process and reports exclusions by criterion (IC/EC) to make the screening decisions traceable.
After inclusion, we extracted, for each study, the dataset source and size, country (when reported), feature types, preprocessing steps, modelling approaches, evaluation metrics, reported performance, interpretability/explainability elements, deployment considerations, and limitations discussed by the authors. All extracted information was stored in a spreadsheet and used to build the comparative tables and figures presented in the subsequent sections.
3. Data Sources and Predictive Variables
3.1. Dataset Country Patterns
Across the reviewed studies, geographic reporting is uneven. In many publications, the specific country of data collection is not clearly specified. This limitation impedes the extent to which we can interpret patterns at the country level or make meaningful comparisons across different contexts. Still, among the studies that report location, datasets most often come from Asia, Europe, and Latin America. At the same time, North America appears less frequently, and Africa is represented in only a few cases. This means the literature is geographically broad, but cross-country synthesis remains constrained by incomplete reporting of dataset provenance.
Given these limitations, we treat regional comparisons as indicative rather than definitive. When a country is reported, we summarise recurring tendencies in the types of data emphasised, as these patterns help explain why models may not transfer well across settings.
In Asia, several studies rely primarily on structured institutional records (e.g., grades, enrolment history, demographics), with behavioural traces used less consistently. For example, ref. [
9] analysed a large cohort from a South Korean university using mostly academic and demographic information. At the same time, ref. [
10] extends this analysis by including a broader set of variables, including socioeconomic, behavioural, and pre-entry variables. In Latin America, socioeconomic indicators are more frequently integrated alongside academic variables, which aligns with dropout modelling in contexts where financial constraints and structural inequalities may be more visible in institutional data. This pattern appears in Mexican studies [
11,
12], and in Brazilian work [
13,
14], where institutional records are complemented with behavioural or digital-trace evidence. European datasets show greater variety, ranging from standard administrative and academic records to designs that compare across programmes or institutions. For instance, ref. [
3] used data from two German universities and combined pre-entry, academic progress, behavioural indicators, and socioeconomic proxies.
Overall, when country information is available, most datasets still come from a single institution. As a result, models may capture local academic rules and data-collection practices that do not hold elsewhere, reducing performance when approaches are transferred across institutions or national systems. This pattern is reflected in
Table 1, where single-institution datasets account for most of the reviewed evidence base, further limiting transferability across contexts.
3.2. Dataset Source and Size
Most reviewed studies relied on institutional datasets drawn from a single university, largely because these data are easier to access and share under privacy and governance constraints. In practice, this usually meant structured academic and administrative records (e.g., grades, credits, enrolment history), sometimes complemented with behavioural traces such as Learning Management System (LMS) activity. This pattern appeared both in small-scale settings, for example [
2], which analysed 261 students and combined academic variables with Moodle interactions, and in large institutional registries from individual universities. For instance, refs. [
9,
18] analysed datasets comprising more than 60,000 students and relied mainly on academic history, together with demographic or contextual indicators (e.g., scholarships and family background). As demonstrated in further examples [
10], incorporating socioeconomic, behavioural, and pre-entry variables alongside administrative records can facilitate the analysis of variance in feature richness within a single institution. This analysis utilised data from 20,050 students and revealed that feature richness can vary within this setting. Single-institution datasets dominated the extant evidence base.
A smaller set of studies drew data from multiple universities. As summarised in
Table 1, these multi-institution datasets tended to fall at the extremes of cohort size rather than in the mid-range. On the large-scale end, ref. [
56] analysed approximately 21,000 students across Bangladeshi universities, combining academic, demographic, socioeconomic, and behavioural attributes. Likewise, ref. [
58] leveraged national administrative data from Italy’s central student registry and enriched standard records with geographic and institutional context. At the smaller end, ref. [
59] examined 480 engineering students across 12 Bangladeshi universities using demographic, socioeconomic, and academic variables, while [
60] analysed survey-based data from 513 students and incorporated financial and psychosocial factors.
Publicly available datasets were uncommon in the reviewed literature, but they offered clearer opportunities for reproducibility and benchmarking. For instance, ref. [
61] used public benchmark datasets, while [
6] relied on SATDAP and ICFES datasets when evaluating neural models supported by feature selection and extraction.
Across the reviewed studies, dataset sizes varied substantially, influencing the modelling choices the authors considered feasible. As captured in
Table 1, 29 studies used large cohorts (>10,000), 17 relied on medium-sized cohorts (1000–10,000), and 11 were based on small samples (<1000). Smaller datasets were more often paired with simpler and more interpretable models to reduce overfitting risk, whereas larger datasets supported higher-capacity modelling and broader comparisons (e.g., [
9,
18]). Medium-sized datasets often balanced statistical power with feature diversity; for example, ref. [
31] analysed approximately 6000 students using primarily administrative and academic variables, while ref. [
32] studied 1761 students and incorporated socioeconomic, demographic, and psychological factors.
Overall, the reviewed literature reflects two common data settings: smaller cohorts that allow richer behavioural signals and larger administrative datasets that support scalable modelling but rely mainly on structured records. From the perspective of RQ3, this heavy reliance on local institutional data, together with inconsistent reporting of dataset provenance, cohort definitions, and sample sizes, remains a recurring barrier to replication and to strong claims of transferability across institutions.
3.3. Feature Types
The predictive features used across the reviewed studies were diverse, reflecting both data availability and institutional context. To keep the synthesis consistent, we discuss feature groups in descending order of frequency across studies in
Table 2. Across the literature, the most consistently used inputs were academic performance indicators, including grades, exam results, and credit accumulation. These appeared in 60 studies and formed the backbone of many predictive models (e.g., [
4,
15,
29]). Because academic data are routinely collected and strongly tied to progression, they were often used as the primary signal, with other feature groups added on top.
In addition, demographic variables, such as age, gender, and nationality, were frequently combined with academic records to capture differences in dropout risk across student profiles (e.g., [
2,
37]). Beyond static background information, a smaller but important subset of studies incorporated behavioural data extracted from student activity traces (often from LMS logs), such as login frequency, forum participation, and assignment submission patterns (26 studies). These behavioural features were mainly used to support earlier detection of disengagement and to trigger early-warning scenarios (e.g., [
20,
46]).
A further layer of contextual information emerged from socioeconomic features, typically inferred from proxies such as zip code, scholarship status, or parental education. These variables were used to frame dropout risk within broader structural constraints (e.g., [
1,
3,
5]). Similarly, pre-entry variables, such as high school grade point average or entrance exam scores, were used in 24 studies to support forecasting before matriculation and to identify risk at the point of admission (e.g., [
17]). Finally, only a small number of studies examined psychosocial and affective indicators, including self-efficacy, motivation, and emotional well-being (e.g., [
60,
62]). These features point toward more holistic modelling, but they remain difficult to collect consistently and at scale.
Taken together, the feature landscape reflects a trade-off between availability and timeliness. Academic and demographic variables dominate because they are widely accessible and easy to operationalise, but they often become informative only after performance declines. Behavioural traces from learning platforms, although less consistently available, can provide earlier signals of disengagement and are therefore valuable for timely intervention. The limited use of psychosocial variables highlights a gap between what may be informative and what institutions can realistically capture. The frequent inclusion of demographic and socioeconomic variables also underscores the need for careful governance, since these features may improve prediction while also raising fairness and bias concerns if not evaluated transparently. In relation to RQ1, these patterns suggest that the most effective modelling approaches are strongly shaped by which feature groups an institution can reliably provide and how early risk needs to be detected. A comprehensive categorisation of features, their respective frequencies, and illustrative case studies are delineated in
Table 2.
3.4. Preprocessing Techniques
Preprocessing plays a foundational role in shaping the fairness, reliability, and performance of predictive models, particularly in dropout prediction, where datasets are often heterogeneous, noisy, and imbalanced. Across the 61 reviewed studies, several preprocessing strategies were reported, typically reflecting the modelling goal and the type of data available. However, about 20 studies did not describe preprocessing in enough detail for classification, which limits reproducibility and makes it harder to interpret performance differences across papers.
At the input level, two steps were especially tied to the nature of structured educational data: encoding categorical variables and scaling numerical features. As shown in
Table 3, encoding was explicitly reported in a limited number of studies. However, it is typically necessary when models ingest attributes such as programme, nationality, or categorical status indicators. Its main advantage is that it allows models to use these variables directly, the trade-off is that some approaches (e.g., one-hot encoding) can increase dimensionality and sparsity, which may be less stable in smaller cohorts. Scaling/normalisation was reported in 10 studies. It was typically used when feature magnitudes differed substantially, so that scale-sensitive models such as Support Vector Machines (SVMs) and Neural Networks (NNs) were not dominated by a small set of high-variance variables. For example, refs. [
2,
56] reported scaling as part of their preprocessing pipelines. While scaling can stabilise training and improve comparability across features, it is less critical for many tree-based models, which is consistent with its selective rather than universal appearance.
A dominant preprocessing concern in dropout prediction was class imbalance, since dropout is often the minority outcome, and models can achieve high accuracy while failing to identify at-risk students. In the reviewed studies, oversampling strategies, such as Synthetic Minority Oversampling Technique (SMOTE), were among the most frequently reported steps. The main motivation is practical, when the goal is early intervention, improving minority-class detection often matters more than overall accuracy. Studies such as [
10,
36] illustrated this pattern by applying resampling before training to improve sensitivity to the dropout class. Beyond SMOTE, recent work in other application domains has explored GAN-based oversampling under severe data-scarcity conditions; for instance, Generative Adversarial Network Synthesis for Oversampling (GANSO) has been reported to generate informative minority-class samples even with very small training sets [
64]. Although such methods did not appear in the reviewed HEI dropout studies, they may be worth exploring in future work, particularly for small-cohort institutional datasets. At the same time, synthetic oversampling can introduce artificial patterns that do not fully reflect real students, so its benefit depends on careful validation and on whether the minority class is sufficiently represented in the available data.
In dropout datasets, missing data is rarely random; it can reflect non-response, incomplete administrative records, or disengagement (e.g., missing LMS interactions). As a result, imputation choices can influence both model stability and the conclusions drawn from the predictors. Ref. [
15] reported imputation as part of their preprocessing, while [
30] described a more explicit imputation pipeline, highlighting the need for transparency when missing values are common. Imputation can help preserve sample size and avoid discarding students with partial records, but it can also mask informative signals, especially when “missing” is itself associated with risk.
Finally, feature selection and dimensionality reduction were reported in a smaller subset of studies, suggesting that some settings involved high-dimensional or noisy feature spaces where reducing complexity supported more stable modelling and clearer interpretation. Feature selection is typically used to reduce overfitting risk, improve generalisation, and increase interpretability by focusing attention on a smaller set of predictors. For example, ref. [
32] reduced an initial set of 53 variables to 27 through a feature selection process involving eight algorithms, and ref. [
62] also reported feature selection to retain only the most relevant predictors. However, a key limitation is that selection procedures may remove variables that are weak in isolation but important in combination, and different selection methods can lead to different “best” feature sets. Dimensionality reduction methods such as Principal Component Analysis (PCA) can similarly help control redundancy and compress correlated variables. Still, they reduce interpretability because components are less directly connected to meaningful educational indicators. These trade-offs are particularly important in dropout prediction, where models are often expected not only to predict risk but also to support institutional decision-making.
Overall, the preprocessing landscape across the reviewed studies was shaped by two recurring needs: dealing with class imbalance and managing feature space complexity. At the same time, limited reporting remains a major weakness in the literature. Without clear preprocessing descriptions, it is difficult to reproduce results or make meaningful comparisons across studies.
Table 3 summarises the reported preprocessing techniques, ranked by frequency of occurrence in the reviewed studies.
4. Predictive Modelling Approaches
Predicting student dropout in HEI is a multifaceted problem that requires algorithms capable of capturing complex patterns while remaining robust to common data issues, such as missing values and class imbalance. In practice, institutions also need models that support timely and actionable decisions, which places additional constraints on interpretability, stability, and deployment feasibility. Across the 61 reviewed studies, we identified a wide range of ML approaches. To synthesise the literature for comparison, we organise these approaches into four categories: Traditional ML Models, DL Models, Hybrid and Ensemble Models, and Interpretable and Emerging Modelling Approaches. This section summarises the modelling strategies adopted in each category, with emphasis on how studies handle feature representation, training and validation choices, and the practical trade-offs reported between predictive performance and usability in real institutional contexts.
4.1. Traditional ML and Tree-Based Models
Traditional ML models remain the dominant approach for dropout prediction in HEI, mainly because they perform well on structured institutional data while remaining relatively interpretable and lightweight to deploy. As summarised in
Table 4, we present traditional ML algorithms ordered by how frequently they appear in the reviewed studies. Tree-based and linear classifiers were the most frequently adopted across the reviewed studies. Random Forest (RF) appeared in 33 studies, followed by Logistic Regression (LR) and SVM, while Decision Trees (DTs) appeared in 15 studies. Naive Bayes (NB) and k-Nearest Neighbours (kNN) were used less often, typically as baseline or comparative models.
DTs were widely employed because of their transparent decision logic and ability to model non-linear relationships, which is particularly useful when the goal is not only prediction but also explaining risk drivers to institutional stakeholders (e.g., [
14,
60]). In terms of reported performance, the highest DT accuracy in
Table 4 reached 97.09% [
60]. However, because dropout is typically imbalanced and reporting varies across studies, the “best” accuracies should be interpreted as reported outcomes rather than directly comparable benchmarks.
Ensemble extensions of tree-based models were even more prominent. RFs were frequently highlighted for their robustness and ability to handle heterogeneous feature sets, with the best RF accuracy in
Table 4 reaching 97.45% [
56]. Boosting methods were also common; XGBoost appeared in 12 studies and was often used to improve the precision-recall balance. In contrast, Light Gradient Boosting Machine (LightGBM) and Categorical Boosting (CatBoost) appeared less frequently but achieved competitive results in specific settings (e.g., 95.50% with LightGBM in [
10], 83.00% with CatBoost in [
23]). Notably, the highest boosting accuracy reported in
Table 4 was 98.06% using XGBoost [
60].
Linear models, particularly LR, remained a strong baseline because of their simplicity and interpretability. Despite linear assumptions, LR achieved competitive performance in multiple studies (e.g., 93% in [
2]), and regularised variants were occasionally used to support feature selection and reduce overfitting, including Least Absolute Shrinkage and Selection Operator (LASSO) [
58]. Across the reviewed studies, the best LR accuracy in
Table 4 was 93.20% [
60].
SVMs were adopted in 23 studies, often in settings with smaller sample sizes or higher-dimensional feature spaces, where kernel functions enable non-linear decision boundaries. The best SVM accuracy reported in
Table 4 was 95.15% using an RBF kernel [
60]. NB models served as fast and interpretable baselines, typically with lower performance (e.g., 90.2% in [
60]), although the best NB accuracy in
Table 4 reached 93% [
63]. kNN appeared least frequently and was typically paired with scaling or dimensionality reduction due to its sensitivity to feature magnitude. In
Table 4, the best kNN accuracy was 94.17% [
60].
A recurring limitation across this body of work is limited methodological transparency. Many studies provided insufficient detail on preprocessing choices, tuning procedures, or feature handling, which makes replication difficult and can inflate apparent performance. More systematic pipelines were described in a smaller subset of studies (e.g., [
3,
30,
36]), including clearer tuning procedures, imputation strategies, or explicit feature selection.
In summary, the reviewed evidence suggests that traditional ML models are a strong and widely adopted choice for dropout prediction in HEI, especially when structured academic and administrative data are the main inputs, and when explainability and implementation feasibility are priorities. In relation to RQ1, this supports the view that, under typical institutional data constraints, traditional ML (particularly tree-based ensembles and LR-style baselines) is often sufficient to achieve high predictive performance. For comparability,
Table 4 reports accuracy as the most consistently available metric; however, in imbalanced dropout settings, accuracy alone can be misleading. When available, recall, precision, F1-score, and Area Under the Receiver Operating Characteristic Curve (ROC-AUC) provide a more informative basis for judging the practical value of early interventions.
4.2. Deep Learning Models
Although traditional ML still dominates the field, DL models are gradually gaining ground in student dropout prediction in HEI, particularly in studies working with larger, high-dimensional, or behaviour-rich datasets. In practice, however, most DL models in the reviewed literature still relied on relatively standard feedforward architectures trained on tabular academic, demographic, and engagement variables rather than on architectures specifically designed for temporal learning.
The most frequently adopted DL architecture was the Multilayer Perceptron (MLP). These models were typically trained on structured institutional data and often included regularisation techniques and optimisers such as Adam to improve generalisation. A clear example is [
36], which reported 98.1% accuracy with an MLP despite relying on a relatively small set of inputs, suggesting that, in some settings, careful variable selection and a clean training pipeline can be more influential than architectural complexity. Regarding MLPs, several studies used simpler Artificial Neural Networks (ANNs), typically shallow feedforward networks. While less expressive than deeper designs, these models were still competitive when the feature space was informative (e.g., [
13,
38,
51]), and they were often used as a neural alternative to standard ML baselines on structured data.
Only a small number of studies explored deeper feedforward networks. For example, ref. [
10] implemented a three-layer Deep Neural Network (DNN) using ReLU and sigmoid activations over combined academic performance and LMS variables, achieving 94.7% accuracy. More generally, deeper feedforward designs were reported in settings where sample size and feature diversity could support larger parameter spaces. Still, training design choices (e.g., architecture selection and tuning depth) were not consistently described across the reviewed studies, limiting comparability.
Convolutional Neural Networks (CNNs) were uncommon but showed potential when behavioural data could be transformed into structured representations that a convolutional model can exploit. In particular, ref. [
21] converted LMS activity into temporal heatmaps and applied a CNN to capture behavioural patterns, reporting 98.6% accuracy, which was the highest value reported within the DL subset (
Table 5). Other neural approaches appeared more sporadically. For instance, ref. [
49] implemented a Probabilistic Neural Network (PNN) and reported 94.7% accuracy (
Table 5), illustrating how alternative neural classifiers were sometimes explored alongside more standard backpropagation-based models.
Overall, DL appeared in the reviewed literature mainly as an extension of tabular prediction (MLP/ANN/DNN), rather than as a systematic move toward modelling sequences, trajectories, or multimodal data. The strongest CNN-style results occurred when behavioural data were carefully engineered into learnable representations, but such designs remained rare. In relation to RQ1, the reviewed evidence suggests that DL tends to add the most value when richer behavioural information is available and the modelling goal includes earlier detection. In contrast, gains are less consistent when DL is applied to static tabular records alone. To remain consistent with traditional ML synthesis,
Table 5 reports accuracy as a shared baseline across DL studies, while noting that imbalance-aware metrics are needed to assess the true early-warning value.
4.3. Hybrid and Ensemble Models
Beyond individual ML and DL models, a growing subset of reviewed studies explored hybrid and ensemble strategies to improve dropout prediction. In this review, we use the term hybrid to refer to models that augment a primary learner with an additional mechanism (e.g., resampling, reweighting, or meta-heuristic optimisation). In contrast, ensemble methods combine multiple learners to produce a single prediction. We first summarise hybrid designs, then ensemble strategies, reflecting how these approaches are typically reported across the reviewed studies. These approaches generally follow two practical rationales: (i) improving detection of the minority dropout class by pairing strong learners with resampling or reweighting, and (ii) increasing robustness by aggregating complementary models or optimising key components such as hyperparameters.
A common hybrid pattern was to combine boosting-based classifiers with explicit imbalance handling. For example, ref. [
9] coupled XGBoost and CatBoost with SMOTE variants to strengthen the coverage of dropout cases. Other hybrid designs focused less on rebalancing and more on optimisation. In [
61], a Modified Mutated Firefly Algorithm was used for hyperparameter optimisation, while [
19] used an evolutionary strategy to generate optimised DT structures. Taken together, these studies suggest that "hybrid" in dropout prediction most often means augmenting standard predictors with methods to handle imbalance and/or optimisation mechanisms, rather than combining fundamentally different data modalities.
Ensemble methods were also used to combine multiple learners into a single predictor. Stacked generalisation was the most explicit ensemble strategy in the reviewed set. Base models are trained first, and a meta-classifier then combines their outputs. This design was adopted in [
16,
32,
46], where the goal was typically to stabilise performance across different decision boundaries and feature spaces. Simpler aggregation schemes, such as majority or plurality voting, were also applied to reduce variance and improve reliability relative to individual models (e.g., [
37,
39]). Other ensemble variants included bagging and boosting in regression-style formulations of dropout risk [
55]. Finally, some studies proposed custom ensembles combining heterogeneous model families (e.g., LR, NN, and DTs), reflecting a pragmatic attempt to balance interpretability with predictive flexibility (e.g., [
13]).
Overall, hybrid and ensemble approaches are promising because they directly target common failure modes in dropout prediction, especially class imbalance and model instability. In relation to RQ1, the reviewed evidence suggests that these strategies are most useful when explicitly aligned with the operational goal of identifying at-risk students, rather than solely improving headline accuracy. Because hybrid and ensemble pipelines introduce additional design degrees of freedom (e.g., resampling, weighting, meta-learning, hyperparameter search), it is hard to compare results when these details are not fully reported. Evidence is strongest when papers specify the rebalancing/optimisation procedure and prioritise dropout-class detection metrics over headline accuracy.
4.4. Interpretable and Emerging Modelling Approaches
Beyond the mainstream traditional ML and DL methods discussed earlier, a smaller set of studies explored alternative modelling approaches that emphasise interpretability, theoretical grounding, or novel problem formulations. Despite their infrequent use, these methods are particularly pertinent in contexts where transparency, uncertainty-aware reasoning, or contextual understanding are imperative for stakeholder trust and institutional decision-making, thereby directly informing RQ2.
Several studies employed probabilistic, statistically grounded models, often motivated by early-warning objectives or the need to reason under uncertainty with limited or longitudinal data. For example, two early-warning models (GMET and GMERF) were proposed, reporting ROC-AUC values above 90% [
24]. Related work leveraged classical statistical techniques that inherently support interpretability and feature selection. LASSO regularisation was applied to reduce overfitting while improving interpretability, achieving an accuracy of 89.1% [
58]. Similarly, Linear Discriminant Analysis (LDA), a parameter-free dimensionality reduction and classification method, performed competitively, with LDA and SVM yielding the best results in the experiments [
29]. In a complementary direction, Bayesian Networks were explored to model dependencies between student attributes and dropout outcomes while providing uncertainty-aware and interpretable reasoning [
31,
50].
A smaller but conceptually distinct line of work reframed dropout as a temporal or sequential process rather than a static classification problem. Markov Chain models were used to represent transitions between academic states and to support early risk identification [
25]. Such approaches are particularly appealing when the objective is to capture evolving risk over time and to model student progression explicitly, rather than relying on aggregated snapshots.
More recently, a limited number of studies have explored language-based architectures capable of incorporating unstructured or semi-structured information. One example reformulates structured demographic and academic records into natural language. It casts dropout prediction as a natural language inference task, outperforming several traditional baselines (including LR, MLPs, and SVMs) and achieving a 9.00% improvement in F1-score over the previous state of the art [
34]. However, this approach requires a relatively large number of tokens, which may pose scalability and efficiency challenges in large institutional settings.
While these approaches do not consistently outperform the traditional ML and DL models previously discussed, they do offer practical benefits that are significant in real-world applications. These benefits include facilitating the interpretation of predictions, communicating uncertainty, and aligning outputs with institutional decision-making processes. The evidence remains limited, however, because these methods appear in relatively few studies and are typically evaluated within a single institution, making it difficult to assess transferability. Overall, the literature suggests that progress in dropout prediction in HEI will depend not only on improving predictive performance but also on developing models that are understandable, trustworthy, and manageable in real deployments.
4.5. Evaluation Metrics
Evaluation in dropout prediction is strongly shaped by a recurring property of the task, and dropout is often the minority outcome. This has two implications for the modelling approaches reviewed. First, accuracy remains widely reported because it is intuitive and easy to compare across algorithms. Second, accuracy alone is not sufficient for assessing practical usefulness in early-warning scenarios because a model can appear strong overall while still failing to identify many at-risk students. This matters directly for RQ1, as different modelling families (e.g., traditional ML baselines, DL models, and hybrid/ensemble strategies) may achieve similar accuracy while behaving very differently with respect to false negatives and false positives. It also matters for RQ3, since Early Warning Systems (EWSs) are only effective if evaluation reflects the operational objective of identifying students who need support; in this sense, recall/precision trade-offs are especially central when comparing tree ensembles, neural models, and imbalance-aware hybrids.
Across the reviewed studies, a common pattern was to report accuracy along with recall (sensitivity), precision, and F1-score. This combination appeared most often in early-warning-style pipelines, where the goal is not only to classify but also to flag students who may need intervention. For example, ref. [
2] reported results beyond accuracy, with an RF reaching 0.93 accuracy while also achieving 0.96 recall, 0.86 precision, and an Area Under the Receiver Operating Characteristic Curve (AUC) of 0.97. Similarly, ref. [
10] showed that class-sensitive metrics remain essential even when accuracy is high, while the best-performing LightGBM reached 0.955 accuracy, recall (0.81), and F1-score (0.84) better reflected its utility for identifying dropout cases. Operationally, recall captures how many at-risk students are detected (reducing missed interventions), while precision reflects the workload created by false alerts. When precision is low, support services may experience excessive false positives, eroding trust and limiting adoption even when overall accuracy remains high. This trade-off is especially relevant when comparing ensemble and hybrid approaches in
Section 4.3, many of which are explicitly motivated by improving minority-class detection.
A second group of studies relied on threshold-independent metrics, most commonly ROC-AUC, to compare models across decision thresholds. Several papers reported AUC alongside accuracy and class-based metrics to provide a broader view of performance. For instance, ref. [
29] reported both accuracy and AUC, with an RF achieving 0.91 accuracy and 0.97 AUC, along with sensitivity (0.96) and specificity (0.86). Similarly, ref. [
46] reported a multi-metric view for a stacking ensemble, with 0.92 accuracy and an AUC of 0.98, alongside precision, recall, and F1-score. These examples illustrate how AUC is often used as a general comparison tool when benchmarking multiple algorithms. However, AUC alone does not guarantee strong minority-class detection, which is why it is most informative when interpreted together with recall and precision.
Precision–recall (PR) based measures (e.g., PR-AUC/average precision), which are often more informative than ROC-AUC under severe imbalance, were rarely reported across the reviewed studies, as shown in
Table 6. This gap limits how clearly studies demonstrate performance specifically in the dropout class, especially in settings with low dropout prevalence. From a synthesis perspective, it also constrains meaningful cross-study comparisons, because two models can have similar ROC-AUC while differing substantially in the PR regime that matters most for early intervention.
Beyond these common metrics,
Table 6 shows a long tail of measures reported only in isolated studies, including Cohen’s kappa, balanced accuracy, G-mean, gain, and probability- or loss-based measures such as log loss. A small number of studies also reported regression-style errors, such as Mean Absolute Error (MAE) and Mean Squared Error (MSE), typically when dropout risk was framed as a continuous score rather than a strict binary label [
55]. While these metrics can provide a useful perspective (e.g., kappa adjusts for agreement beyond chance and log loss evaluates probability calibration), they were not consistently used to support robust cross-study benchmarking.
Finally, only a small subset of studies reported confusion matrices or explicit error breakdowns, even though these are critical for interpreting how models behave in practice. For example, ref. [
56] reported a confusion-matrix-style breakdown for RF results (0.975 accuracy, AUC 0.98), clarifying the types of mistakes made and their likely impact on intervention workload. Overall, variation in metric choice and reporting depth remains a barrier to synthesis, two models with similar accuracy can imply very different institutional outcomes depending on false negatives (missed at-risk students) and false positives (unnecessary interventions). For this reason, when interpreting the modelling approaches in
Section 4, performance claims should be read through the lens of class-sensitive metrics and transparency in reporting, rather than accuracy alone.
Table 6 summarises the metrics reported across the reviewed studies listed in descending frequency.
5. Interpretability and Practical Deployment
High predictive performance alone is insufficient in real HEI, models must also be interpretable and actionable. Without transparency, institutional staff may hesitate to act on model outputs, undermining the impact of EWS. Across the reviewed literature, interpretability and deployment are most often addressed through four recurring directions: (i) identifying influential predictors and presenting them transparently, (ii) using inherently interpretable model families, (iii) adopting probabilistic risk reasoning, and (iv) framing models as decision-support systems that support timely intervention. These directions primarily address RQ2, while recurring gaps in reporting and validation connect directly to RQ3.
5.1. Interpretability Practices
Across the reviewed studies, interpretability was most often addressed through attribution-based explanations that indicate which variables contributed most to a prediction. This was especially evident in studies that integrated robust predictive models with post hoc explainability. For example, ref. [
4] combined prediction with Shapley Additive Explanations (SHAP) and model-specific importance analyses to highlight which factors most influenced dropout risk, explicitly framing explanations as necessary for justifying decisions and supporting responsible use. A similar pattern appeared in [
48], where SHAP was used to identify the strongest academic drivers behind the model outputs, moving the discussion beyond a single risk score to a clearer explanation of why a student was flagged. Together, these approaches improve communicability to staff and strengthen decision support, directly addressing RQ2.
A smaller set of studies relied on inherently interpretable or uncertainty-aware model families. For instance, ref. [
1] used Bayesian networks to represent dependencies among risk factors and produce transparent risk estimates under uncertainty rather than only deterministic labels. This type of modelling can align naturally with institutional reasoning (e.g., linking risk to specific academic and background conditions), which may reduce resistance to adoption and better support actionable intervention planning.
Rule-based explanations also appeared, typically through constrained tree models that prioritised readability. For example, ref. [
23] used shallow DTs to describe student profiles in a form that can be reviewed and discussed by non-technical stakeholders. While such constraints can reduce model flexibility, they can improve interpretability at the point where intervention decisions are made, again aligning with RQ2.
Despite these examples, interpretability was concentrated in a minority of papers. Many studies reported predictive results but provided limited detail on how explanations were produced, validated, and communicated to end users. This gap is particularly consequential when demographic or socioeconomic variables are included, because institutions must be able to justify how such signals influence risk estimates and ensure that model outputs do not amplify existing inequities. In relation to RQ3, the reviewed literature therefore highlights a recurring requirement for real-world deployment. It is recommended that explanations be reported transparently and, where possible, validated with stakeholders to support models that are not only accurate but also governable in practice.
5.2. Deployment and Actionability
Compared with the previously reviewed studies, fewer provided detailed evidence of end-to-end deployment. Nevertheless, the studies that went further shared a common approach. In the aforementioned studies, prediction was regarded as a component of an early-warning or decision-support workflow rather than an isolated classification task. For example, ref. [
3] proposed and evaluated an Early Detection System (EDS) aligned with semester-level decision points. Their results showed that predictive performance evolved as more academic evidence accumulated, and they discussed how different feature groups became informative at different stages (e.g., demographic and pre-entry indicators early, performance indicators later). This temporal framing improves usability by linking model outputs to when and how institutions can intervene, directly supporting RQ2.
A similar emphasis on actionability appeared in studies that positioned prediction as a trigger for targeted support. For instance, ref. [
29] framed early prediction as a mechanism for guiding academic assistance strategies, reinforcing that practical value depends on alignment with institutional decision timelines rather than performance alone. Other work adapted modelling choices explicitly to support downstream decision-making. For example, ref. [
34] reframed dropout prediction to integrate heterogeneous inputs better and produce outputs meaningful for counselling and support processes, placing greater emphasis on interpretability and decision relevance than on purely tabular optimisation.
Some of the clearest deployment-oriented contributions were those that incorporated monitoring and user-facing interfaces. For example, ref. [
26] proposed a weekly prediction framework with a front-end interface, enabling instructors to track risk trajectories over time and supporting student reflection. This addresses two operational requirements that were frequently under-specified elsewhere, generating time-sensitive outputs and presenting them in a form that can be acted upon.
Overall, the reviewed literature contains substantially more evidence on predictive performance than on how predictions are translated into decisions. Even when strong models were reported, links to intervention design and institutional process integration were often thin (e.g., [
46]). Regarding RQ3, this finding highlights a recurring limitation and a clear research direction. Future studies should document how risk outputs are operationalised (e.g., thresholds or ranking strategies, responsible actors, escalation paths, and feedback loops) and evaluate usefulness with validation choices and metrics aligned with early-warning goals (e.g., recall/precision trade-offs and workload implications), rather than relying on accuracy alone.
6. Limitations and Challenges
Despite notable progress in dropout prediction research, our review of 61 studies highlights persistent limitations that constrain real-world deployment and the strength of cross-study conclusions. These challenges are rarely isolated technical issues; instead, they reflect recurring constraints in educational data access, reporting practices, and institutional adoption. Across the reviewed literature, four categories were most consistently discussed: (i) data availability and quality, (ii) generalisability and reproducibility, (iii) fairness and bias, and (iv) operational and ethical challenges. These categories are summarised in
Table 7, ordered from the most to the least frequently reported limitations.
6.1. Data Availability and Quality
The most frequently reported limitation was data-related. A recurring issue is the restricted availability of data, its incompleteness, and its representativeness. These issues affect both the learning of models and the credibility of reported performance. As shown in
Table 7, 12 studies explicitly acknowledged data scarcity, typically linked to small cohorts, limited temporal scope, or substantial record filtering during cleaning. Examples include settings with small institutional samples [
2,
46], as well as cases where cohort construction and preprocessing reduced the effective sample size [
48]. Constraints similar to those previously mentioned have also been identified in other studies, which have noted that the available institutional variables were too limited to capture the full range of drivers of dropout [
58]. In practice, these constraints can inflate variance, encourage overfitting, and render results highly sensitive to cohort definitions and inclusion criteria.
A closely linked limitation is the presence of missing or inaccessible variables, which have broad downstream implications for both prediction and intervention design. Several studies noted that behavioural, psychosocial, and motivational factors are often absent from institutional systems or difficult to capture at scale, pushing models toward academic and administrative proxies [
3]. This matters because proxies may improve prediction while offering weaker insight into actionable causes, particularly when the goal is early and supportive intervention rather than retrospective explanation.
Finally, class imbalance was explicitly reported as a challenge in 10 studies, reinforcing the notion that dropout is a minority outcome. This limitation is emphasised in work that treats imbalance as a central methodological issue that can distort both training and evaluation if not handled carefully [
9,
36]. As a result, strong headline accuracy does not necessarily imply reliable detection of at-risk students, and performance claims can be difficult to interpret when imbalance handling and minority-class outcomes are not reported transparently.
6.2. Generalisability and Concept Drift
Generalisability remains one of the most persistent limitations in the reviewed literature. It is explicitly acknowledged in 40 studies, as summarised in
Table 7, indicating that dropout models are still most often trained and tested within a single institutional context. In these settings, models can capture local regularities tied to specific admission rules, programme structures, assessment practices, and support policies, which may not hold elsewhere. This concern is explicitly raised across studies using administrative records from individual universities as well as those emphasising explainability and institutional decision-making constraints [
3,
4,
6,
24]. In practice, strong results at one institution do not automatically imply that the same feature sets, thresholds, or model families will remain effective across different governance structures, grading cultures, or student demographics.
A smaller but important subset of studies also highlights temporal instability, where predictor–outcome relationships shift across semesters, cohorts, or stages of the student lifecycle. Such shifts are consistent with concept drift; risk factors that are informative early (e.g., pre-entry and demographic variables) may become less predictive later. In contrast, behavioural disengagement or accumulated academic signals become more salient. This issue is explicitly noted in work using repeated or stage-based prediction designs, showing that performance can vary substantially depending on when the model is applied [
3,
26]. Despite acknowledging temporal drift, few studies describe concrete monitoring strategies (e.g., drift detection, periodic recalibration, or scheduled retraining), meaning temporal robustness is more often identified as a risk than treated as a design requirement.
Reproducibility is closely tied to these generalisability concerns. Even when models report high performance, cross-study comparisons are limited by inconsistent reporting of cohort definitions, feature engineering choices, preprocessing pipelines (including imbalance handling), and tuning and validation protocols. Together with the continued scarcity of openly reusable datasets, these reporting gaps limit replication and weaken claims about transferability and robustness across contexts.
6.3. Fairness and Bias
Fairness and bias concerns are explicitly raised in 15 studies, most often because dropout models frequently rely on demographic and socioeconomic variables (e.g., age, gender, nationality, scholarship status, neighbourhood proxies, parental education). While these variables can improve predictive performance, they also create clear risks in deployment. Models may reproduce historical disadvantages, amplify structural inequalities, or generate disproportionate false positives/false negatives for specific student groups if subgroup behaviour is not examined. These risks are explicitly acknowledged across studies that discuss responsible use, explainability, or governance constraints around sensitive predictors [
2,
3,
4,
6,
24].
A key limitation is that fairness is more often mentioned than operationalised. Only a minority of studies describe concrete fairness-orientated practices, such as subgroup performance reporting (e.g., disaggregated recall/precision), comparisons of error rates across protected or vulnerable groups, sensitivity analyses in which sensitive variables are removed or constrained, or governance mechanisms that define how predictions should be acted upon. This gap matters because, in early-warning settings, the costs of errors are asymmetric: false negatives can mean missing support for students who need it most, while false positives can lead to unnecessary interventions or stigma.
The dominance of single-institution designs further compounds fairness limitations. When models are trained and evaluated in a single context, it becomes difficult to assess whether their performance and the implied risk drivers generalise equitably across institutions with different student demographics, support policies, and structural conditions. Without broader validation, there is a risk that a model that appears accurate overall may still behave unevenly for under-represented groups, limiting both trust and responsible adoption in real educational deployments.
6.4. Ethical and Operational Barriers
Beyond modelling constraints, several studies emphasise ethical and operational barriers that determine whether predictive systems can be deployed responsibly. Ethical and privacy constraints are explicitly acknowledged in eight studies, as summarised in
Table 7, reflecting concerns around sensitive data handling, consent, and data governance, as well as the risk that “at-risk” labels may stigmatise students if predictions are communicated or acted upon without safeguards. These concerns are raised in studies that explicitly discuss privacy, transparency, or responsible-use implications of deploying predictive tools in educational contexts [
3,
4,
15,
21].
A closely related adoption barrier is the implementation gap. Intervention limitations are explicitly noted in six studies, where predictive outputs are produced without a clearly specified and evaluated pathway from prediction to action. In these cases, models can achieve strong results experimentally, yet they remain difficult to operationalise because institutions lack defined processes for thresholds, responsible actors, follow-up actions, and feedback loops [
2,
46]. The significance of this discrepancy lies in recognising that predictive accuracy alone is insufficient to address complex social issues. Institutional readiness and intervention frameworks are crucial components in ensuring that outputs are not merely disregarded, misinterpreted, or applied inconsistently.
Practical constraints on feasibility are also present, with particular emphasis on the impact of model complexity on deployability. The limited interpretability of such models is reported in several studies, with the implication that even high-performing models may encounter difficulties when stakeholders are unable to justify or communicate the reasons for a student being flagged [
1,
21,
46]. Furthermore, certain papers emphasise the computational or maintenance burdens of more complex pipelines, which can impede adoption in institutions with constrained infrastructure, thereby rendering monitoring and updating more arduous over time [
10,
23].
Overall, these ethical and operational barriers reinforce the central theme evident throughout the reviewed literature: responsible deployment requires more than just strong predictive performance. Recurring prerequisites for real-world uptake include clear governance (privacy, access control, and communication practices), actionable workflows (who intervenes, when, and how), and transparent outputs.
7. Discussion
The results in the previous sections show a literature that is diverse in methods but shaped by a few recurring patterns. Most datasets are institutional and structured, dropout is often the minority class, and many papers report predictive performance without fully showing how predictions would be used in an intervention workflow. This discussion connects these findings directly to the defined RQs.
In relation to RQ1, the clearest pattern is that results depend less on the “type” of algorithm and more on the type of data available. Because most studies rely on structured institutional records, traditional ML approaches repeatedly perform well and remain practical choices for many HEI, especially LR, DT, RF, and boosting methods [
9,
10,
29]. In many of these settings, the advantage of DL models is inconsistent. When neural networks are trained on the same structured variables, reported gains are often small, mixed, or difficult to compare across papers because preprocessing and validation are described unevenly. Where DL becomes more valuable is in the smaller group of studies that include richer evidence of student engagement, such as LMS interaction logs or patterns over time. In those cases, DL models can better capture complex engagement behaviour and support earlier identification of disengagement [
18,
20,
21]. Overall, this review suggests that when the available data is mostly administrative and academic, traditional ML is usually enough; however, when institutions also have reliable behavioural traces over time, DL may offer stronger benefits.
These findings also help interpret RQ2. Across the reviewed studies, a strong model is not automatically useful. The papers that engage more directly with institutional use tend to frame prediction as part of a decision-support process, clarifying when predictions are produced, which information is available at that point, and how staff might interpret and act on results [
3,
26]. This matters because many of the strongest predictors are academic performance indicators, but those indicators can become informative only after problems have already appeared. Behavioural data can signal disengagement earlier, but it is harder to collect consistently and often raises governance concerns. Interpretability practices follow the same logic; many studies rely on explanation methods that highlight influential variables to justify why a student was flagged and to make outputs easier to communicate [
4,
48]. A smaller set uses models that are easier to explain by design or that explicitly express uncertainty, which can fit institutional reasoning and accountability requirements [
1,
50]. Taken together, the evidence suggests that real-world usefulness comes from combining timely predictions with explanations that staff can understand and trust, not from optimising performance alone.
From the perspective of RQ3, the same evidence also explains why certain challenges keep appearing. First, external validity remains weak because most studies are based on one institution. Strong performance can reflect local rules, curricula, and data-collection practices that do not hold elsewhere [
4,
6]. Second, reproducibility is limited by incomplete reporting of cohort definitions, feature construction, preprocessing, and tuning, which makes it difficult to reproduce results or compare studies fairly [
5,
58]. Third, several studies acknowledge that performance can change across semesters or cohorts, yet very few evaluate monitoring, updating, or retraining as part of a sustained pipeline [
26]. Finally, fairness and ethical concerns are repeatedly linked to common practice: demographic and socioeconomic variables can improve prediction, but without subgroup evaluation and governance safeguards, models risk reinforcing existing inequalities, especially when explanations are limited [
3,
24]. This review also highlights an implementation gap. Several papers report strong prediction models without showing a clearly defined and evaluated path from risk scores to interventions and outcomes [
2,
29,
46].
Overall, the reviewed evidence supports three conclusions across RQ1–RQ3: (i) under common institutional data constraints, traditional ML is often a strong and deployable choice; (ii) DL shows clearer value when behavioural or time-based evidence is available and early intervention is the goal; and (iii) real impact depends on transferability, clear reporting, and responsible deployment practices that address interpretability, fairness, privacy, and changes over time.
8. Future Research Directions
As predictive modelling in HEI continues to evolve, the next frontier is not solely about maximising accuracy but about building systems that are transferable, interpretable, and governable in real institutional workflows. In the following points, we highlight several converging directions that can guide both research and implementation.
Multi-Institutional Collaboration and Shared Benchmarks: A persistent bottleneck is the dominance of single-institution datasets, which limits external validity and makes benchmarking across contexts difficult. Several studies explicitly acknowledge that models are shaped by local policies, cohort structures, and incomplete contextual coverage, suggesting that stronger evidence will require cross-institution validation and shared benchmarks [
2,
5]. Privacy-preserving collaboration (e.g., federated or secure multi-party learning) and governance-ready data-sharing agreements are promising pathways to address this gap without compromising confidentiality.
Explainability and Human-Centered Design: Although predictive performance has improved, far fewer studies demonstrate explanations designed for real advisory use. Work that integrates explainability (e.g., feature attribution or instance-level reasoning) shows how transparency can support stakeholder trust and more defensible decisions [
4,
48]. Future systems should treat explainability as part of the interface and workflow (not only as an additional result), aligning outputs with how advisors and support teams interpret risk and decide interventions.
Ethical Standards, Fairness Audits, and Governance-by-Design: Multiple studies highlight ethical risks associated with sensitive data, proxy variables, and potential stigmatization, especially when demographic and socioeconomic indicators are used without subgroup evaluation [
3,
5]. A more robust next step would be to incorporate privacy safeguards, fairness testing, consent and communication practices, and accountability mechanisms into the modelling pipeline itself. Deployment feasibility depends not only on whether the system predicts well but also on whether institutions can justify and govern it.
Longitudinal and Behavioural Modelling Beyond Static Snapshots: Despite the availability of behavioural traces in some contexts, most studies still frame dropout prediction as a static classification task over tabular summaries. Even when strong results are reported, limitations remain in modelling progression dynamics and turning behavioural evidence into time-sensitive risk signals [
2,
46]. Future work should expand the range of longitudinal modelling choices (e.g., trajectory-based learning, time-aware validation) and justify architectures in terms of the temporal decision points that institutions actually operate under, e.g., early alerts vs late-stage confirmation, thereby tightening the link to RQ1 and RQ2.
Standardized Evaluation and Reporting Beyond Accuracy: The absence of shared datasets is compounded by inconsistent reporting of metrics and protocols. Because dropout is often imbalanced, accuracy-only reporting can obscure minority-class detection and inflate the perceived usefulness of early warning. Future studies should adopt standardized evaluation practices and report imbalance-aware metrics (e.g., recall, precision, F1-score, ROC-AUC). When risk probabilities are used operationally, calibration and threshold rationale should be included.
Low Adoption of Modern Architectures for Structured and Relational Data: Although transformers and graph-based models are well-suited to language reformulations, sequences, and relational structures, they remain rare in the reviewed set. Transformer-style modelling appears only in isolated cases [
34], and graph-based approaches are absent despite their potential for modelling course networks, prerequisite structures, or peer/interaction graphs. Wider adoption will likely require better access to behavioural and relational data, clearer benchmarking, and more explicit discussions about the feasibility of deployment in terms of computing, maintenance, and interpretability.
Overall, these guidelines suggest that future advances in the field will be driven by improvements in transferability and governance as much as by improvements in raw performance.
9. Conclusions
The objective of this paper was to synthesise recent evidence on student dropout prediction in HEI and to clarify, beyond reported performance, what data are being used, how features and preprocessing are handled, which modelling approaches dominate, and what the literature reveals about evaluation, interpretability, and practical deployment. To that end, we reviewed 61 studies and consolidated evidence on data sources, feature engineering practices, preprocessing choices, modelling strategies, evaluation practices, and interpretability and deployment considerations. The overall conclusion is that predictive performance has improved substantially; however, the practical impact of these models continues to be shaped by recurring constraints, namely limited data portability, inconsistent reporting, and the difficulty of translating risk scores into sustained institutional action.
Traditional ML approaches remain the most common and, in many settings, the most pragmatic choice. Tree-based ensembles and logistic regression continue to achieve strong results on structured academic and administrative records, which are the dominant data type available across institutions. DL appears less frequently and is most often implemented as feedforward architectures on tabular data; stronger gains are reported when richer behavioural evidence is engineered into learnable representations or when models leverage more informative engagement traces. Hybrid and ensemble strategies are typically used to strengthen robustness and to address class imbalance, especially in early-warning contexts where identifying the minority dropout class is operationally critical.
Despite these advances, our synthesis highlights three persistent barriers to generalisability and deployment. First, most studies rely on single-institution datasets, and open or shared benchmarks remain rare, limiting external validity and cross-study replication. Second, dropout is frequently imbalanced, yet performance reporting still often foregrounds accuracy; studies that also report recall, precision, F1-score, and ROC-AUC demonstrate why imbalance-aware evaluation is essential for trustworthy EWS. Third, relatively few papers evaluate end-to-end deployment, including decision thresholds, stakeholder-facing explanations, intervention workflows, or monitoring over time, even though these factors often determine real adoption.
To advance the field, future work should prioritise: (i) multi-institution validation and privacy-aware collaboration to strengthen transferability, (ii) standardised and transparent reporting of cohort definitions, preprocessing, and evaluation beyond accuracy, and (iii) human-centred deployment designs that integrate interpretability, fairness auditing, and intervention capacity into the modelling pipeline from the outset. Progress along these directions is key to developing EWSs that not only predict risk but also support timely, interpretable, and equitable interventions in HEI.




 ,
,