1. Introduction
The use of large language models (LLMs) has increased within the software development community. LLMs are a type of natural language processing (NLP)–based artificial intelligence that understands and generates content from human language input command prompts, making them invaluable for tasks like translation, code generation, summarization, and sentiment analysis. Many software engineers rely on LLMs for software development tasks. Writing code, test cases, debugging, and understanding software code are some of the applications that software developers use with LLMs. This significantly enhances software engineers’ productivity and assists in automating tasks that reduce the time spent on repetitive coding tasks and allow engineers to focus on more complex and creative aspects of development.
Code generation applications are essential for enhancing the efficiency and productivity of software development. They automate the creation of code, reducing the time developers spend on repetitive and boilerplate tasks. However, when using these applications, it is crucial to consider the complexity of the code being generated to ensure it aligns with the project’s requirements and maintainability standards. Code correctness is another key factor, as the generated code must function as intended without introducing bugs or loopholes. Accuracy is equally important for ensuring that the code adheres to best practices and coding standards. Balancing these considerations helps developers leverage code generation tools effectively while maintaining high-quality and reliable software.
Code summarization applications are vital for improving the readability and maintainability of software projects. They help developers quickly understand the purpose and functionality of code segments, which is especially useful when dealing with large codebases, understanding legacy code, debugging, onboarding new team members, and improving documentation. However, ensuring the accuracy of these summaries is crucial, as any misinterpretation can lead to misunderstandings and potential errors in the code. Additionally, maintaining linguistic similarity between the summary and the original code is important to preserve the context and intent, making the summaries more intuitive and easier to follow. Balancing these considerations ensures that code summarization tools provide reliable and helpful insights for developers.
Evaluating LLMs for code generation and summarization is critical, as these models increasingly influence software engineering practices. Proper selection of LLMs can impact code quality, maintainability, and development efficiency. In industry settings, selecting an appropriate LLM can significantly improve code quality and reduce debugging time. For example, a software development team integrating an LLM for automated code suggestions observed that using a model with higher summarization and maintainability scores reduced error-prone refactoring and improved overall productivity. Such insights demonstrate the practical benefits of informed LLM selection for both small and large-scale software projects. By systematically assessing LLM capabilities, our study aims to provide actionable insights that help researchers and practitioners make informed decisions when integrating LLMs into software development workflows.
Selecting the right LLM for code generation and summarization is crucial due to the varying requirements of code complexity, correctness, differences in LLMs’ perplexity [
1], and linguistic dissimilarity. Closed-source LLMs often come with limitations such as a lack of transparency and customization, making it challenging to assess their suitability for specific tasks. Open-source LLMs, on the other hand, offer greater transparency and flexibility, allowing researchers and practitioners to inspect model architectures, training objectives, and fine-tuning strategies, which is particularly valuable for understanding model behavior in code generation and summarization tasks. This transparency enables systematic error analysis, reproducibility, and informed model selection. Additionally, the flexibility of open-source LLMs allows customization through fine-tuning, prompt engineering, and integration into existing development pipelines, making them well-suited for diverse software engineering applications where task-specific adaptation is often required. However, the decision is complex and multifaceted, as it involves evaluating multiple parameters to ensure the chosen model can handle the intricacies of the code while maintaining high standards of accuracy and readability. This process requires careful consideration and balancing of these factors to make an informed and effective selection.
Despite all of the different available LLM applications, assessing both LLM code generation and code summarization is a complex process to measure, as it involves different aspects to evaluate the code quality generated and the code similarity levels reached. This study aims to leverage machine learning classification and ranking algorithms to conduct an empirical study to address this literature gap by proposing a framework for evaluating LLM code and summarization similarity using different quality measures. This research will analyze code generation and code summarization output from four open-source LLMs. Coding problems are given to these models to solve and analyze the code generated in terms of test case correctness, the quality of the generated code, the complexity of the software program generated, perplexity to assess LLM tokens to study the model’s abilities, and code summarization text-similarity evaluation to verify if the models are suitable for summarizing a code problem and whether they can fulfill the project stakeholders’ needs. LLM selection is implemented through classification accuracy and ranking score to demonstrate how to properly select the best-suited LLM for a specific coding task, considering features related to the generated code and code summary obtained from the LLM.
The major contributions of this study are as follows:
A machine learning-driven framework combining classification (SVM) and ranking (RankNet) methods to evaluate open-source LLMs for code generation and summarization tasks.
The systematic extraction and analysis of software engineering metrics and summarization similarity features to inform LLM selection.
A comprehensive evaluation of four open-source LLMs using Python-based MBPP tasks, including comparative analysis with baseline methods.
A discussion of practical implications for software engineering applications and guidance for future research on LLM selection.
The rest of this paper is organized as follows.
Section 2 provides related work.
Section 3 describes the methodology.
Section 4 and
Section 5 present the experimental results and discussion. Finally,
Section 6 presents the study’s conclusion and limitations.
2. Related Work
Since their early emergence, LLMs have been used widely to assist in various software engineering tasks, including code generation. The study by Jiang, J. et al. [
2] categorized code LLMs-related software applications into understanding and generation tasks. Examples of generation tasks consist of code generation and code summarization. Examples of understanding tasks include code classification, code search, and bug detection applications. The study discussed how the availability of LLMs has made software development more productive and accessible by extending automation tasks, which has led to more developers being dependent on different software-level code generation models despite their complexity levels [
3]. The study by Haque A. [
4] compared software project status before and after the emergence of LLMs. The study showed that projects relied heavily on manual processes, making them time-consuming, prone to errors, and resource-intensive. After the rise of LLMs, the outlook changed drastically, shifting projects towards automation, therefore improving the speed of development, increasing code quality, and making them less prone to errors. The same study reported a survey of different AI-assisted software development tasks used by developers, from planning to maintenance tasks. The highest percentage was coding with 82.5% and debugging with 49%. The same study stressed the difference between closed- and open-source LLMs, indicating how closed models sometimes provide inefficient code where test quality is more related to code complexity. Another study by Das K. et al. [
5] revealed that ChatGPT-generated code was used as-is by developers and resolved only 5.83% of the total issues. Moreover, LLMs may also produce different results for the same code generation prompt, as shown in studies [
6,
7,
8], which makes the use of LLMs in code generation tasks unpredictable in terms of correctness.
The quality of LLM-generated code is vital for any software project to obtain a high-quality code base. The work by Sepidband M. et al. [
9] studied code complexity metrics for LLMs’ code generation output for four datasets, and compared the pass@1 score for four LLMs. The study analyzed the distributions of complexity metrics and how they differ between successful and failed code solutions generated by LLMs. Another study by Khan M. et al. [
10] analyzed how complexity metrics differ between ChatGPT-generated code and human-written code. The machine learning models used were able to distinguish ChatGPT from human code with up to 88% accuracy. The study by Hu W. et al. [
11] proposed a complexity-aware metric benchmark to evaluate LLM code generation. The study uses nested call graphs to categorize the difficulty of code problems and generate benchmarks to be compared with the ground truth. In the context of automated software synthesis, the study by Biswas S. et al. [
12] reported that LLMs often face the challenge of local optima, where the model generates functional but suboptimal code or fails to navigate complex logical constraints, indicating the need for better LLM reliability selection criteria. Another study by Mahmud T. et al. [
13] uses ensemble learning on LLM code generation tasks, using the CodeBLEU metric for detecting semantic similarity and CrossHair’s differential behavior analysis to select the most reliable LLM solutions that achieve the highest accuracy of 90.2%. Other research by Huynh N. and Lin B. [
14] discussed the need for CodeBLEU metrics to assist in evaluating the quality of LLM code generation, both grammatically and logically. The results of the study demonstrate that CodeBLEU has a better correlation with human evaluation scores compared to traditional metrics such as BLEU.
By analyzing the perplexity of generated code, insights into the complexity and predictability of the generated code can be determined. The study by Mostafa A. et al. [
15] demonstrated the impact of tokenizers on model performance by using the Llama 3.2 (1B-parameter) model, the encoder-only BERT model, and the encoder–decoder BART-Base model on binary code using three different tokenizers. The highest Llama accuracy reached is 85.76%, and BERT’s highest accuracy is 86.58%. The study by Xu J. [
1] discussed how different models yield different perplexity scores based on how models focus on core logic, usage, boundary conditions, and robustness. Other factors include code authenticity, language diversity, and generalization capabilities. Another study by Xu Z. and Sheng V. [
16] employed the GPT-3.5 model to detect AI-generated code from human-like code. The research showed that AI-generated code usually has a low perplexity score compared with human code, and no other LLMs were used in the study.
Several studies showed how beneficial it is to use LLMs with bug reports, making use of LLM text generation and text summarization features to provide well-structured bug reports. This will not only help to minimize ambiguity but also enhance developers’ productivity by helping them resolve issues with efficient processes and clear guidelines [
17]. The study by Bo L. et al. [
18] utilized the ChatGPT GPT-3.5-turbo LLM to rewrite bug reports with missing information to produce complete and accurate bug reports, with the goal of saving developers’ time and allowing them to focus solely on software fix tasks. Some other studies [
19] try to mitigate the issue of unstructured bug reports by creating structured bug reports with the use of LLMs’ text generation prompts. The same study uses SBERT, ROUGE-1, and CTQRS score measures, with results reaching up to a 70% CTQRS score on unseen projects, with an overall AI approach that is able to generalize well on bug report datasets. Generating correct bug titles in bug reports is important for describing bug severity and bug urgency for fixing. The study by Surekaby A. et al. [
20] discussed the linguistic importance of bug-report titles in assigning the correct bug severity level and ensuring correct interpretation by internal stakeholders. The same study used a predictive classifier to perform statistical analysis on word frequency and distributions across various severity levels. The use of LLMs to generate bug descriptions is mentioned in the work by Kang S. et al. [
21], which found that a fifth of LLM-produced code comments contain inaccurate statements. The authors proposed a documentation testing-driven approach to test the correctness of LLM-generated code by comparing it with the accuracy of code comments. Similarly, LLMs are used as evaluators for bug reports. In the study by Kumar A. et al. [
22], GPT-4o, LLaMA-3, and Gemini models were applied to bug title and bug description fields, and the results were compared with those of human evaluators. The study found that GPT-4o outperformed the other models for complex evaluations when compared with human evaluators, whereas human evaluators were more suitable for simpler evaluation tasks.
LLMs have been used widely with issue-tracking systems in providing bug descriptions, assigning labels [
23], and in task prioritization [
24]. The work by Chen Z. et al. [
25] used ChatGPT and DeepSeek models on bug reports from the Apache Jira dataset. The authors indicated that LLMs show potential in assisting developers in decomposing complex bug reports, but their accuracy levels performed poorly. New LLM tools have also been used to access issue-tracking systems in the work by Ciepielowski L. [
26], where the title, description, and comments for each bug issue are used as embedding vectors for the tool to retrieve bug-issue-related information. The study revealed that practitioners preferred using the chatbot tool to retrieve knowledge, which can also be used to retrieve bug details if bug titles are vague, and ultimately save developers time in overall searching efforts. In addition, ambiguity in bug reports has led stakeholders to use LLMs to clarify bug reports, similar to the study done by [
27] to recreate the test cases from bug reports, where only 50% of the executable test cases were obtained across all the study projects.
LLM code summarization is also essential to developers when there is a need to understand complex code or identify certain bugs within the LOC. The work by Sun W. [
28] used summary-to-summary and summary-to-code similarities generated from four LLMs, compared with the reference text summary and the code snippet reference summary. The study results show that CodeLlama outperformed advanced GPT-4, StarChat, and GPT-3.5 combined in generating summaries. The study used different similarity metrics such as BLEU, METEOR, ROUGE-L, and BERTScore. Furthermore, LLMs can also be used as code summarization evaluators, as shown in the study by Wu Y. et al. [
29]. The study used different LLMs from the GPT-3.5 and GPT-4 series to create a novel code summarization evaluation metric, which achieved 81.59% Spearman correlation with human evaluations, outperforming the existing BERTScore metric by 17.27%. The study indicated that the two models used varied in results, especially in accuracy and performance, and suggested using other LLMs as evaluators whenever possible.
A variety of studies explained the criteria to select the best LLM for different problems that are given. The work by Mbaiossoum B. and Bamana A. [
30] provided a state-of-the-art overview combined with a comparative analysis of well-known LLMs. These guidelines are based on model size, performance, required resources, and ethical considerations. Another study by Cheng J. [
31] considered selecting the optimal LLM for code generation problems, only focusing on the cost perspective and task difficulty. The approach achieved a 7.86% improvement in pass@1 score while reducing resource consumption by 88.9% compared to the baseline used. Within code generation problems, other applications of LLMs include selecting the best hyperparameters [
32], the best programs [
33] from different LLM outputs through consistency and LLM-generated test suite criteria, and even performing code validation from code features [
34].
Selecting the best open-source LLM for code generation and code summarization involves evaluating several key factors. Considering accuracy, clarity, and error detection is essential for evaluating the rationale behind the correct selection. In this research, we will analyze how to make judgments about LLM selection that best meet the needs for code generation and code summarization by running specific code test tasks and evaluating complexity, correctness, accuracy, and linguistic similarity as features for LLM classification and ranking problems.
3. Methodology
In the following subsections, a discussion of the test case dataset used in this experiment, with its data type, structure, and volume, is provided; then, this study demonstrates the overall experiment workflow approach used. Furthermore, this study discusses the code quality metrics used to evaluate the generated code from each selected LLM, along with the text summarization similarity measures used. Moreover, the feature selection criteria used for machine learning classification and ranking problems are explained. Finally, experimental results and a comparison of LLMs are illustrated using the selection criteria.
3.1. Data Collection
This research uses the MBPP (Mostly Basic Python Problems) dataset [
35], which contains entry-level programming tasks along with their unit test cases. This study uses a sanitized version [
36] of the dataset, which is a cleaned and curated version of the original MBPP dataset.
Table 1 lists the dataset attributes definitions, including their data types. The MBPP dataset is a benchmark designed to evaluate Python programming skills and code generation models. Each problem in this dataset includes a task description, a code solution, and a test case to verify correctness. This dataset is a valuable resource for benchmarking code generation models and improving their performance in solving real-world programming tasks.
The study incorporated a total of 427 programming tasks, consisting of 1324 test cases distributed among all of the tasks.
3.2. Overall Workflow Approach
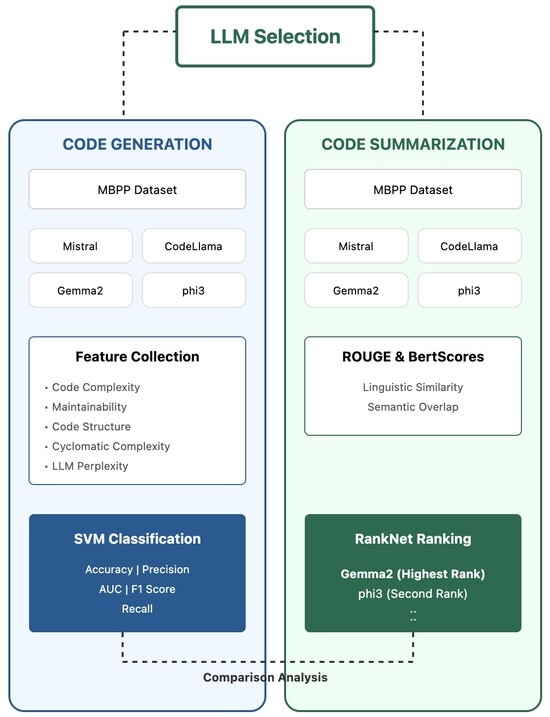
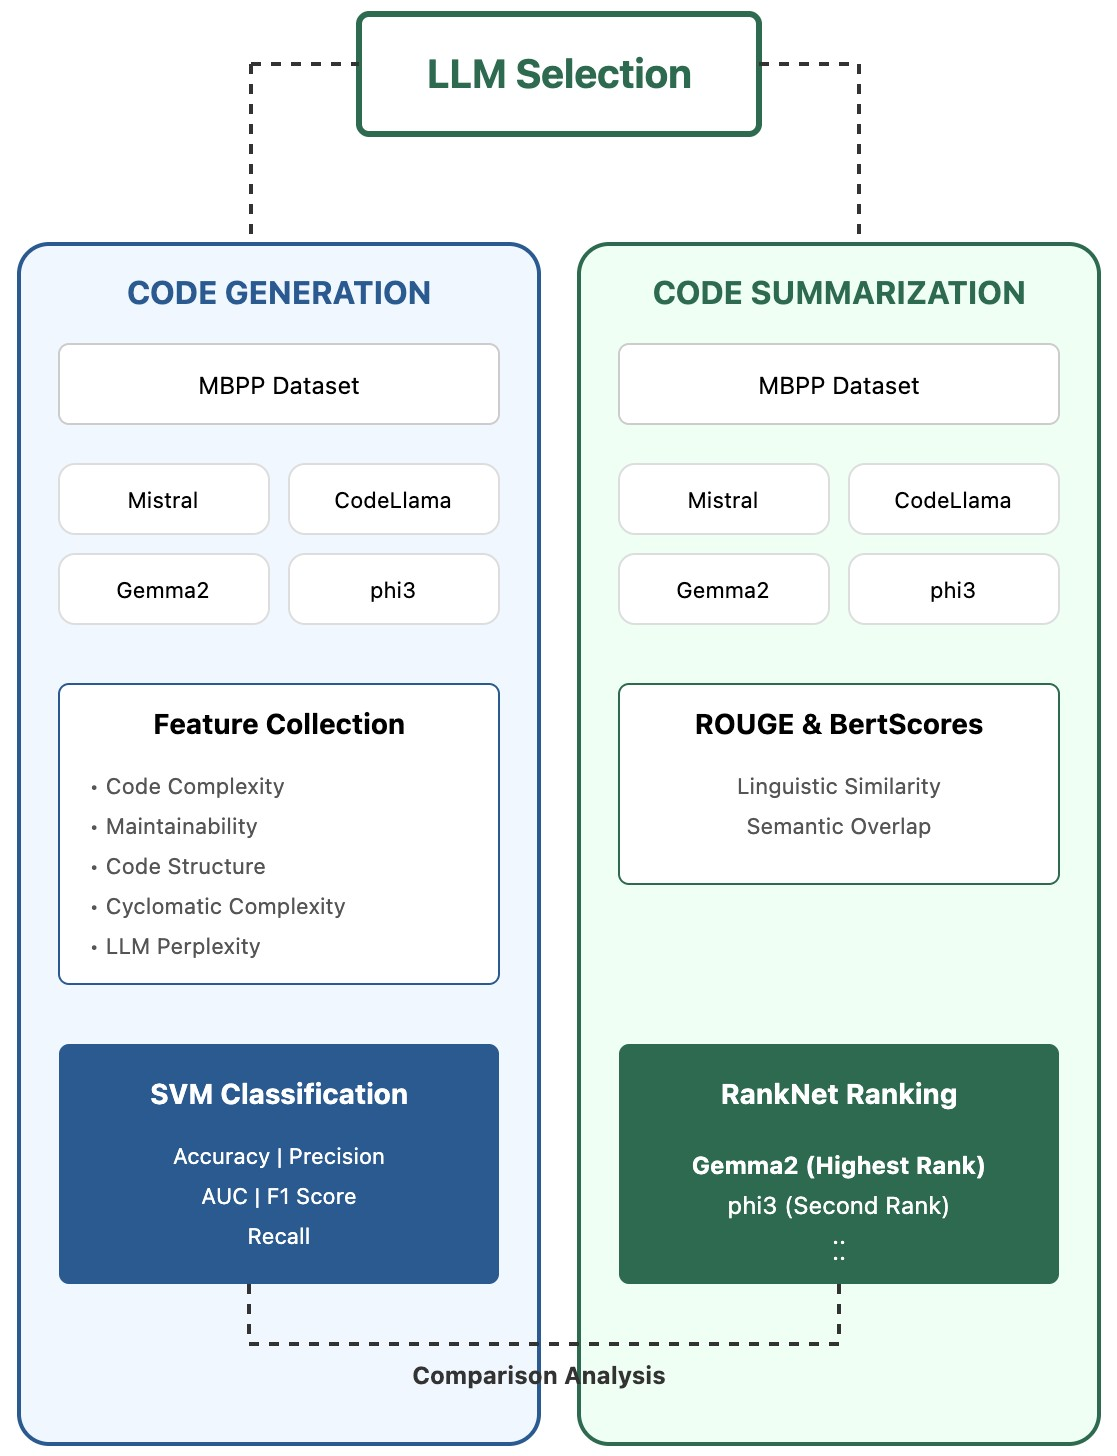
Figure 1,
Figure 2 and
Figure 3 illustrate the streamlined workflow of our study.
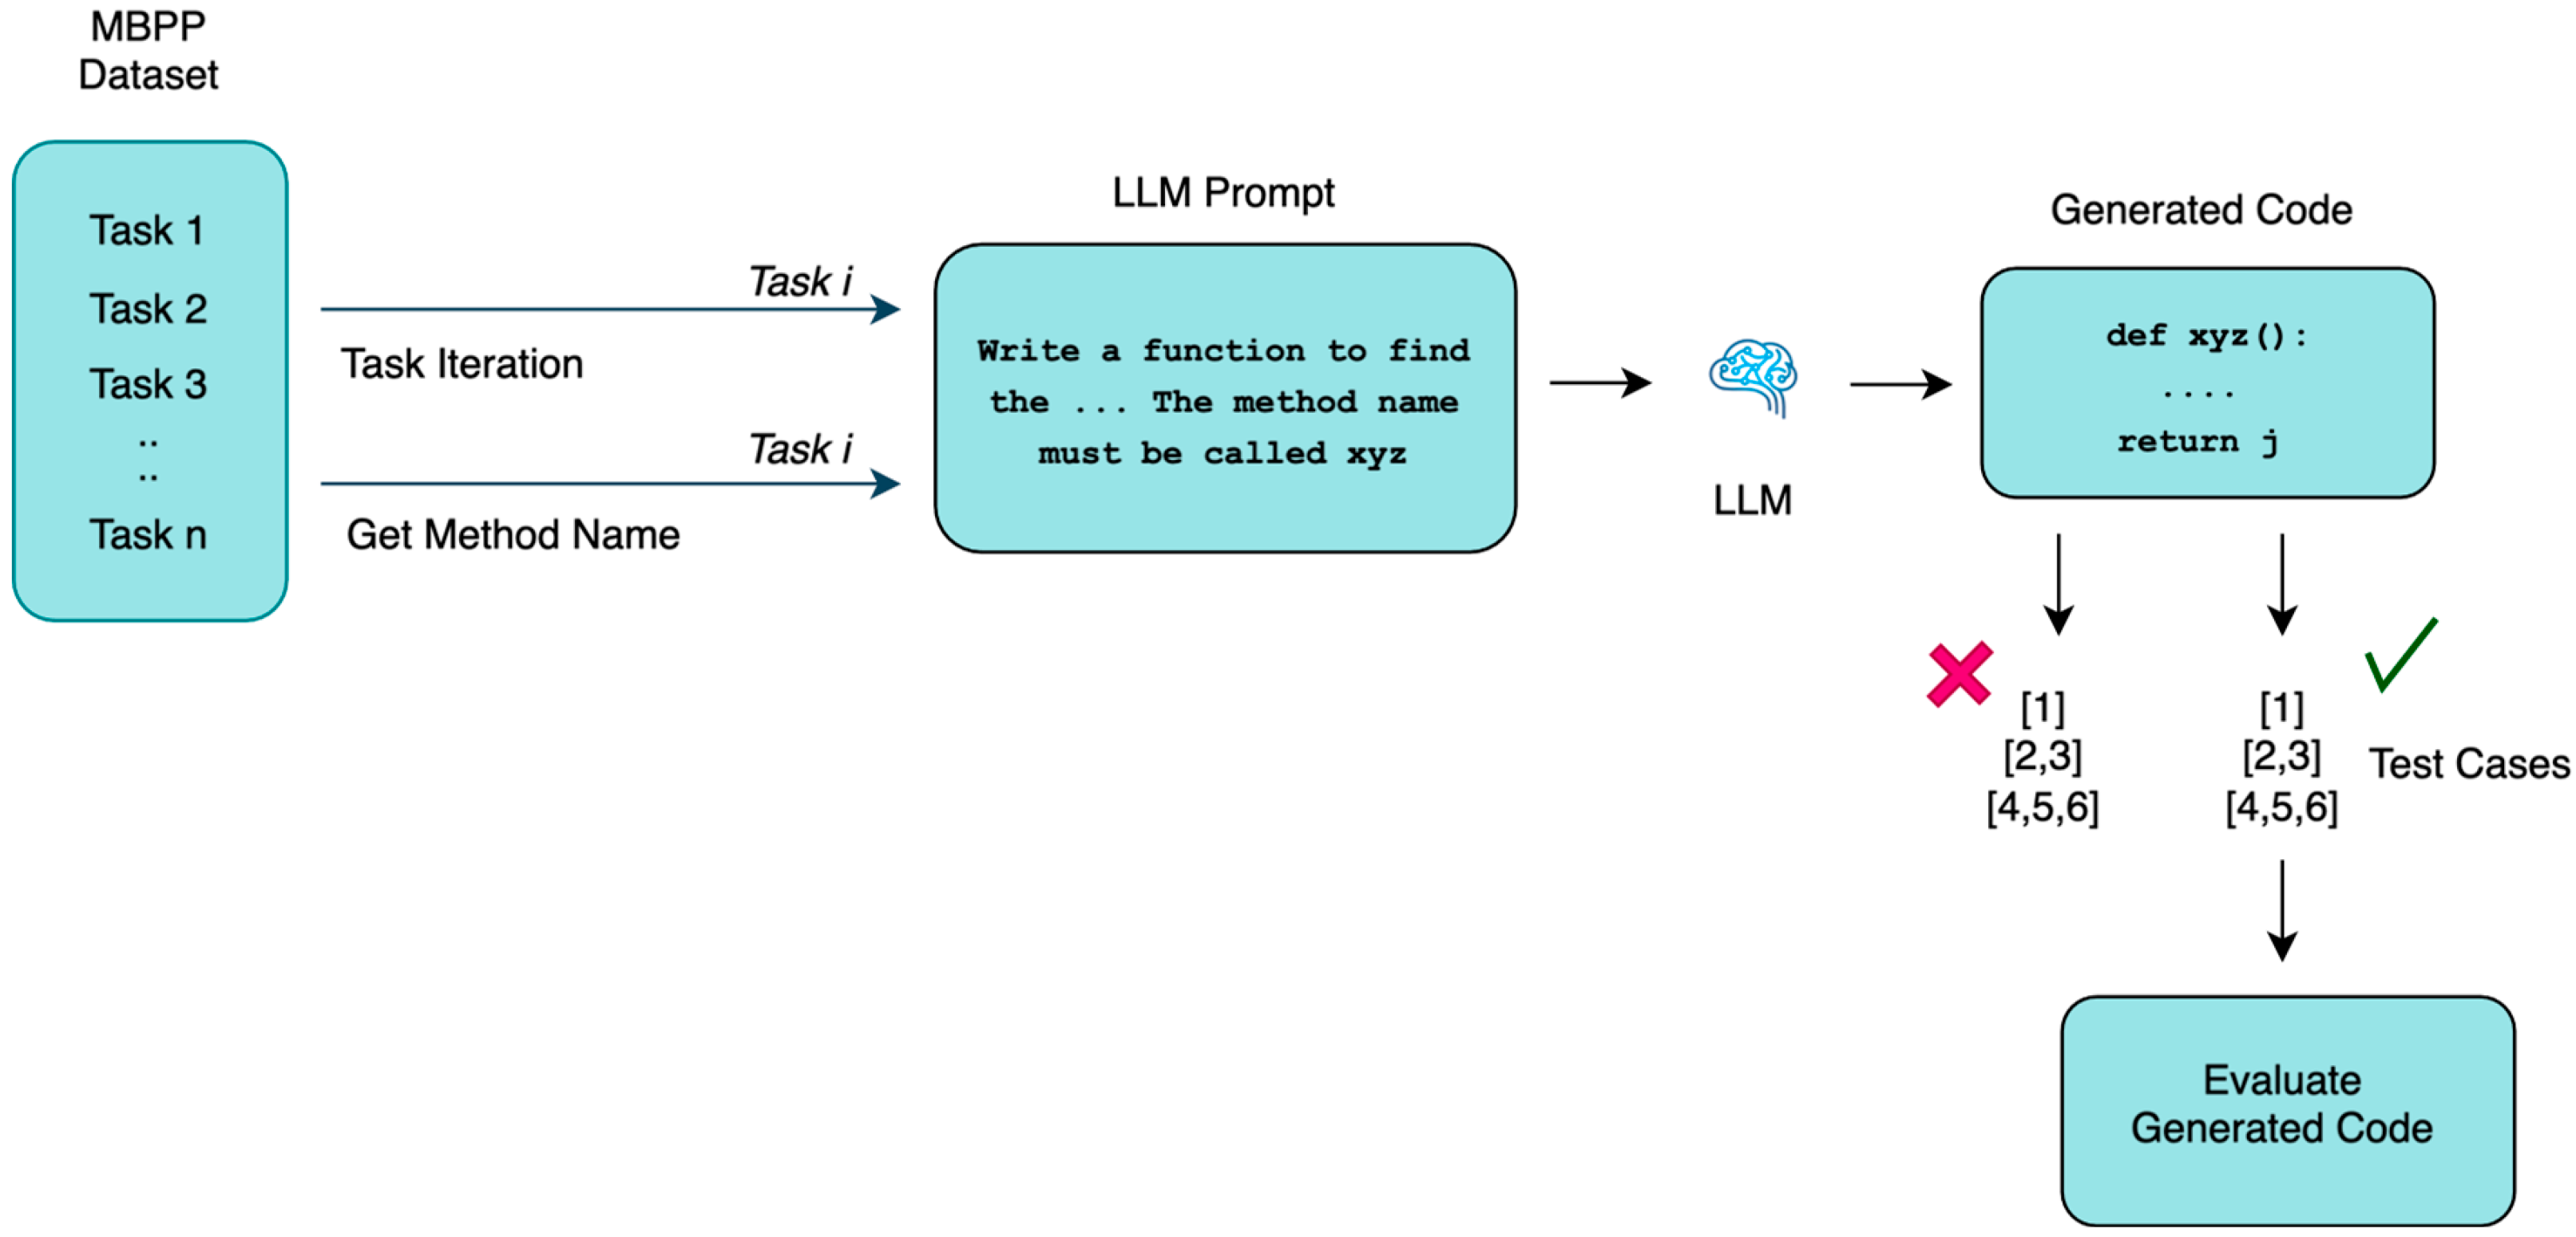
Figure 1 shows the code generation approach used. Initially, this research collects coding problems and asks a specific LLM to solve the assigned problem. The dataset test cases are applied to the generated code, where different evaluation metrics are used on the generated code snippet to calculate correctness, code quality, complexity, and LLM perplexity.
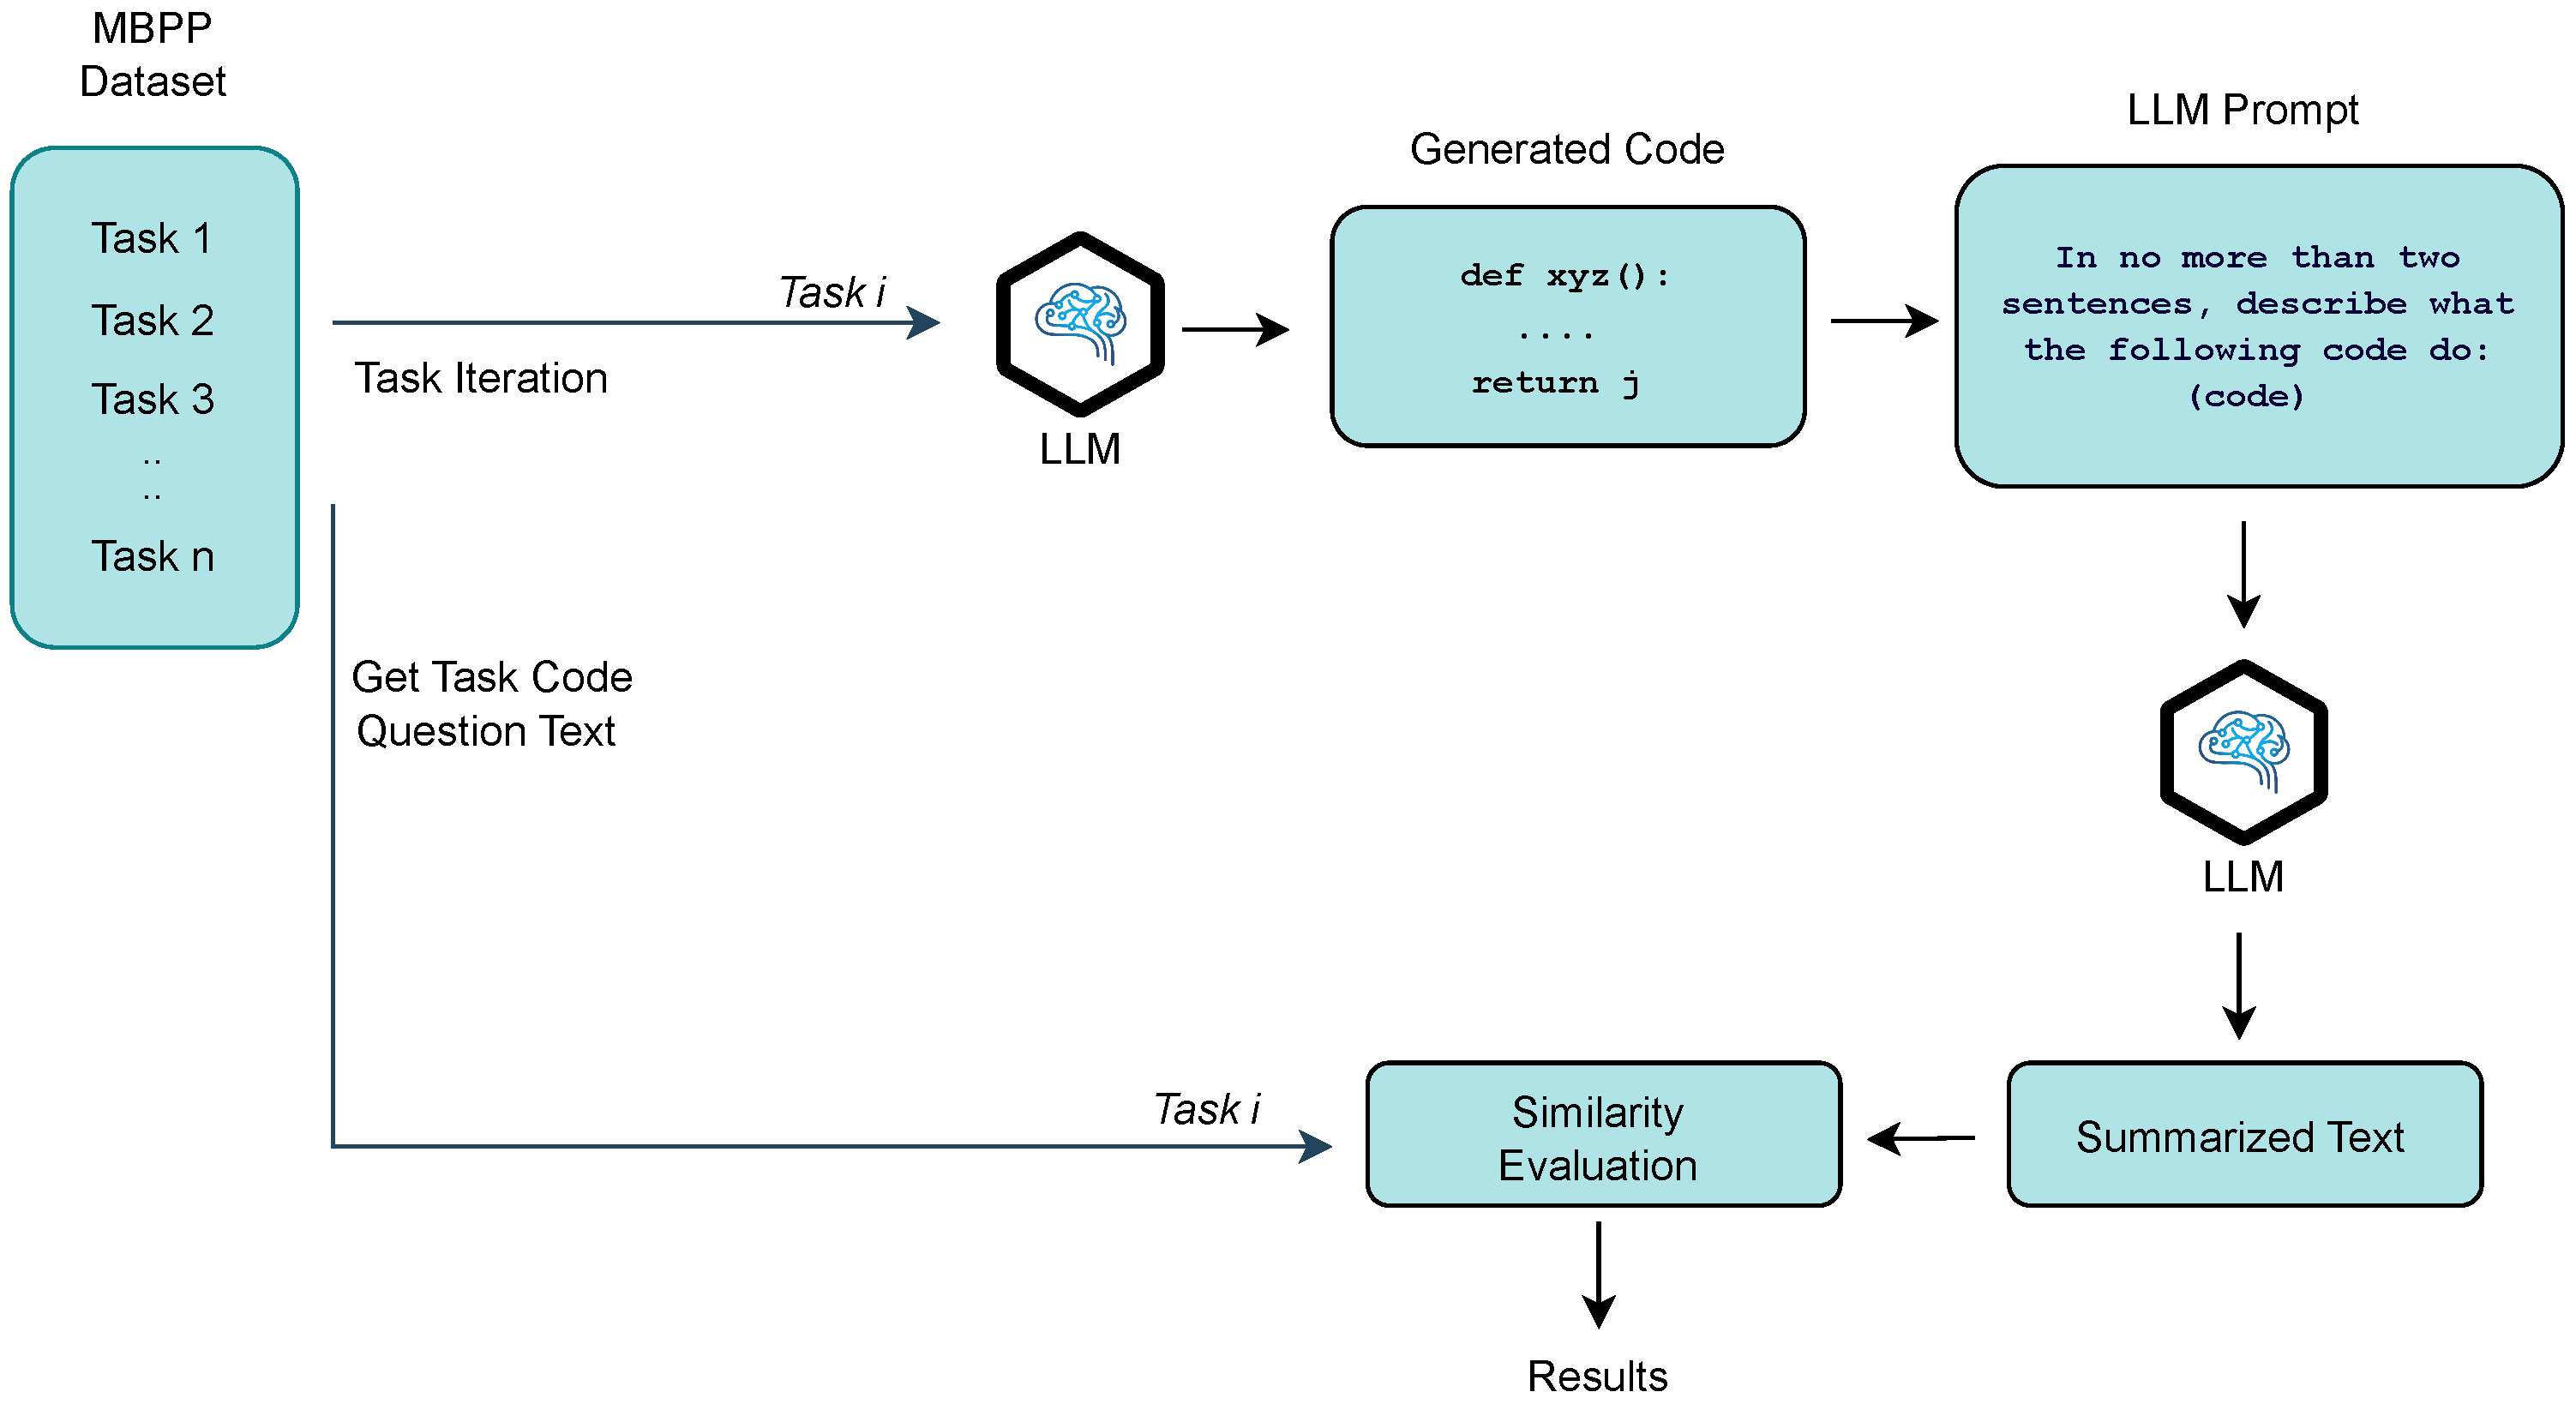
Figure 2 explains the code summarization methodological approach used. First, generated code snippets are collected from the earlier LLM output given. Second, an LLM is asked to explain and summarize the code given through text. Third, different linguistic similarity metrics are applied to compare the generated summary text with the code problem question text as an ideal reference text.
Figure 3 demonstrates the classification problem used. From
Figure 1 and
Figure 2, some of the features are collected from the evaluation results obtained from the code generation and code summarization experiments. Then, a classification problem is conducted on individual features in one case, and in another case, a ranking feature comparison is implemented. Finally, the performance of the classification and ranking methods is evaluated, on which the LLM selection criteria will be based. This study’s implementation and dataset are publicly available on GitHub [
37].
3.3. LLM Models
Four LLMs are selected and evaluated. Each model is used in the two code generation and code summarization experiments. The LLMs are selected based on a set of practical and methodological criteria. First, all models are open-source and publicly available, ensuring transparency and reproducibility. Second, they represent diversity in architectural design, parameter scale, and training objectives, including general-purpose language modeling and code-oriented pretraining. Third, these models are commonly adopted by the software engineering community for code generation and reasoning tasks, making them representative of realistic deployment scenarios. Larger proprietary or highly specialized models are excluded to avoid reproducibility constraints and unfair computational advantages. In addition, their overall size is compatible with the experiment’s limited machine storage resources. Collectively, these four models provide a balanced and sufficient sample for evaluating the effectiveness of machine learning-based classification and ranking techniques for LLM selection.
Table 2 presents a summary of the LLMs used in this study, including their model size and context length.
Mistral is a family of high-performance language models developed by Mistral AI, offering scalable and efficient models like Mistral Medium and Codestral for general reasoning and code generation. Gemma 2, created by Google, is a lightweight open-source model optimized for text generation and reasoning, designed to run efficiently on modest hardware with advanced context handling. Phi-3-mini, from Microsoft, is a compact 3.8B-parameter model focused on reasoning, math, and code, trained on synthetic and filtered data, and capable of handling long contexts with instruction tuning. CodeLlama, developed by Meta, is a code-specialized model based on the Llama 2 architecture, supporting large contexts and multiple programming languages, ideal for tasks like code generation, completion, and debugging.
3.4. Code Generation Approach
Figure 4 shows the process of the code generation experiment. The process starts with providing the dataset JSON as a source file and retrieving the coding question. As shown in
Figure 4, the method name is retrieved from the reference code solution obtained from the dataset. This method name is used as part of the prompt question in order to have a similar code output generated to the reference solution obtained, and to avoid large deviations in the code quality evaluation results. By selecting a specific LLM, a prompt question is given to the LLM to retrieve the coding solution. Then, the code solution is assessed using the retrieved test cases from the same dataset task.
The number of passed, failed, and error test cases is stored for each task. If the code obtained from an LLM cannot be executed, it is discarded and is not considered in the overall result calculation. A failed code execution might mean that the LLM misunderstood the task, that unwanted text was provided by the LLM, or that the code generated has a syntax error that makes the code non-executable. Not to be confused with a failed test case, a failed test case is considered in the evaluation calculation since it means the code is executable, but it does not cover all the test cases provided.
The error-free code solution is further evaluated using code quality measures based on syntax, semantics, lexical, and logical properties.
Code snippet Listing 1 shows an example of the prompt question used, where the generated code is obtained for each given coding task. The prompt question asks the LLM to only output the solution code. The output code is examined again and cleaned by removing any unwanted descriptions, backticks, indentation, and grave accents that the LLM might produce along with the code, which could affect the code evaluation calculation.
| Listing 1. LLM Code Generation Template Prompt Question used in Python Programming
Language. |
 |
All experiments were conducted under controlled context-length constraints to ensure fair comparison across models. The MBPP dataset samples fall within the supported context windows of the evaluated LLMs, and prompt truncation was not required. In scenarios involving longer contexts, commonly used strategies, including truncation, sliding-window segmentation, and chunk-based prompting, were not used in this experiment.
3.5. Code Generation Evaluation Metrics
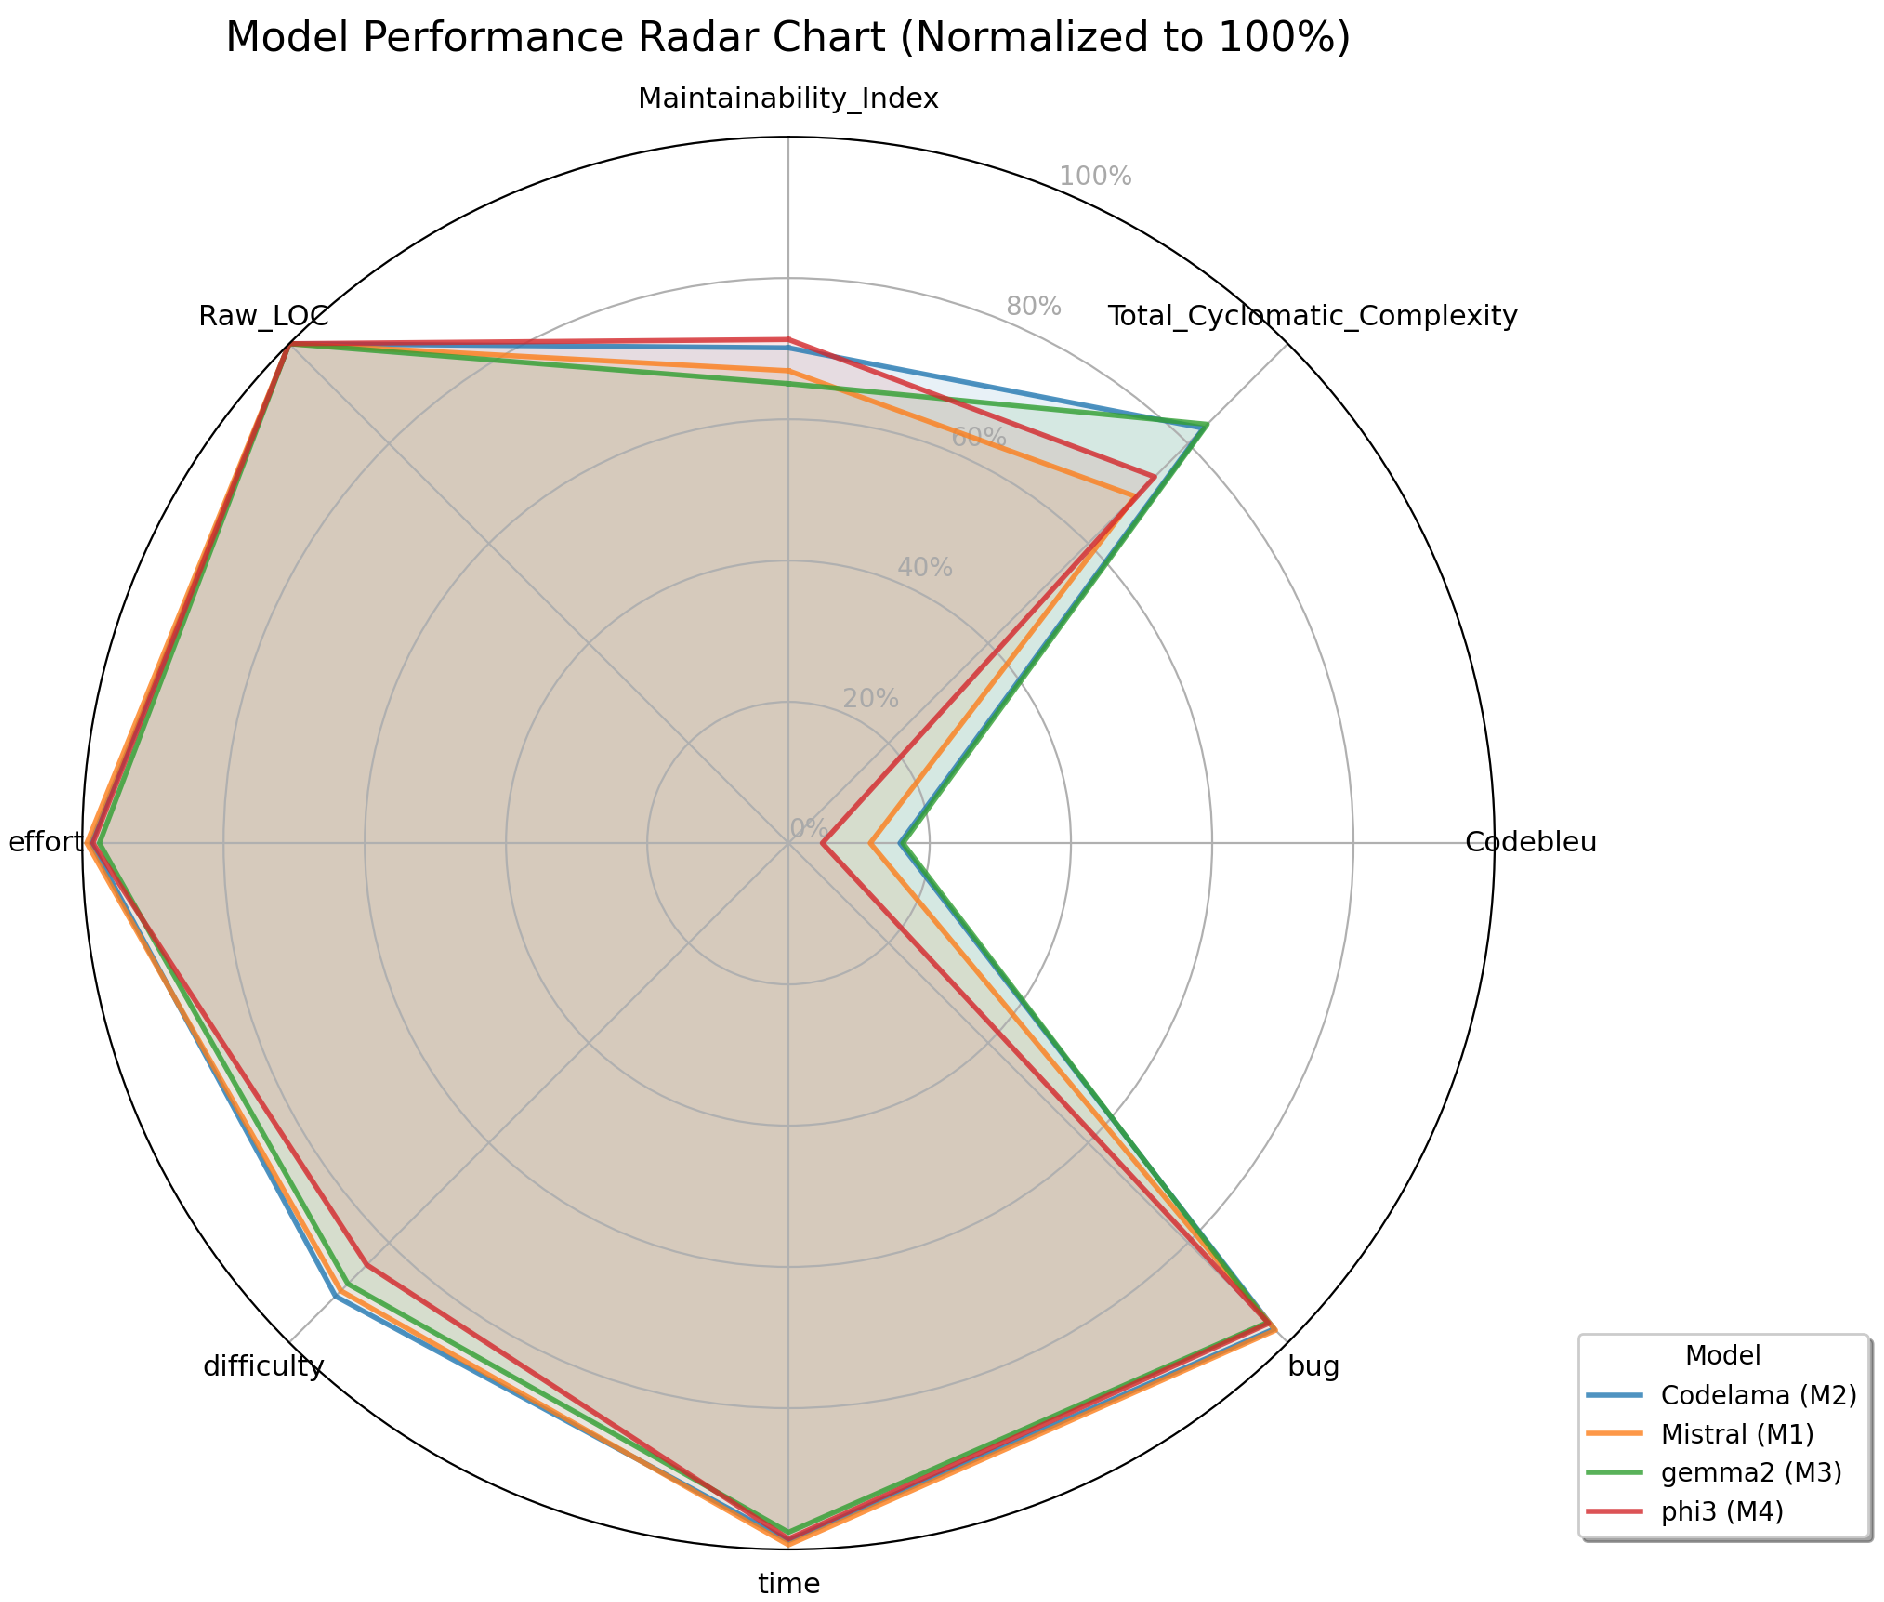
The task code generated from the LLM is obtained and evaluated. Halstead complexity, Maintainability Index, raw metrics, and cyclomatic complexity are used to evaluate the code structure, complexity, and maintainability of the generated code.
Table 3 shows an overview of the Halstead metrics used [
42] as features to be evaluated for the LLM code generated, including their purpose and formulas.
In order to calculate the quality of the generated code against the solution reference code given in the dataset, a simplified version of the CodeBLEU metric is used, which is tailored for evaluating lexical code similarity. The method splits the code into tokens and measures the overlap of token sequences using N-gram precision, where the method uses equal weights for each n-gram level. Furthermore, the method uses the geometric mean to combine precision scores stably, applying a brevity penalty in case of a short candidate code compared to the reference. Formulas (
1)–(
3) show N-gram precision, geometric mean, and brevity penalty formulas, respectively. Formula (
4) shows the final BLEU-like score retrieved between the generated code and the solution reference code.
where
If any
= 0, then
GM = 0
where
A simplified version of CodeBLEU was employed in this study to reduce computational overhead and dependency complexity while maintaining consistency across models. Since the objective of the summarization experiment is comparative ranking rather than absolute functional correctness, the simplified metric provides sufficient discriminatory power.
Besides calculating passed, failed, and error test cases, the
Pass@1 metric is used to evaluate the accuracy of the generated code and its correctness. Formulas (
5) and (
6) show the
Pass@1 and
Pass@k calculations.
where
n = total number of generated samples per problem
c = number of correct samples (i.e, samples that pass all tests)
k = number of samples evaluated (e.g., top-k)
= binomial coefficient (“a choose b”)
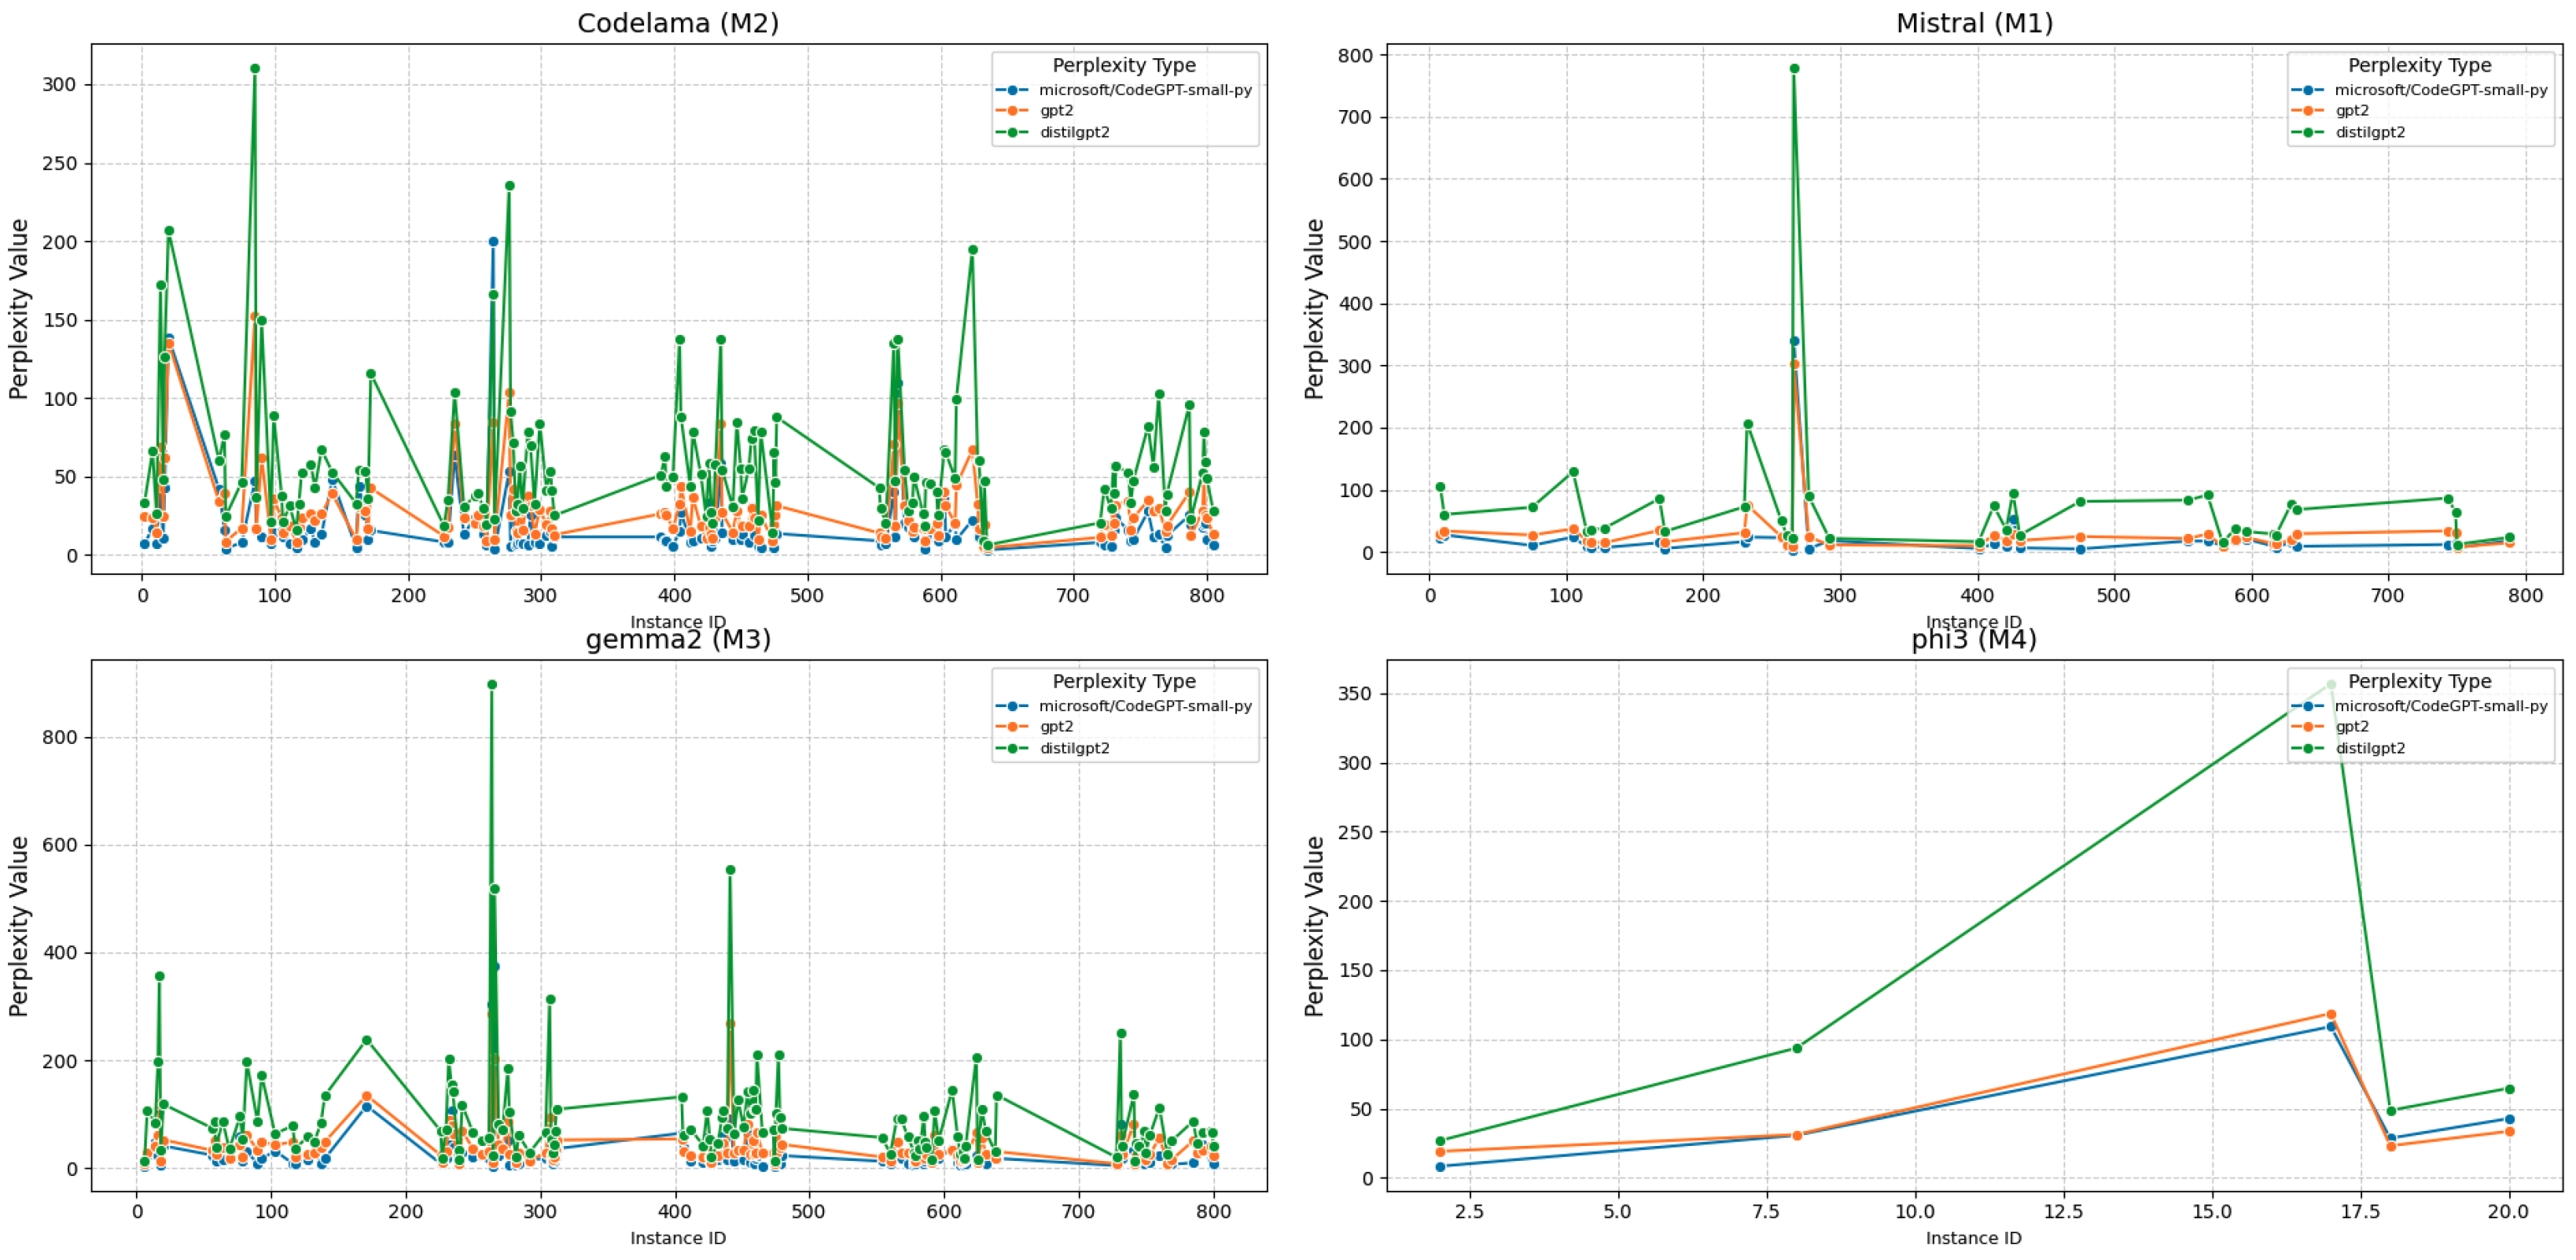
To evaluate the LLM’s prediction confidence, the perplexity measure is used on the generated code. Perplexity is a measure of how well a language model predicts a sample. Lower perplexity means that the model is more confident in its predictions.
Given a sequence of tokens
, the mathematical definition of perplexity is shown in Formula (
7), where
is the probability of token
given the previous tokens.
Formula (
8) shows the loss returned by a given language model, which is typically the average negative log-likelihood (NLL).
The code generated for each task from each model in
Table 2 is tokenized and evaluated using three other LLMs.
Table 4 shows a summary of the LLM perplexity evaluators used in the study. The evaluator models used are of the TensorFlow-native type [
43].
CodeGPT-small-py is a lightweight GPT-Neo-based model developed by Microsoft, specifically fine-tuned for Python code generation and completion. It was trained on a large, cleaned dataset of Python files from GitHub and is designed to be efficient and comparable in performance to models like Codex for similar model sizes. GPT-2, created by OpenAI, is a general-purpose language model trained on a massive corpus of English text using a causal language modeling objective. It predicts the next word in a sequence and is widely used for text generation, with 124 M parameters in its smallest version. DistilGPT2 is a compressed version of GPT-2 developed by Hugging Face using knowledge distillation. It has 82 M parameters and retains much of GPT-2’s performance while being faster and more resource-efficient, making it suitable for lightweight applications in text generation.
The study used fixed variables of WINDOW_SIZE with a default value of 512 and STEP_SIZE with a default value of 256. WINDOW_SIZE is the maximum number of tokens the model can handle at once, whereas STEP_SIZE is how many tokens to slide the window by for each new chunk. If the code is shorter than the WINDOW_SIZE, the study calculates perplexity for the whole code. The study averages the perplexity values from these three models and considers the result a single feature.
3.6. Code Summarization Approach
Figure 5 shows the code summarization process. The task code generated from the LLM is obtained, and for each task, one LLM is selected and asked to summarize a code snippet to be compared with the prompt question string given in the dataset. As shown in
Figure 5, the summarization generated from the LLM will be used as-is for the comparison with the reference coding question obtained from the dataset and will be evaluated using textual summarization similarity metrics.
Text similarity methodology involves comparing a candidate text (e.g., a generated summary) to a reference text (e.g., the ground truth dataset question) to evaluate how close they are in meaning, structure, or wording.
Code snippet Listing 2 shows an example of the prompt question used to ask an LLM for the code summarization for a given task code.
| Listing 2. LLM Code Summarization Template Prompt Question used in Python Programming
Language. |
 |
3.7. Code Summarization Evaluation Metrics
Consideration of word-level, phrase-level, and semantic similarity, sentence structure, and fluency is needed for proper summarization evaluation. ROUGE metrics were selected to measure lexical overlap between generated summaries and reference descriptions, providing a baseline assessment of content coverage. BERTScore was included to capture semantic similarity using contextual embeddings, enabling evaluation beyond surface-level matching. While ROUGE is sensitive to exact phrasing, it may underestimate semantically equivalent summaries. Conversely, BERTScore better captures semantic alignment but may overlook factual inaccuracies. Combining both metrics provides a more balanced evaluation of code summarization quality.
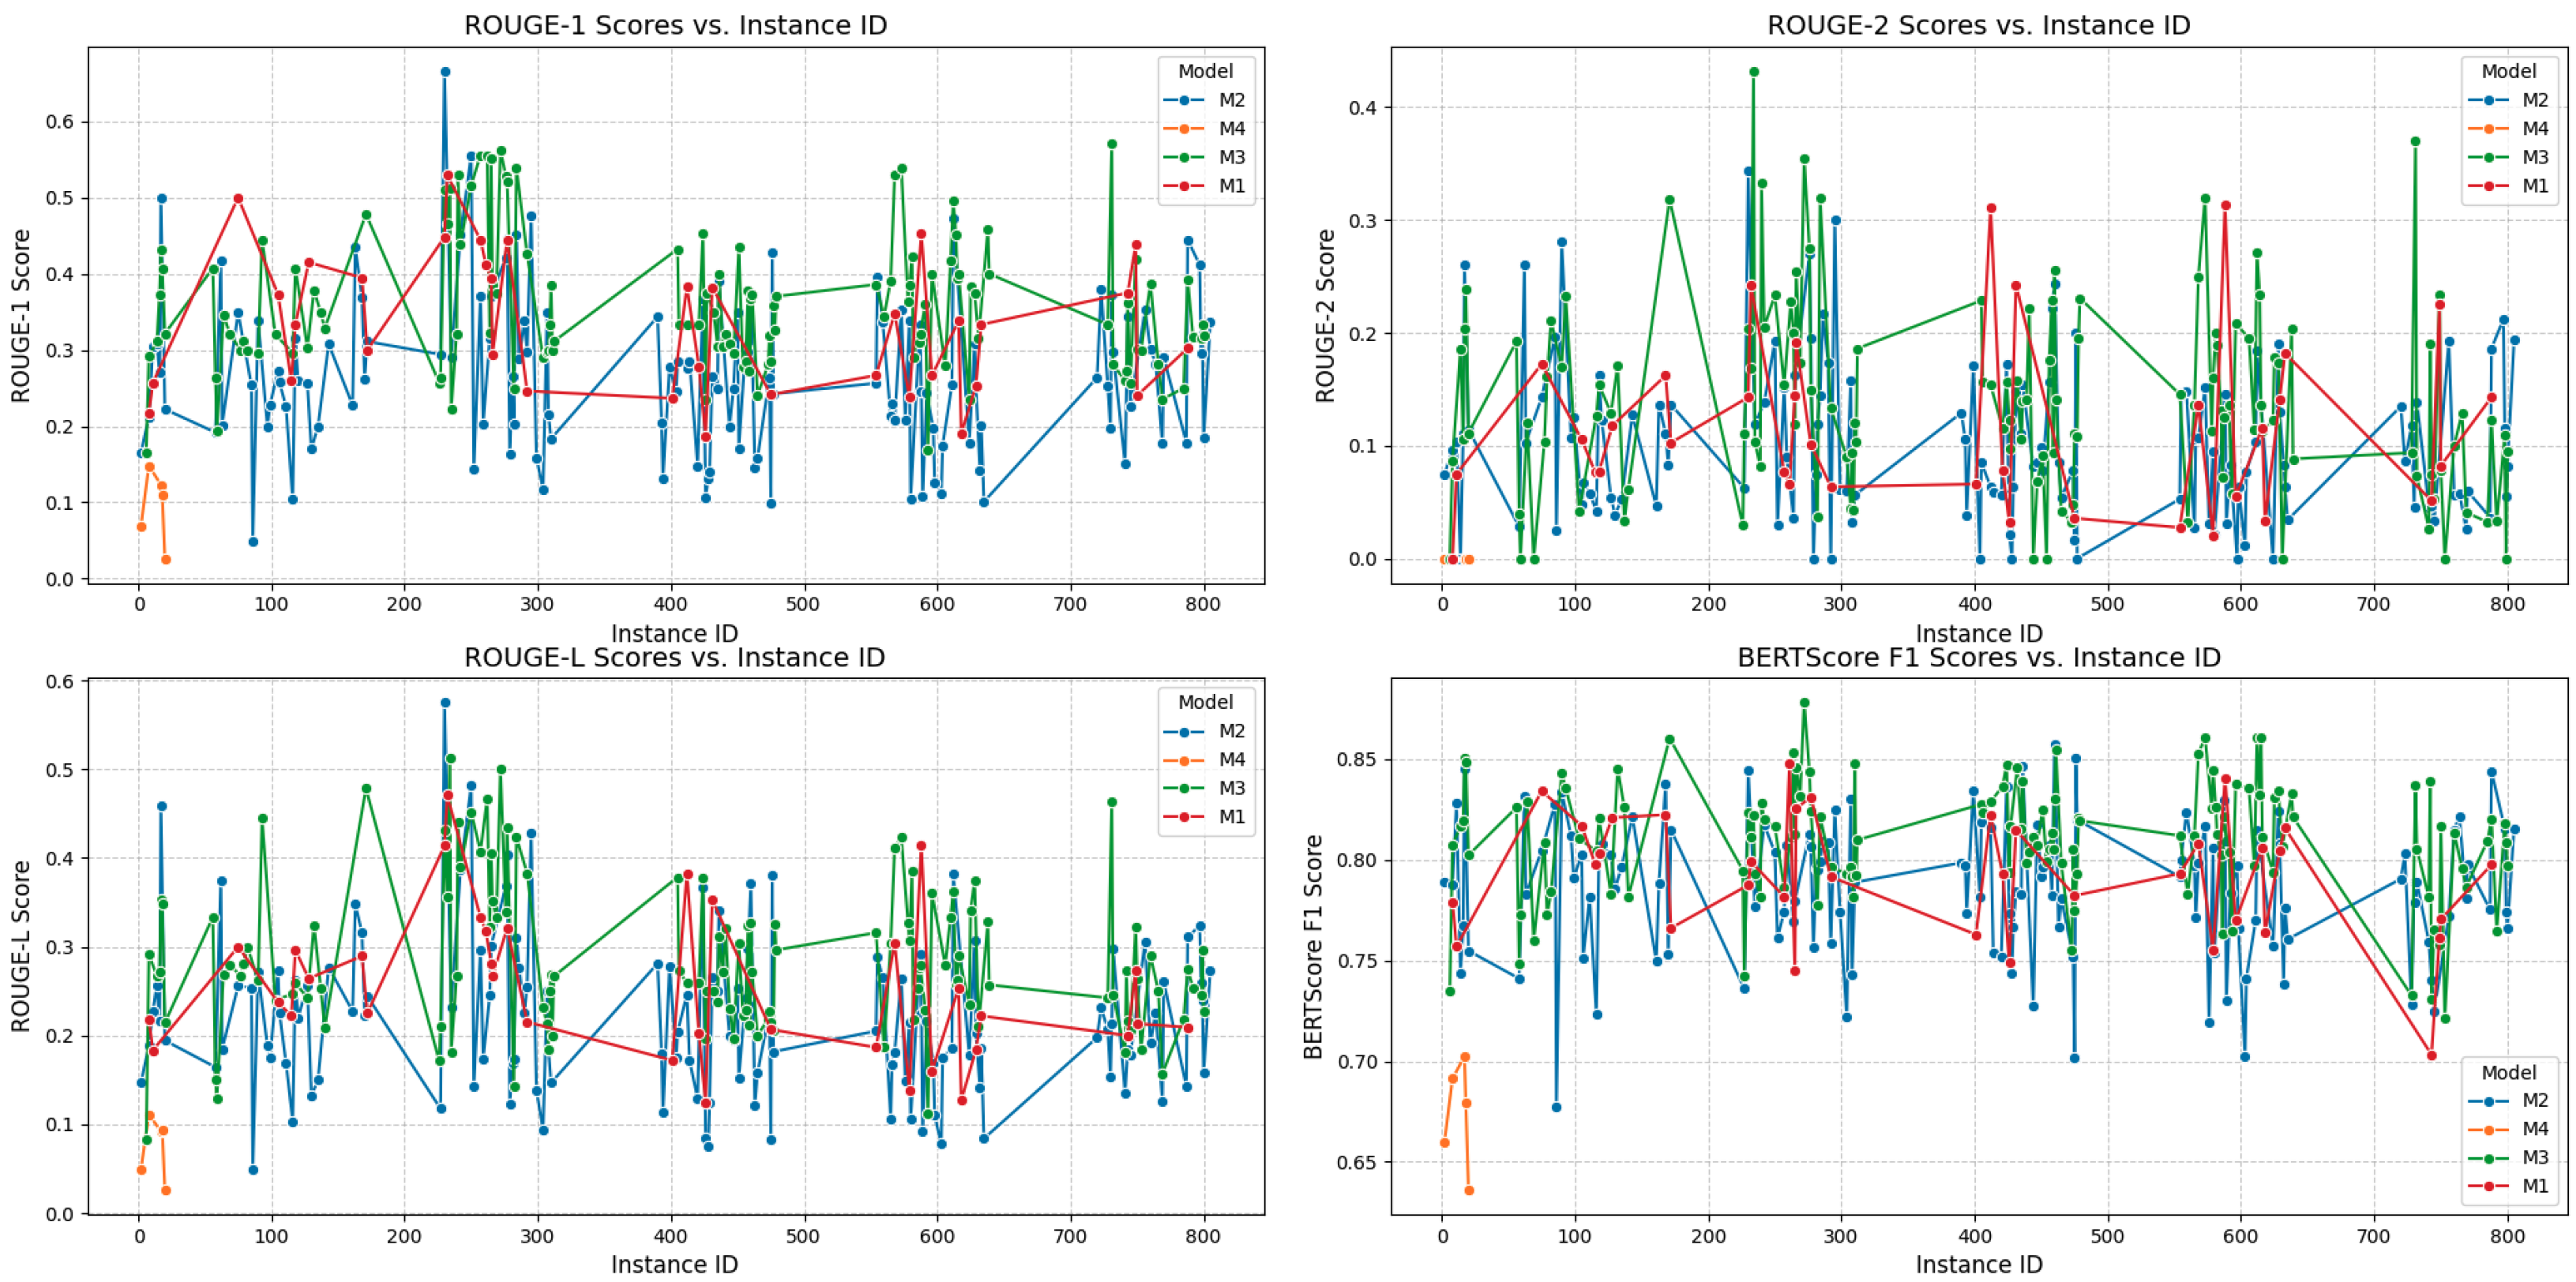
This study calculates similarity between the code text summary generated by an LLM and the code problem question reference from the dataset using ROUGE-1, ROUGE-2, ROUGE-L, and BERT Score metrics.
Table 5 shows the rationale for selecting these metrics. The table lists the focus for each metric and its corresponding evaluation type. Formulas (
9)–(
20) show their corresponding mathematical definitions.
Given
R is the set of unigrams in the reference text and
C is the set of unigrams in the candidate text, Formulas (
9)–(
11) show the ROUGE-1 mathematical representation for recall, precision, and F1 score, respectively.
Given that
is the set of bigrams in the reference text and
is the set of bigrams in the candidate text, Formulas (
12)–(
14) show the ROUGE-2 mathematical representation for recall, precision, and F1 score, respectively.
ROUGE-L is based on the Longest Common Subsequence (LCS) between the candidate and reference. Let
be the length of the longest common subsequence,
be the length of the reference, and
be the length of the candidate. Formulas (
15)–(
17) show the ROUGE-L mathematical representation for recall, precision, and F1 score, respectively.
BERTScore uses contextual embeddings from BERT to compare semantic similarity between tokens, capturing semantic similarity even when the wording differs.
Let
be the tokens in the candidate text and
be the tokens in the reference text. Let
and
be the BERT embeddings of tokens
and
, respectively. Formulas (
18)–(
20) show the BERTScore mathematical representation for recall (
R), precision (
P), and (
F1) score, respectively.
This evaluation will only take into consideration the F1 score, as it is sufficient to evaluate the summarization text similarities since it balances both precision and recall values.
3.8. Model Classification Selection and Implementation
This section includes detailed implementation details of the LLM classification and ranking methodology used in our study. The following subsection’s goal is to provide clarity and transparency on the approach used.
3.9. Feature Engineering
We extract 24 features from the code generation and code summarization experiments. All of these features are numerical. The features for the code generation experiment are taken from
Table 3, with perplexity and CodeBLEU values added. The features consist of different scaling values, so the features are adjusted using min-max normalization to a fixed range from 0 to 1. The min-max scaling formula is shown in Formula (
21).
The features for the code summarization experiment are the ROUGE-1, ROUGE-2, ROUGE-L, and BERTScore F1 similarity scores calculated for each model, respectively.
3.10. Feature Selection
The selection of the features considers only the code-generation tasks that give a Pass@1 score of 1 across all selected models, for the same tasks processed by each model; this indicates that only LLM outputs that passed all coding-task test cases without any failures or error occurrences are considered. Other features from the task results with any failed or error test cases in any model are discarded during feature selection among all models to avoid model bias in the final LLM selection results.
3.11. Model Selection and Configuration
Support vector machine (SVM) classification was selected for the code generation experiment. The rationale for the selection is due to its effectiveness in classification tasks and in handling high-dimensional feature spaces and limited sample sizes, which align with the characteristics of the extracted software metrics. SVMs are also well-suited for maximizing class separation when feature distributions overlap.
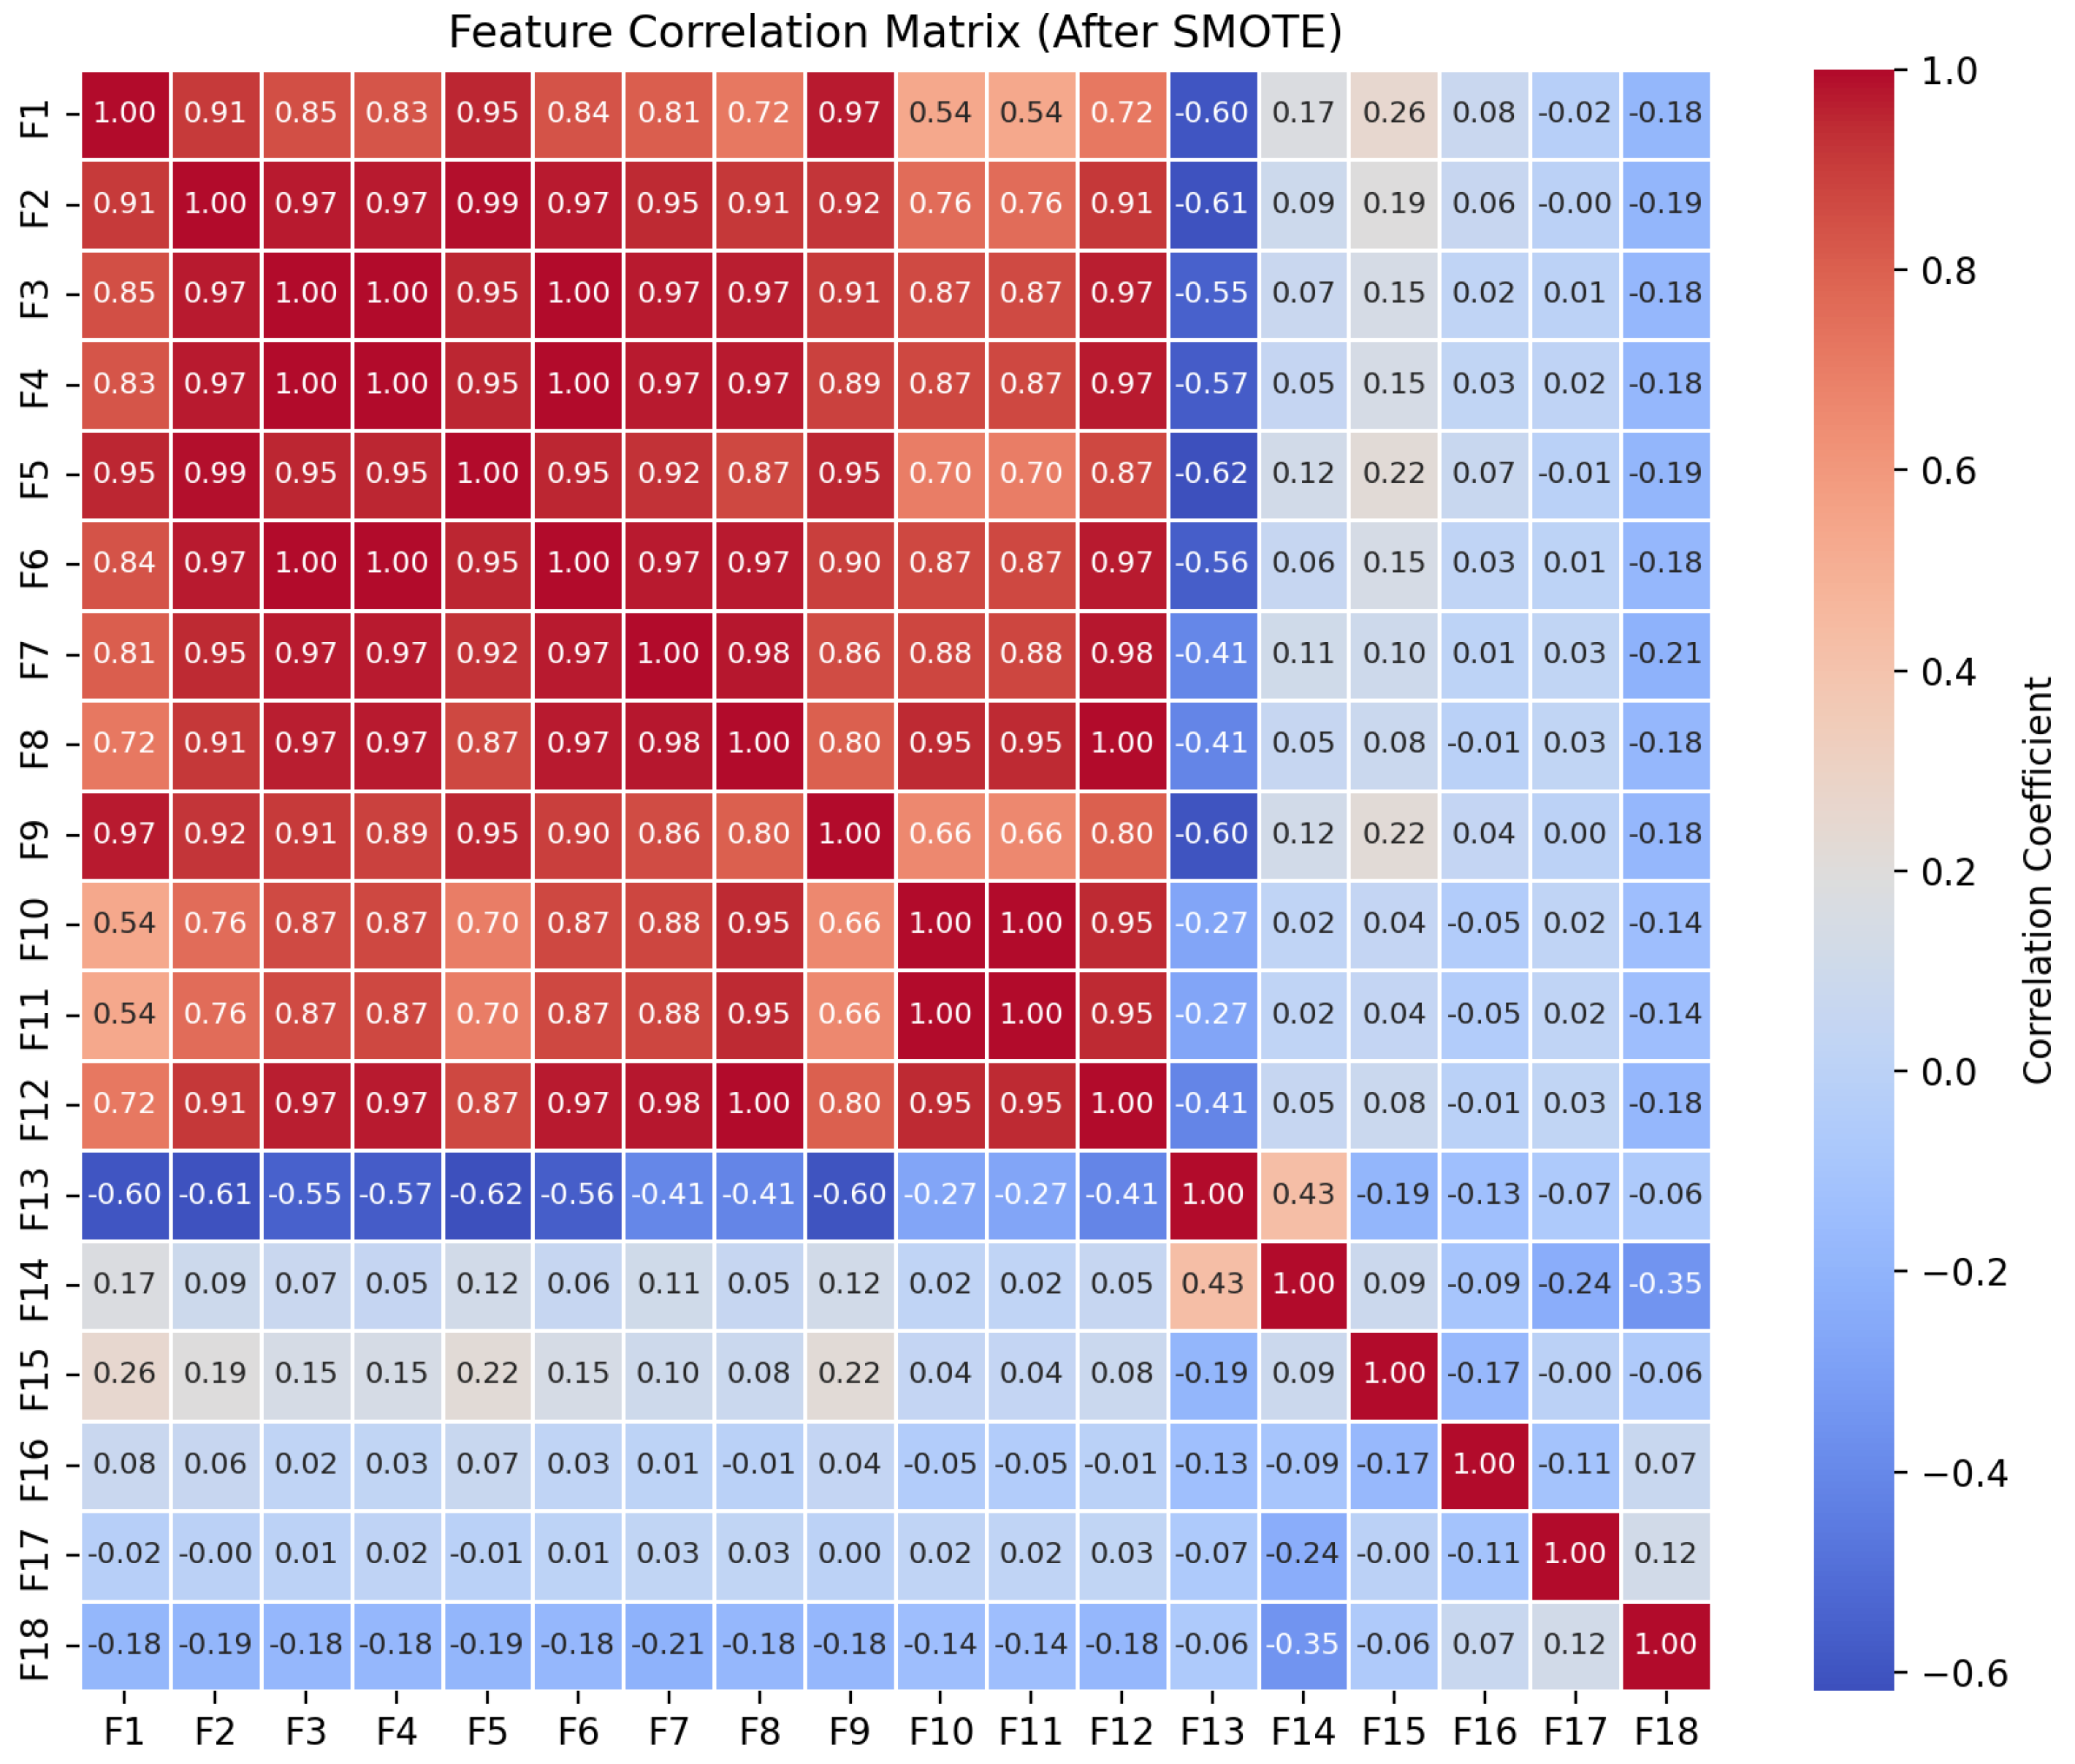
The SVM methodology used an approach to transform a one-dimensional, continuous dataset into a multi-class classification problem, where the primary focus was on data preparation and exploratory correlation analysis for a machine learning task, specifically a multi-class classification problem involving four different models (M1, M2, M3, M4). The logic first aggregates the individual feature vectors into combined feature matrices and creates corresponding class labels. Crucially, recognizing an inherent class imbalance in the dataset, it then employs the synthetic minority over-sampling technique (SMOTE) to artificially balance the class distribution. Finally, it calculates and visualizes the Pearson correlation matrix for the resampled features to identify and report the top 10 most strongly correlated, and thus potentially redundant, feature pairs.
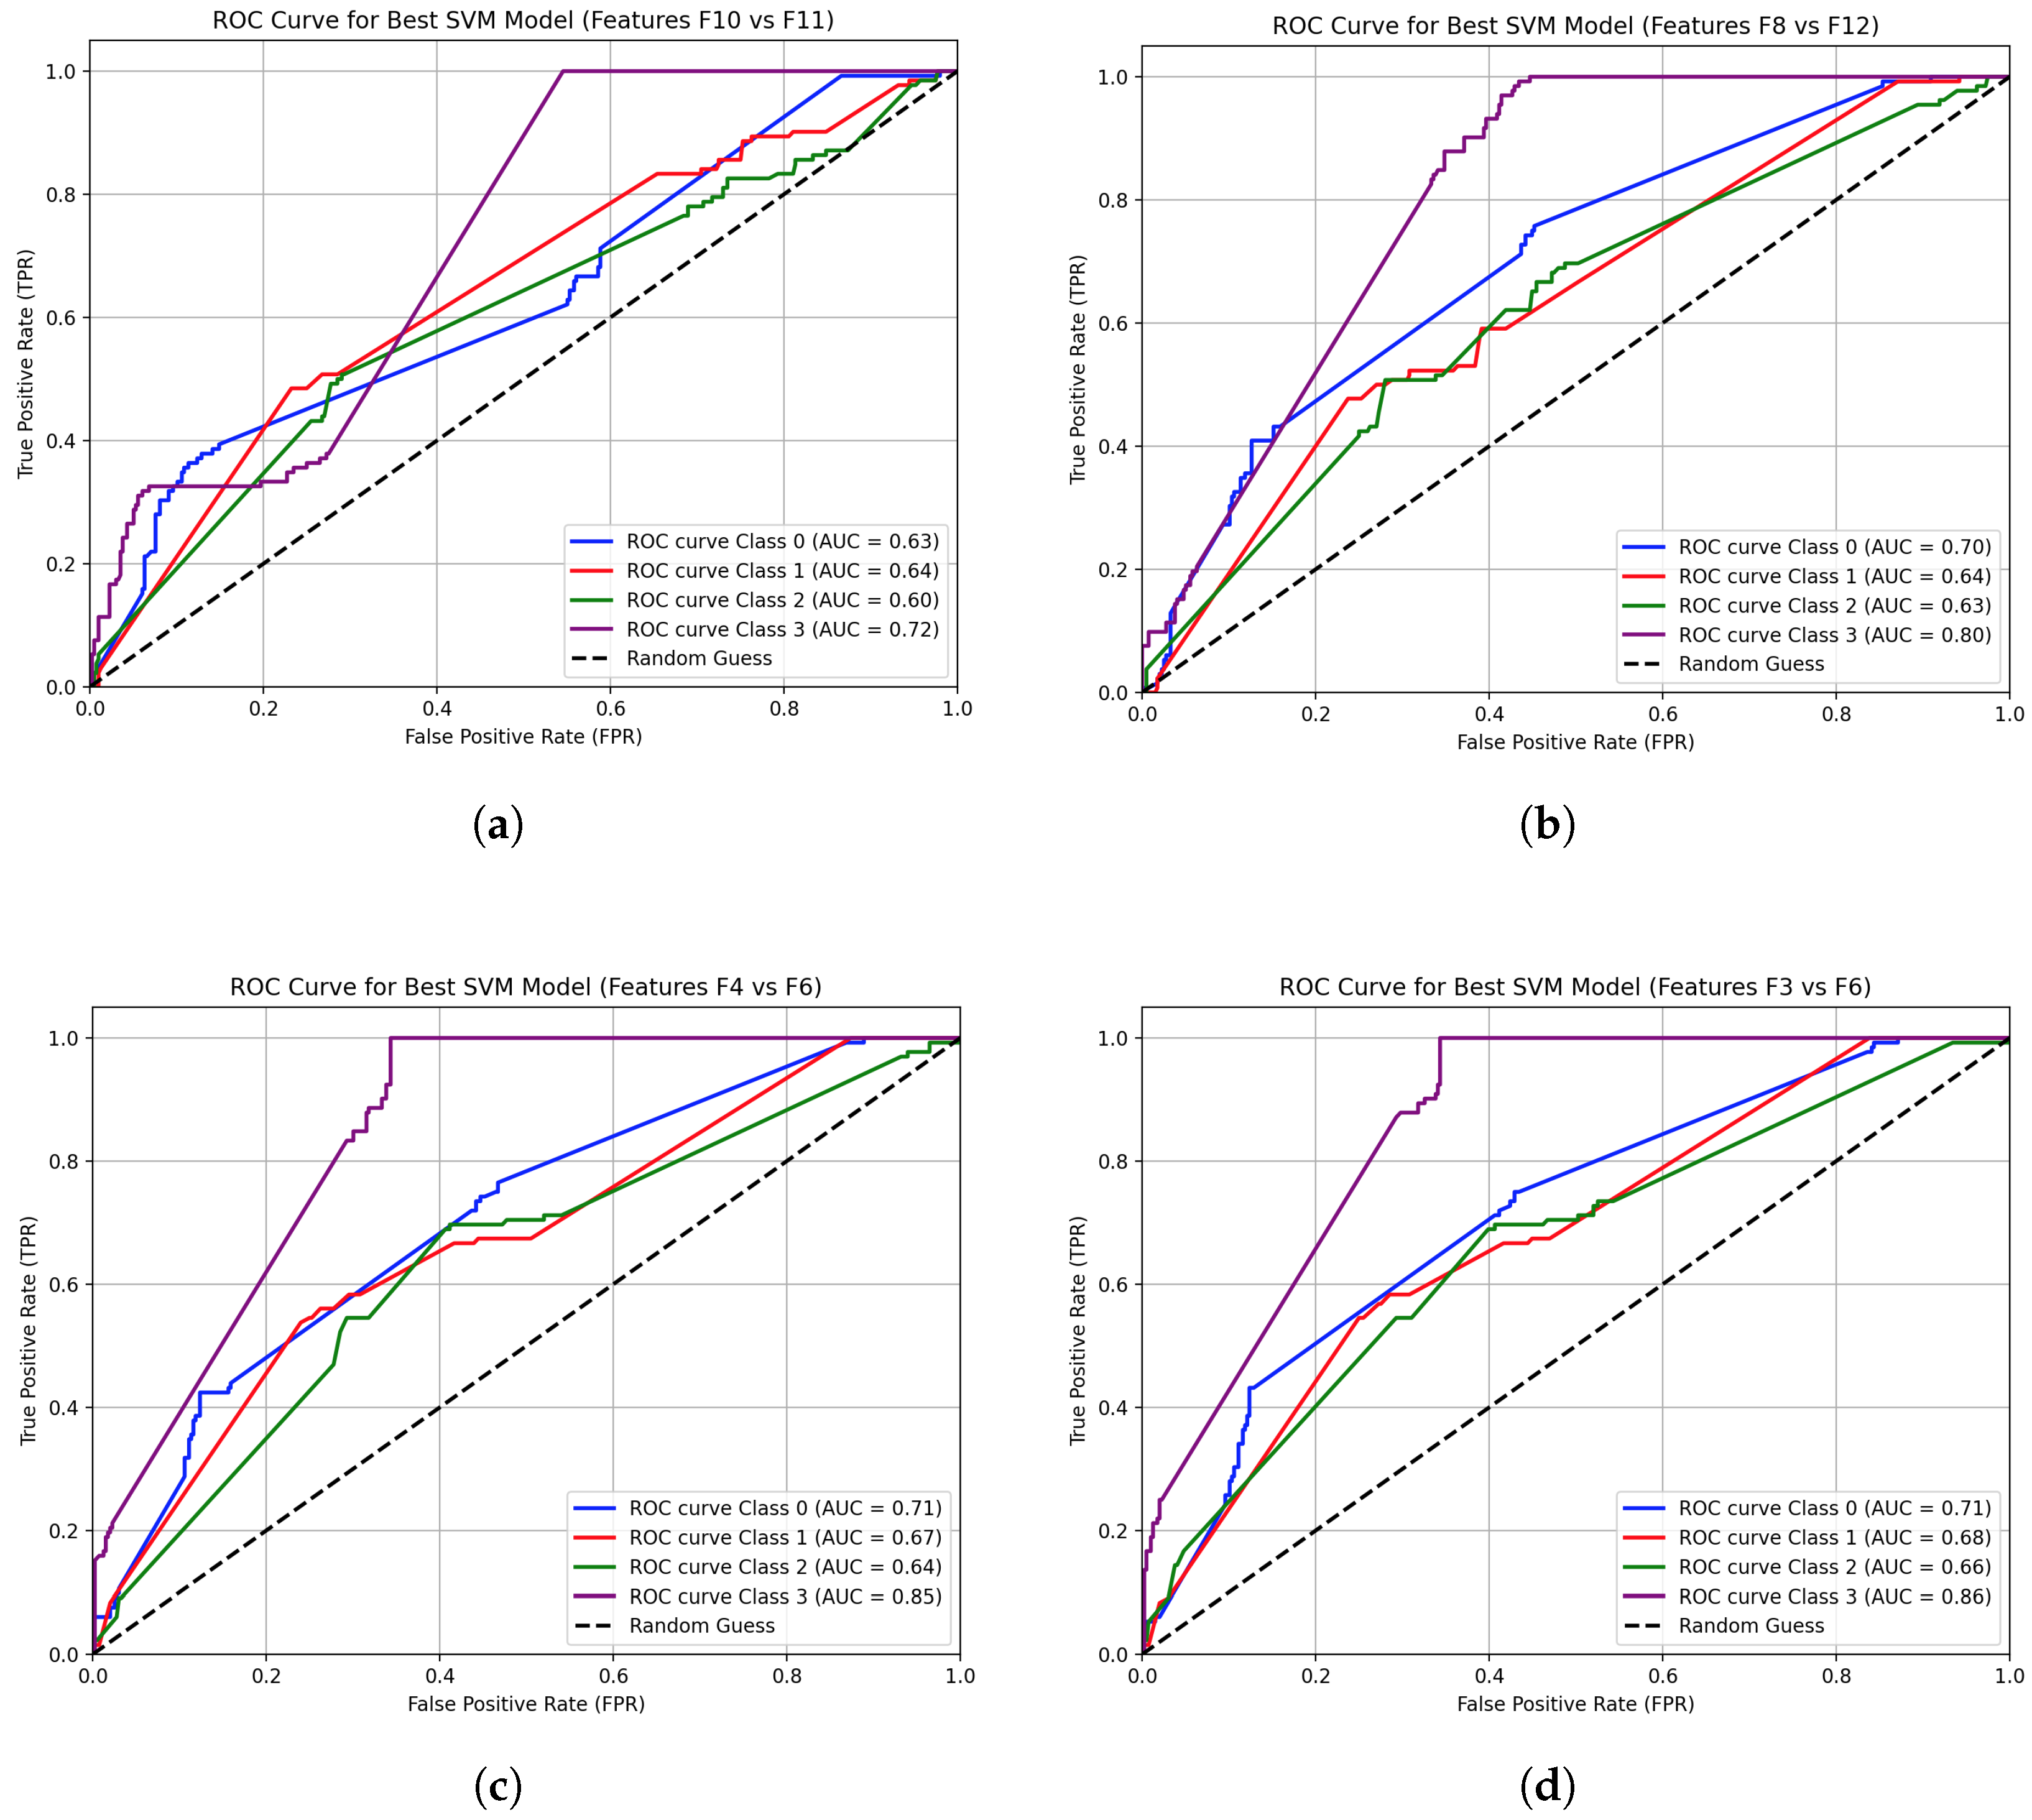
A critical configuration setting in the SVM process is the probability configuration. This parameter is enabled to allow the model to not only predict the class but also output a probability estimate for each class. This is an essential step, as these probabilities are later used to calculate metrics like the area under the curve (AUC) and to generate the ROC plots, providing deeper insight into the model’s performance beyond simple accuracy.
As the models used in the experiment could give different solutions with errors, and as this experiment considered only passed test cases, it is expected to have a different count of sample solutions provided by each model. In order to obtain accurate results for the classification problem, SMOTE was used to create synthetic samples and therefore create equal sample counts to reduce classification bias in the results.
While non-SMOTE approaches could provide better precision and calibration, given the data samples retrieved from LLMs in
Table 6, which show class imbalance in the dataset, the model may not have enough data to learn the underlying pattern of the minority class, leading to a high probability of bias in class predictions.
Since this experiment used four models for the classification problem with the use of SMOTE, the selection of the features is made using pairs of two features that give a strong correlation score and represent the most redundant information in the dataset.
RankNet is employed to rank the models’ scores for the code summarization experiment. RankNet was chosen for the ranking task because it is a well-established learning-to-rank algorithm capable of modeling pairwise preferences, making it suitable for comparative evaluation of LLM-generated summaries, and providing a robust and interpretable machine learning framework for LLM evaluation.
Given the accuracy features collected for each code summarization task, the total average per-metric score is calculated for the training part of the data and considered as the base score. The testing data are evaluated on a pairwise basis, where for every possible pairing of models, the code calculates the difference in their metric scores. This difference vector then serves as the input features for the neural network.
The process moves to evaluating and ranking the models. The trained model is employed to generate a matrix of win probabilities, which shows the likelihood of each model outperforming every other model. This is achieved by feeding the difference vectors of all possible pairs into the model and averaging the predicted win probabilities. The final step is to derive a single, consolidated ranking and show the matrix of pairwise model comparison alongside the final model ranking.
The RankNet model is configured as a multi-layer perceptron classifier. This model is specifically designed to tackle the ranking problem by reframing it as a classification task. It is trained on a dataset of pairwise comparisons where the input features are the differences between two models’ performance metrics on a specific task. The model then learns to predict a binary output: a 1 if the first model in the pair is better, and a 0 if the second model is better. This allows the neural network to effectively learn the subtle relationships and relative superiority of models based on their comparative scores without needing to know the absolute performance values.
3.12. Hyperparameter Settings
To optimize performance for SVM classification, this study used grid search on three main hyperparameters, which are as follows: C, gamma, and kernel. The best parameters are selected based on the accuracy score and through 5-fold cross-validation on the training set. The estimator selects the best hyperparameter values within a predefined range and is ultimately used as the final classifier.
This RankNet method systematically searches through a predefined set of hyperparameters, including the network’s architecture, hidden layer sizes, the activation function (ReLU or tanh), and the L2 regularization strength (alpha). By testing all combinations of these parameters, the grid search identifies the best-performing model based on cross-validation, ensuring that the final RankNet model is well-tuned for the given task data.
3.13. Evaluation Techniques
The classification model was assessed using evaluation metrics listed in
Table 7, where true positive (
TP), false positive (
FP), true negative (
TN), and false negative (
FN) notations are represented within these formulas. Additionally,
Table 7 shows the AUC, MCC, and Kappa metrics that were used to evaluate results per class, along with macro-average values for AUC, precision, and recall. This study further shows the highest prediction distribution percentages among all classes.
The ranking problem is evaluated by showing a comparison matrix between all pairs of models by calculating feature difference values. A final model ranking win score is demonstrated across the selected models.
3.14. Model Training and Validation
The SVM model training process begins after the initial dataset is partitioned. An 80% training split is performed, and then a 20% testing split is used to ensure the final model is evaluated on completely unseen data. A critical first step is to convert the continuous, one-dimensional feature data from the 80% training set into a labeled, multi-class format. A 10-fold cross-validation iteration is performed on the training data. A new support vector classifier model is then instantiated and trained on 90% of the current fold’s data, and the trained model is then used to predict the labels for the remaining 10% of the fold’s data, which serves as the validation set.
The RankNet allocates 70% of the pairwise dataset for training and the remaining 30% for testing on unseen data. The average scores per metric are considered as the base score and are calculated for the training part of the data for all the models. The testing is conducted on individual summarization tasks, using unique instances with their corresponding similarity metric scores. Validation is an integral part of the training process and is handled automatically by using grid search. The methodology uses grid search with a 3-fold cross-validation for faster computational efficiency, considering the size of the dataset, making it the best choice for the validation process. During this process, the training set is partitioned into three subsets. The model is trained on two of these subsets, and its performance is validated on the remaining one. This cycle is repeated three times, ensuring that each of the three subsets serves as a validation set exactly once. This robust method of validation provides a more reliable estimate of the model’s performance on new data and is crucial for selecting the final, best-performing model from all the combinations tested by the grid search.
5. Discussions
The results obtained from the code generation SVM classification experiment provide a comprehensive overview of predicting LLM classes across pairs of highly correlated features. The classification accuracy reached up to 49.05% among the top 10 pairs of correlated features, with a high AUC score of 86% among the top 4 pairs of correlated features. The high precision (90%) and recall (92%) indicate few false positives or negatives in identifying the predicted model class, and the distribution percentage reaches up to 69.70%.
As some classes have more samples than others, it is important to measure an overall score that reflects the model’s performance across all classes equally. The macro-averaged AUC-ROC results, ranging from 65% to 72%, are a strong indicator of the model’s ability to provide fair classification predictions across all models. Furthermore, another indicator for an imbalanced dataset is the macro-averaged F1 score, as it reflects general performance and not just performance on the majority classes, reaching a maximum of 45.88%. The average accuracy scores could be explained by the model not learning enough about the minority classes due to insufficient training data for those classes. Even with SMOTE generating synthetic samples, some of the LLMs provided few coding solutions from the dataset, which increases the likelihood of incorrect predictions for minority classes, lowering overall accuracy. It is also noted that minority classes often have low recall and low precision, which eventually affects the overall F1 scores for those classes.
To validate the effectiveness of the proposed SVM framework, a baseline comparison was conducted using a simple selection strategy based solely on pass@1 accuracy. From
Table 6, the pass@1 score ratio of error-free solutions indicates selection of Phi-3 with 60%, Mistral with 55%, Gemma 2 with 47%, and CodeLlama with 40%. In contrast, based on the SVM experiment with the highest correlated feature pair, the model selection prediction class order is 69.70% for CodeLlama, 18.94% for Mistral, 9.47% for Phi-3, and 1.89% for Gemma 2.
The experimental results indicate that the proposed approach’s prediction percentage variance across the models outperforms the pass@1 baseline in terms of class prediction identification percentage. This confirms that machine learning-based feature analysis provides more reliable LLM selection than heuristic or single-metric approaches.
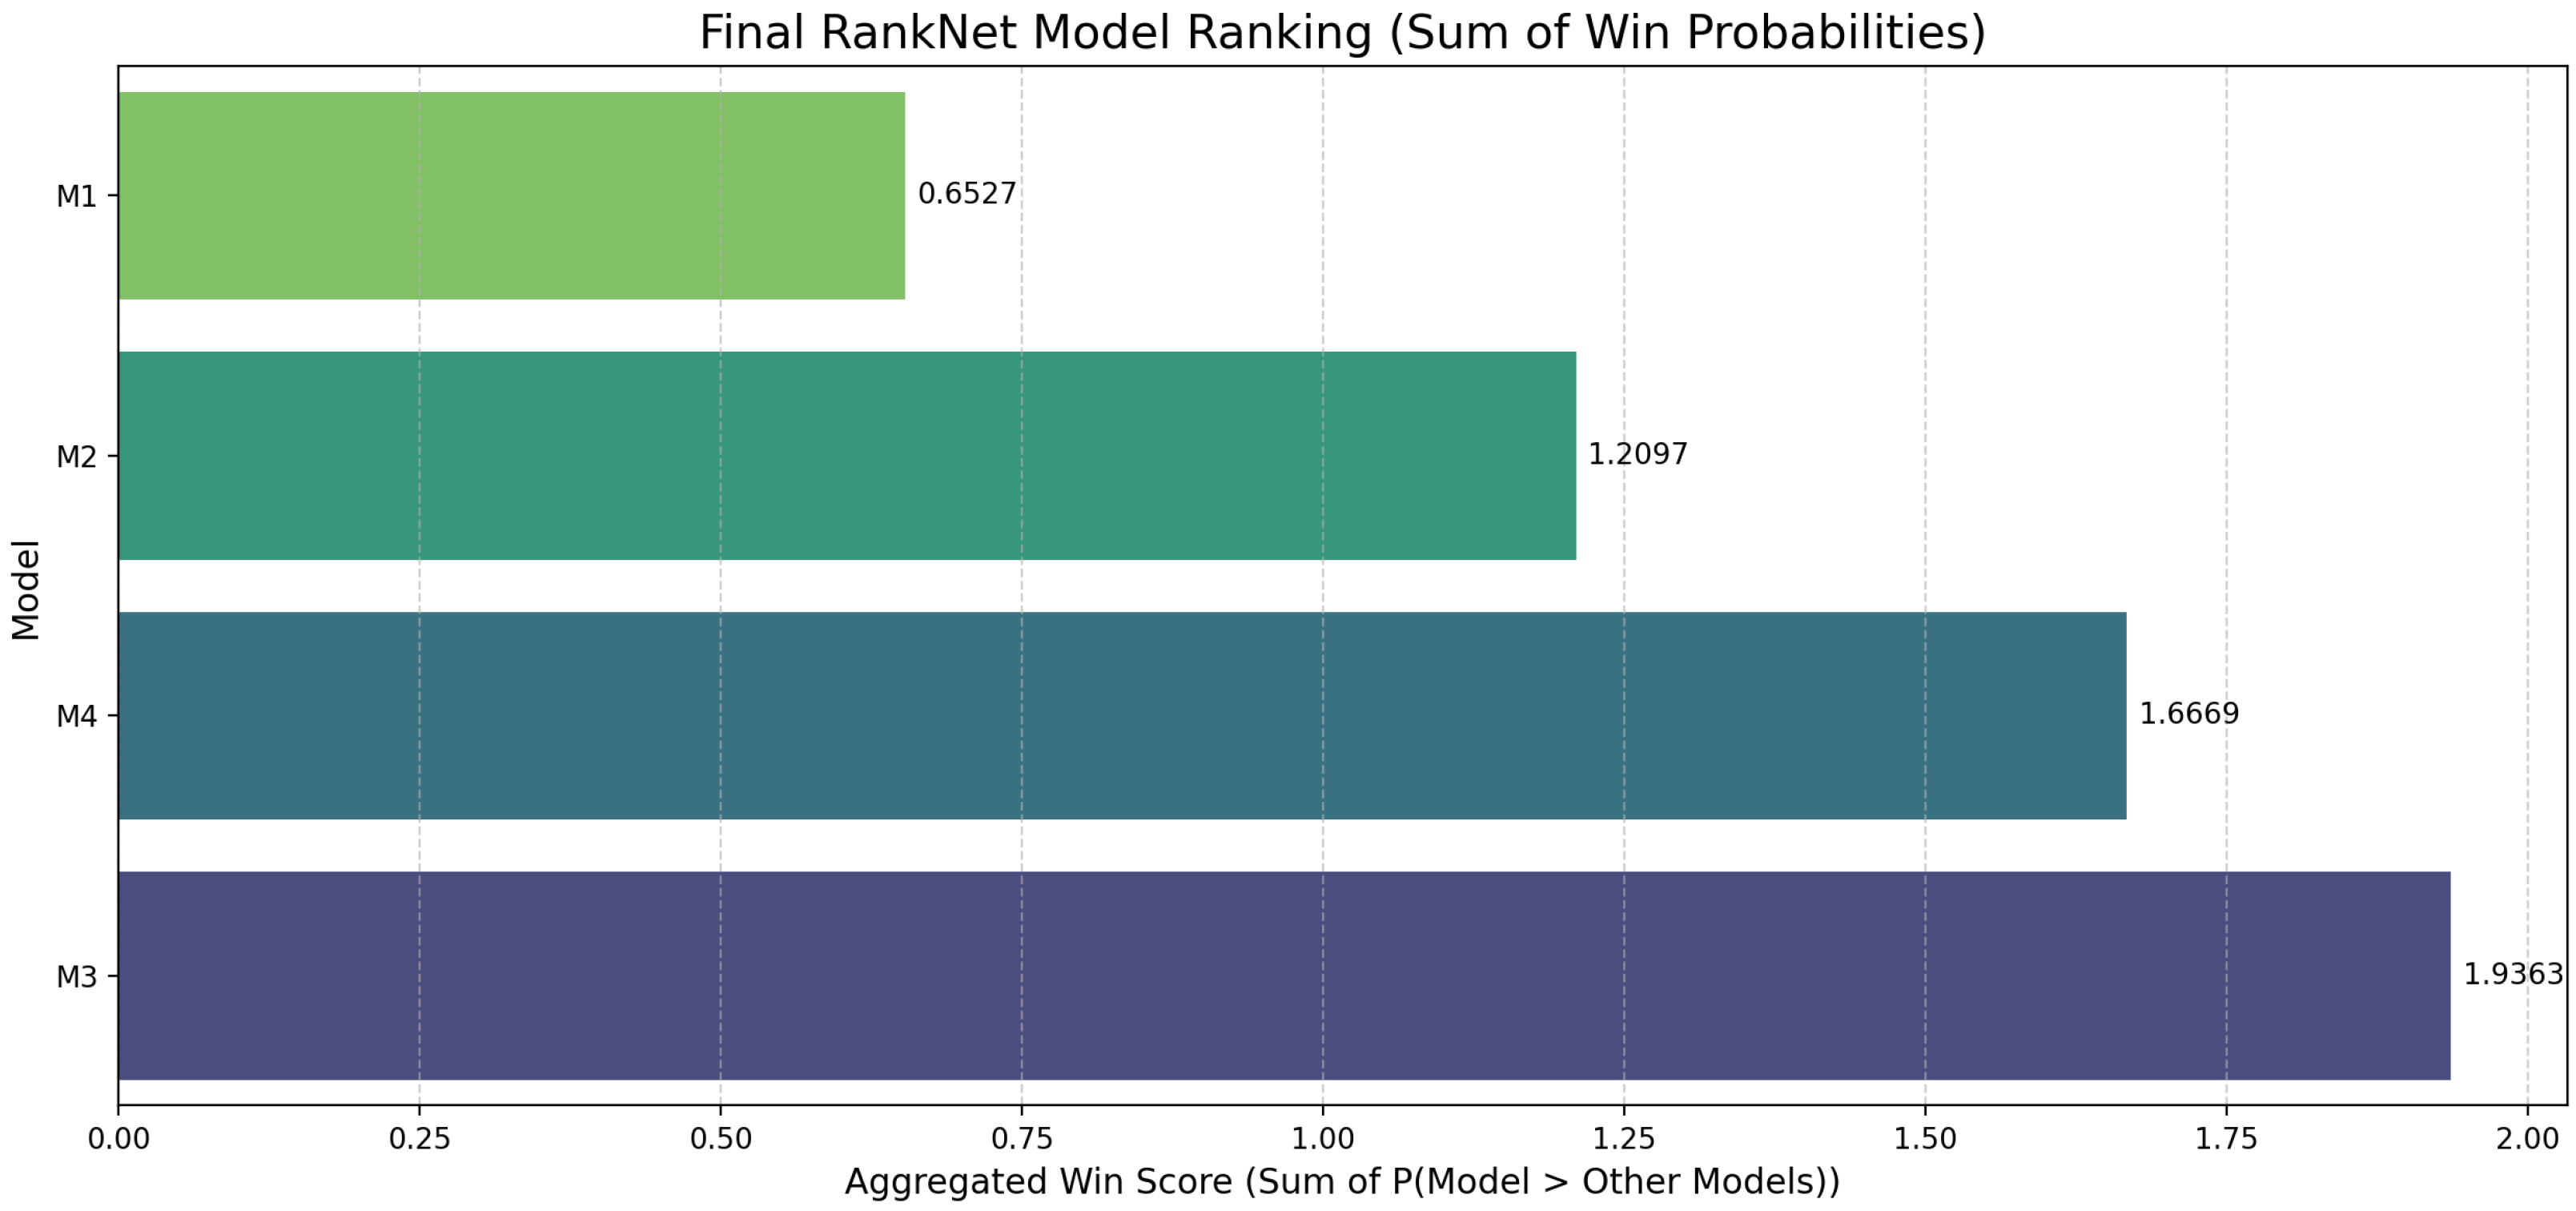
The results obtained from the code summarization RankNet ranking show close results for models M3 and M4, with win probabilities of 1.93 and 1.66, respectively. The RankNet comparison matrix is highest for the (M3, M1) pair with a score of 0.72. The (M2, M4) and (M3, M4) pairs had similar scores of 0.6645 and 0.66, respectively. In the results, the (M4, M1) pair reached a score of 1, indicating M4’s ability to outperform M1.
Practical Application and Experiment Reproducibility
In practical settings, the proposed framework can be used to select LLMs based on application-specific priorities. For example, developers prioritizing code correctness and maintainability may prefer models with higher classification confidence scores, while tasks emphasizing documentation quality may benefit from models with higher summarization rankings. This illustrates that different models may be preferred depending on the task requirements and the code metrics prioritized by stakeholders. Other applications include integrating the selection of best-suited LLMs into Integrated Development Environments (IDEs), which can enable adaptive learning, real-time code suggestions, and automatic documentation generation based on software metric features or developers’ preferences in code generation and summarization domains. Future studies could explore how the proposed selection framework interacts with IDE plugins to optimize workflow efficiency and developer productivity.
LLM selection can impact real-life software engineering outcomes, such as code quality, maintainability, and adherence to emerging coding standards. By integrating LLMs with higher performance scores, development teams can reduce defect rates, improve code readability, and establish benchmarks that inform future coding standards and automated development practices.
All experiments were conducted using publicly available datasets and open-source LLM implementations. Model versions, hyperparameters, evaluation metrics, and random seed configurations are explicitly documented to support reproducibility, with the code base shared through GitHub [
37]. The MBPP dataset and evaluation pipeline can be reused to replicate the reported results, enabling transparent and reproducible research.
6. Conclusions
The findings of this research indicate that the selection of the best-suited LLM for code generation and code summarization could utilize machine learning classification and ranking algorithms as selection criteria. The selection criteria are dependent on a set of software metric features and accuracy scores from summarization similarities. The maximum accuracy reached is 49% for the code-generation metrics experiment. The highest precision score reached 90%, and the recall score reached up to 92%. The highest AUC score was reached with an impressive percentage of 86% among the top four pair correlated features. In the code summarization experiment, the M3 model got the highest ranking with a 1.93 score. The second-highest model was M4 with a 1.66 score. This classification and ranking methodology could be used by other researchers to provide different techniques and insights on LLM selection for different code-generation and summarization metrics.
Future research will focus on incorporating larger and more diverse datasets, including multilingual and multimodal code benchmarks. Alternative machine learning models, such as ensemble classifiers and neural ranking approaches, will be explored to improve accuracy and robustness. Additionally, execution-based evaluation metrics and human-in-the-loop assessments will be integrated to capture functional correctness and real-world usability.
While the current study focuses on model-centric evaluation, incorporating user feedback and interactive performance metrics could provide additional insights into LLM usability, real-time coding support, and effectiveness in collaborative software development environments.
In real-world applications, long-context approaches are critical; unlike isolated snippets, professional software development involves multi-file dependencies and extensive libraries that often exceed standard LLM token limits. Handling this requires sophisticated strategies—such as Sliding Window Attention [
49], RAG-based (retrieval-augmented generation) context filtering [
50], or linear attention mechanisms [
51]—to ensure the LLM maintains project-level awareness during code generation and summarization. While the current experimental setup focused on modular tasks, where these techniques were not strictly required, evaluating the robustness of these long-context strategies for complex, large-scale repository generation remains a vital direction for future research.
Limitations. This study is not without limitations; it must acknowledge the following:
LLMs selected in the experiment differ in coding and summarization capabilities. This might affect the overall score results and could give misleading accuracy values. In addition, other prompt types (e.g., few-shot, chain-of-thought, etc.) and the choice of wording could influence the results.
Features selected for coding prediction results are those that show a highly correlated score. The features selected might not be the best for measuring coding capabilities and may not be the best to use to judge models in this domain.
Synthetic samples may not represent the true distribution, as SMOTE only addresses quantity imbalance and not sample quality, which could lead to overfitting or poor generalization.
The generalizability of the study findings to other datasets could give better results.
The final scores of code summarization results are built from BERT and ROUGE baseline scores, which differ across models and could affect the overall score. Similarly, if evaluators are fundamentally different (e.g., one measures accuracy, another measures perplexity), averaging could distort the meaning.
The selection of machine learning methodology, hyperparameters, and cross-validation percentage could affect the accuracy scores and could eventually lead to better classification and ranking results.
The proposed machine learning-based framework is largely programming-language agnostic, as it relies on feature extraction, classification, and ranking rather than language-specific heuristics. However, metric distributions, summarization behavior, and the implementation of different software libraries may vary across programming languages and could affect the experiment results.
The observed maximum classification accuracy of 49% for the code generation experiment suggests that code complexity and quality metrics alone provide limited discriminative power when distinguishing between multiple LLMs with overlapping capabilities. This indicates that while such metrics capture structural and maintainability aspects, they may not fully reflect semantic correctness or problem-solving strategies employed by different models. Incorporating additional features—such as execution-based correctness measures, token-level confidence scores, or embedding-based semantic representations—may improve classification performance.