1. Introduction
Drones, or unmanned aerial systems (UAS), have become vital tools in numerous industries like agriculture, delivery, surveillance, and media. With increasing applications, the need for drone frames that are not only lighter but also mechanically resilient and aerodynamically shaped is realized. The structural frame is the backbone by holding propulsion units, onboard electronics, and power sources, which directly affect the stability of flight, energy efficiency, and responsiveness of the drone.
The creation of an efficient drone frame is a compromise of a few key parameters: mechanical robustness, minimal structural weight, and desirable aerodynamics. Although aluminum alloys and carbon polymer matrices are typically utilized based on better mechanical properties, their cost and manufacturing complexity restrict practicability to hobby or budget-restricted consumer UAV use. This makes it essential to explore other materials that will provide ease of manufacture and affordability while maintaining structural requirements.
Polylactic acid (PLA) is one of the most widespread biodegradable thermoplastics applied in 3D printing that allows prototyping with low production cost and compatibility with fused deposition modeling (FDM) methods. Its application in the form of a drone frame material has not been extensively researched, mainly because of its performance constraints under fatigue and temperature. Nevertheless, PLA is a potential candidate in minimalist drone designs if optimized and well understood under operational conditions.
This study employs a simulation-driven design approach to analyze and enhance the viability of using PLA for the material of a UAV structure. Design starts with CAD modeling in SolidWorks, followed by structural simulation with finite element analysis (FEA) to mimic stress response, displacement characteristics, and fatigue life in real-world loading situations. Concurrently, computational fluid dynamics (CFD) simulation is employed to test aerodynamic performance, e.g., airflow patterns and drag.
Topologically optimized using simulation results, the frame’s weight is minimized by removing unnecessary material in low-stress areas, enhancing the overall stiffness-to-weight ratio and not sacrificing structural integrity. The resulting design is manufactured using an FDM 3D printer, followed by testing under controlled load conditions to validate the simulation results and establish functionality.
The research team concludes by suggesting potential enhancements to next-generation designs, including using materials with PETG, Nylon, or composite-reinforced filaments in regions of highest stress concentrations. The materials hybridization strategy is intended to improve long-term strength and structural integrity at a cost-effective and practical solution for the design of UAV frames through additive manufacturing. This is a cost-saving approach to UAV frame design without sacrificing structural performance.
2. Literature Review
Optimized drone frame configuration demands the weighing of structural integrity, aerodynamic efficiency, and material characteristics. Of these, mechanical strength of the material and the ability to resist impacts are especially critical in establishing the operational dependability of the frame. Simulation methods like finite element analysis (FEA) and computational fluid dynamics (CFD) are typically utilized in order to optimize load-carrying efficiency and reduce aerodynamic drag. However, most of the existing work has been centered on large UAVs, and structurally, aerodynamically, and mission-wise, these differ significantly from small-scale drones. This lack of research highlights the need for targeted research that specifically addresses the problems of small drone frame optimization.
2.1. Structural Optimization
Structural integrity takes precedence in UAV (unmanned aerial vehicle) design since it influences critical considerations such as flight safety, load carrying capacity, and service life. To reduce the design of the frame, Asif et al. [
1] utilized finite element analysis (FEA) for investigating stress distribution under simulated loads. Their work focused on minimizing material in non-structural regions while bracing regions subjected to higher mechanical loads, resulting in a lightweight but structurally rigid frame tuned for flight dynamics.
Expanding on this process, Liu et al. [
2] combined topology optimization with additive manufacturing to design UAV frames that place material in the optimal location based on structural requirements. This resulted in geometrically complex frames with maximum stiffness-to-weight and strength-to-weight ratios, key performance drivers in aerial vehicle design, especially for lighter drones where weight influences efficiency and agility directly.
Tomislav et al. [
3] report that the adoption of additive manufacturing technologies such as fused deposition modeling (FDM) and selective laser sintering (SLS) has transformed UAV frame production. Both technologies enable the creation of sophisticated internal geometry and customized infill patterns, enabling the precise distribution of material along expected load paths. This differs from conventional subtractive manufacturing since additive manufacturing can provide design freedom, rapid prototyping, and weight minimization without sacrificing mechanical strength.
With simulation-based optimization paired with enhanced manufacturing processes, designers can make frames for UAVs that are mechanically optimized and also lightweight and customizable to exact mission requirements. This synergy between fabricating and fabrication leads to shorter times for development, lower material consumption, and higher UAV performance and customization potential.
2.2. Aerodynamic Optimization
Aerodynamic efficiency plays a very crucial role in enhancing the efficiency of unmanned aerial vehicles (UAVs) in reducing power needs and enhancing flight capabilities such as range and speed. Drag, form drag, skin friction, and induced drag are among the top reasons that limit aerodynamic efficiency. To this, researchers like Yap et al. [
4] and Kapsalis et al. [
5] employed advanced computational fluid dynamics (CFD) techniques to simulate airflow patterns across UAV frames. They saw in their simulations that the aerodynamic drag could be significantly reduced by smoothing the shape at the rear fuselage and placing motors and arms strategically.
These improvements are largely attributed to wake turbulence and suppression of vortices, particularly at rotors and structural interfaces. Induced drag arises from such actions of vortices; thus, their minimization translates to enhanced aerodynamic efficiency directly [
6]. Despite such valuable contributions, the majority of the available literature has been concerned with larger UAV systems that are scaled and varied in terms of flow dynamics from small consumer-based drones.
Small UAVs possess a different aerodynamic regime, with reduced Reynolds numbers and closer component integration that exposes them more to drag losses. The Reynolds number has a significant effect on aerodynamics, as studied by Lin et al. [
7]. Therefore, design strategies effective for large drones cannot be directly applied to small platforms. Due to the huge growth of small-drone applications, especially in consumer and commercial segments, dedicated study toward their aerodynamic optimization is necessary.
This research bridges that gap by using CFD simulations to minimize the structural geometry of mini-drones, particularly the motor mount areas and fuselage. The objective is to minimize induced drag as well as parasitic drag while keeping structural feasibility and manufacturability in mind, leading to increased flight duration, increased speed, and enhanced overall performance. This will also help in assessing the viability of PLA material as a strong, lightweight, biodegradable, and cheap material for drones.
2.3. Material Selection and Fatigue Analysis
The selection of a proper material for drone frames is critical for good mechanical strength, durability, and cost-effectiveness. Carbon fiber composite materials are largely used in top-end UAVs due to their strength-to-weight ratio, but thermoplastics such as PLA, ABS, and Nylon are widely used in consumer-grade drones due to their affordability and suitability with 3D printing technologies.
According to the study performed by Jamadar et al. [
8], ABS and Nylon are more fatigue-resistant than PLA, whose lifespan under cyclic loads is shorter due to its brittleness. While PLA still prevails in applications for the production of lightweight prototypes, its lower fatigue resistance suggests that it should not be used in parts that undergo continuous mechanical stresses.
Nylon’s added toughness and ultraviolet (UV) radiation resistance make it a particularly valuable material for exposed drone parts that need to be rugged enough to withstand outdoor environments and cyclic loading, often performing better than ABS and PLA [
9],
Table 1 gives a comparison of different Polymers.
PLA’s biodegradability, as studied by Hajilou et al. [
10], coupled with its availability and easy accessibility, makes it better for the mass manufacture of drones as it has a much smaller impact on the environment, and its material properties are fair enough to make it a viable material for the manufacture of small drones.
The objective of this research is to establish the fatigue properties of PLA under simulated UAV operational loading. By establishing the fatigue limits and failure modes of PLA, the research will determine its applicability for use in structural components of light drones and whether other materials should be given precedence. This analysis fills a knowledge gap between the knowledge of PLA’s longevity when used in drone frame applications.
2.4. Research Gap and Contribution
Except for recent research, most UAV work has been aimed at enhancing the aerodynamic and structural efficiency of larger drones that make use of advanced materials like carbon fiber composites and aluminum alloys. Although these materials offer greater strength-to-weight ratios, their high cost and production demands limit their use in small, consumer-grade drones. On the other hand, little research has been conducted on how to optimize drone frames made of polylactic acid (PLA), a material that has grown popular for its affordability and environmental friendliness for small UAV applications. Also, the fatigue life of PLA when subjected to cyclic operational loads has not been comprehensively studied, making it less reliable to apply.
This research will seek to fill these gaps by examining three broad topics. It evaluates PLA as a structural material for drone frames and praises its feasibility as an inexpensive, sustainable, and biodegradable choice. It also targets the aerodynamics and weight reduction of mini UAVs to minimize drag and thus improve flight duration, distance, and speed. Finally, the research studies PLA’s fatigue resistance due to cyclic loading imitating real flight scenarios, showing its durability and applicability for consumer drones.
Through this focused initiative, the research contributes to the development of cost-effective, strong, lightweight, and compact UAVs by enhancing both material performance and aerodynamic efficiency. The proposed drone design demonstrates the feasibility of using a biodegradable and environmentally friendly material (PLA), offering a sustainable and practical solution for real-world applications.
3. Methodology
Here, the systematic process of designing, modeling, and producing the drone frame to be tested is presented. Structural behavior was analyzed through finite element analysis (FEA) in SolidWorks to quantify stress distribution and deformation under working load. Aerodynamics was examined through computational fluid dynamics (CFD) simulation to model air flow and minimize drag. The final product was thereafter printed using fused deposition modeling (FDM) 3D printing, providing the opportunity for physical testing to validate simulation outcomes.
3.1. Design and Simulation Setup
Using SolidWorks, the structure of the drone was modeled to meet vital structural and performance requirements. Focus was laid on developing a minimal weight structure to reduce energy consumption and maximize battery life while providing sufficient strength to counteract the forces from the drone’s weight, aerodynamic, and motor thrust. Aerodynamic efficiency was also prioritized to reduce drag and improve flight performance.
The design incorporated a central compartment for battery and electronics storage, and four arms radiating outward to accommodate motors. Streamlined, lightweight landing gear that would bear the landing impact was also included. Fillets and smooth transition geometry eliminated stress concentrations by spreading stresses more evenly across and making the frame more durable overall. PLA was used to print the drone frame, the particulars of which are listed in
Table 2.
Figure 1 shows a side view of the drone body Along with the major dimensions.
3.2. Mesh and Solver Parameters
The mesh has 227,732 total nodes and 123,013 total elements. The max element size was 17.4195 mm, and the minimum element size was 0.870976 mm. A finite volume method (FVM)-based pressure-based segregated solver was used for the flow simulation, and an FFE Plus solver was used for the static studies.
The
Figure 2 and
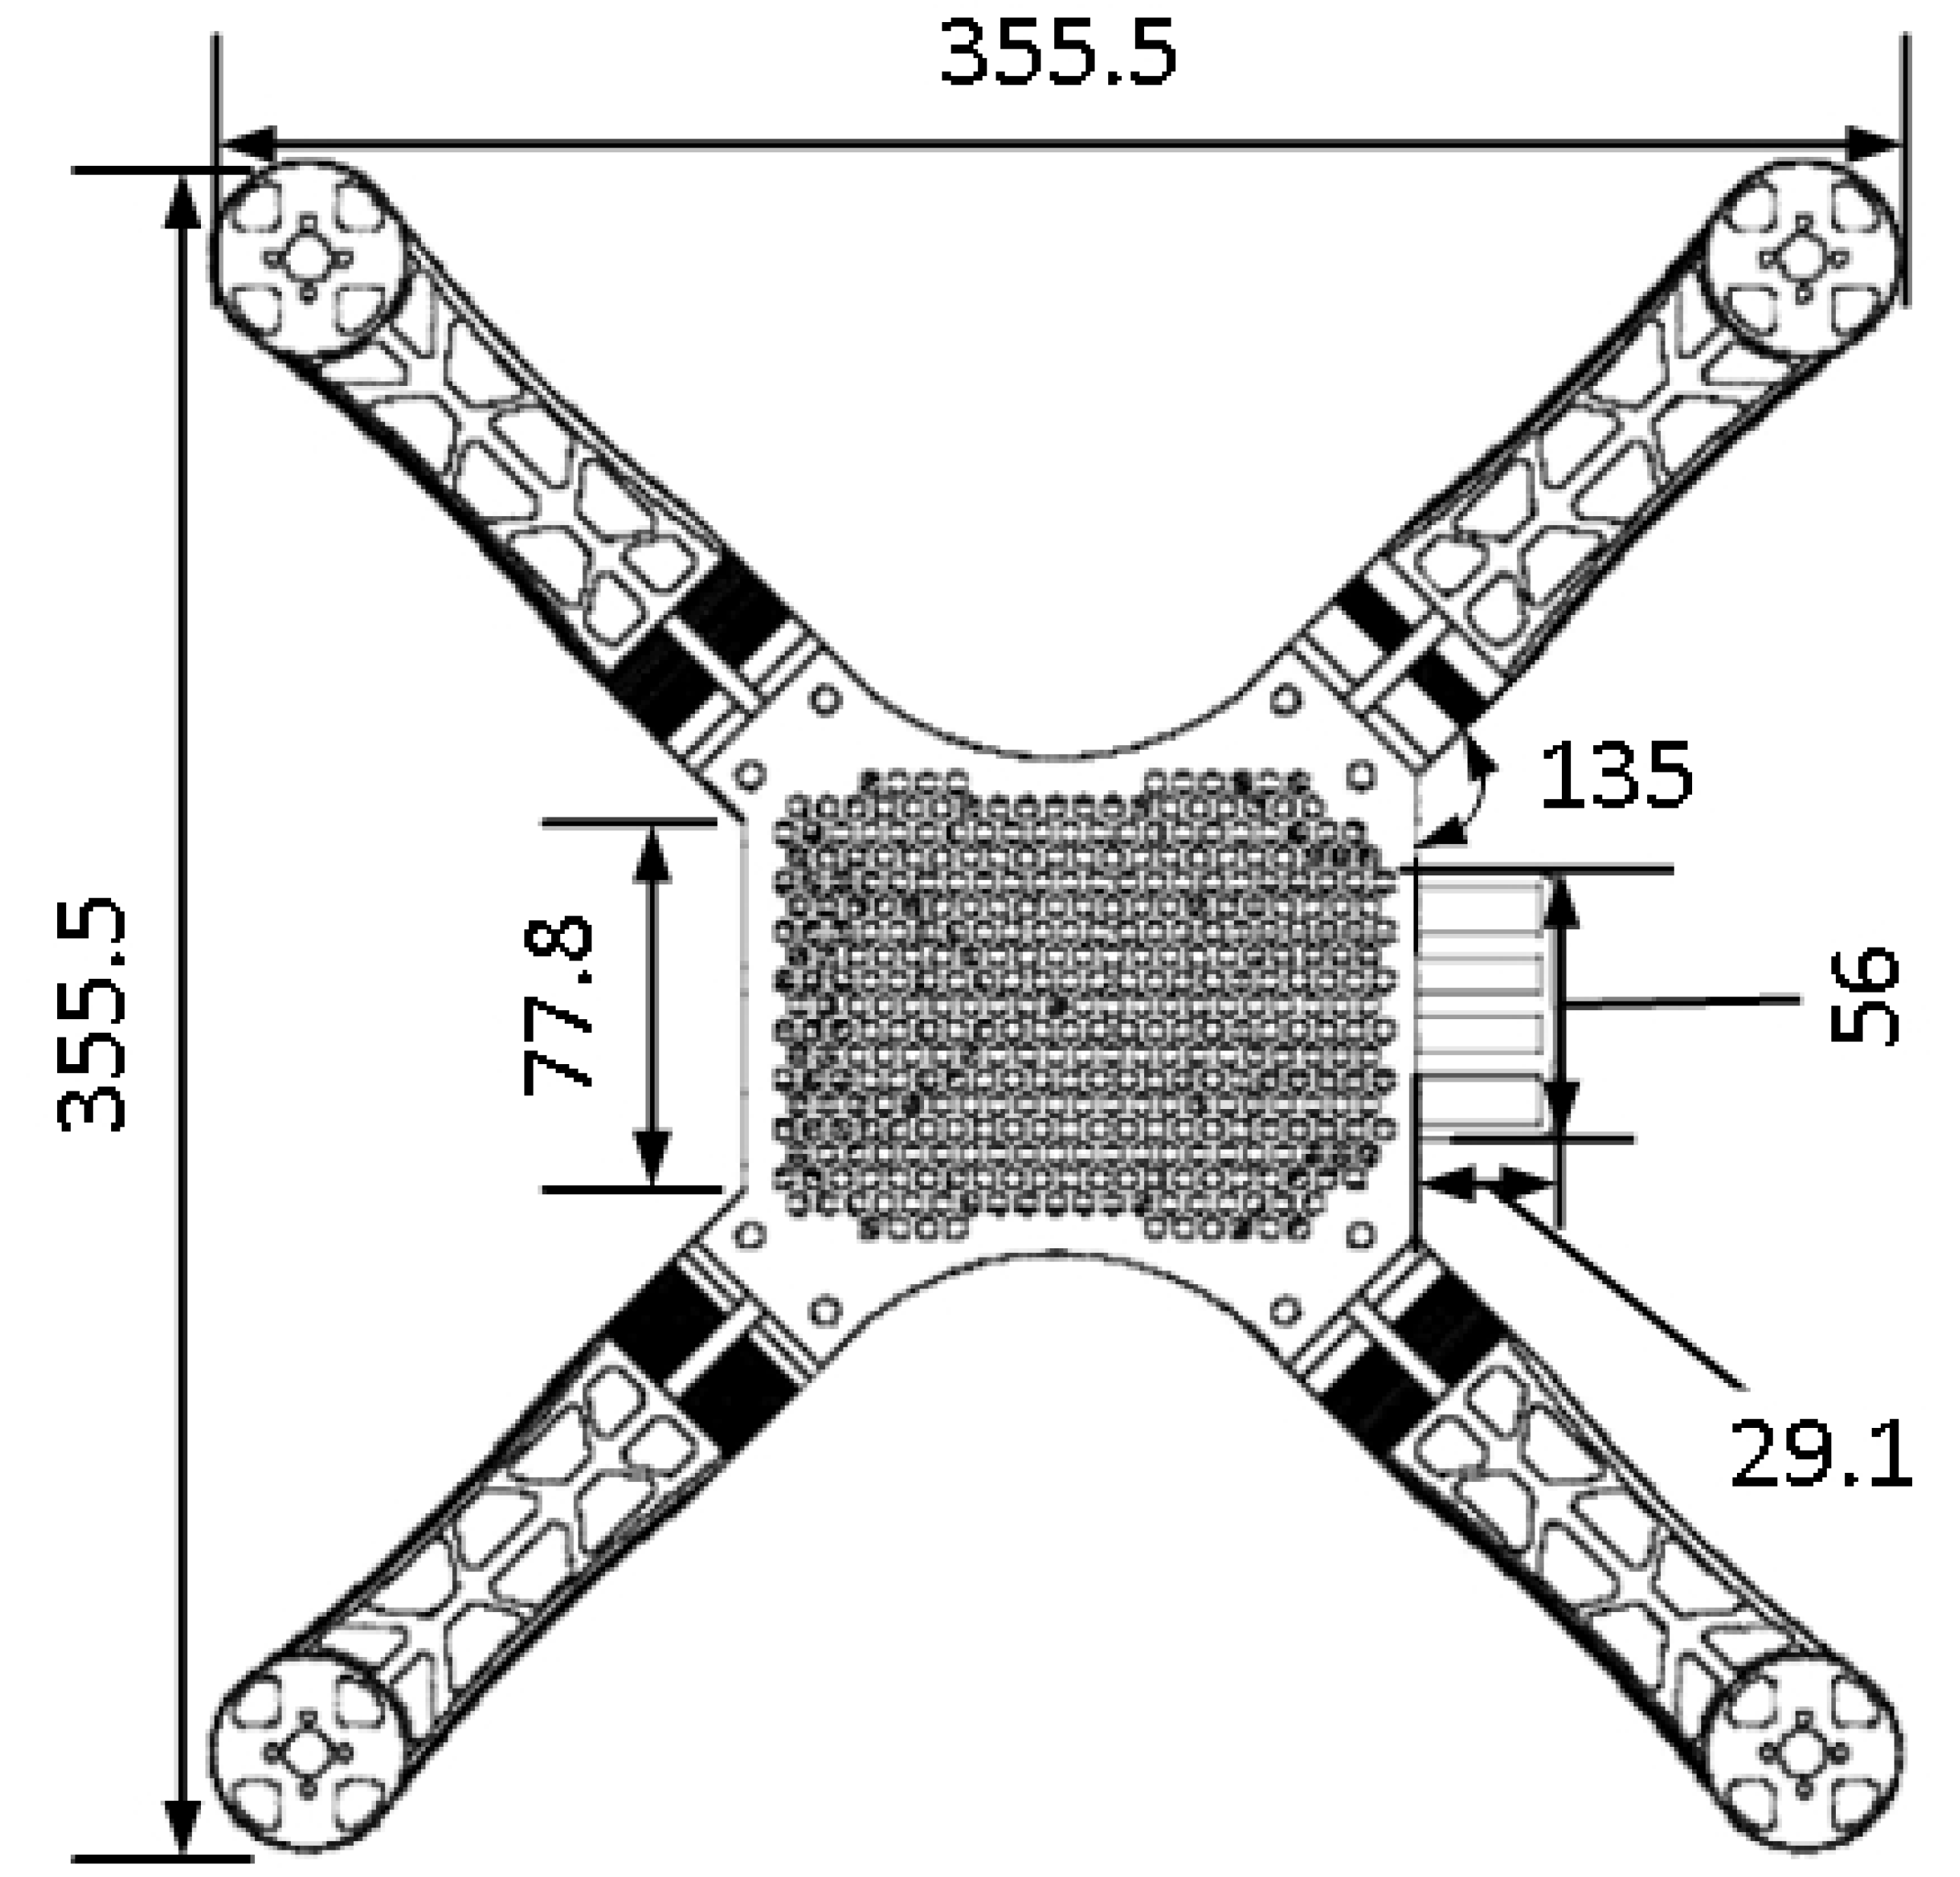
Figure 3 show the top view and arm dimensions of the drone body respectively.
3.3. Design Steps
The drone was simulated through a series of predefined steps using SolidWorks 2025 software. The structural analysis found that the maximum displacement of the arms during loading was 0.05 mm, which provided satisfactory stability under abrupt stress conditions. The design was carried out according to the following steps.
3.3.1. Arms
The drone’s arms, which were subjected to elevated stress levels, were designed in such a way that they possessed sufficient strength while ensuring weight was kept at its lowest. The procedure for design began with a rectangular solid that was then cut and fashioned to meet the requirements as desired. The arms’ total weight after finalization was 82.5772 g.
Figure 4 shows the different steps of the arm design.
3.3.2. Step 1
Unused portions of the arm carrying loads were cut off to reduce weight. Consequently, the weight of the arm was decreased to 77.6147 g without sacrificing strength.
3.3.3. Step 2
By eliminating additional material in acceptable regions to keep stiffness, arm weight was greatly reduced. This final optimization achieved the maximum mass reduction, up to 58.9667 g.
3.3.4. Step 3
The arm’s thickest section, closest to the fuselage, was hollowed to help minimize weight. This enabled the weight to be saved without creating a notable increase in the highest stresses found in that region.
3.3.5. Step 4
The location of material removal was verified using a topology study. The final mass of the arm was 39.12 g. This was an improvement of 49.588% over the first prototype.
Top and Bottom section of the fuselage
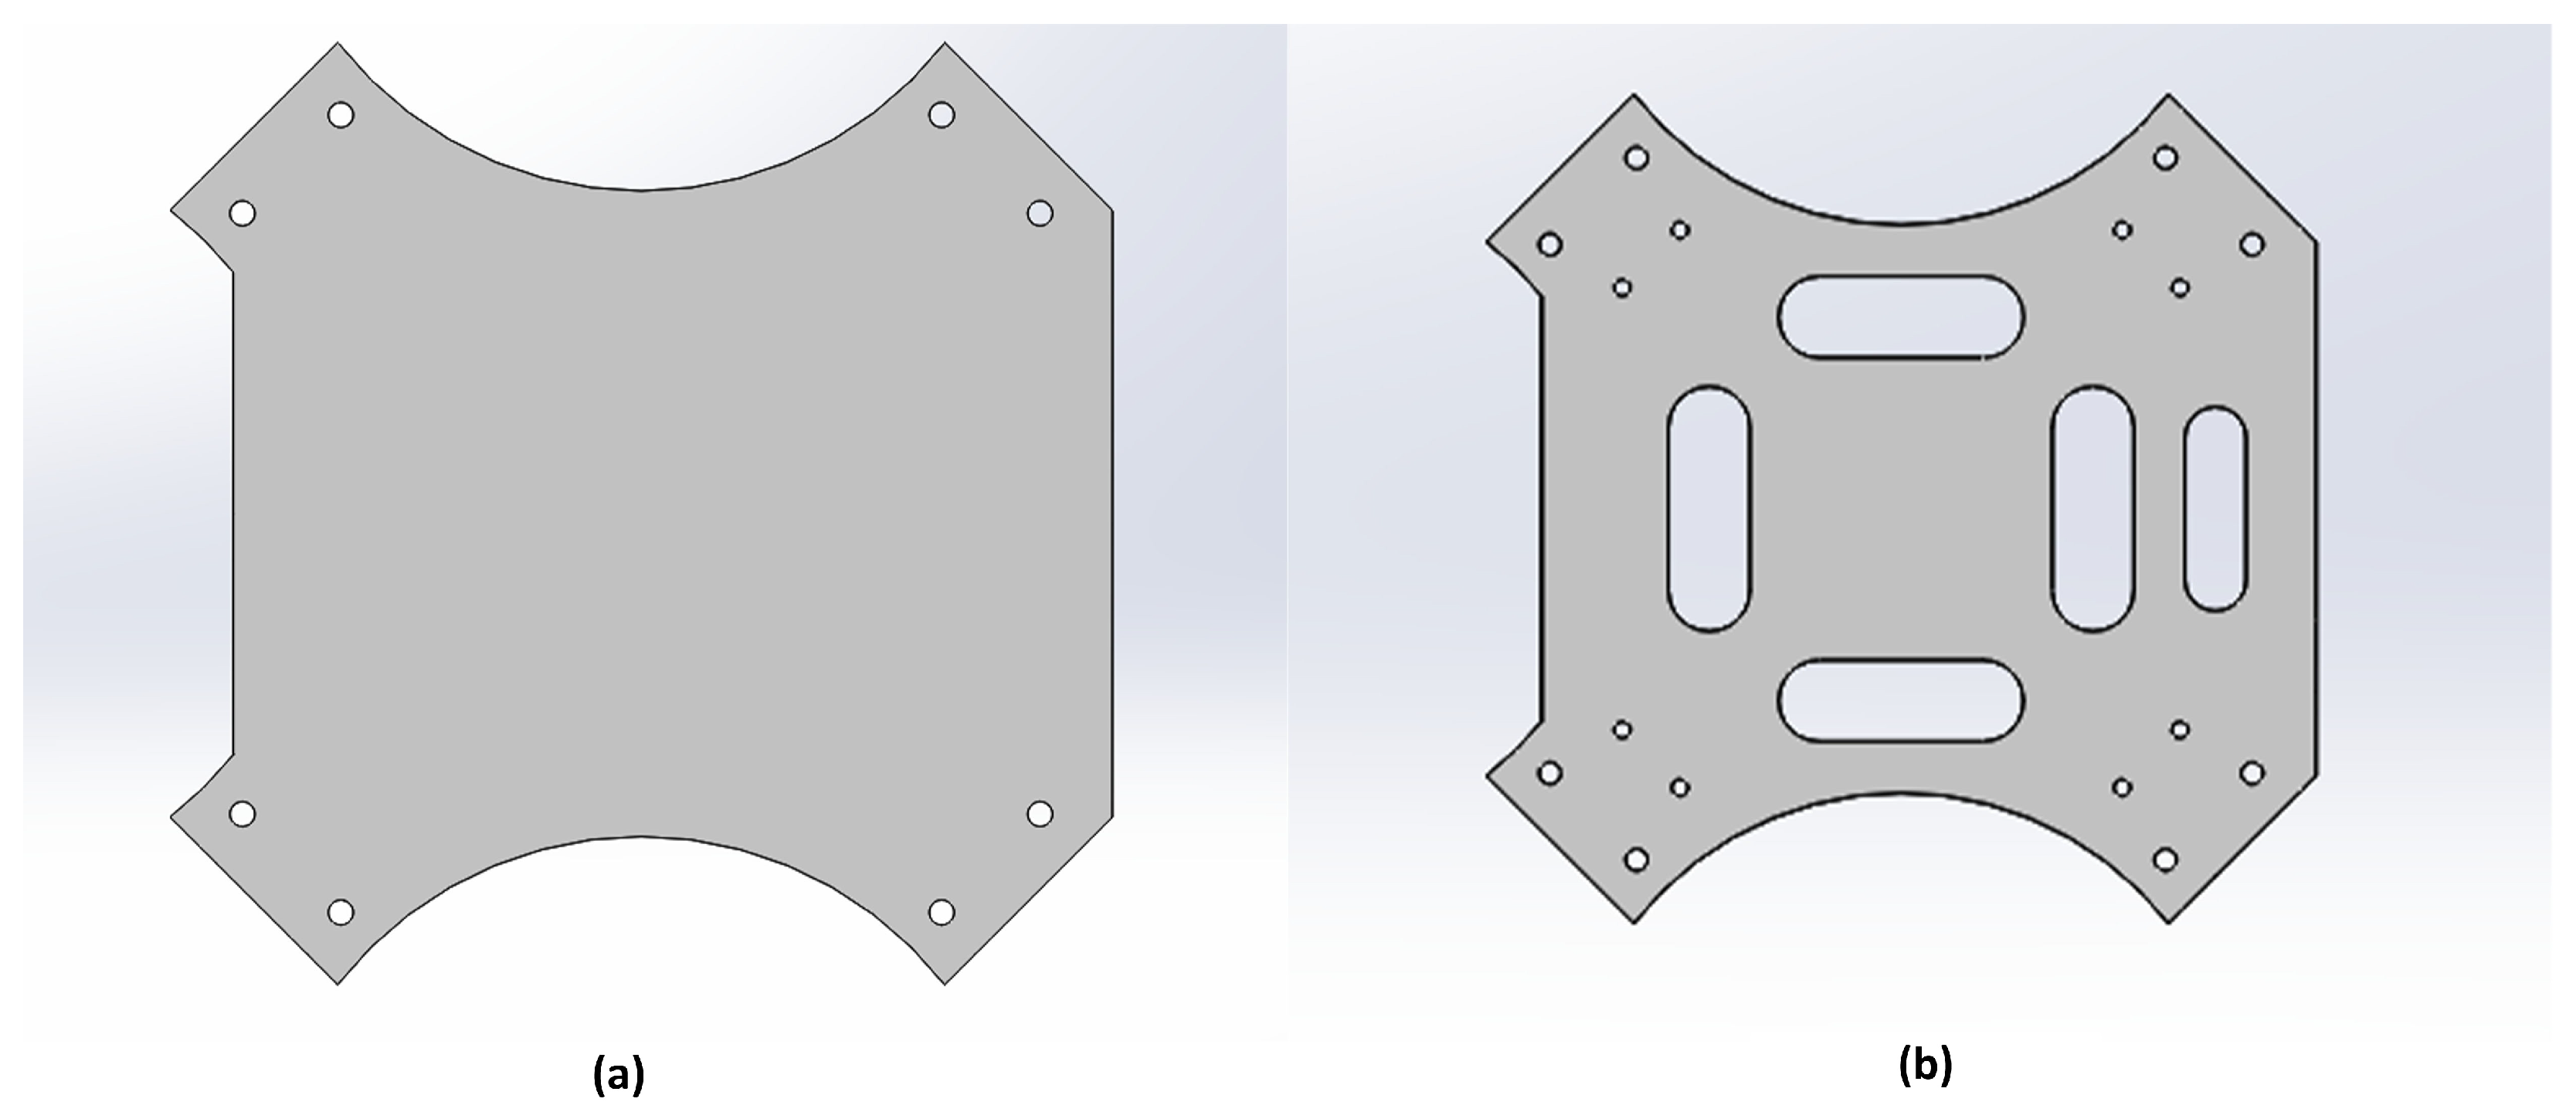
The top and bottom fuselage plates were designed by drawing and extruding their profiles to 2 mm thickness. The top plate was machined solid with no holes, while the bottom plate was modified with slots, as can be seen in
Figure 5.
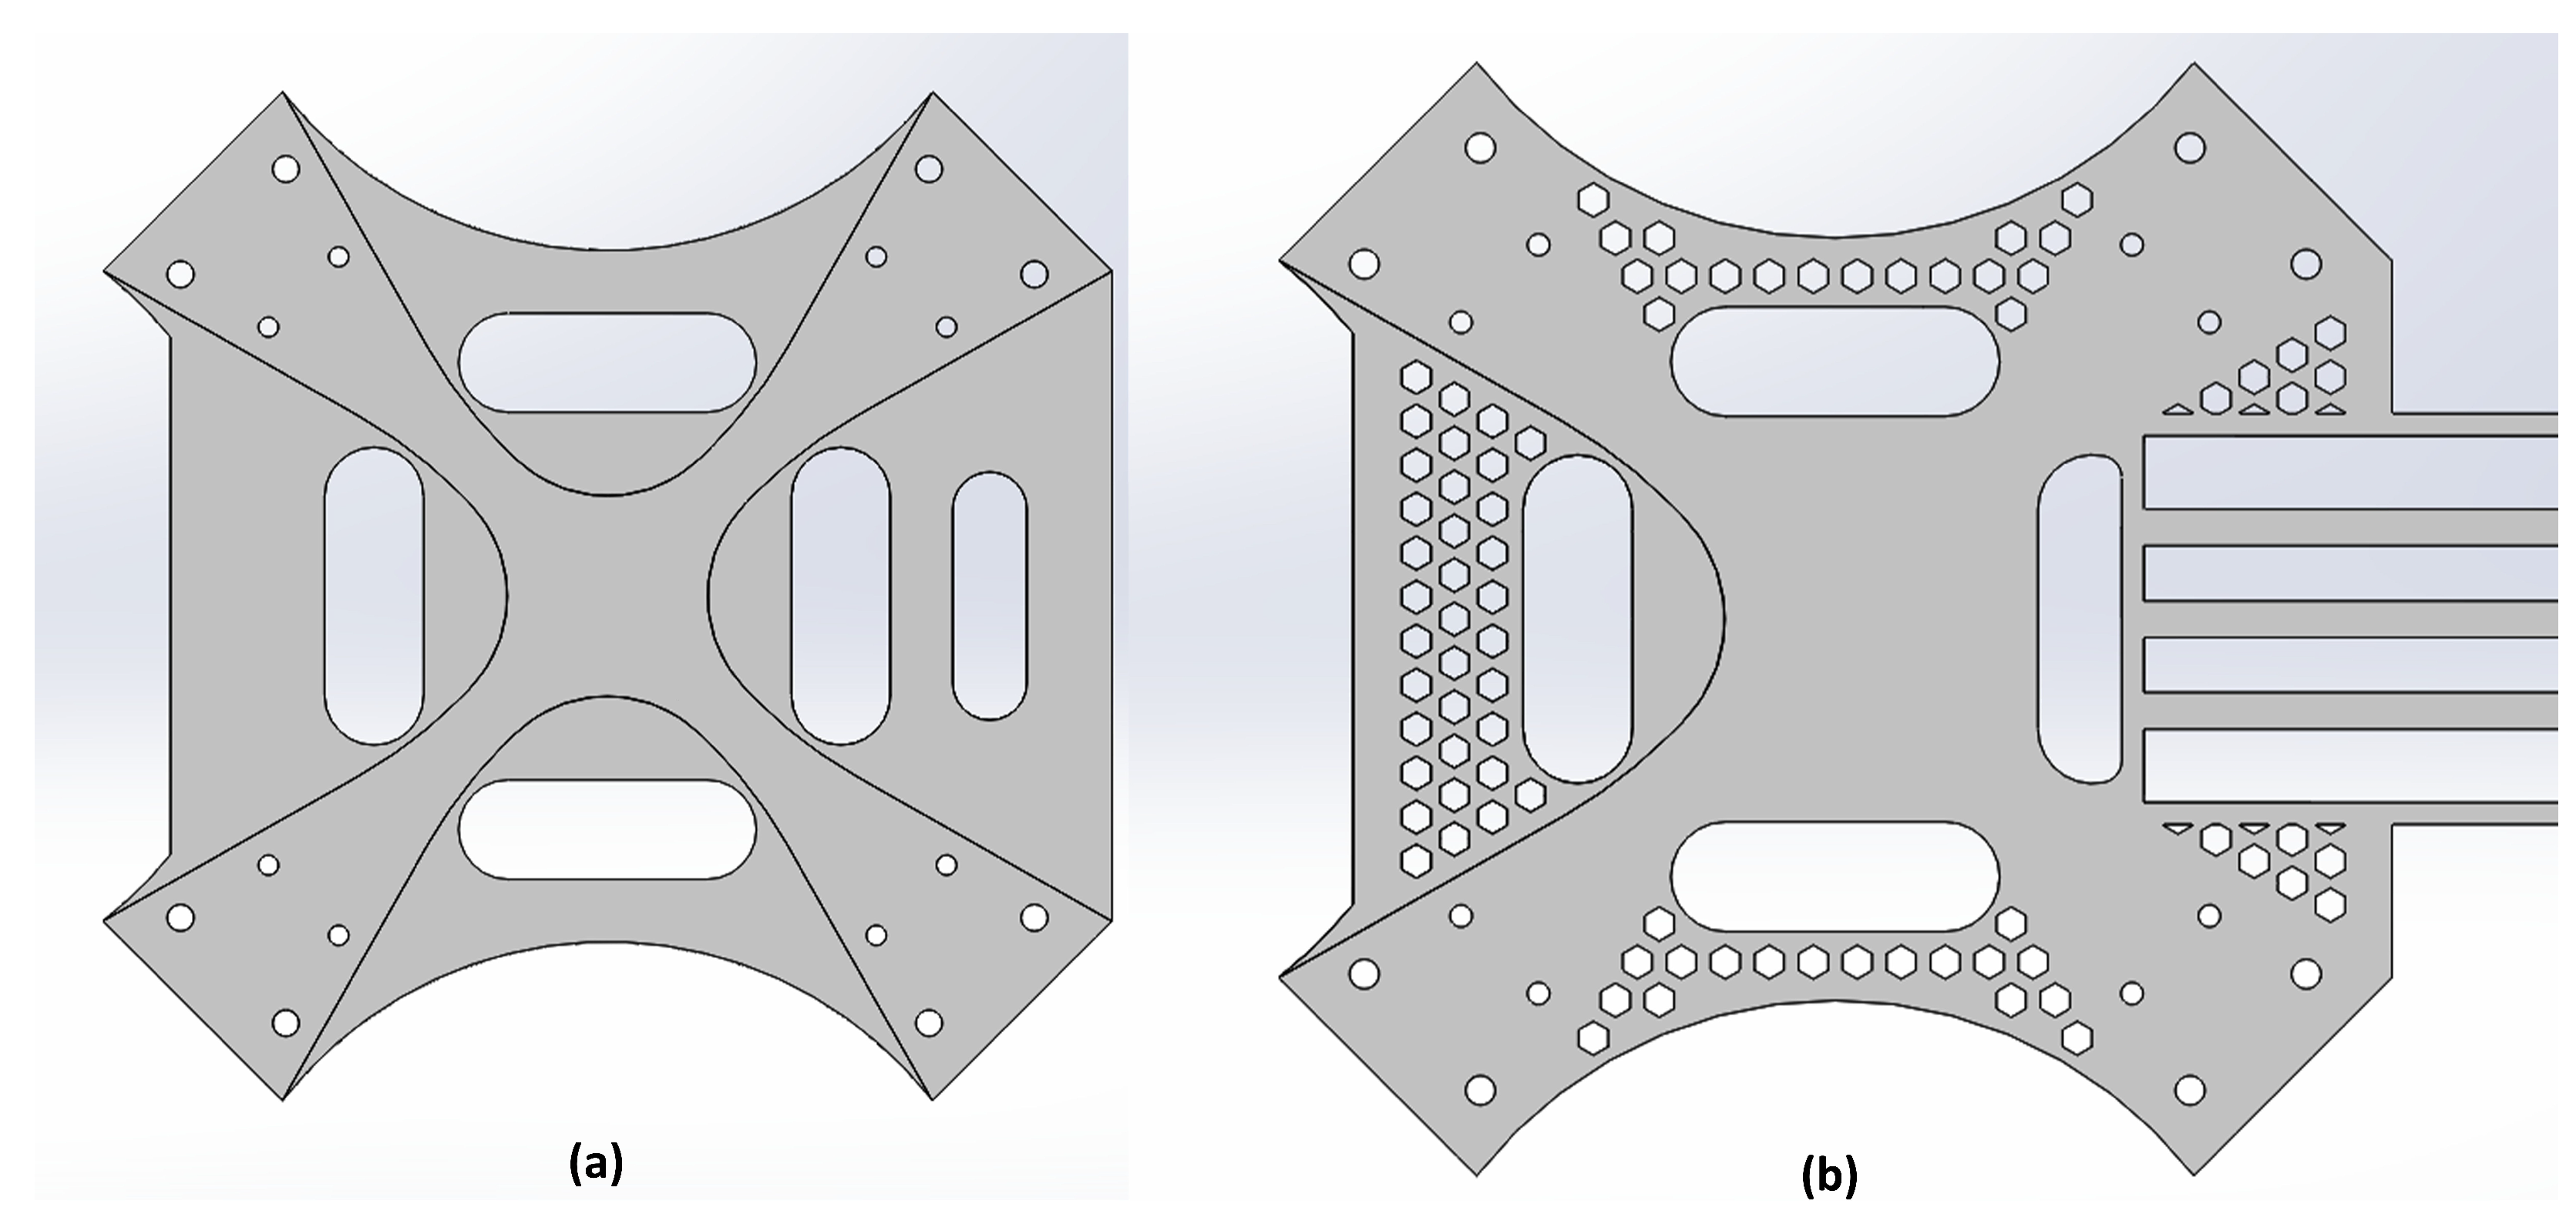
The top plate was concluded by the inclusion of a honeycomb pattern that was cut into it; care was taken to keep the cut sections away from the edges as can be seen in
Figure 6.
The bottom section was reinforced using a cross-shaped section that went across to each arm. This was done in order to ensure that the section did not deform excessively under loads as we can see in
Figure 7.
A honeycomb structure was cut into the bottom plate where feasible, and an extruded section was added in order to shift the drones’ center of gravity to a desirable location.
3.4. Parametric Studies
Various parametric studies were conducted to assess the best design for the arms, as they will bear the most weight. The design having the best stiffness to weight ratio was chosen. The overview of the studies conducted is presented below.
3.4.1. Parametric Study 1
This study was conducted using a solid arm with the highest stiffness; the downside was an increased weight, which would cause inefficiencies and would also cause problems in drone control.
3.4.2. Parametric Study 2
This study was conducted using an arm having lengthwise cutouts along the arm; the design was scrapped due to excessive stress concentrations near the base of the arm.
3.4.3. Parametric Study 3
A design incorporating lateral cutouts along the arm was conceived but discarded due to excessive stress concentrations on the side of the arm and insufficient weight savings to meet the requirements of the drone.
3.4.4. Parametric Study 4
This study was conducted with a honeycomb structure cut out along the arm; the design was scrapped because the decrease in weight was not high enough to meet the demands of the drone.
3.4.5. Parametric Study 5
This study was conducted using an arm having a variable pattern cutout along the arm; the design was selected as it gave the most reduction in weight without decreasing performance much.
3.4.6. Parametric Study 6
This study was conducted by modifying the previously selected design and removing material internally where feasible. The portion with the cutouts was kept filled in order to reduce stress concentrations in that region and also to make sure to remove any errors during the printing procedure.
Figure 8 shows the different iterations of the drone arms.
3.4.7. Parametric Study 7
This study was conducted by modifying the previously selected design and removing more material internally where feasible. The previous design was selected in order to avoid errors during the printing of the arm. The studies led to a successive decrease in the weight of the drone arm. The final weight was 49.588% lighter than the weight of the first iteration of the arm.
The important parameters of the arm are given in
Table 3.
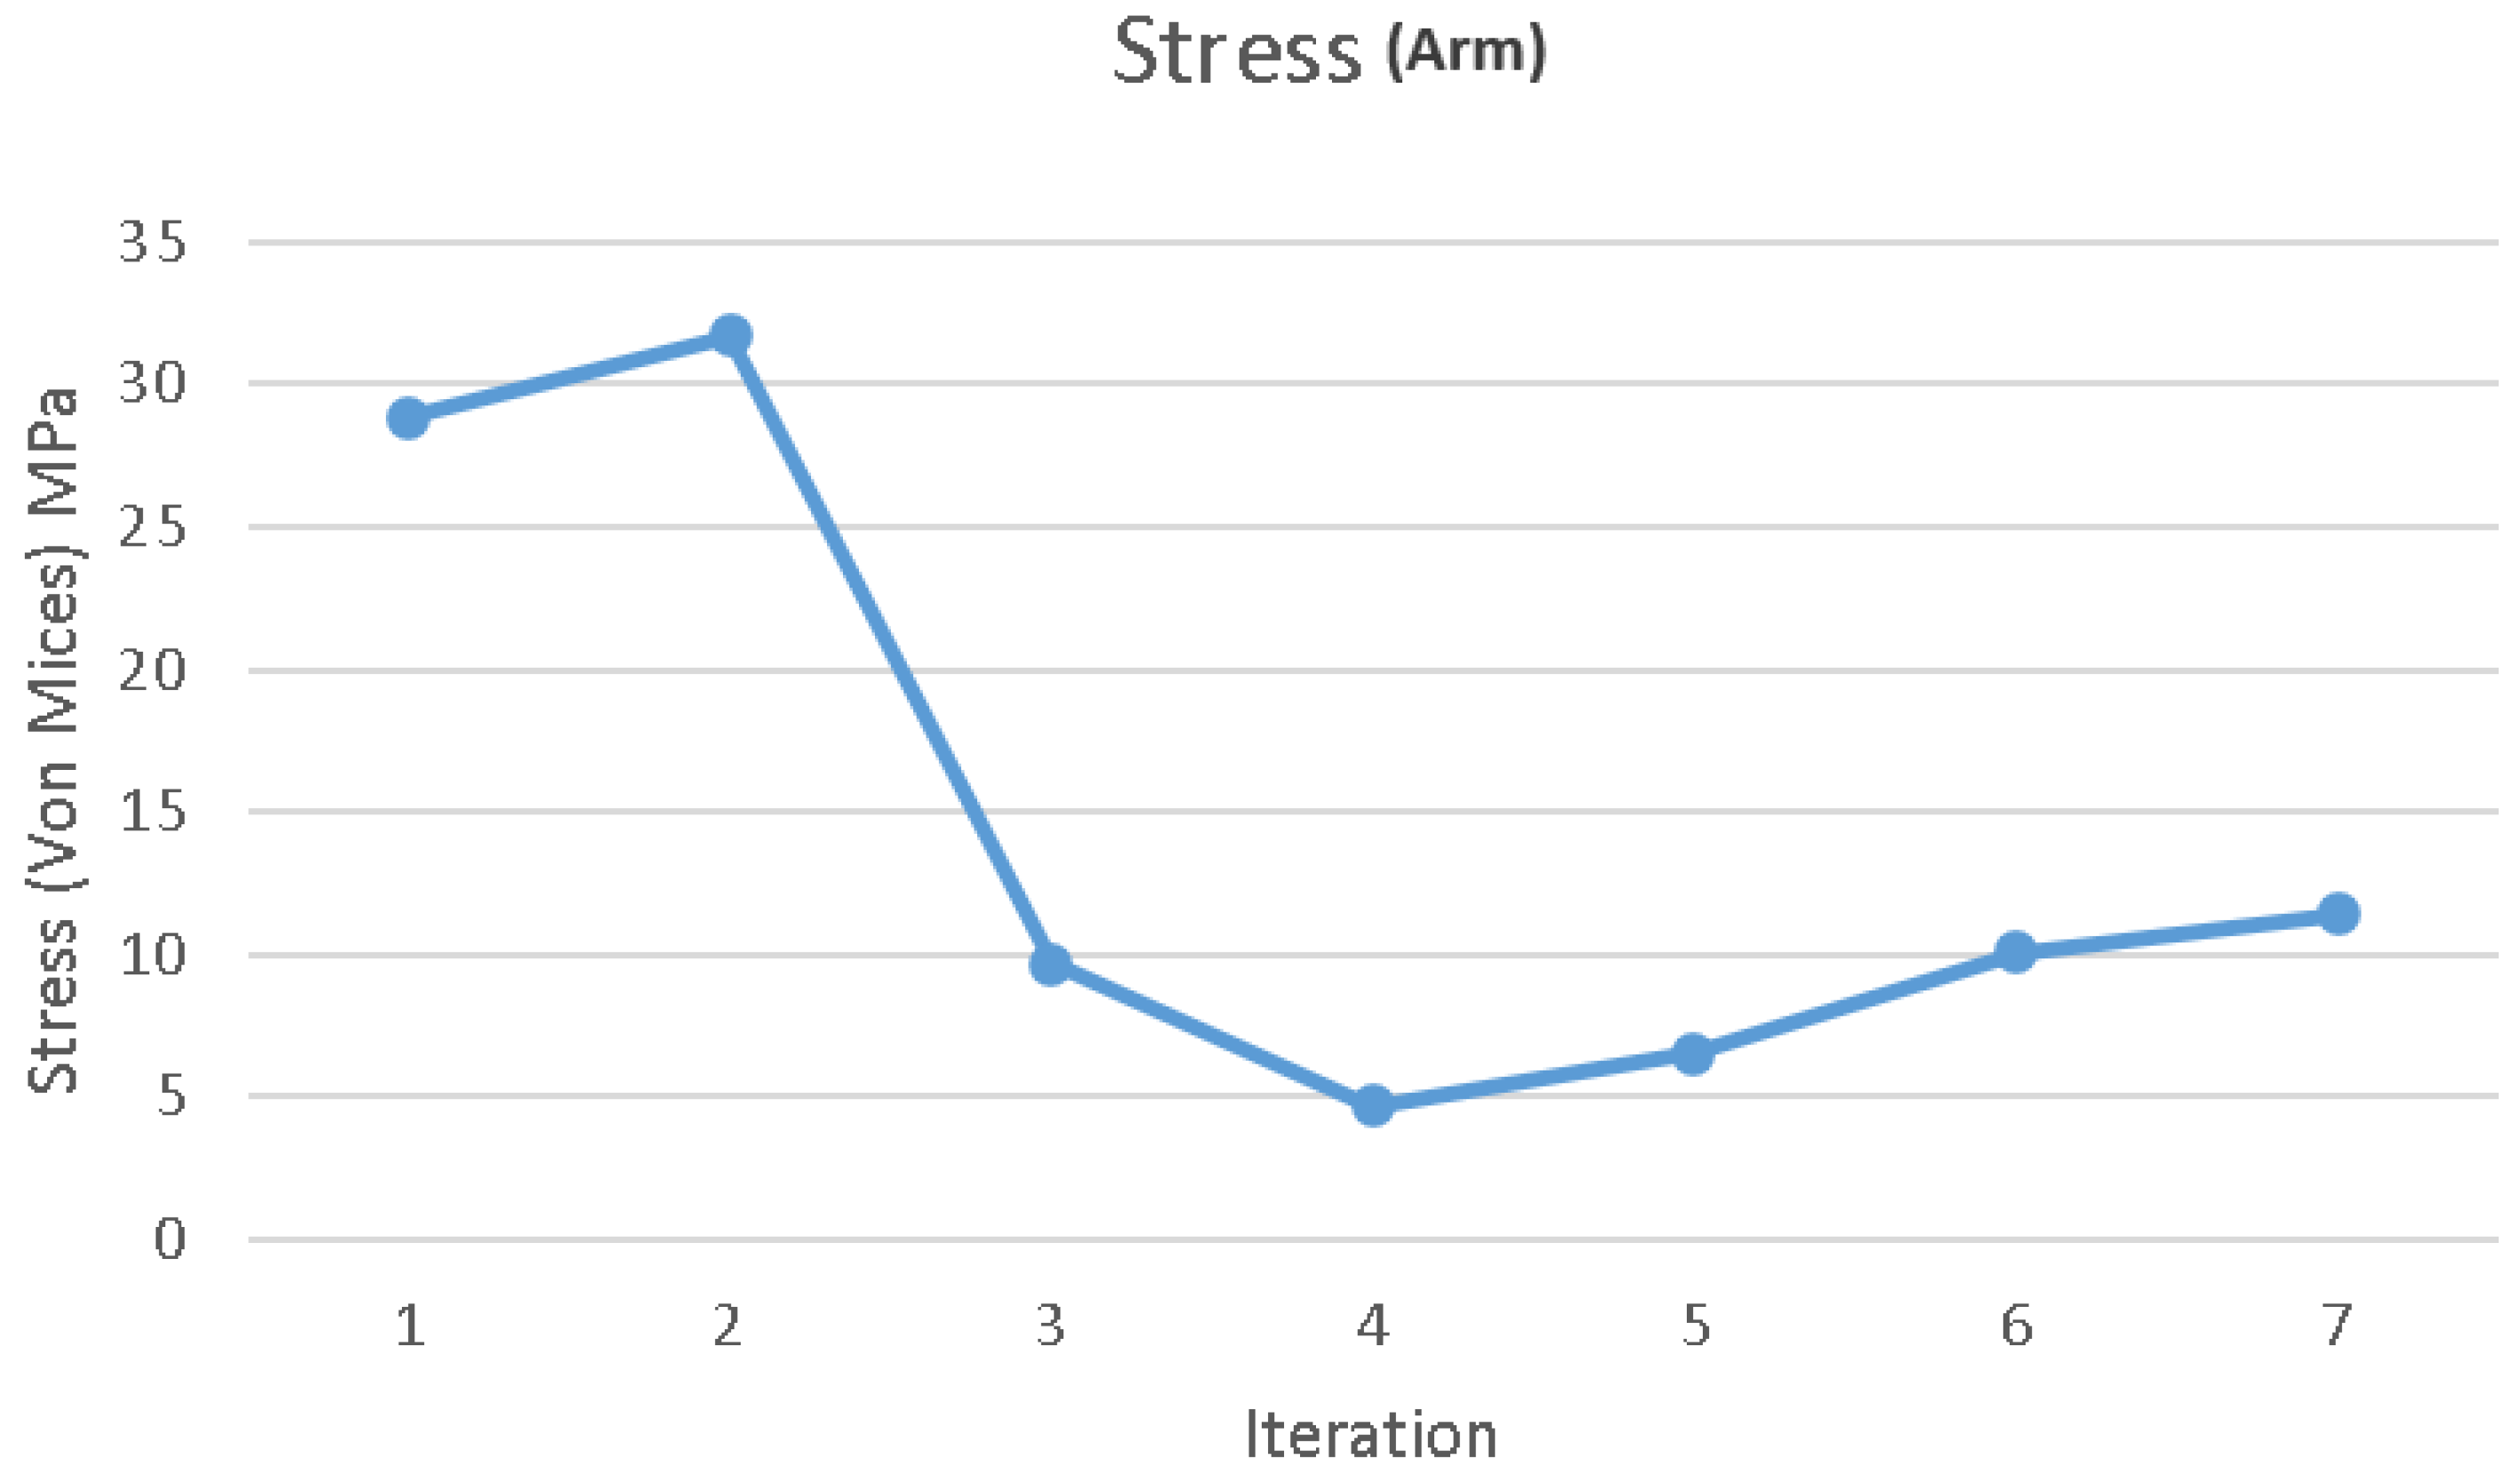
Figure 9 shows the stress profiles of the different designs.
3.4.8. Static Stress and Strain Analysis
A static structural analysis was also conducted in SolidWorks to find out the capability of the frame to withstand flight loads. Motor, battery, aerodynamic drag, and maximum acceleration loads were considered. The arms were restrained at bolt locations, with the motor mount, which was located at the farthest position from the fuselage, taking the combined thrust, drag, and arm weight. The max vertical load of 10 Newtons was applied to each arm.
3.4.9. Displacement Analysis
A displacement test was conducted to measure the deformation of the drone frame since it is subjected to the same load utilized in the structural test. The max load of 10 Newtons was applied to each arm. This was to ensure that the deformation is within a set limit that guarantees stability during flight. The deflection under maximum load conditions was to be limited to 0.05 mm to ensure that the drone frame is rigid and stable enough during flight.
3.5. Torsion and Buckling Analysis
During flight, the drone will experience a diverse range of forces; therefore, the buckling and torsion analysis of the drone arms is required, as they are the parts that will undergo the most amount of stress. The torsion analysis simulates the torsional forces acting on the drone arms at a torque of 1 Nm, which is sufficiently high for such a scale. We can see that the stresses in the arm do not exceed the elastic limit of PLA, which indicates that failure due to torsion will not occur and the design is safe and will not fail due to torsion as can be seen in
Figure 13.
The buckling analysis was conducted with a force of 10 N on the drone arm, and the stresses were observed to be within the elastic limit of PLA; thus, the design will not buckle under normal flight conditions, this can be verified from
Figure 14.
3.5.1. Aerodynamic Flow Simulation (CFD)
Computational fluid dynamics (CFD) was utilized to investigate the aerodynamic efficiency and stability of the drone frame by taking into account the drag coefficient and air flow distribution over it. The investigation also aimed to monitor the development of vortices behind the back propellers and body, which interfere with propeller functioning and flight stability. It is vital to control such vortices in order to improve the overall aerodynamic efficiency of the drone and extend battery life. The CFD software uses Reynolds-averaged Navier–Stokes equations for the aerodynamic analysis of the model, which are as follows:
Classic notation
These are simplified equations and are modified according to the needs of the problem.
3.5.2. Fatigue Analysis
The fatigue test was intended to predict the drone frame’s life under cyclic loading conditions that simulate the stresses due to repeated takeoffs, landings, and high-angle flight maneuvers. The max load of 10 Newtons was applied to each arm with a zero-based cyclic loading condition to simulate takeoff and landing. These scenarios put fluctuating loads on the structure, providing a realistic estimate of the mechanical loads prevailing under normal operations.
3.6. Three-Dimensional Printing and Prototyping
The evolution of 3D printing has greatly boosted prototype production through fast, precise, and flexible production. Prototype frames functional for the drone were produced for the conduct of this study using a Creality Ender K1 FDM printer and PLA filament. This material was preferred due to its user-friendliness, low cost, and eco-friendliness derived from biodegradable sources such as cornstarch. Print settings were calibrated to achieve a balance of mechanical integrity, dimensional tolerance, material usage, and print time.
The printer’s hotbed was at 60 °C to ensure appropriate adhesion of the initial layer as well as prevent warping. A 210 °C temperature in the nozzle ensured smooth extrusion of PLA, preventing defects like stringing and poor adhesion of layers. Additionally, 15% infill density was utilized to maintain the structural integrity while reducing material consumption and printing time. The relationship between mechanical integrity and infill density has been thoroughly studied and documented by Umer et al. [
11]. A layer thickness of 0.2 mm was used to achieve a good balance between the quality of the surface finish and printing speed.
These settings provided prototypes with fair mechanical integrity and dimensional precision suitable for performance analysis. Post-processing activities included support structure removal, light sanding to enhance surface finish, and coating or painting optionally for better looks and sustainability. This process allowed quick and affordable production of physical prototypes, bridging virtual design and reality verification.
4. Results and Discussion
4.1. Static Stress and Strain Analysis
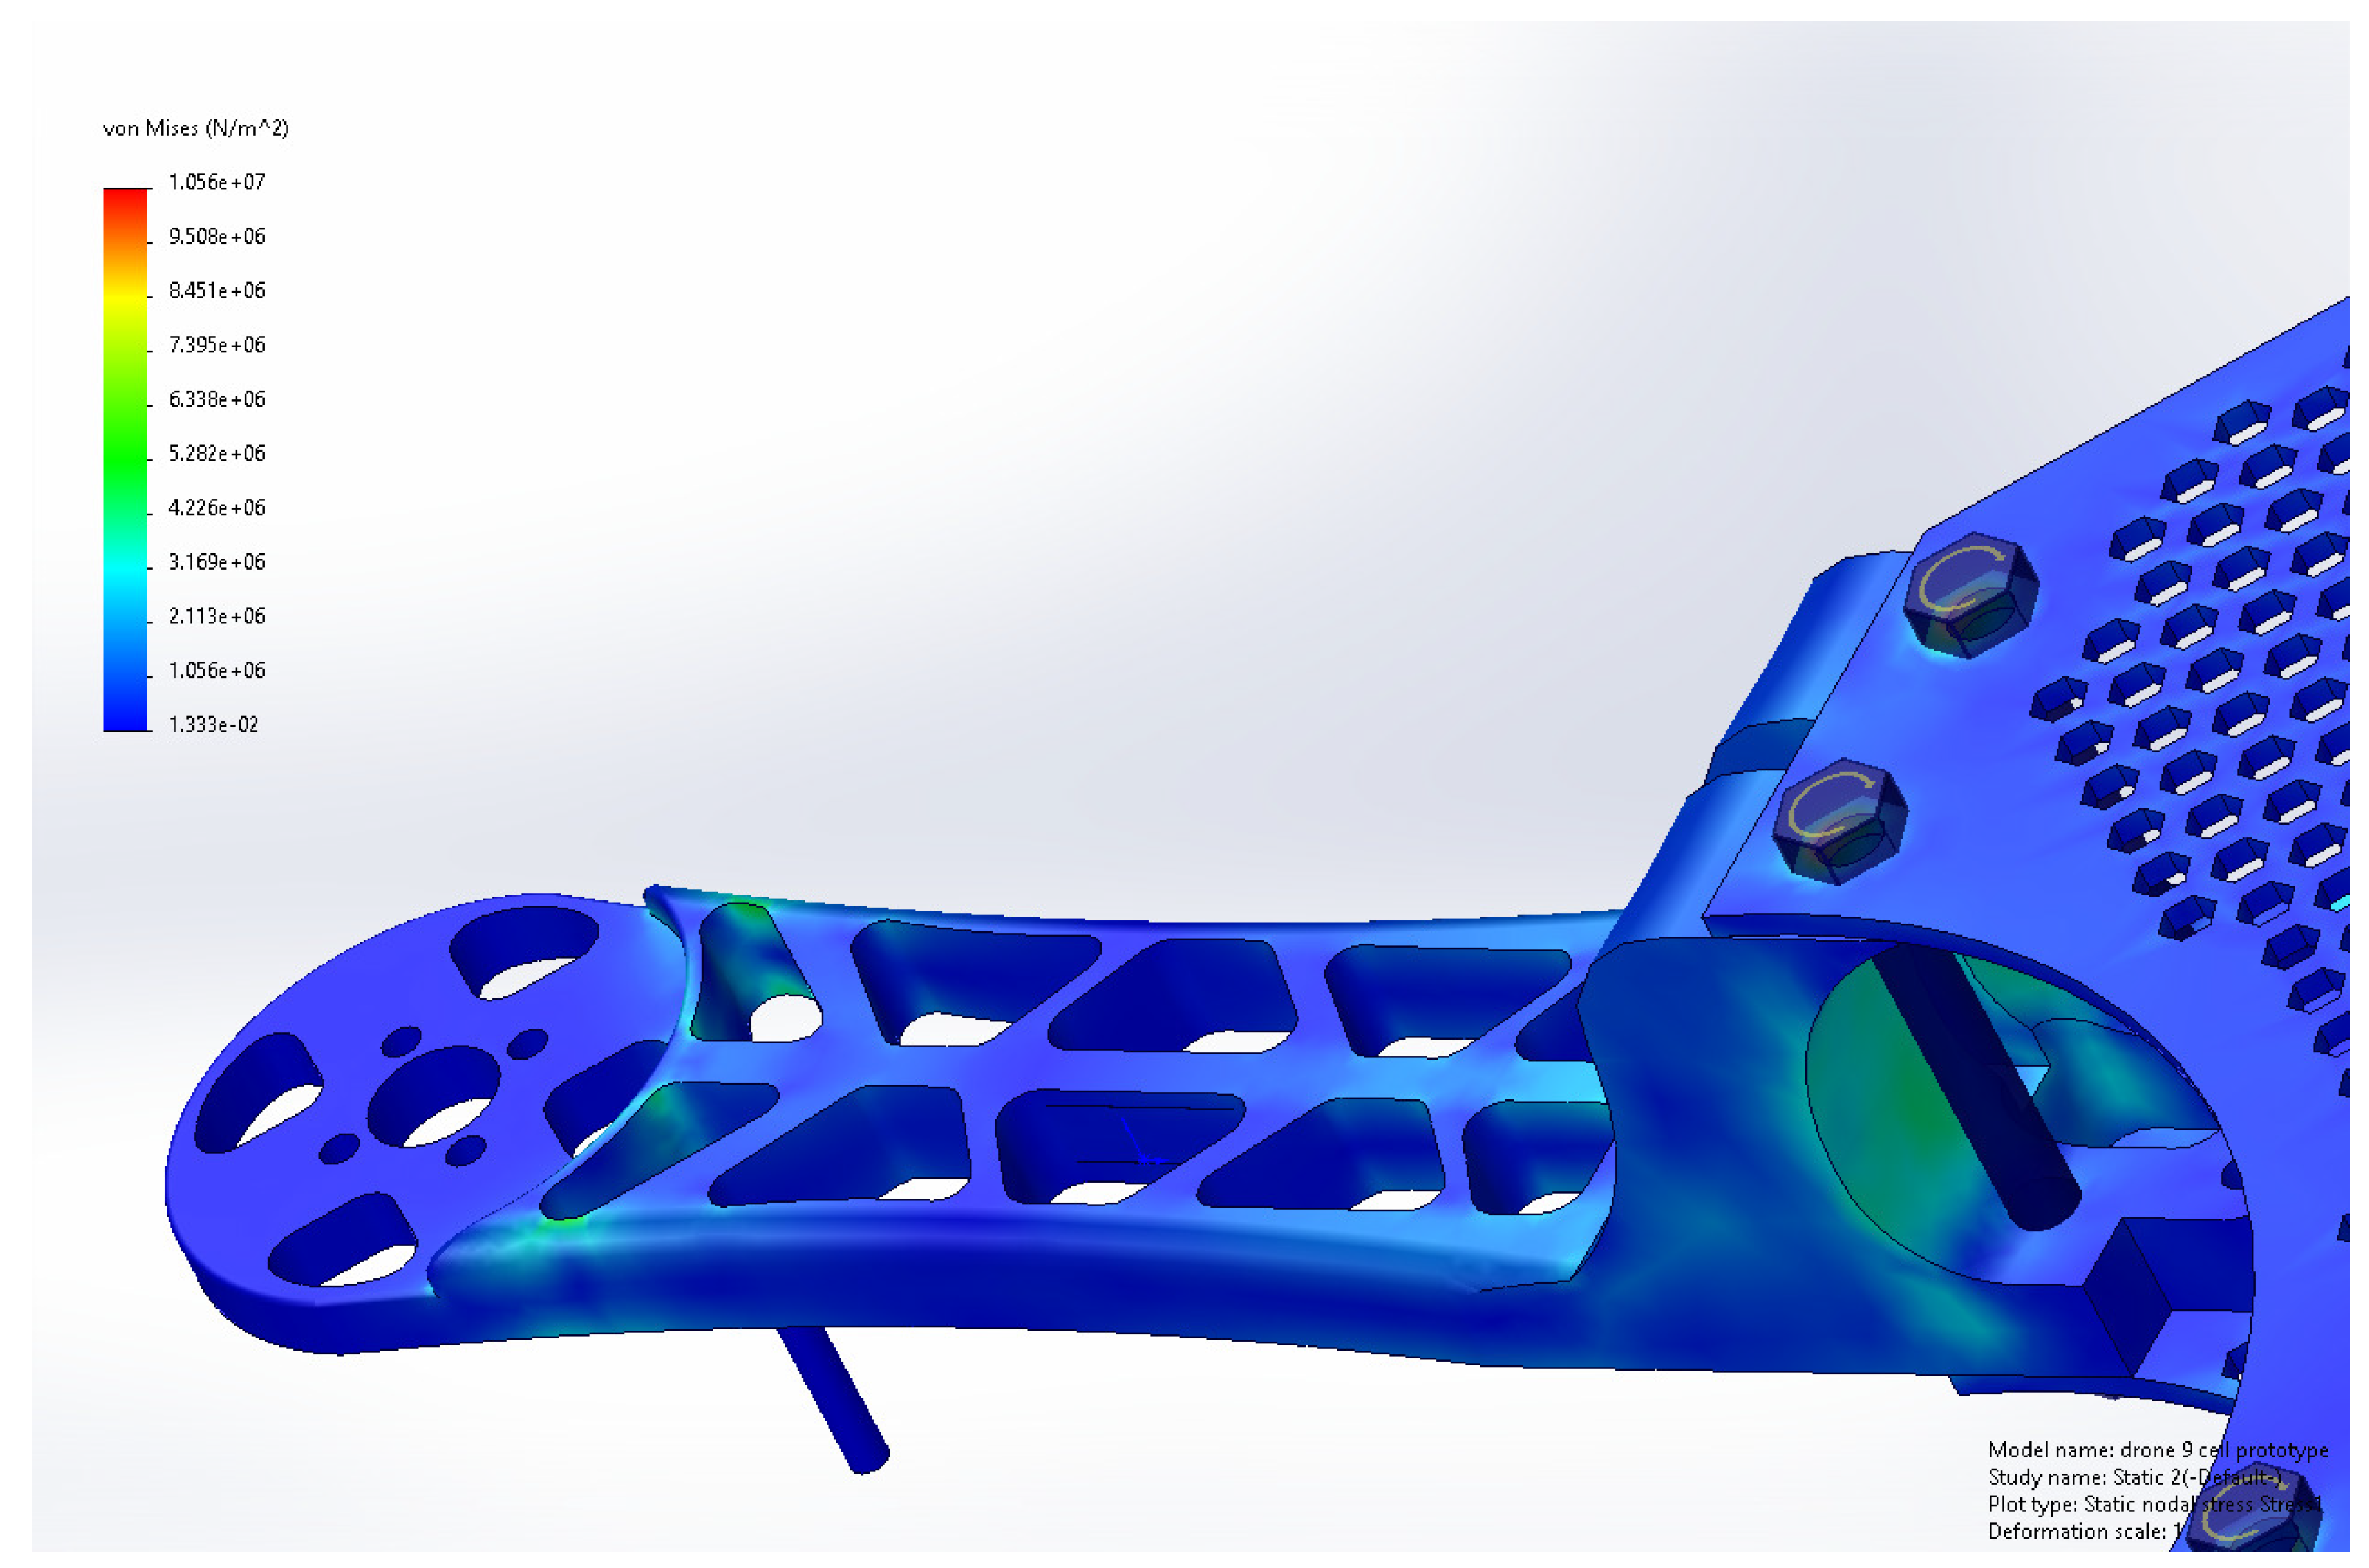
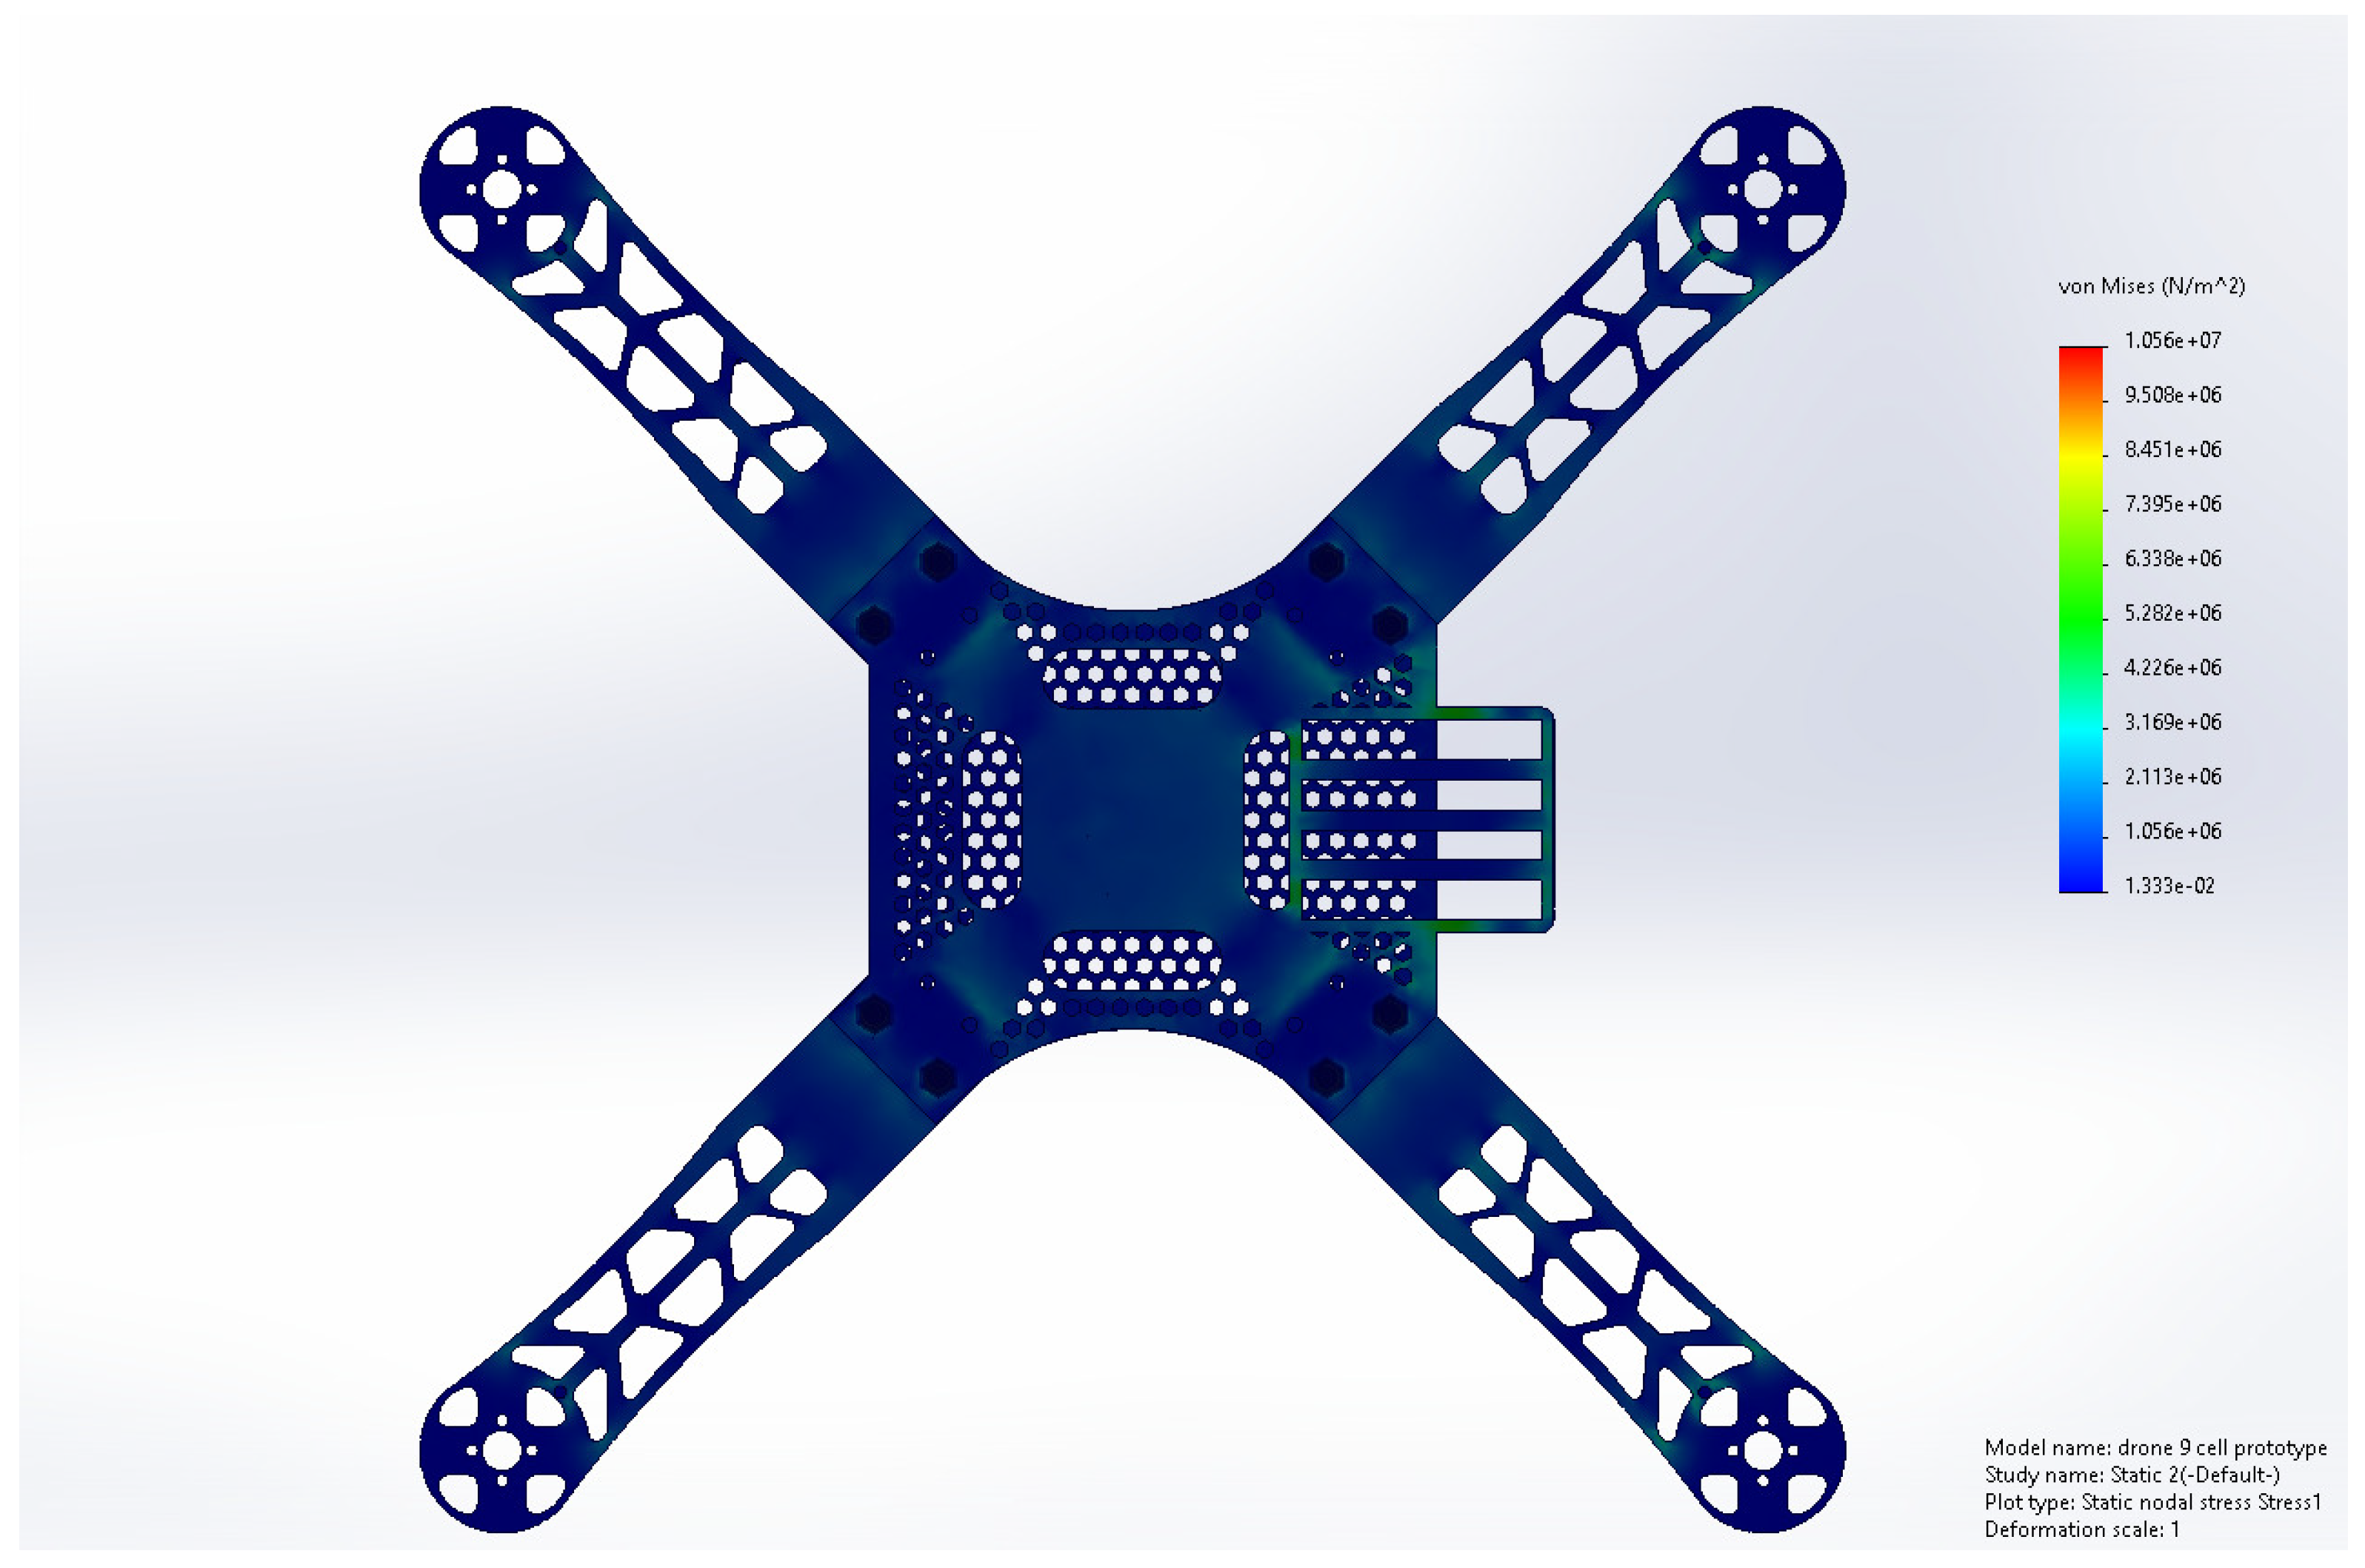
The static stress analysis conducted identified some areas of particular concern where the stress levels were significantly higher than the overall mean. These areas of high-stress concentration were between the contact of the motor mounts and the bolt joints used to fasten the arms to the central body of the fuselage. Higher stresses of this nature indicate areas prone to plastic deformation or structural failure under flight loads. In order to mitigate these risks and achieve higher reliability, these areas must be made stronger either by optimizing the geometry or by applying materials of higher mechanical strength. This will assist in increasing the structural strength of the drone and safety during flight under conditions of stressful flight.
Design Modifications
The areas surrounding the motor mounts and arm connections were reinforced by thickening the material and the inclusion of ribs to give added support. These changes improve the durability of these areas of stress by distributing forces more evenly and preventing the likelihood of deformation. Furthermore, using stronger yet lighter materials like Nylon or carbon fiber composites in these key areas can also assist in preventing failure during flight and minimizing weight, thus enhancing the drone’s operating performance further.
4.2. Displacement Analysis
The maximum measured displacement of 0.05 mm at motor mount positions indicates that the drone frame is sufficiently stiff for regular flight conditions. That deformation at the joints is minimal indicates that aerodynamic stability will be maintained, even in high-load conditions, because these movements are well within acceptable structural limits as shown in the
Figure 15,
Figure 16 and
Figure 17.
4.2.1. Design Modifications
Reinforcement of attachment points in the regions near arm joints to further reduce displacement and Modification of the joint design to better distribute the forces and minimize displacement during flight by adding reinforcing ribs.
4.2.2. Weight Reduction
A topology study was conducted in the arms to check the regions where the minimum stresses act under different loading conditions to analyze where the material can be safely minimized without having any appreciable effects on the strength of the frame.
Figure 18 shows the optimized arm.
4.3. Aerodynamic Flow Simulation (CFD)
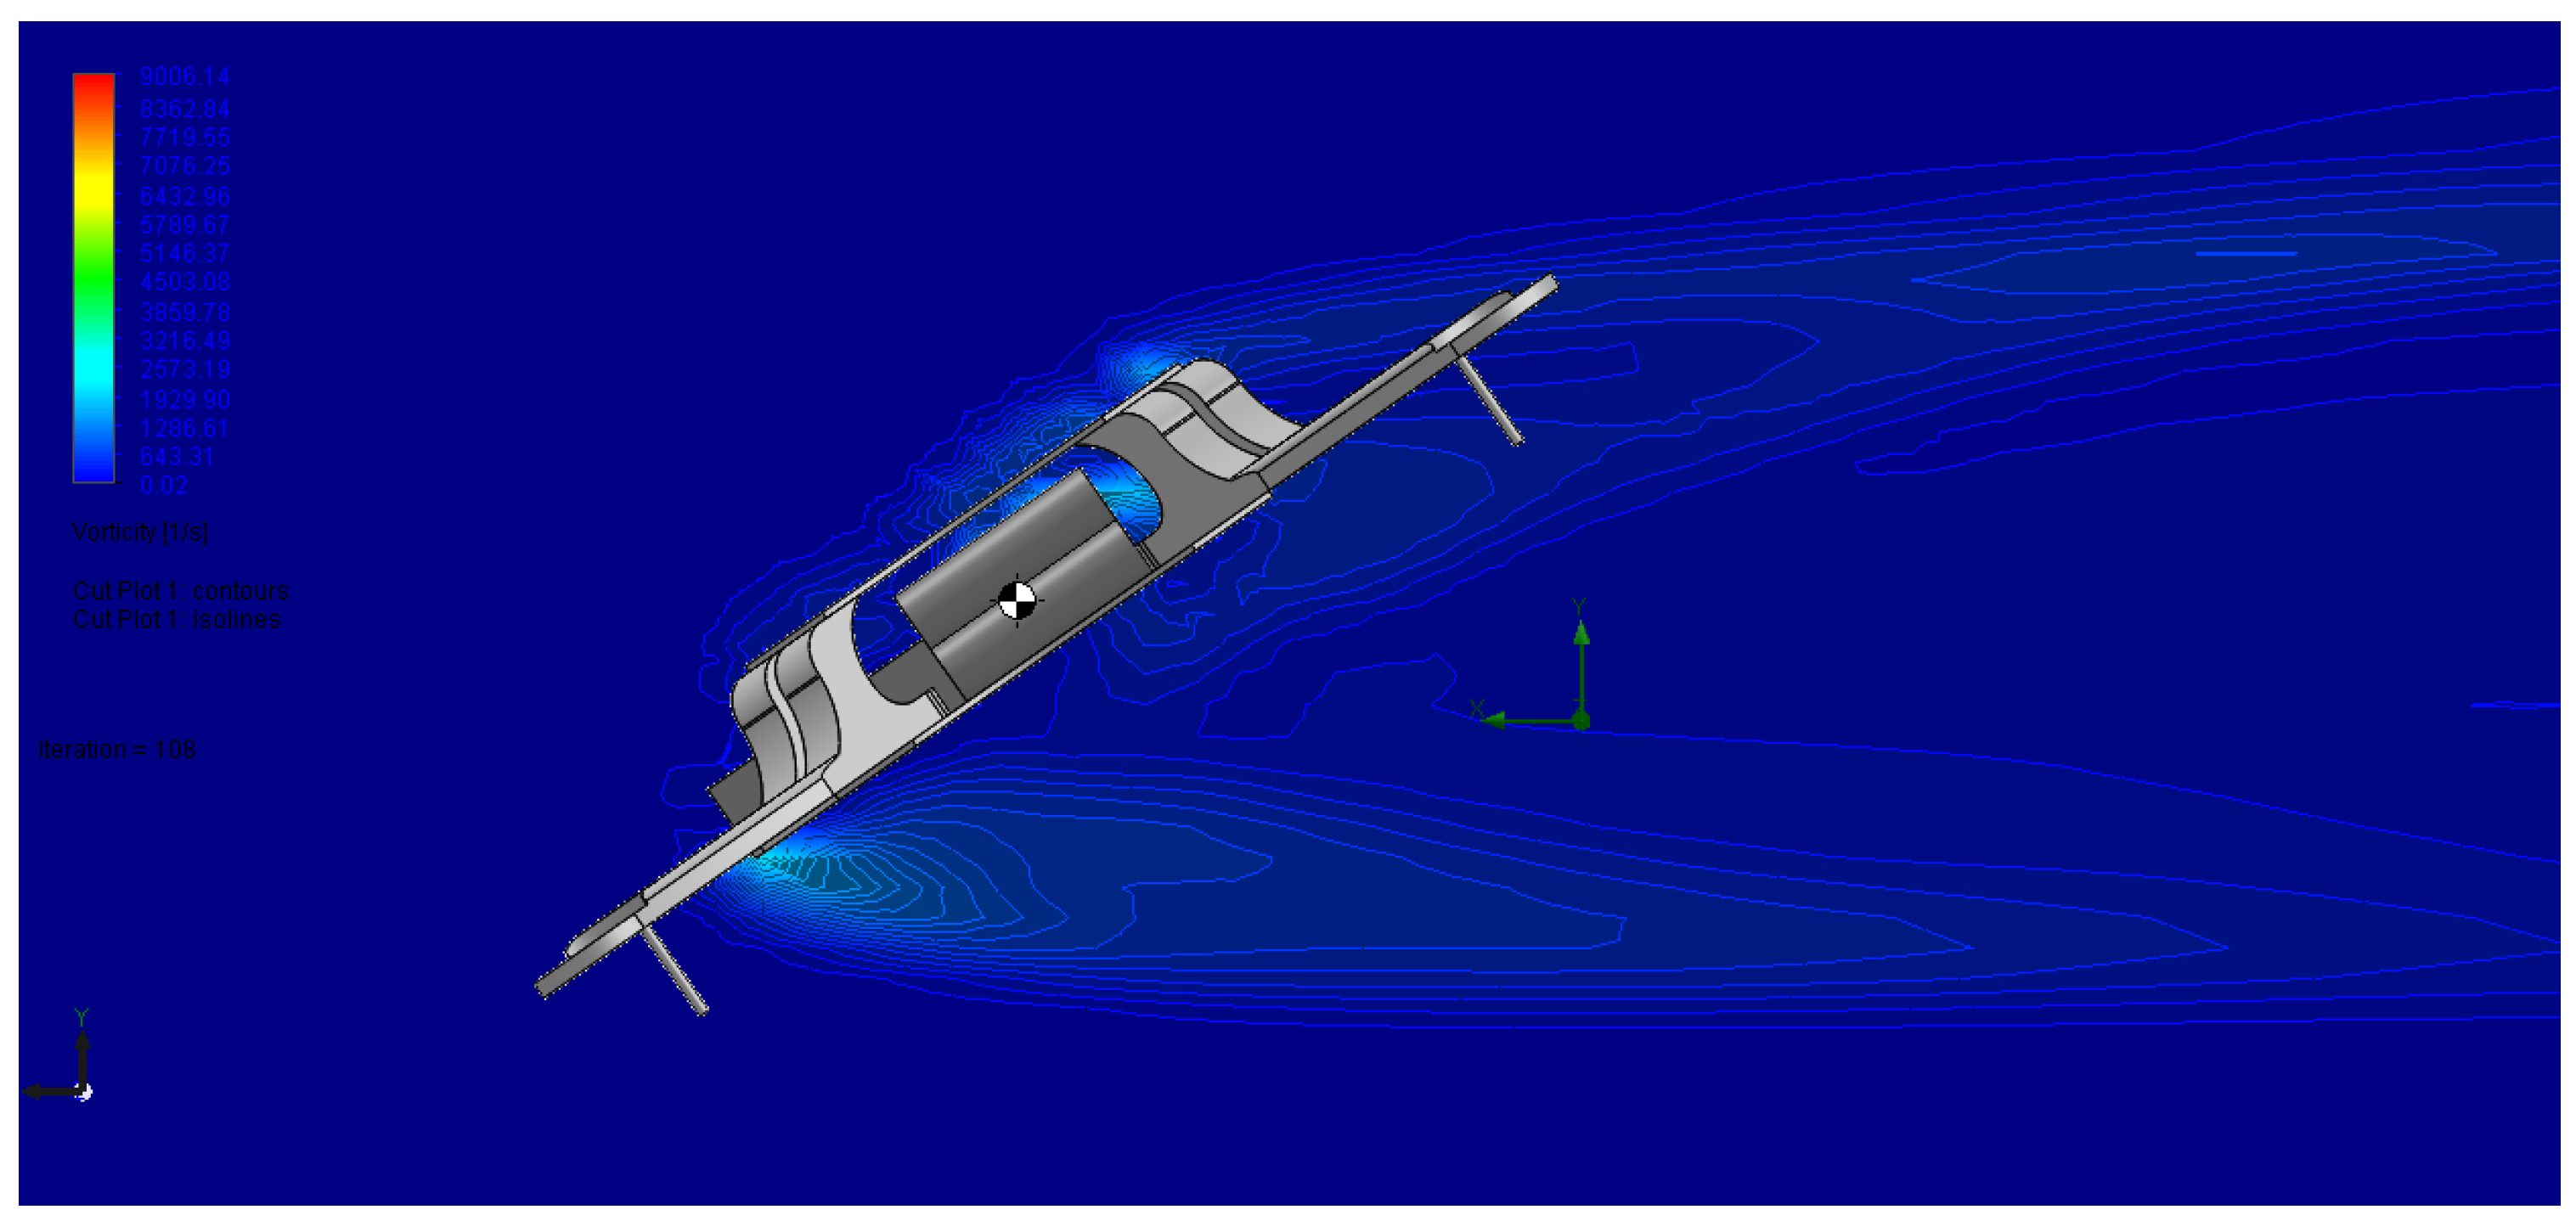
The CFD simulation showed that the rear base of the drone was subjected to strong turbulence and low-pressure areas, which resulted in higher drag and the generation of downforce with a negative effect on aerodynamic efficiency. To correct this, a honeycomb configuration was introduced into the fuselage structure, which enhanced flow between the diverse pressure zones and consequently improved the aerodynamics of the drone, as can be seen in the CFD images in
Figure 19,
Figure 20,
Figure 21 and
Figure 22.
Design Modifications
Streamline the rear section of the fuselage to reduce turbulence and improve aerodynamic performance. Adjust the frame’s geometry to reduce drag and improve overall flight efficiency.
4.4. Fatigue Analysis
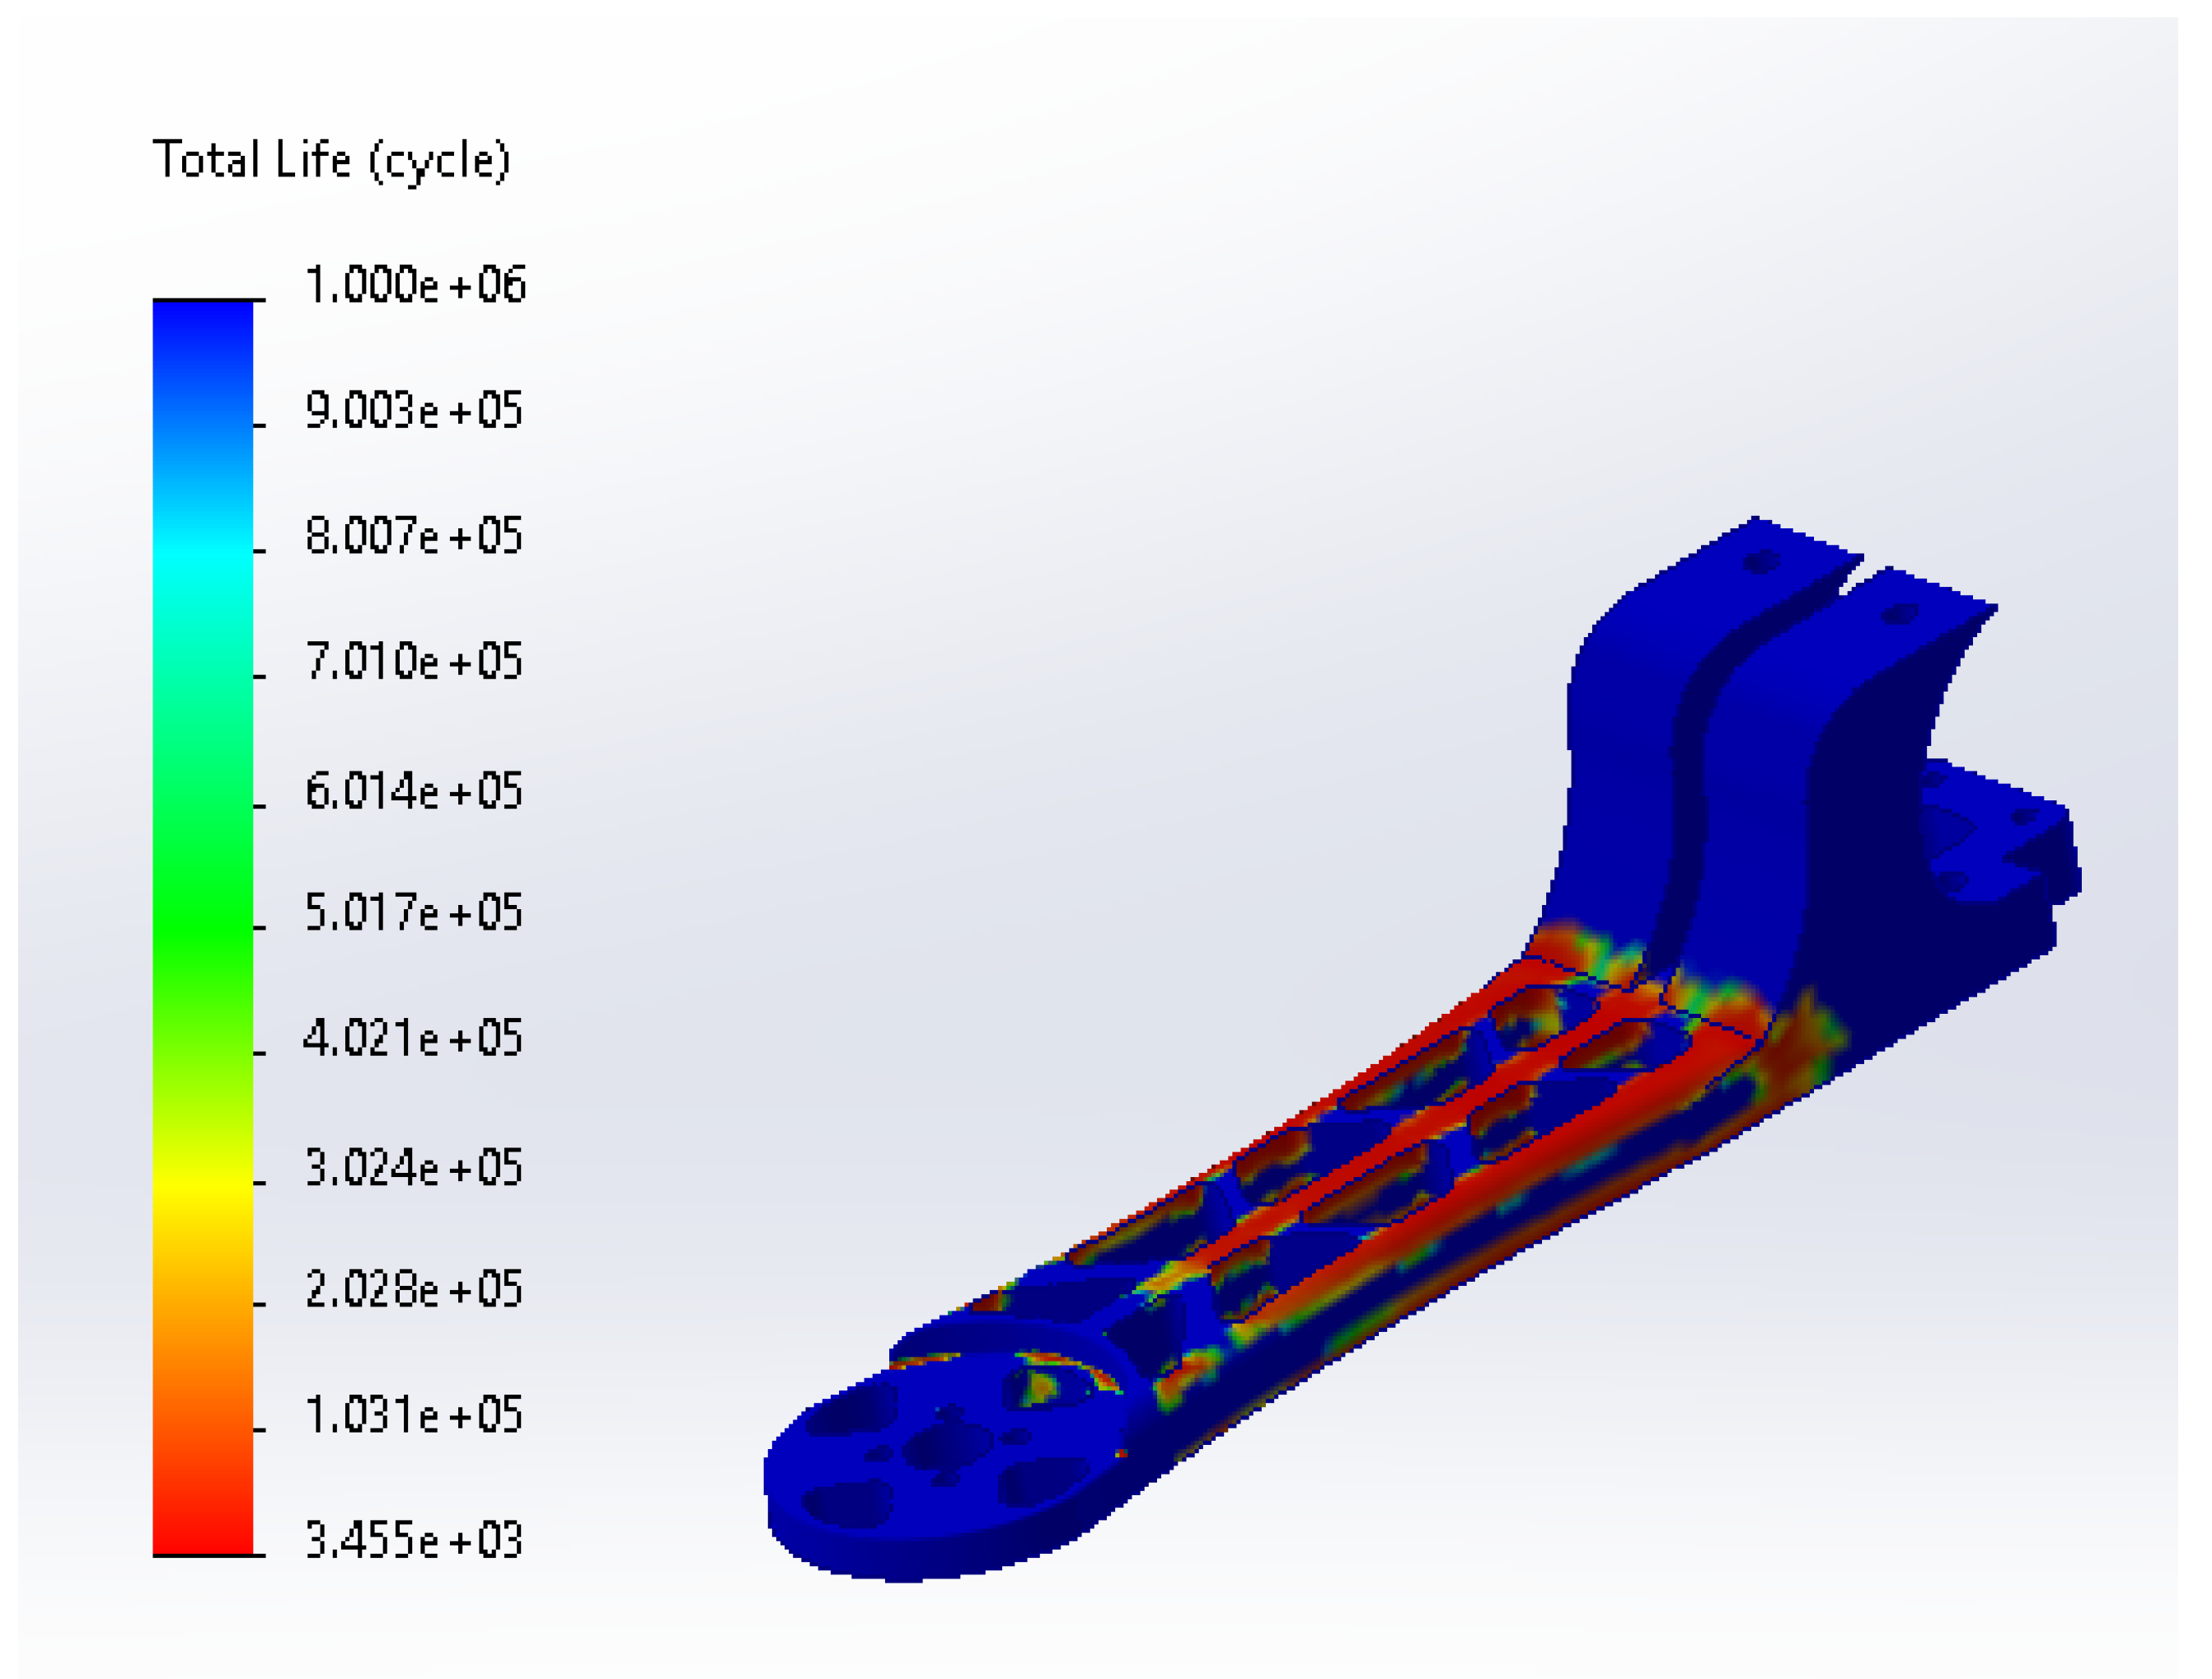
Fatigue behavior evaluation shows that the frame of the drone has nearly 3455 operating flight cycles before it starts experiencing quantifiable fatigue damage. The areas under the highest risk of failure are at the interfaces between the arms and the fuselage, where there is peak stress concentration due to repeated loading. The fatigue profile of the drone arms is given in
Figure 23.
Design Modifications
Increase the material thickness at high-stress areas due to the ease of using a single material for the entire print. Reinforce critical areas exposed to cyclic loads by introducing structural reinforcements and adding more material to enhance fatigue resistance.
The
Figure 24 and
Figure 25 show the completed print and the printing process of the frame.
Table 4 provides a comparative analysis of this paper.
The values for the coefficient of drag vary with the angle in accordance with the
Table 5.
The table indicates that the drag coefficient increases as the pitch angle of the drone increases. This is because, as the pitch angle increases, the effective frontal area of the drone facing the freestream flow also increases, which results in a corresponding rise in the drag coefficient of the drone.
5. Conclusions
This study provides a detailed analysis of a PLA-printed drone frame through the use of advanced SolidWorks simulations to explore its strength and aerodynamics. There was also fatigue analysis to predict its long-term strength, in addition to topology optimization analysis for weight-reduction potential determination. Some of the findings include: The motor mount-to-arm interfaces and the arm joints experience increased stress concentrations, with consideration to reinforce to prevent structural failure at high load conditions. PLA is a light and economical option for drone frameworks but is limited by its inherent UV sensitivity to be used for extended outdoor missions. Modification for enhanced UV resistance or application of protective coatings is recommended for extended field deployment. Large-scale turbulence and high-pressure regions were observed beneath the rear fuselage section of the drone. These effects can be reduced through the smoothing of the aerodynamic profile of the fuselage to a smoother shape and the reduction in size or closing of the big openings to improve flow and reduce drag. Future efforts will be focused on production and iteratively updating the drone frame through 3D printing, with experimental validation of simulated results. An examination of alternative materials, such as Nylon and CFRPs, will be explored to enhance fatigue resistance and lifespan and reduce total weight, hence making the frame ideal for long-duration UAV applications.
The following are the photographs of the finished drone body.
Author Contributions
Conceptualization, F.K., A.H. and S.M.-U.-N.; methodology, S.J., M.I.M. and F.Q.K.; software, F.K. and M.I.M.; validation, B.M.A., S.M.-U.-N. and S.J.; formal analysis, B.K.; investigation, A.B. and M.I.M.; resources, F.K. and S.J.; data curation, A.H.; writing S.M.-U.-N. and A.H.—original draft preparation, S.J. and B.M.A.; writing—review and editing, M.I.M., F.K. and S.M.-U.-N.; visualization, F.Q.K.; supervision, S.M.-U.-N. and S.J.; project administration, B.K., F.K. and A.H.; funding acquisition, F.K. All authors have read and agreed to the published version of the manuscript.
Funding
The project was funded by KAU Endowment (WAQF) at king Abdulaziz University, Jeddah, Saudi Arabia. The authors, therefore, acknowledge with thanks WAQF and the Deanship of Scientific Research (DSR) for technical and financial support.
Data Availability Statement
Data will be made available upon request to the corresponding author.
Acknowledgments
The project was funded by KAU Endowment (WAQF) at king Abdulaziz University, Jeddah, Saudi Arabia. The authors, therefore, acknowledge with thanks WAQF and the Deanship of Scientific Research (DSR) for technical and financial support.
Conflicts of Interest
The authors declare no conflict of interest.
References
- Asif, S.H.; Hasan, K.; Dhar, N.R. Topology Optimization and 3D Printing of a Unibody Quadcopter Airframe. IOP Conf. Ser. Mater. Sci. Eng. 2024, 1305, 012021. [Google Scholar] [CrossRef]
- Liu, J.; Huang, J.; Zhang, C.; Yu, H. Topology Optimization and Additive Manufacturing of Fiber-Reinforced UAV Components. In Proceedings of the International Conference on Autonomous Unmanned Systems, Changsha, China, 24–26 September 2021; Springer: Berlin/Heidelberg, Germany, 2021; pp. 2734–2743. [Google Scholar]
- Šančić, T.; Brčić, M.; Kotarski, D.; Łukaszewicz, A. Experimental characterization of composite-printed materials for the production of multirotor UAV airframe parts. Materials 2023, 16, 5060. [Google Scholar] [CrossRef]
- Yap, Y.L.; Toh, W.; Giam, A.; Yong, F.R.; Chan, K.I.; Tay, J.W.S.; Teong, S.S.; Lin, R.; Ng, T.Y. Topology Optimization and 3D Printing of Micro-Drone: Numerical Design with Experimental Testing. Int. J. Mech. Sci. 2023, 237, 107771. [Google Scholar] [CrossRef]
- Kapsalis, S.; Panagiotou, P.; Yakinthos, K. CFD-Aided Optimization of a Tactical Blended-Wing-Body UAV Platform Using the Taguchi Method. Aerosp. Sci. Technol. 2021, 108, 106395. [Google Scholar] [CrossRef]
- Öztürk, Ş.; Örs, İ. An Overview for Effects on Aerodynamic Performance of Using Winglets and Wingtip Devices on Aircraft. Int. J. Aeronaut. Astronaut. 2020, 1, 1–11. [Google Scholar]
- Lin, P.; Wu, J.; Lu, L.; Xiong, N.; Liu, D.; Su, J.; Liu, G.; Tao, Y.; Wu, J.; Liu, X. Investigation on the Reynolds number effect of a flying wing model with large sweep angle and small aspect ratio. Aerospace 2022, 9, 523. [Google Scholar] [CrossRef]
- Jamadar, I.M.; Kamate, P.; Samal, P.K. Evaluation of Fatigue Characteristics of 3D Printed/Composites Reinforced with Carbon Fiber Using Design of Experiments. Polym. Compos. 2024, 45, 17134–17149. [Google Scholar] [CrossRef]
- Rodríguez-Reyna, S.; Díaz-Aguilera, J.; Acevedo-Parra, H.; García, C.J.; Gutierrez-Castañeda, E.J.; Tapia, F. Design and optimization methodology for different 3D processed materials (PLA, ABS and carbon fiber reinforced nylon PA12) subjected to static and dynamic loads. J. Mech. Behav. Biomed. Mater. 2024, 150, 106257. [Google Scholar] [CrossRef] [PubMed]
- Hajilou, N.; Mostafayi, S.S.; Yarin, A.L.; Shokuhfar, T. A Comparative Review on Biodegradation of Poly (Lactic Acid) in Soil, Compost, Water, and Wastewater Environments: Incorporating Mathematical Modeling Perspectives. Appl. Chem. 2024, 5, 1. [Google Scholar] [CrossRef]
- Umer, M.H.; Rehman, M.U.; Ali, S.; Raza, A.; Muzammil, L.; Ijaz, M.S.; Khan, M.B.; Zafar, M.Q. Significance of Infill Density on Mechanical Performance in Fused Deposition Modeling. In Proceedings of the MATEC Web of Conferences, EDP Sciences, Chennai, India, 14–15 February 2024; Volume 398, p. 01030. [Google Scholar]
- Tang, J.; Mueller, M.W. PairTilt: Design and Control of an Active Tilt-Rotor Quadcopter for Improved Efficiency and Agility. Adv. Intell. Syst. 2025, 7, 2400494. [Google Scholar] [CrossRef]
- Barua, A.; Singha, S. Simulation Studies for Structural Optimization of a 3D Printable Quadcopter. In Proceedings of the International Conference on Mechanical, Industrial and Materials Engineering (ICMIME2024), Rajshahi, Bangladesh, 11–13 December 2024; pp. 1–6. [Google Scholar]
- Balayan, A.; Mallick, R.; Dwivedi, S.; Saxena, S.; Haorongbam, B.; Sharma, A. Optimal Design of Quadcopter Chassis Using Generative Design and Lightweight Materials to Advance Precision Agriculture. Machines 2024, 12, 187. [Google Scholar] [CrossRef]
- Kamonsukyunyong, P.; Katongtung, T.; Srinophakun, T.R.; Sukpancharoen, S. Optimization of 3D Printed Drone Performance Using Synergistic Multi Algorithms. Int. J. Thermofluids 2025, 26, 101058. [Google Scholar] [CrossRef]
- Osama, J.; Al-Zogphy, O.; Elnady, A. CFD Analysis of Quadcopter. In Proceedings of the 4th International Undergraduate Research Conference (IUGRC 2019), Cairo, Egypt, 29 July–1 August 2019; pp. 1–4. [Google Scholar]
- Ahmad, F.; Kumar, P.; Khan, Y.; Patil, P.P. Flow and Structural Analysis of a Quadcopter UAV. Int. J. Adv. Res. Eng. Technol. 2020, 11, 1–9. [Google Scholar]
- Javir, A.V.; Pawar, K.; Dhudum, S.; Patale, N.; Patil, S. Design, Analysis and Fabrication of Quadcopter. J. Int. Assoc. Adv. Technol. Sci. 2015, 16, 1–12. [Google Scholar] [CrossRef]
- Musa, S. Techniques for Quadcopter Modelling & Design: A Review. J. Unmanned Syst. Technol. 2018, 5. [Google Scholar] [CrossRef]
Figure 1.
Side view of the drone frame.
Figure 1.
Side view of the drone frame.
Figure 2.
Top view of the drone frame.
Figure 2.
Top view of the drone frame.
Figure 3.
Arm top view: top view of the drone arm.
Figure 3.
Arm top view: top view of the drone arm.
Figure 4.
Design steps for arms: In the design steps, material reduction can be seen at each step. (a) step 1 (b) step 2 (c) step 3 (d) step 4 (e) sectioned view.
Figure 4.
Design steps for arms: In the design steps, material reduction can be seen at each step. (a) step 1 (b) step 2 (c) step 3 (d) step 4 (e) sectioned view.
Figure 5.
(a) top plate of fuselage, first iteration (b) bottom plate of fuselage, first iteration.
Figure 5.
(a) top plate of fuselage, first iteration (b) bottom plate of fuselage, first iteration.
Figure 6.
Top plate of fuselage, final iteration.
Figure 6.
Top plate of fuselage, final iteration.
Figure 7.
(a) bottom plate of fuselage, second iteration (b) bottom plate of fuselage, final iteration.
Figure 7.
(a) bottom plate of fuselage, second iteration (b) bottom plate of fuselage, final iteration.
Figure 8.
Arm iterations: (a) first iteration-completely solid (b) second iteration-lengthwise slots (c) third iteration-breadth-wise slots (d) fourth iteration-honeycomb pattern (e) fifth iteration-custom cutouts (f) sixth iteration-custom cutouts with fillets (g) seventh iteration-custom cutouts with fillets and internal cavities.
Figure 9.
Stress profiles (arm): (a) first iteration stress profile (b) second iteration stress profile (c) third iteration stress profile (d) fourth iteration stress profile (e) fifth iteration stress profile (f) sixth iteration stress profile (g) seventh iteration stress profile.
Figure 9.
Stress profiles (arm): (a) first iteration stress profile (b) second iteration stress profile (c) third iteration stress profile (d) fourth iteration stress profile (e) fifth iteration stress profile (f) sixth iteration stress profile (g) seventh iteration stress profile.
Figure 10.
Mass variation: Mass variation of the drone arm across successive design iterations.
Figure 10.
Mass variation: Mass variation of the drone arm across successive design iterations.
Figure 11.
Stress variation: Variation in max stress of the drone arm across successive design iterations.
Figure 11.
Stress variation: Variation in max stress of the drone arm across successive design iterations.
Figure 12.
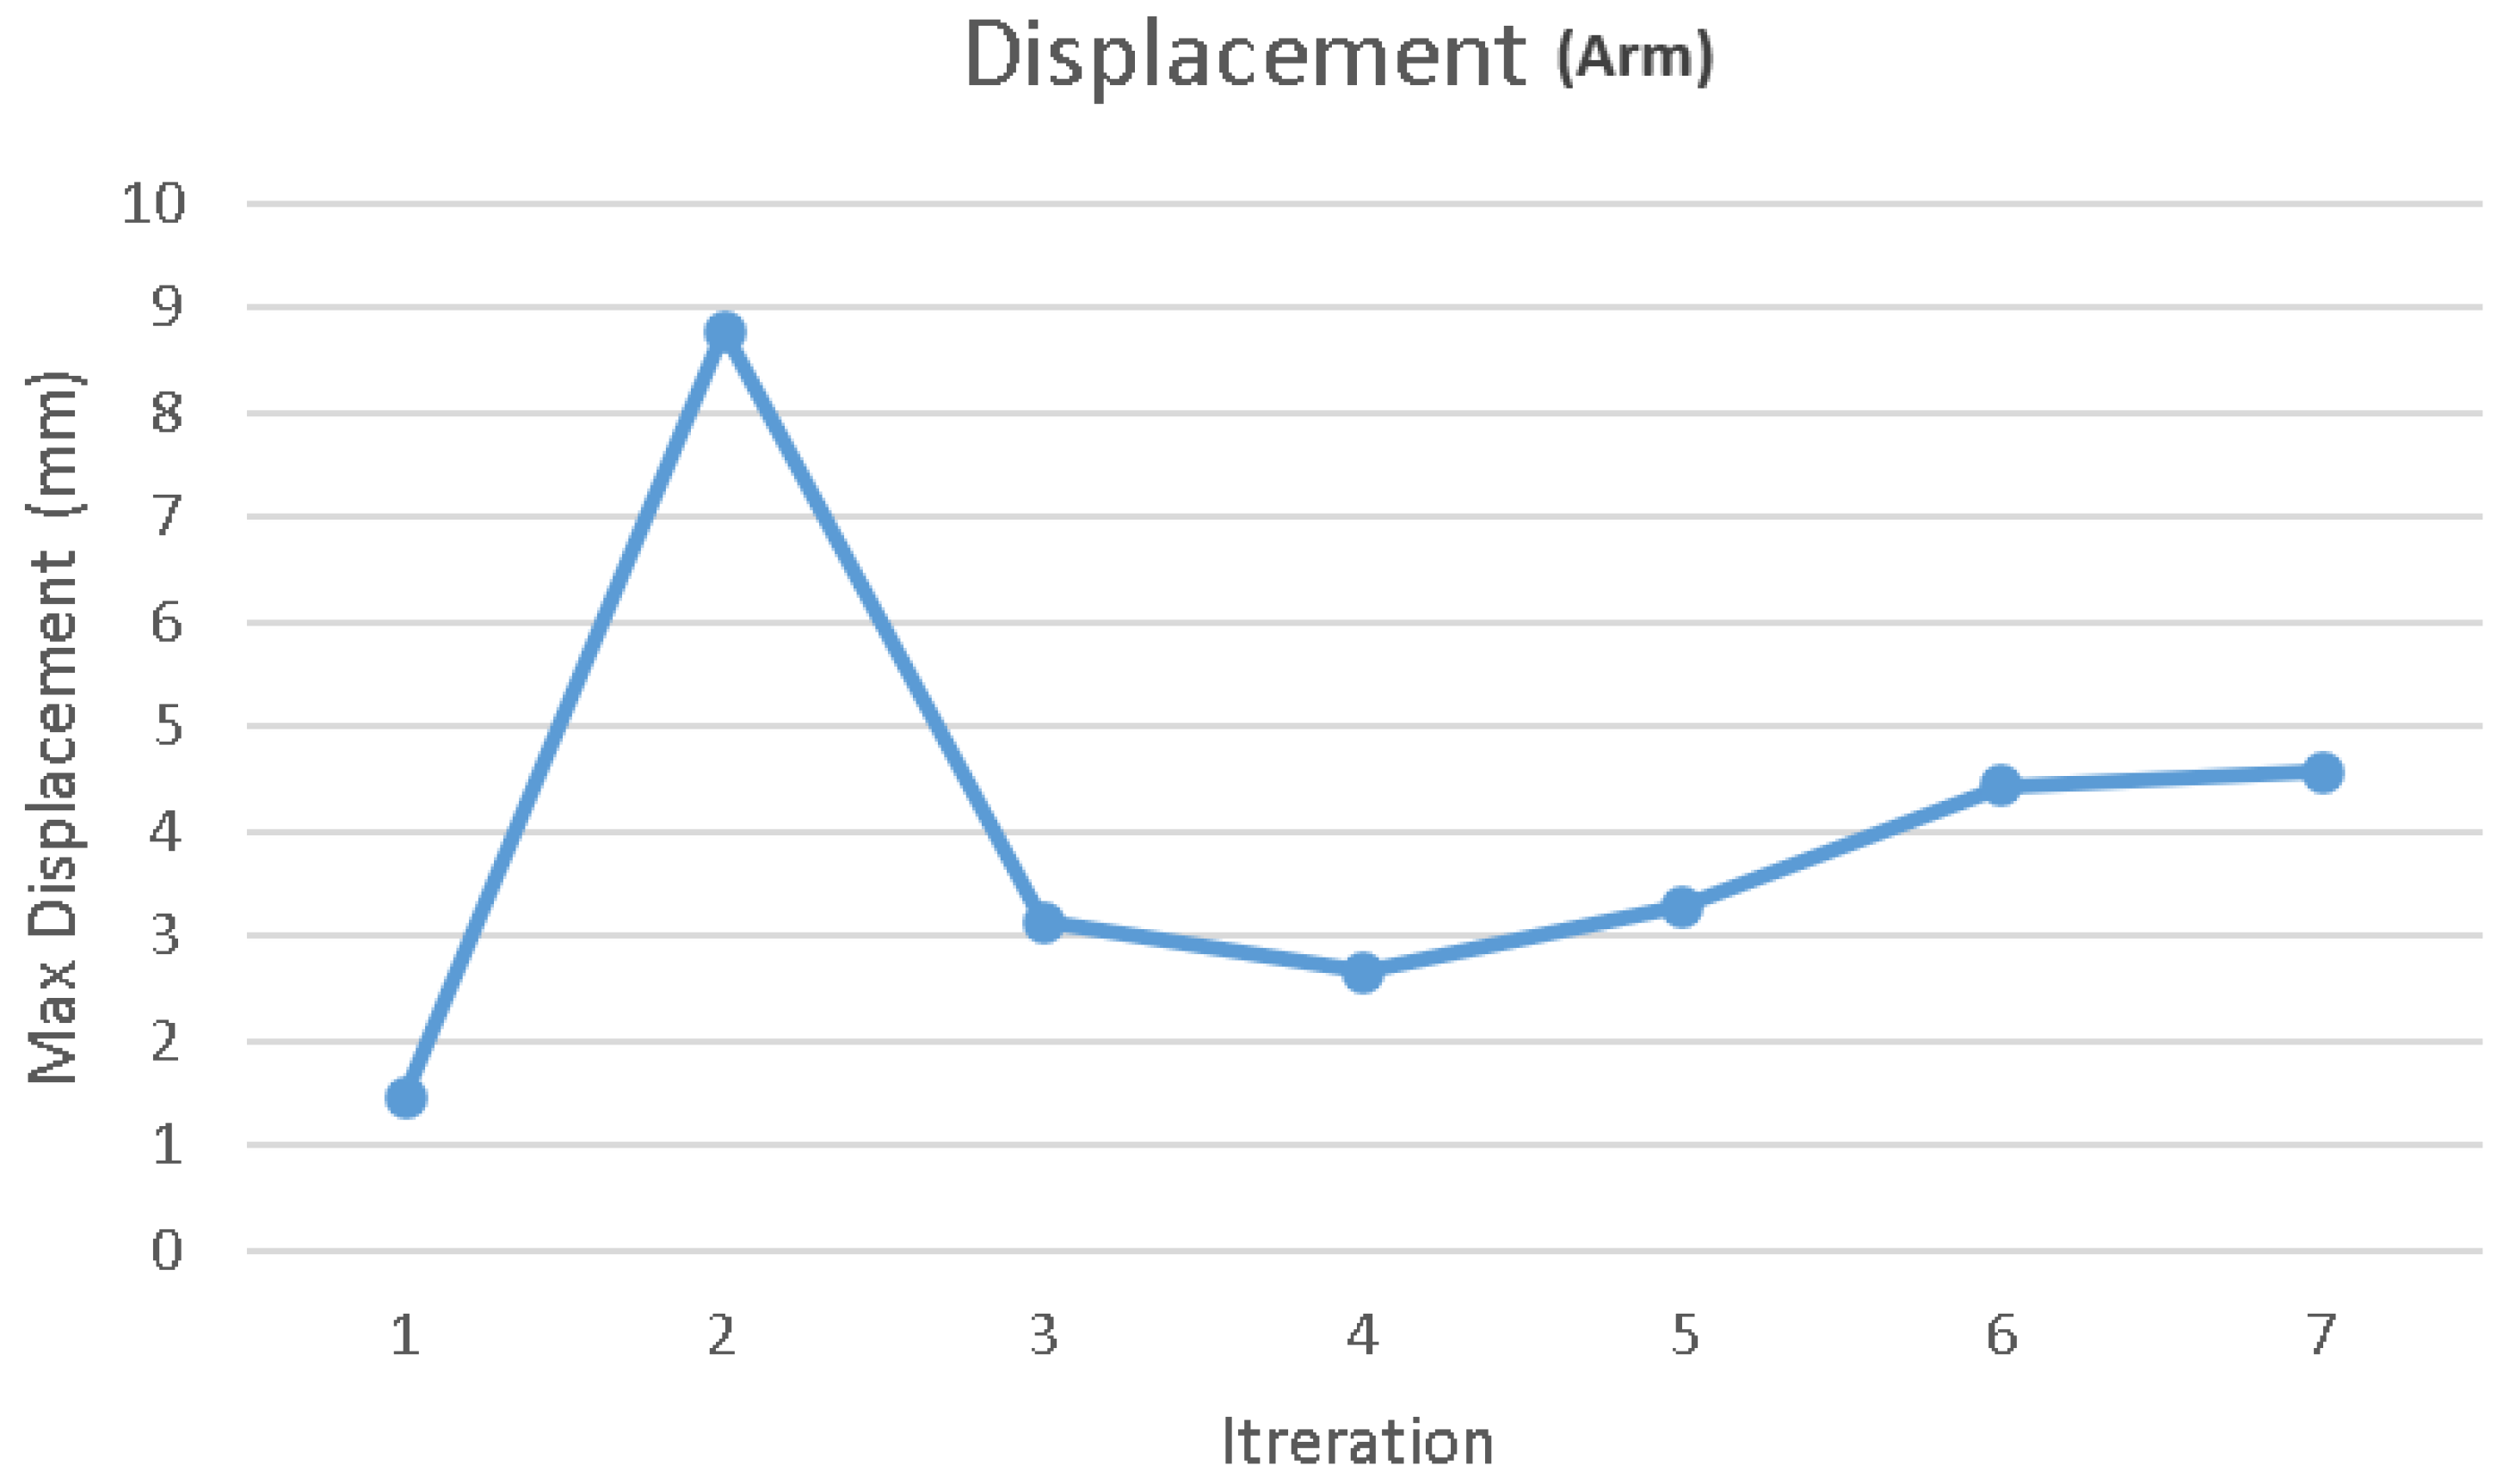
Displacement variation: Variation of max displacement of the drone arm across successive design iterations.
Figure 12.
Displacement variation: Variation of max displacement of the drone arm across successive design iterations.
Figure 13.
Max stress in torsion under a torque of 1 Nm.
Figure 13.
Max stress in torsion under a torque of 1 Nm.
Figure 14.
Max stress in buckling under a load of 10 N.
Figure 14.
Max stress in buckling under a load of 10 N.
Figure 15.
Displacement profile (complete): Displacement profile of the complete drone frame, under simulated max loading.
Figure 15.
Displacement profile (complete): Displacement profile of the complete drone frame, under simulated max loading.
Figure 16.
Stress profile arm (Von Mises): Stress profile of the arm, under simulated max loading.
Figure 16.
Stress profile arm (Von Mises): Stress profile of the arm, under simulated max loading.
Figure 17.
Stress profile (Von Mises): Stress profile of the complete drone frame, under simulated max loading.
Figure 17.
Stress profile (Von Mises): Stress profile of the complete drone frame, under simulated max loading.
Figure 18.
Topology study iso view.
Figure 18.
Topology study iso view.
Figure 19.
Velocity flow field (X): Flow field of air around the drone body at a speed of 100 km/h.
Figure 19.
Velocity flow field (X): Flow field of air around the drone body at a speed of 100 km/h.
Figure 20.
Pressure field: Pressure field of air around the drone body at a speed of 100 km/h.
Figure 20.
Pressure field: Pressure field of air around the drone body at a speed of 100 km/h.
Figure 21.
Vortices fuselage: Vortex generation around the fuselage whilst flying at a speed of 100 km/h.
Figure 21.
Vortices fuselage: Vortex generation around the fuselage whilst flying at a speed of 100 km/h.
Figure 22.
Vortices arms: Vortex generation around the drone arms whilst flying at a speed of 100 km/h.
Figure 22.
Vortices arms: Vortex generation around the drone arms whilst flying at a speed of 100 km/h.
Figure 23.
Fatigue profile of the drone arms: Fatigue profile of the drone arms, with red indicating regions of max fatigue.
Figure 23.
Fatigue profile of the drone arms: Fatigue profile of the drone arms, with red indicating regions of max fatigue.
Figure 24.
Assembled print: Fully assembled print of the drone frame.
Figure 24.
Assembled print: Fully assembled print of the drone frame.
Figure 25.
Printing process: Printing process of the drone (a) top plate (b) bottom plate (c) arms-top view (d) arms-bottom view.
Figure 25.
Printing process: Printing process of the drone (a) top plate (b) bottom plate (c) arms-top view (d) arms-bottom view.
Table 1.
Comparison table: PLA vs. ABS vs. Nylon.
Table 1.
Comparison table: PLA vs. ABS vs. Nylon.
| Property | PLA (Polylactic Acid) | ABS | Nylon |
|---|
| Density | 1.24 g/cm³ | 1.04 g/cm³ | 1.12–1.15 g/cm³ |
| Tensile Strength (MPa) | 50–65 | 30–45 | 45–75 |
| Tensile Modulus (Stiffness) | 3.0–3.5 GPa | 1.5–2.5 GPa | 1.0–2.5 GPa |
| Elongation at Break | 4–10% (brittle) | 10–30% | 60–300% (highly ductile) |
| Impact Strength (Izod) | 16–30 J/m | 200–300 J/m | 300–600 J/m |
| Glass Transition Temperature | 55–65 °C | 95–105 °C | 70–80 °C (PA12 lower, PA6 higher) |
| Fatigue Life (15 MPa) | – cycles | – cycles | – cycles |
| Creep Resistance | Poor | Moderate | High (especially PA6) |
| UV/Weather Resistance | Poor | Fair (with additives) | Good (PA12 is better for outdoor use) |
| Biodegradability | Biodegradable | Non-biodegradable | Non-biodegradable |
Table 2.
Drone parameters.
Table 2.
Drone parameters.
| Parameter | Value |
|---|
| Width (frame) | 355.5 mm |
| Length (frame) | 355.5 mm |
| Height (frame) | 46.81 mm |
| Weight (frame) | 218.94 g |
| Width (arm) | 41 mm |
| Length (arm) | 182.6 mm |
| Height (arm) | 42.81 mm |
| Weight (arm) | 41.88 g |
| Width (top plate) | 151.85 mm |
| Length (top plate) | 151.85 mm |
| Height (top plate) | 2 mm |
| Weight (top plate) | 24.51 g |
| Width (bottom plate) | 151.85 mm |
| Length (bottom plate) | 181 mm |
| Height (bottom plate) | 2 mm |
| Weight (bottom plate) | 26.86 g |
Table 3.
Arm parameters.
| Parameter | 1 | 2 | 3 | 4 | 5 | 6 | 7 |
|---|
| Mass | 77.6018 g | 68.0109 g | 67.4588 g | 63.6001 g | 59.1182 g | 41.7649 g | 39.12 g |
| Max stress (20 N) (Von Mices) | N/m2 | N/m2 | N/m2 | N/m2 | N/m2 | N/m2 | N/m2 |
| Max displacement (20 N) | 1.462 mm | 8.773 mm | 3.138 mm | 2.663 mm | 3.289 | 4.429 mm | 4.565 mm |
Table 4.
Comparison of various parameters of different drone designs.
Table 4.
Comparison of various parameters of different drone designs.
| Property | This Work | [12] | [13] | [14] | [15] | [16] | [17] | [18] | [19] |
|---|
| Year | 2025 | 2025 | 2025 | 2024 | 2025 | 2019 | 2020 | 2015 | 2024 |
| Vehicle Mass | 750 g | 1000 g | 25.93 g | 1430 g | not available | not available | 947.68 g | not available | 400 g |
| Specific Strength (MPa/g) | 10.35 | not available | 16.597 | 5.35 | not available | 1.1498 | 0.1926 | 1.9369 | 0.3806 |
| Max Deformation (mm) | 0.5984 | not available | 0.56182 | 0.296 | not available | 0.00096759 | 0.0073 | 0.0013176 | 0.04475 |
| Cycle Life (no of cycles) | 3455 | not available | not available | not available | not available | not available | not available | not available | not available |
| Reference Area | 0.01 m2 | 0.05 m2 | not available | 0.02 m2 | not available | not available | not available | not available | not available |
| Coefficient of Drag (35°) | 0.2365 (Tilt Rotor) | 0.25 | not available | not available | not available | 0.61 | not available | not available | not available |
| Material | PLA | not available | ABS | ABS | ABS | PLA-PLUS | CFRP | Aluminum | PLA |
Table 5.
Drag coefficient at different angles.
Table 5.
Drag coefficient at different angles.
| Angle | Value | Drag (N) |
|---|
| 5 | 0.2974 | 0.32825 |
| 10 | 0.2974 | 4.32857 |
| 15 | 0.4377 | 6.32846 |
| 20 | 0.5189 | 7.48561 |
| 35 | 0.6929 | 9.94028 |
| Disclaimer/Publisher’s Note: The statements, opinions and data contained in all publications are solely those of the individual author(s) and contributor(s) and not of MDPI and/or the editor(s). MDPI and/or the editor(s) disclaim responsibility for any injury to people or property resulting from any ideas, methods, instructions or products referred to in the content. |
© 2025 by the authors. Licensee MDPI, Basel, Switzerland. This article is an open access article distributed under the terms and conditions of the Creative Commons Attribution (CC BY) license (https://creativecommons.org/licenses/by/4.0/).

