Article

Multimodal Detection of Emotional and Cognitive States in E-Learning Through Deep Fusion of Visual and Textual Data with NLP

by
Qamar El Maazouzi
*,† and
Asmaa Retbi
Rime Team-Networking, Modeling and e-Learning Team-Masi Laboratory-Engineering 3S Research Center, Mohammadia School of Engineers, Mohammed V University in Rabat, Rabat 10100, Morocco
*
Author to whom correspondence should be addressed.
These authors contributed equally to this work.
Computers 2025, 14(8), 314; https://doi.org/10.3390/computers14080314
Submission received: 10 June 2025 / Revised: 18 July 2025 / Accepted: 21 July 2025 / Published: 2 August 2025
(This article belongs to the Special Issue Present and Future of E-Learning Technologies (2nd Edition))

Abstract

In distance learning environments, learner engagement directly impacts attention, motivation, and academic performance. Signs of fatigue, negative affect, or critical remarks can warn of growing disengagement and potential dropout. However, most existing approaches rely on a single modality, visual or text-based, without providing a general view of learners’ cognitive and affective states. We propose a multimodal system that integrates three complementary analyzes: (1) a CNN-LSTM model augmented with warning signs such as PERCLOS and yawning frequency for fatigue detection, (2) facial emotion recognition by EmoNet and an LSTM to handle temporal dynamics, and (3) sentiment analysis of feedback by a fine-tuned BERT model. It was evaluated on three public benchmarks: DAiSEE for fatigue, AffectNet for emotion, and MOOC Review (Coursera) for sentiment analysis. The results show a precision of 88.5% for fatigue detection, 70% for emotion detection, and 91.5% for sentiment analysis. Aggregating these cues enables an accurate identification of disengagement periods and triggers individualized pedagogical interventions. These results, although based on independently sourced datasets, demonstrate the feasibility of an integrated approach to detecting disengagement and open the door to emotionally intelligent learning systems with potential for future work in real-time content personalization and adaptive learning assistance.

1. Introduction

With the unprecedented expansion of online learning, particularly in the wake of the COVID-19 pandemic, student motivation and engagement have become central concerns in assuring the quality and effectiveness of distance education [1]. The absence of direct face-to-face communication makes it more difficult to detect early warning signs such as cognitive overload, frustration, boredom, or disengagement. However, these states directly affect concentration, motivation, and academic performance [2].
Most existing engagement detection systems are unimodal, relying on a single data source. Some use visual cues captured by webcams (e.g., facial expressions, blinking, posture) to detect fatigue or emotions [3,4], while others analyze sentiment in student feedback [5,6]. Although informative, these approaches fail to capture the full spectrum of learners’ cognitive and affective states. For instance, a student might appear neutral on camera while expressing distress in written feedback, or vice versa.
Recent studies emphasize the need for multimodal approaches to more accurately assess engagement [7]. Indicators such as PERCLOS, head pose, and yawning frequency have shown potential to predict cognitive dropout [8]. In contrast, facial affect and free text feedback offer complementary insights into the learner’s experience. With the advent of advanced language models such as BERT [9], it is now possible to achieve a richer, context-sentitive understanding of textual input.
However, to date, no existing work has fused visual fatigue estimation, facial affect recognition, and text-based sentiment analysis within a single architecture. This lack of multimodal fusion limits the ability of current systems to accurately estimate overall engagement and to allow timely pedagogical interventions.
To address this gap, we propose a new multimodal approach that integrates three modules: CNN-LSTM for visual fatigue detection, EmoNet for facial emotion recognition, and a fine-tuned BERT model for sentiment analysis of learner comments. The output of these modules is normalized, weighted, and aggregated to generate a global engagement index. This composite score, which is more representative than any single modality, drives adaptive pedagogical recommendations (e.g., break reminders, content simplification, tutor intervention) in a personalized learning system.
The main contributions of this work are summarized as follows:
  • An integrated combination of multimodal signals—visual (fatigue and facial emotions) and textual (sentiment)—within a single architecture for measuring engagement in e-learning environments;
  • The joint use of cutting-edge learning models: CNN-LSTM to capture temporal dynamics of fatigue, EmoNet for robust facial emotion recognition, and fine-tuned BERT for context-aware sentiment analysis of learner feedback;
  • A weighted fusion of the predictions from the three modules, resulting in a composite engagement index that is more accurate and representative than unimodal estimates;
  • The use of this interaction index for making personalized pedagogical recommendations, validated by experiments on three publicly available benchmark datasets: DAiSEE (fatigue), AffectNet (facial expressions), and Course Reviews on Coursera (sentiment analysis).
The remainder of this paper is structured as follows. Section 2 addresses related work and the state-of-the-art. Section 3 outlines the proposed methodology. Section 4 is concerned with experimentation and results analysis. Section 5 finally outlines future research directions before reaching a conclusion.

2. Previous Works

Fatigue recognition is a pertinent problem in contexts such as driving, prolonged cognitive work, and e-learning. Ref. [10] observe that traditional methods rely on observable indicators such as PERCLOS or blink frequency. While effective under laboratory-like conditions, these methods, as noted by [11], are not sensitive to micro-indicators of fatigue and lack robustness in real-world settings. To address these limitations, deep learning models—particularly CNN-LSTM architectures—have been introduced to capture facial dynamics [12]. Additionally, multimodal techniques combining visual data with physiological signals (e.g., EEG, ECG) have shown promising results in adverse environments [13]. More recently, Ref. [14] proposed temporal transformer-based architectures to represent the progressive build-up of fatigue in long video sequences.
Facial emotion recognition is another key area of affective analysis in digital contexts. Ref. [15] report that recent approaches rely on CNN-based models trained on annotated datasets such as AffectNet, FER2013, or RAF-DB. Models like EmoNet [16] estimate both discrete emotions and continuous dimensions (valence, arousal), and are more robust when dealing with partially occluded or noisy facial expressions. Visual context (e.g., surrounding objects or background scenes), as noted by [17], helps disambiguate facial expressions. However, as explained by [18], model performance drops considerably in unconstrained settings, particularly for rotated faces—scenarios common in e-learning environments.
Text-based sentiment analysis is also crucial for inferring underlying affective states. As pointed out by [19], the advent of Transformer-based models such as BERT has revolutionized contextual understanding and polarity detection in natural language. Subsequent advancements, such as RoBERTa [20] and DistilBERT [21], have further improved performance while reducing computational cost. In education, as discussed by [22], these models—when trained on labeled MOOC corpora—achieve high accuracy in both binary and multi-class sentiment prediction. Nonetheless, as highlighted by [23], their performance heavily depends on domain-specific annotated datasets, which are often limited or biased.
Few studies have explored the fusion of visual and textual data in e-learning, and most overlook the temporal dynamics of affective states. This gap motivates our proposal of an adaptive sequential model for fine-grained engagement analysis and personalized pedagogical recommendations.

3. Methods and Materials

The system proposed in this paper is based on a multimodal approach that aims to detect the engagement of learners correctly and contextually in an e-learning environment. The architecture consists of three complementary modules, as Figure 1 illustrates: visual fatigue sensing, facial emotion analysis, and textual sentiment analysis. Each module processes a different kind of input (text or videos), extracts different features (visual, behavioral, linguistic), and outputs a partial score. Subsequently, these are normalized and aggregated to produce a global engagement index on which pedagogical advice can be based.
The identification of visual fatigue relies on a CNN-LSTM model capable of capturing both spatial characteristics (blinking, yawning, head orientation) and the temporal evolution thereof. Emotion detection is performed by the EmoNet network, which is highly skilled at recognizing facial expressions in relation to eight universal emotional categories and calculating continuous valence and arousal dimensions. Lastly, sentiment analysis is performed through a fine-tuned BERT model, trained on the learner feedback corpora, enabling classification of the emotional tone (positive, neutral, or negative) expressed in text comments.
Before feeding visual data into CNN-LSTM and EmoNet models, a pre-processing pipeline was performed on all images collected from videos in the publicly available datasets. This is done to normalize the data, reduce environmental variation, and improve the quality of the features used for fatigue and emotion detection.

3.1. Image Preprocessing

The video recordings were segmented into 20-frame sequences sampled at equal intervals to record the dynamics of facial expressions over time. Each frame was converted to grayscale through the OpenCV library, in order to reduce computational complexity and highlight the structural changes of the face. The adaptive histogram equalization was then performed using the CLAHE algorithm (Contrast Limited Adaptive Histogram Equalization), also in OpenCV. This technique improves local contrast without adding noise, allowing for the enhancement of valuable facial features (such as eyes and mouth) under varying lighting conditions. The images were now ready for face detection.

3.2. Face Detection, ROI Extraction, and Normalization

In each processed image, face detection was carried out using the Dlib library’s 68-point facial landmark predictor that has very high accuracy for detecting facial features. From this detection, it was feasible to extract the areas of interest in visual fatigue, namely the eyes, mouth, and head posture. An ROI focusing on the face was then cropped out, resized to 64 × 64 pixels, and normalized to [ 0 , 1 ] . The image processing images were then formatted as temporal sequences, where each session was equivalent to 20 consecutive images. These sequences were saved in 5D tensors of dimensions hape ( batch _ size , sequence _ length , height , width , channels ) ) for easy integration into the CNN-LSTM pipeline, where every image was processed in isolation by the CNN and the LSTM was trained on facial behavior temporal dynamics.

3.3. Fatigue Frequency Calculation

3.3.1. Behavioral Indicator Extraction

Fatigue-related behavior detection relies on collaborative analysis of facial geometric features and temporal dynamics [24]. We introduced a hybrid architecture based on a CNN-LSTM network, where spatial feature vectors are extracted automatically and their dynamics are represented as a function of time.
Each input sequence consists of 20 consecutive images that are preprocessed and normalized (as described in Section 3.1). The images first pass through a lightweight convolutional network (Conv2DReLUMaxPooling) that extracts a feature vector f t R d at each time step t.
In parallel, facial landmarks are detected using the Dlib library (68 points), from which three key geometric indicators are computed: Eye Aspect Ratio (EAR), Mouth Aspect Ratio (MAR), and head pose rotation angles (pitch, roll, yaw).
  • Eye Aspect Ratio (EAR)
The Eye Aspect Ratio introduced [25], measures the openness of the eye using six key landmarks detected around the eye (1):
E A R ( t ) = p 2 p 6 + p 3 p 5 2 · p 1 p 4
where p 1 to p 6 are the facial landmarks detected by Dlib around the eye contour. An EAR value lower than a certain threshold (typically 0.2) indicates that the eye is closed. Successive low EAR values are used to detect blinks and compute the Percentage of Eye Closure (PERCLOS) (2).
  • Mouth Aspect Ratio (MAR)
The Mouth Aspect Ratio (MAR), defined in Equation (2), is a geometric measure used to detect yawning behaviors by tracking facial landmarks around the mouth [26].
M A R ( t ) = p 63 p 67 + p 64 p 66 2 · p 61 p 65
A high MAR value sustained across several frames indicates a yawn, especially when combined with an elevated pitch angle of the head.
  • Head Rotation Angles
The learner’s head inclination is computed using the Euler angles—pitch (vertical tilt), roll (lateral tilt), and yaw (horizontal rotation)—which are extracted from a 3D pose estimation model [27]. In drowsy states, a learner tends to tilt their head downward (high pitch) or sideways (high roll), deviating from an alert and upright posture. The transformation between 3D world coordinates ( X , Y , Z ) and image coordinates ( u , v ) is given by (3):
u v 1 = K · R t · X Y Z 1
This pinhole camera model is adapted from [28].
Where K is the camera intrinsic matrix, R the rotation matrix, and t the translation vector.

3.3.2. Detection of Behavioral Events

At each time step t, we extract a base feature vector f t composed of core visual indicators such as PERCLOS, EAR, MAR, and head orientation. To enhance temporal modeling, we augment this vector with additional geometric features (e.g., distances between key facial landmarks), forming the enriched vector f t a u g . This augmented vector is passed to a unidirectional LSTM with 128 units (4):
h t = LSTM ( f t a u g , h t 1 )
The final output h T summarizes the temporal sequence and is used for behavioral fatigue event detection.
  • Blinking
A blink is detected when the EAR value drops below a certain threshold T blink for at least n b consecutive frames (5):
Blink ( t ) = ( EAR ( t ) < T blink ) , BlinkFreq = N blinks T
where N blinks is the number of blinks observed within a sequence of length T.
  • Prolonged Eye Closure (PERCLOS)
The percentage of frames during which the eyes remain more than 80% closed is calculated as (6):
PERCLOS = 1 T t = 1 T EAR ( t ) < T close
  • Yawning
A yawn is detected when the MAR value exceeds a defined threshold T yawn for at least n y consecutive frames (7):
Yawn ( t ) = MAR ( t ) > T yawn , YawnFreq = N yawns T
  • Head Nodding (Drowsy Nod)
A nodding event is detected when the pitch angle changes abruptly beyond a defined threshold T nod over a time interval Δ t δ t (8):
Nod ( t ) = Δ Pitch ( t ) > T nod Δ t δ t , NodFreq = N nods T
These indicators are later normalized and fused to compute a global behavioral fatigue score, as detailed in the next section.

3.3.3. Fusion of Behavioral Indicators and Fatigue Score Computation

The four behavioral indicators extracted above are combined into a single fatigue score ranging from 0 to 1. This process includes:
  • Normalization
Each indicator x i is first scaled to the [ 0 , 1 ] interval using (9):
x i norm = x i x i min x i max x i min
where x i min and x i max are empirically derived from dataset statistics.
  • Weighted Fusion
The final fatigue score is computed as a weighted sum of the normalized indicators (10):
FatigueScore = w 1 · PERCLOS norm + w 2 · BlinkFreq norm + w 3 · YawnFreq norm + w 4 · NodFreq norm
The higher weight assigned to PERCLOS (0.35) in Table 1 is based on recent research that confirms its robustness as a primary indicator of fatigue and reduced alertness. Several studies have shown that PERCLOS exhibits a more direct correlation with drowsiness and cognitive fatigue than other behavioral signals. For example, Refs. [29,30] validated its use in embedded systems, while [31] demonstrated its effectiveness in online learning contexts. This consensus supports its higher contribution in the fusion formula, while the other indicators, blink frequency, yawning, and head nodding, are assigned complementary weights, reflecting their respective sensitivity to fatigue.

3.4. Facial Emotion Analysis with EmoNet

The goal of this module is to detect and track the evolution of a learner’s facial emotions during an e-learning session. To achieve this, we employ EmoNet, a convolutional neural network trained on the AffectNet dataset. EmoNet is capable of predicting:
  • A categorical emotion from among 8 universal classes: anger, disgust, fear, joy, sadness, surprise, contempt, neutral.
  • A continuous valence-arousal pair in the range [ 1 , 1 ] , allowing a finer representation of emotional state.
The same facial image sequences used for fatigue analysis are reused here. Each image is resized to 224 × 224 pixels and normalized using the AffectNet dataset’s RGB mean and standard deviation. The processed images are then passed frame by frame into EmoNet.

3.4.1. Architecture and Feature Extraction

The detection and analysis of facial emotions are carried out using a two-stage system that combines a convolutional network for frame-level feature extraction (EmoNet) with a sequential module (LSTM) for temporal modeling. The EmoNet model is based on a standard CNN architecture that processes each facial image independently. It consists of six stacked convolutional blocks, each including a 3 × 3 convolution operation, followed by batch normalization, ReLU activation, and 2 × 2 max pooling.
The number of filters increases progressively from 32 to 256 across the blocks. The resulting feature maps are flattened to produce a vector f t R 512 , representing the salient visual features of the facial image I t .
Two supervised output branches are attached to the network:
  • a fully connected layer followed by a softmax activation, producing the predicted discrete emotion label y ^ t ,
  • and a linear regression head for estimating the continuous valence and arousal dimensions ( v t , a t ) .
Although these outputs are used during training, only the latent representation f t is passed to the next stage for temporal modeling.

3.4.2. Temporal Modeling with LSTM

The sequence of feature vectors { f 1 , f 2 , , f T } is fed into a unidirectional LSTM network with 256 hidden units and a dropout rate of 0.3 to avoid overfitting. This module captures emotional transitions over time and provides contextualized representations of each frame.
Each LSTM output h t is passed through a fully connected layer to produce either:
  • a discrete emotion prediction y ^ t , or
  • a continuous estimation ( v t , a t ) of valence and arousal.
The system thus generates time-dependent sequences (11):
Y ^ = { y ^ 1 , y ^ 2 , , y ^ T } , V ^ = { v 1 , v 2 , , v T } , A ^ = { a 1 , a 2 , , a T }

3.4.3. Temporal Aggregation and Emotion Scoring

To obtain a unified measure of the emotional state over a session, we compute a continuous score from the valence–arousal pairs ( v t , a t ) generated at each time step. Two aggregation strategies were considered:
  • Simple mean (12):
    v ¯ = 1 T t = 1 T v t , a ¯ = 1 T t = 1 T a t
  • Arousal-weighted valence, which better reflects emotionally intense moments (13):
    v ¯ w = t = 1 T | a t | · v t t = 1 T | a t |
This formulation assigns more weight to frames with high arousal levels, thereby emphasizing emotionally intense moments.
The choice of this weighted strategy is supported by recent research in affective computing, which highlights the role of arousal as a modulating factor in emotional salience and perceived engagement [32,33]. Low arousal moments typically correspond to emotionally neutral or ambiguous states, while peaks in arousal often reflect heightened emotional or cognitive activity. By weighting valence by arousal, the model gives priority to the most affectively significant segments of the video. This method is particularly suited to learning environments, where emotional peaks, whether positive or negative, are more indicative of the engagement of the learner than flat emotional averages.
A global emotion score S emo [ 0 , 1 ] is computed using an affine transformation (14):
S emo = v ¯ w + 1 2
This score summarizes the emotional state throughout the sequence by combining both polarity (valence) and intensity (arousal). Following the circumplex model of affect [34], we defined four qualitative intervals of the emotional score S emo [ 0 , 1 ] as shown in Table 2, each corresponding to pedagogically relevant affective states. These intervals are grounded in empirical findings from large-scale emotion datasets such as AffectNet [35] and DEAP, which report similar valence–arousal clusters in learning-relevant emotions.
A high score (close to 1) reflects positive emotional engagement—such as joy, motivation, or serenity—and is a strong signal of active involvement in learning. An intermediate score, especially when associated with negative valence, indicates emotional tension (e.g., anger, frustration, stress); this state may conceal cognitive overload and warrants pedagogical attention. A low score (close to 0) reveals deep affective disengagement, often linked to sadness, boredom, or demotivation; such states correlate with lower learning outcomes and increased dropout risk. This score will later be fused with the fatigue score to compute a global cognitive-affective engagement index, supporting adaptive learning recommendations based on the learner’s real-time emotional and physiological state.

3.5. Sentiment Analysis Layer Using BERT

The third layer of our engagement detection pipeline aims to interpret the emotional and cognitive content expressed by learners through written messages. To achieve this, we use a transformer-based model, specifically BERT (Bidirectional Encoder Representations from Transformers).
Each learner message undergoes standardized linguistic preprocessing to ensure homogeneous and usable input. The main steps are as follows:
  • Lowercasing and removal of special or non-alphanumeric characters
  • Tokenization using the BERT tokenizer (subword-level)
  • Truncation and padding of sequences to a fixed maximum length (128 tokens)
  • Encoding into BERT-compatible input formats:
    -
    input_ids: token identifiers
    -
    attention_mask: binary mask distinguishing real tokens from padding
The inputs are then batched into sequences ready to be fed into the BERT model.

Model Architecture

For sentiment analysis, we use a pretrained BERT model fine-tuned for a 3-class classification task: Positive, Neutral, and Negative.
The model architecture includes:
  • The BERT body, which transforms each input sequence into a contextual representation vector. This vector is derived from the [CLS] token, placed at the beginning of each input, and is intended to summarize the entire sequence.
  • A linear softmax classification layer that projects the [CLS] vector into a 3-dimensional output space.
Formally, for a given tokenized input sequence x, the operation is written as (15):
y ^ = Softmax W · BERT [ CLS ] ( x ) + b
where:
  • x is the tokenized input,
  • BERT [ CLS ] ( x ) R 768 is the contextual representation vector,
  • W R 3 × 768 and b R 3 are the parameters of the classification layer.
Instead of relying solely on the predicted class label, we utilize the full probability distribution to define a continuous sentiment score S sent [ 0 , 1 ] , enabling effective fusion with other behavioral indicators such as fatigue and emotion.
Specifically, we denote by y ^ pos , y ^ neu , y ^ neg the predicted probabilities for the positive, neutral, and negative sentiment classes, respectively, as obtained from the softmax output.
We define the sentiment score as (14):
S sent = y ^ pos + 0.5 · y ^ neu

3.6. Multimodal Fusion and Calculation of the Global Engagement Score

The three extracted scores, behavioral fatigue ( S fatigue ), facial emotion ( S emo ), and textual sentiment ( S sent )—were all normalized within the range [0, 1], allowing direct combination without further rescaling.
The global engagement score S eng [ 0 , 1 ] is defined as a weighted average of the three components:
S eng = α · ( 1 S fatigue ) + β · S emo + γ · S sent with α + β + γ = 1
The term ( 1 S fatigue ) accounts for the inverse relationship between fatigue and engagement: higher fatigue levels should contribute negatively to the engagement score. This formulation ensures conceptual consistency by aligning the directionality of the three scores, higher values indicating higher engagement.
The weights α , β , and γ represent the relative contribution of each modality to the overall engagement score. Their calibration is addressed in the next phase through a systematic sensitivity analysis.

3.7. Interpretation Thresholds and Adaptive Actions

The score S eng allows the classification of the learner’s engagement state into four distinct levels, triggering adaptive pedagogical actions as shown in Table 3.
Thus, the engagement score S eng helps define action thresholds for pedagogical interventions to improve learner engagement and participation.

4. Results

4.1. Work Environment and Datasets

The experiments were conducted in a Python 3.9 environment, using machine learning libraries including TensorFlow 2.13 and Keras 2.13. The Hugging Face Transformers library was used to fine-tune the BERT model. Training was carried out on a workstation equipped with an NVIDIA GPU.
Three main datasets were used for training and evaluating this work:
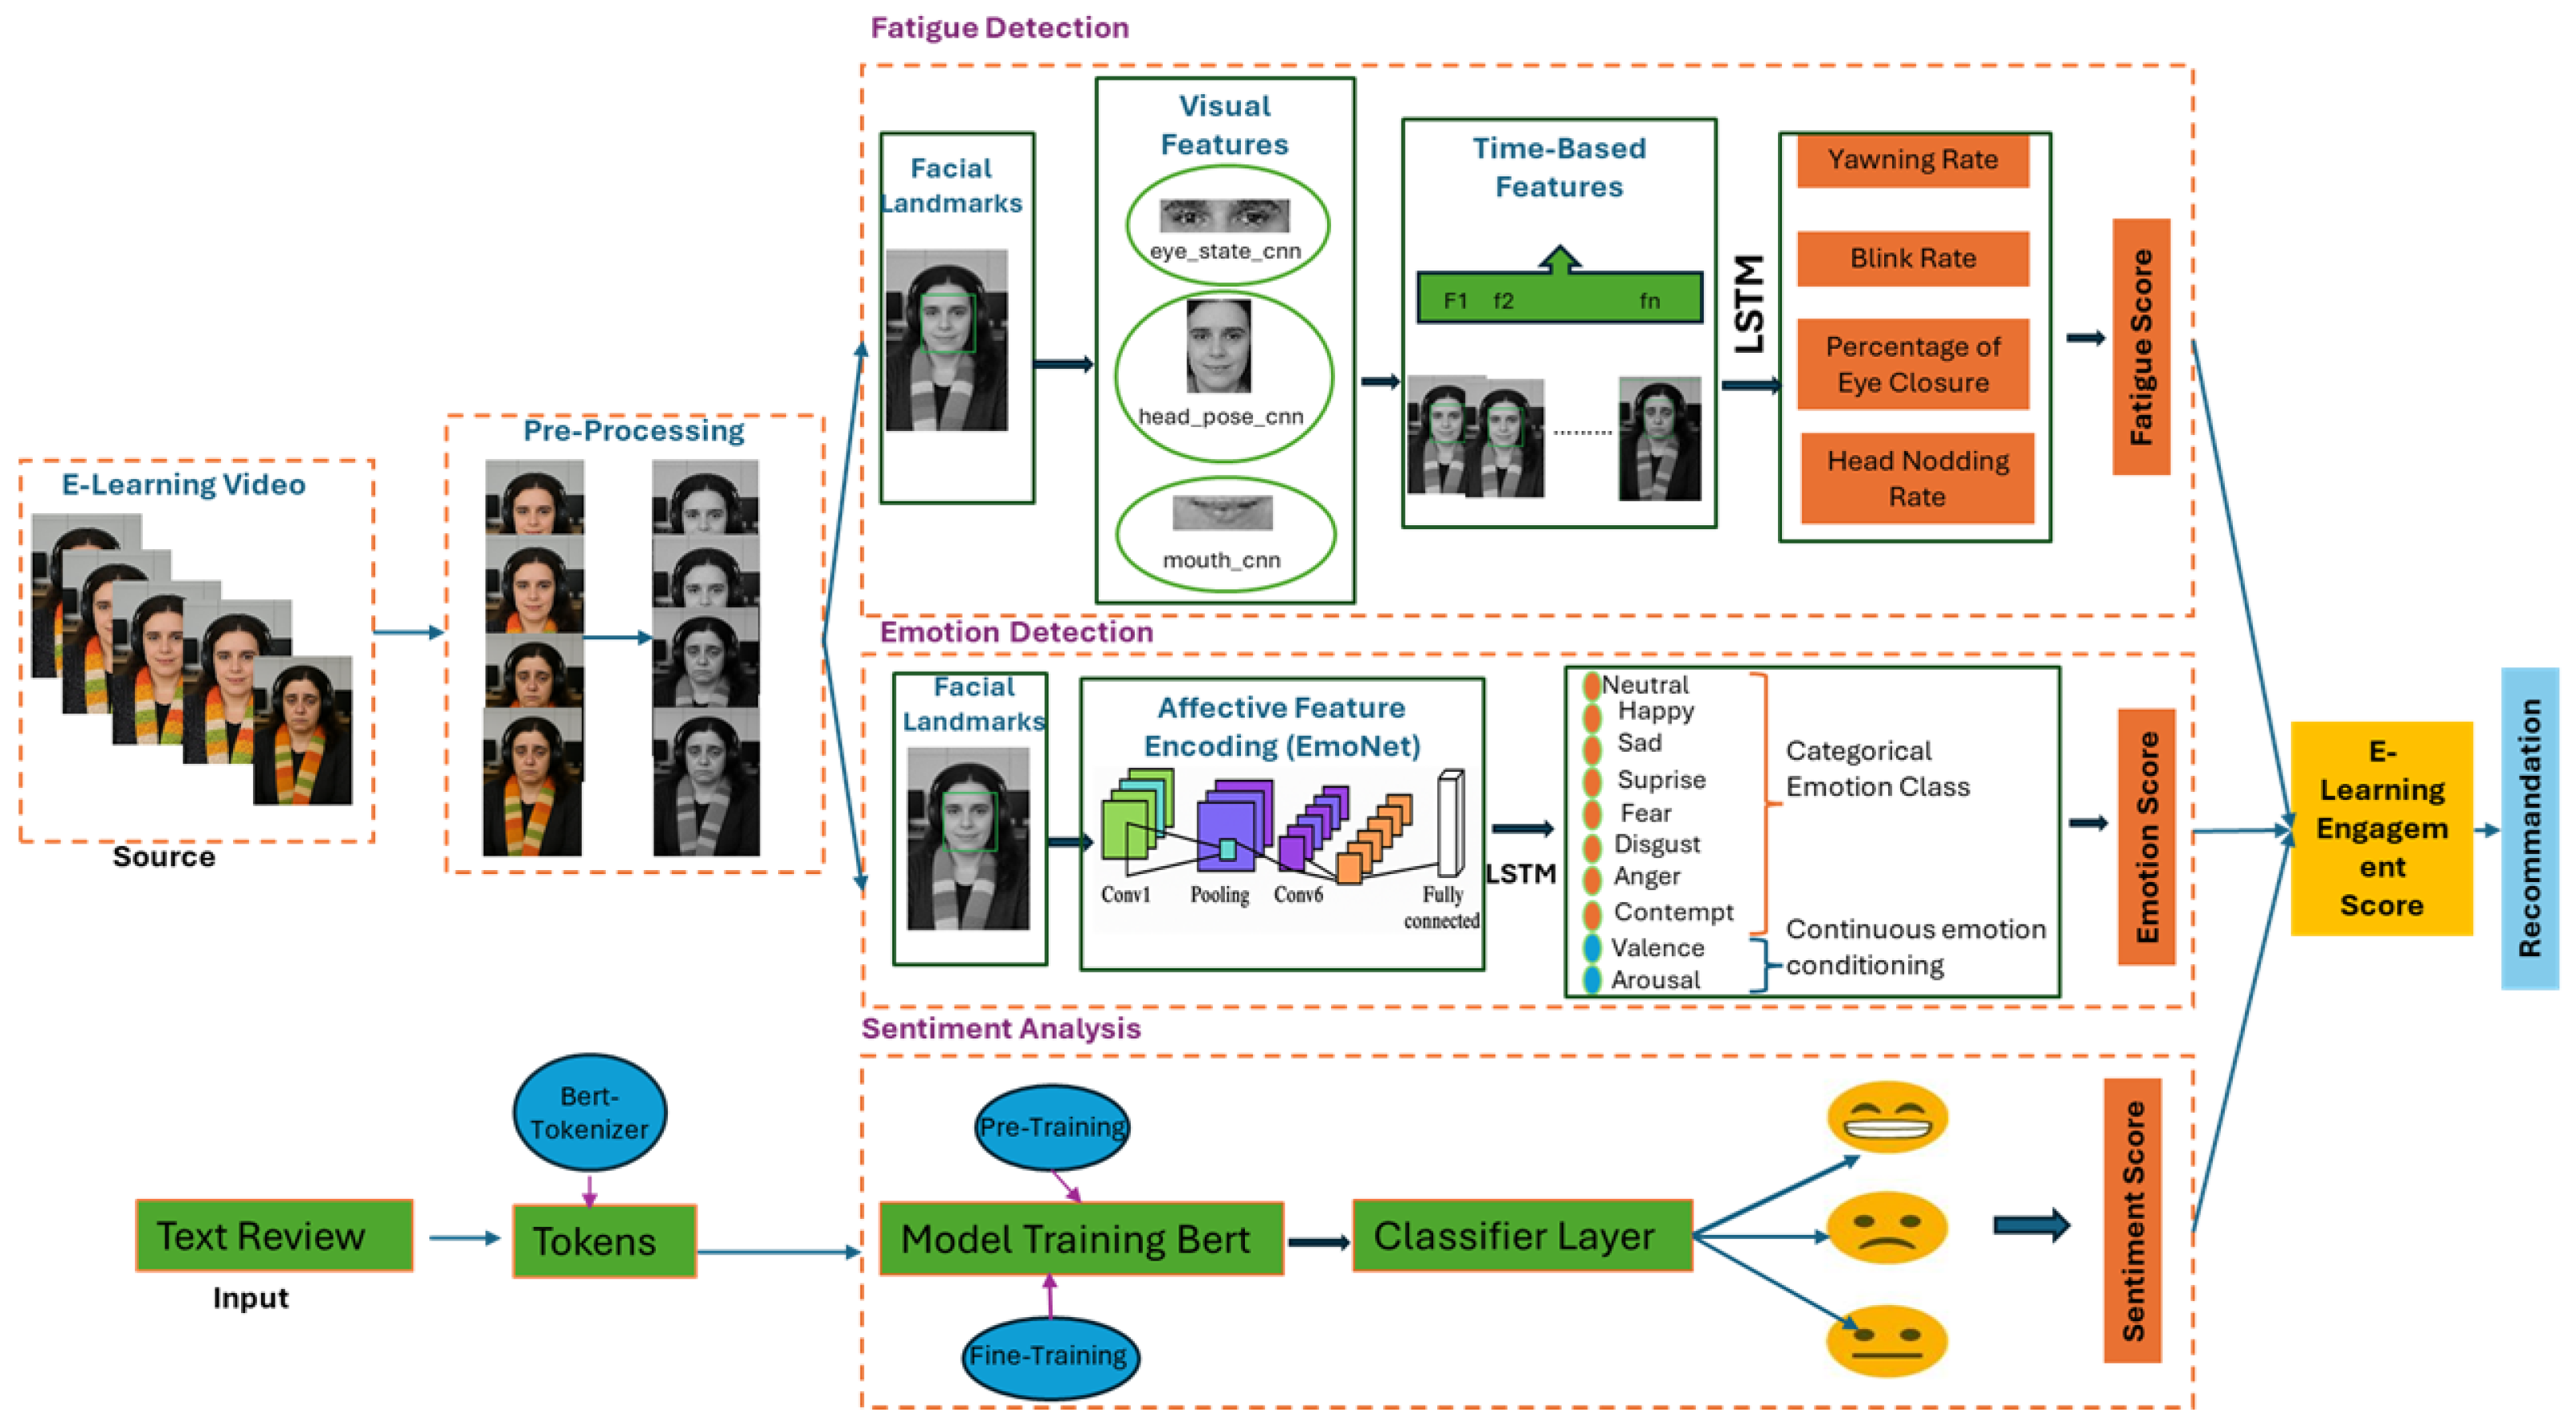
  • DAiSEE: This dataset was used to train and evaluate our fatigue detection module. It contains videos of students filmed in a real e-learning environment, annotated frame-by-frame for four affective states: engagement, excitement, frustration, and fatigue. The sequences are resampled at 10 fps, and the labels are binarized into two classes: tired/not tired.
  • AffectNet: This dataset is used for facial emotion analysis with the EmoNet model. It contains over 1 million images extracted from the web, labeled with 8 discrete emotions (joy, sadness, fear, anger, surprise, disgust, contempt, neutral), and continuous scores for valence and arousal on a scale of [−1, 1].
  • Course Reviews on Coursera: This dataset was used for sentiment analysis of learner feedback. It includes textual reviews on various courses offered on Coursera, labeled as positive, neutral, or negative. This dataset was used to fine-tune the BERT model for sentiment classification.

Experimental Results of the Fatigue Detection Layer

  • Model Performance Metrics
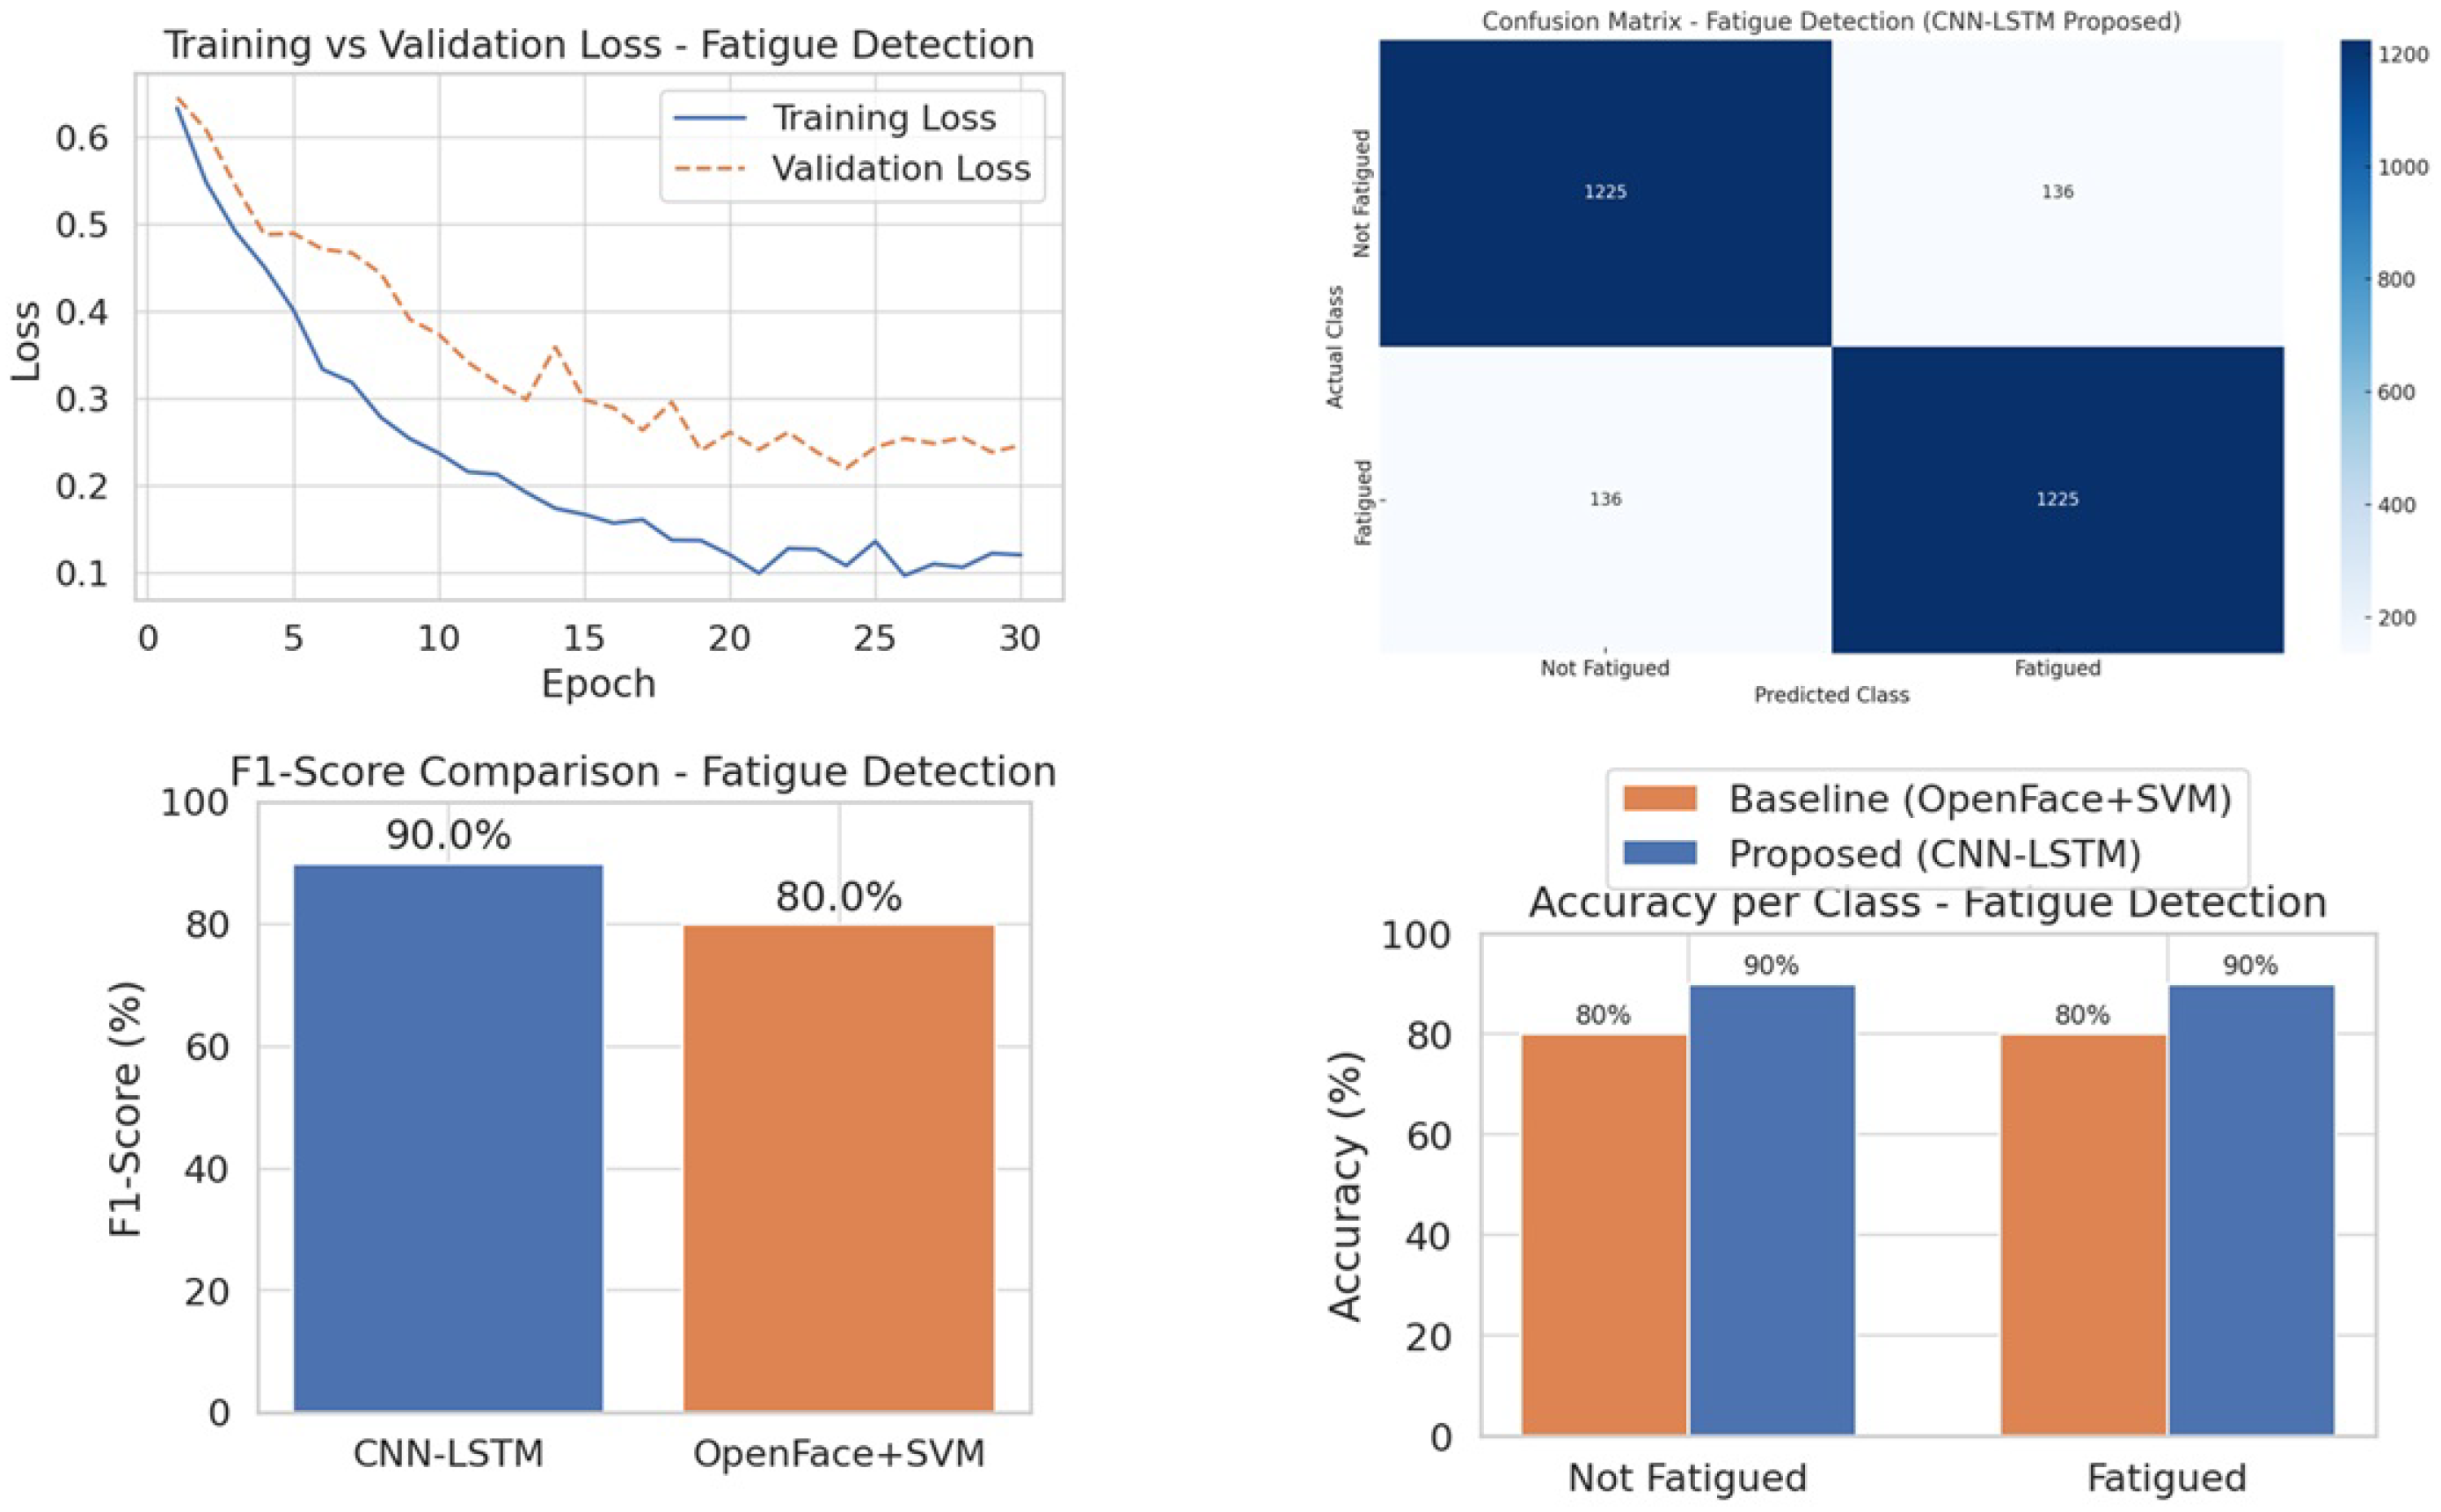
The performance of the CNN-LSTM model for fatigue detection was evaluated on a data set divided into Training (70%), Validation (15%), and Test (15%). The model was trained using the training set and both the validation and test sets were used to evaluate performance.
As shown in Figure 2, the train-validation loss curve indicates a steady reduction in loss over approximately 30 epochs. Initially, the loss was high (0.65), but by epoch 30, the training loss converged to 0.12 and the validation loss to 0.42, with minimal overfitting—evidenced by the small gap between the two curves.
The confusion matrix in Figure 2 further shows that the CNN-LSTM model correctly classifies 90% of both fatigued and non-fatigued instances, with only 10% misclassified in each category.
As illustrated in the F1 score comparison in Figure 2, CNN-LSTM outperforms the OpenFace + SVM baseline, achieving a significantly higher F1 score of 90% versus 80% for OpenFace+SVM. This indicates that the CNN-LSTM model provides a better balance between precision and recall.
To estimate performance variability, we trained the CNN-LSTM model three times using the same architecture and dataset but with different random initializations (default seed behavior). The average F1-score obtained was 90% with a standard deviation of ±1.2%, indicating stable model performance across runs.
  • Experimental Results and Evaluation
The effectiveness of the CNN-LSTM model was further evaluated using real-world tests on the DAiSEE dataset, simulating an e-learning environment. We selected a sample of sequences and manually annotated key events such as blinks, prolonged eye closures (PERCLOS), and yawning. The annotation was performed using the CVAT (Computer Vision Annotation Tool), which allows precise marking of moments when the eyes are closed, when the learner yawns, and to identify head movements. These manual annotations were then compared to the model’s predictions. We measured the accuracy of detecting each behavior by calculating the percentage of agreement between the model’s predictions and the actual annotations.
The Table 4 below presents the results obtained from five test sequences, comparing the number of blinks and prolonged eye closures detected by our system against the real observations. The accuracy was calculated as the percentage of agreement between the automatic detections and the manual annotations.
The results indicate that our model achieves an average precision of 95.4% for blink detection and 92.2% for prolonged eye closures (PERCLOS), thus validating the robustness of the EAR + PERCLOS module combined with CNN-LSTM processing.
Similarly, the precision of yawning detection was evaluated using the Mouth Aspect Ratio (MAR) on the same video sequences. The Table 5 below summarizes the results obtained:
All annotated yawns were correctly identified in most cases, but some errors were observed, particularly a slight mismatch in predictions for certain test sequences. While this confirms the effectiveness of the dynamic MAR threshold integrated into our facial fatigue monitoring algorithm, it also highlights areas for potential improvement. Some critical detection failures, such as undetected yawns, may result from technical limitations like low-resolution frames, partial face occlusion, or suboptimal lighting conditions. Addressing these issues could further enhance the robustness of the system in real-world settings.
The Table 6 shows the results obtained experimentally for the composite fatigue index, combining eye closures, yawning, head nods, and the PERCLOS value. The 0- to 1-dimensioned composite fatigue index represents the degree of fatigue in the subject. With a corresponding rise in eye closures, yawning, and head nods, the composite measure also rises to indicate more fatigue. For instance, in Test 5 with 7 eye closures and 4 head nods, the composite index is 0.598, representing an extreme degree of fatigue, while in Test 1 with only 3 eye closures and 2 yawns, the index is 0.248, showing lower fatigue.
The metrics, along with the test evaluations, demonstrate the strong performance of the CNN-LSTM model in fatigue detection.

4.2. Evaluation Emotion Detection

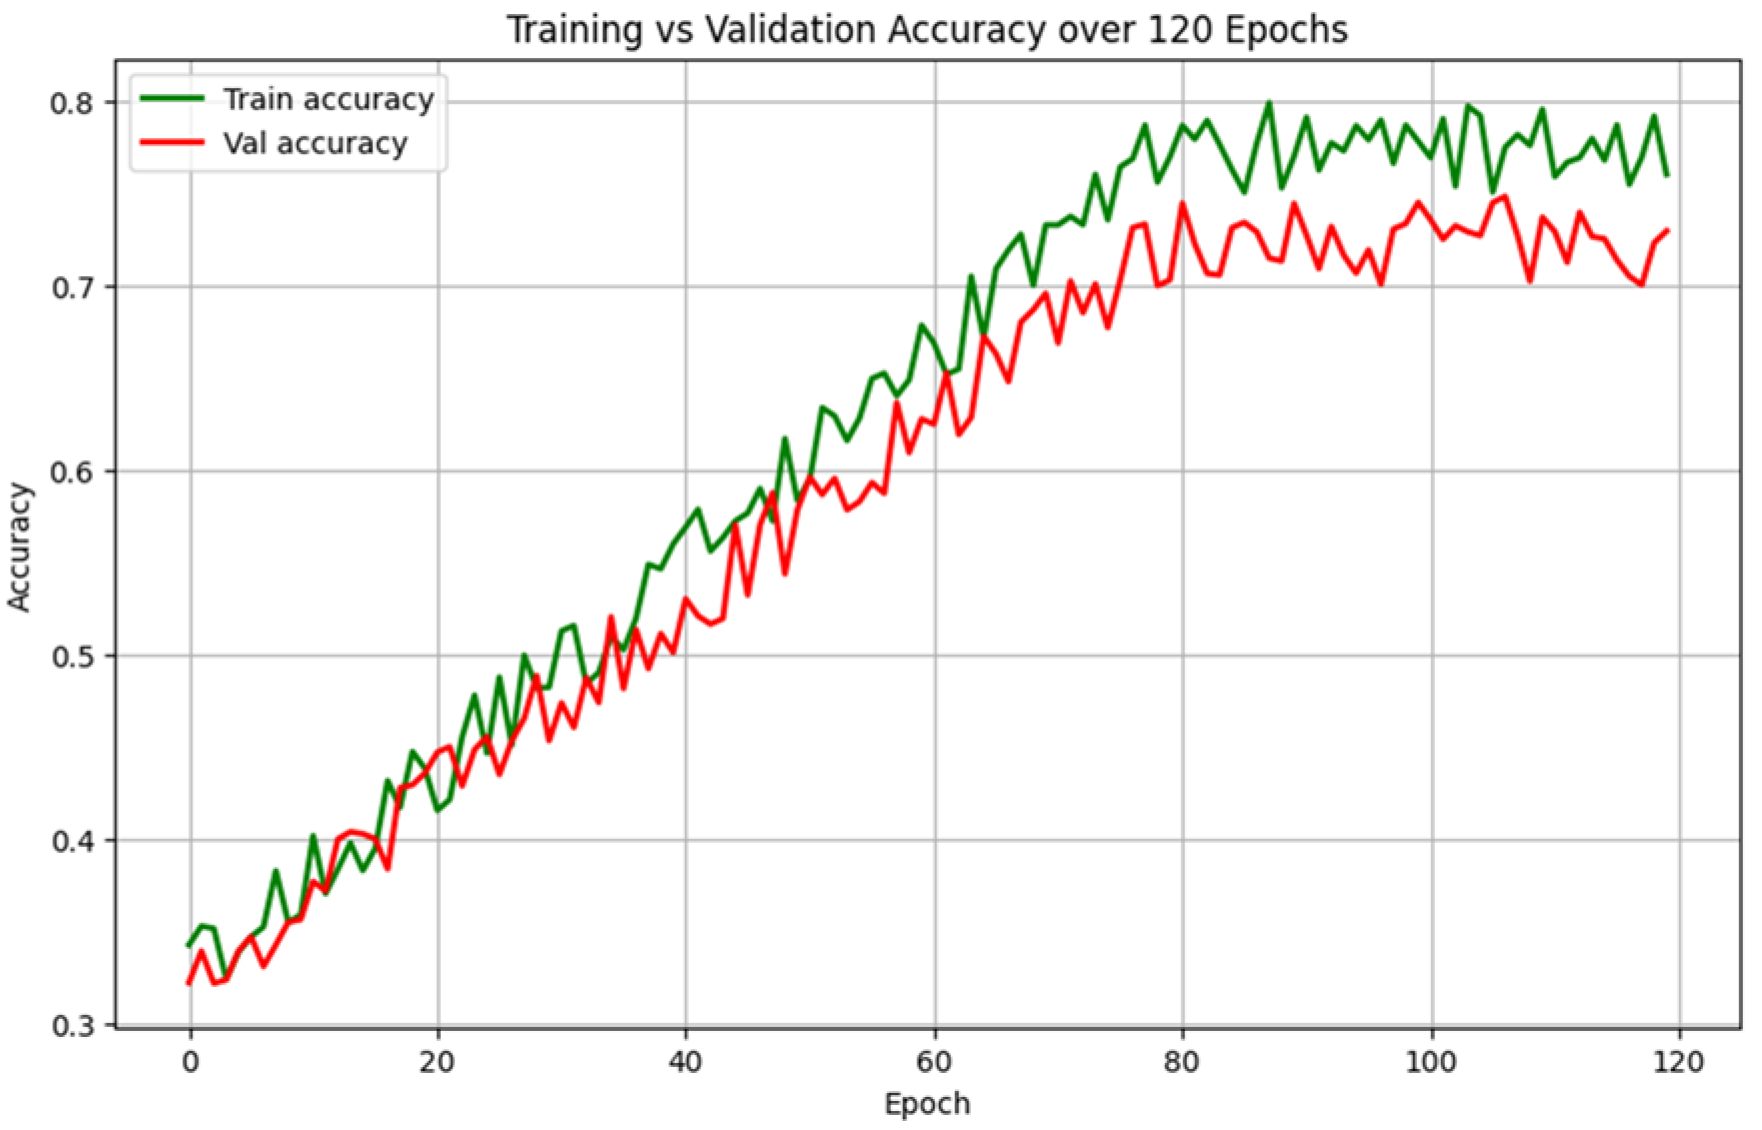
To evaluate our emotion detection pipeline, we used the AffectNet dataset. We used a CNN-LSTM-based model (EmoNet) to predict both discrete emotions and continuous values of valence and arousal for each facial frame. The model was trained over 120 epochs, with a batch size of 16. As shown in Figure 3, the EmoNet model achieved 0.8 accuracy on the training set, with 0.7 accuracy on the validation set, demonstrating good generalization across unseen data. The accuracy gap between training and validation is typical for deep learning models and indicates the model’s ability to learn robust features while maintaining generalizability. After epoch 80, the model’s performance became stable Figure 3.
For testing, we used 8 selected video sequences from the DAiSEE dataset, which were re-annotated for facial emotion recognition. Each video was analyzed frame-by-frame at a rate of 6 frames per second (fps). For each video frame, we predicted a discrete emotion and generated a valence-arousal pair. The valence-arousal values were then aggregated using the arousal-weighted valence method to calculate the global emotion score (Semo), which was normalized to fall within the [0, 1] range.
The following Table 7 summarizes the results of our valence-Arousal prediction for each test sample:
The following 
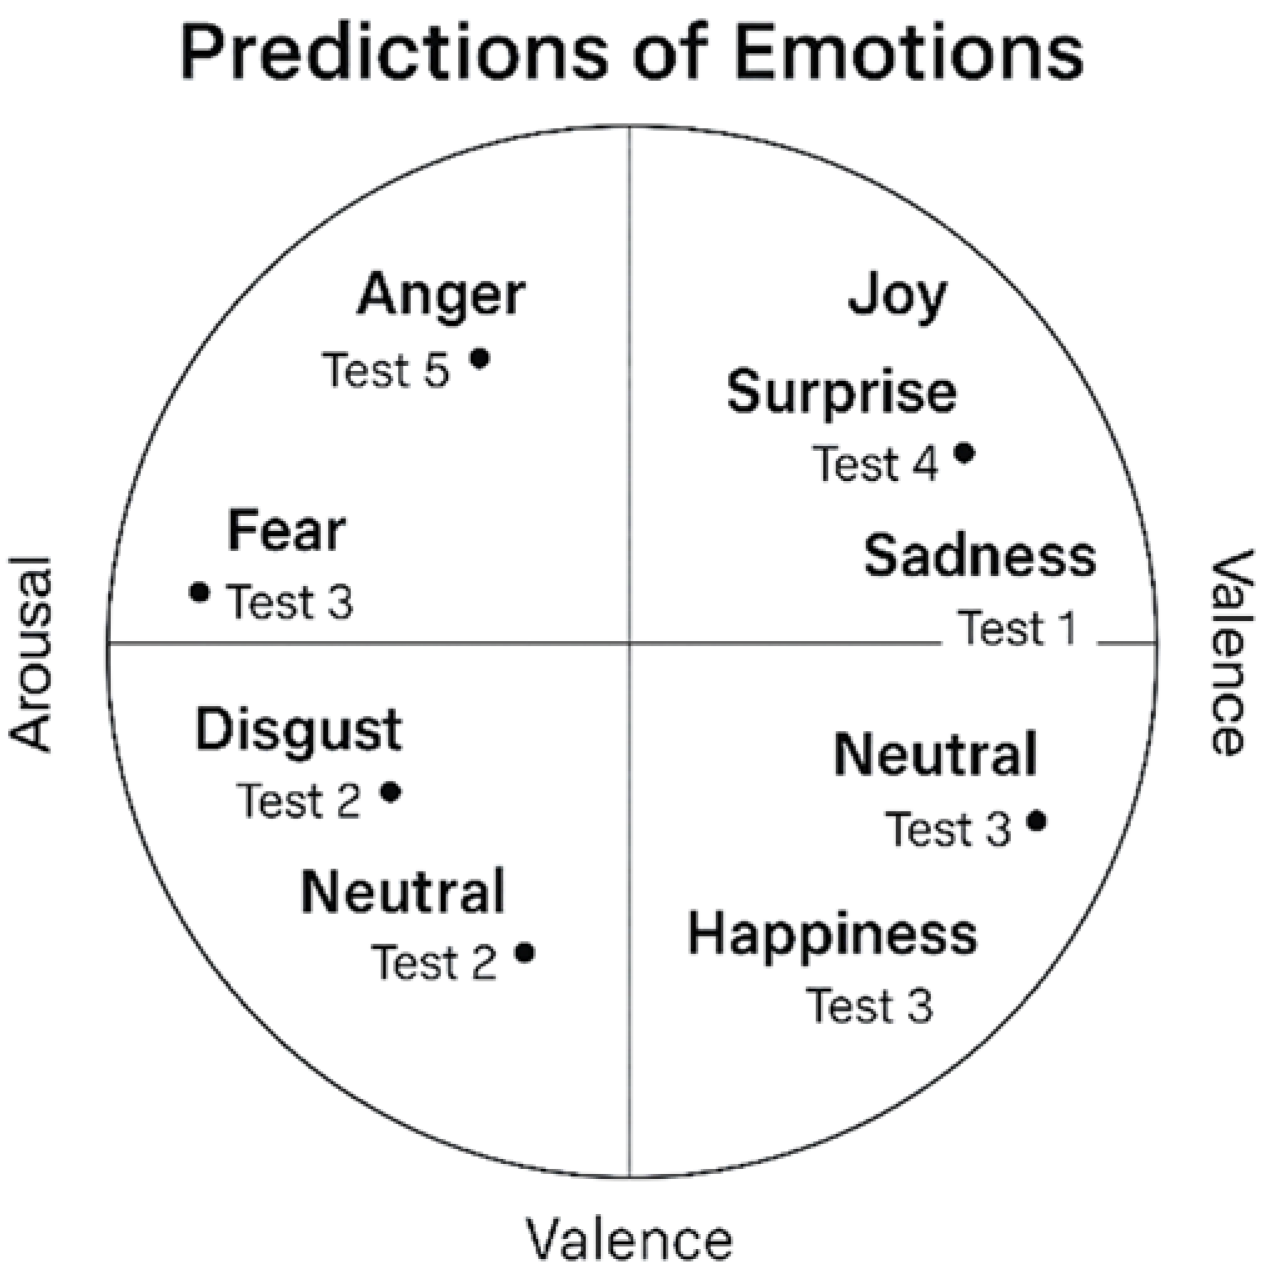
Figure 4 illustrates the prediction of emotions based on the valence-arousal pair for the test set, showing how the predicted emotions are distributed within the valence-arousal circle. This visualization helps to understand the mapping of the predicted emotions in the emotion space:
The results indicate that the model achieves a reliable match between predicted and real valence–arousal pairs, with low Euclidean errors across all cases. Emotion scores span the full spectrum of affective engagement, ranging from deep disengagement (e.g., anger and fear) to high positive engagement (e.g., joy and happiness). This confirms the model’s ability to accurately capture both the polarity and intensity of learners’ emotional states.
The average Euclidean error across the 8 test videos was 0.067, with a standard deviation of ±0.018, computed over three inference runs using different random seeds.

4.3. Sentiment Analysis and Evaluation on Course Reviews

The fine-tuned BERT model on the Course Reviews on Coursera dataset was evaluated using standard metrics such as accuracy, macro F1-score, as well as precision and recall for each class. The batch size was set to 16, with a learning rate of 2 × 10 5 , and a total of 30 epochs. The model achieved an accuracy of 88.1% and a macro F1-score of 84.9%, outperforming the reference models such as Naive Bayes (79.8%) and CNN-GRU (83.2%) [39,40]. The results suggest that BERT excels in capturing emotional nuances in educational feedback, with high precision for the “positive” class and relatively lower results for the “neutral” class.
To assess the accuracy of the predicted sentiment, we computed S sent for a sample from the dataset and compared it to the real annotations. We used metrics like Mean Absolute Error (MAE) and Root Mean Squared Error (RMSE). The results obtained are summarized in Table 8.
While the model performed reliably overall, we observed higher error margins in the “neutral” class (e.g., MAE = 0.17 in Test 5 and 0.28 in Test 4), confirming that this category remains harder to classify. This can be attributed to the inherent ambiguity and semantic overlap in neutral reviews. Future improvements could include the integration of enhanced contextual embeddings to better disambiguate neutral expressions, and the enrichment of the dataset with more representative and balanced samples for this class. Such strategies have been shown to reduce misclassification of neutral sentiment in similar educational domains. Overall, the BERT model has demonstrated robustness in emotion classification and provided accurate sentiment scores, contributing to the overall engagement evaluation of learners.

4.4. Learner Engagement Detection Evaluation

To evaluate our engagement detection pipeline, we built a dedicated subset of the public DAiSEE dataset. To ensure both validity and diversity of the video sequences, we selected 30 videos using an automatic filtering process based on the following criteria:
  • Confidence score 0.9 (provided in DAiSEE official annotations), ensuring reliable engagement labels (“Engaged”, “At Risk”, “Disengaged”).
  • Inter-individual diversity by selecting videos from 10 different users using the user_id attribute, to minimize intra-subject bias.
  • Class balance: 10 videos per engagement class, allowing a symmetric evaluation of predictions.
Although DAiSEE provides validated engagement annotations, we reinforced their robustness with an additional manual annotation procedure. Two independent raters reviewed each video sequence and assigned an engagement label. The inter-rater agreement, measured using Cohen’s Kappa coefficient, was 0.81, indicating strong consistency between annotators.
Each video was processed at 6 frames per second to extract behavioral fatigue indicators (eye closures, yawns, head nods). In parallel, valence and arousal scores were computed using the EmoNet model to estimate facial emotional state. To complete this multimodal analysis, we manually associated a textual comment from the Coursera Reviews corpus with each video.
This manual pairing was based on the following criteria:
  • Semantic consistency: the comment content had to match the visible emotional state in the video (positive, neutral, or negative).
  • Balanced polarity: each engagement class was associated with textual comments reflecting a coherent satisfaction level.
  • Cross-checking by two annotators to ensure subjective validity of the pairing.
Although this manual process does not reflect a truly co-localized learning context, it was used for exploratory purposes to evaluate the benefit of fusing heterogeneous modalities for engagement prediction.
Each extracted score—fatigue S fatigue , emotion S emo , and sentiment S sent —was normalized to the range [ 0 , 1 ] . We then computed a global engagement score S eng using a weighted fusion of the three modalities as described in Equation (17).
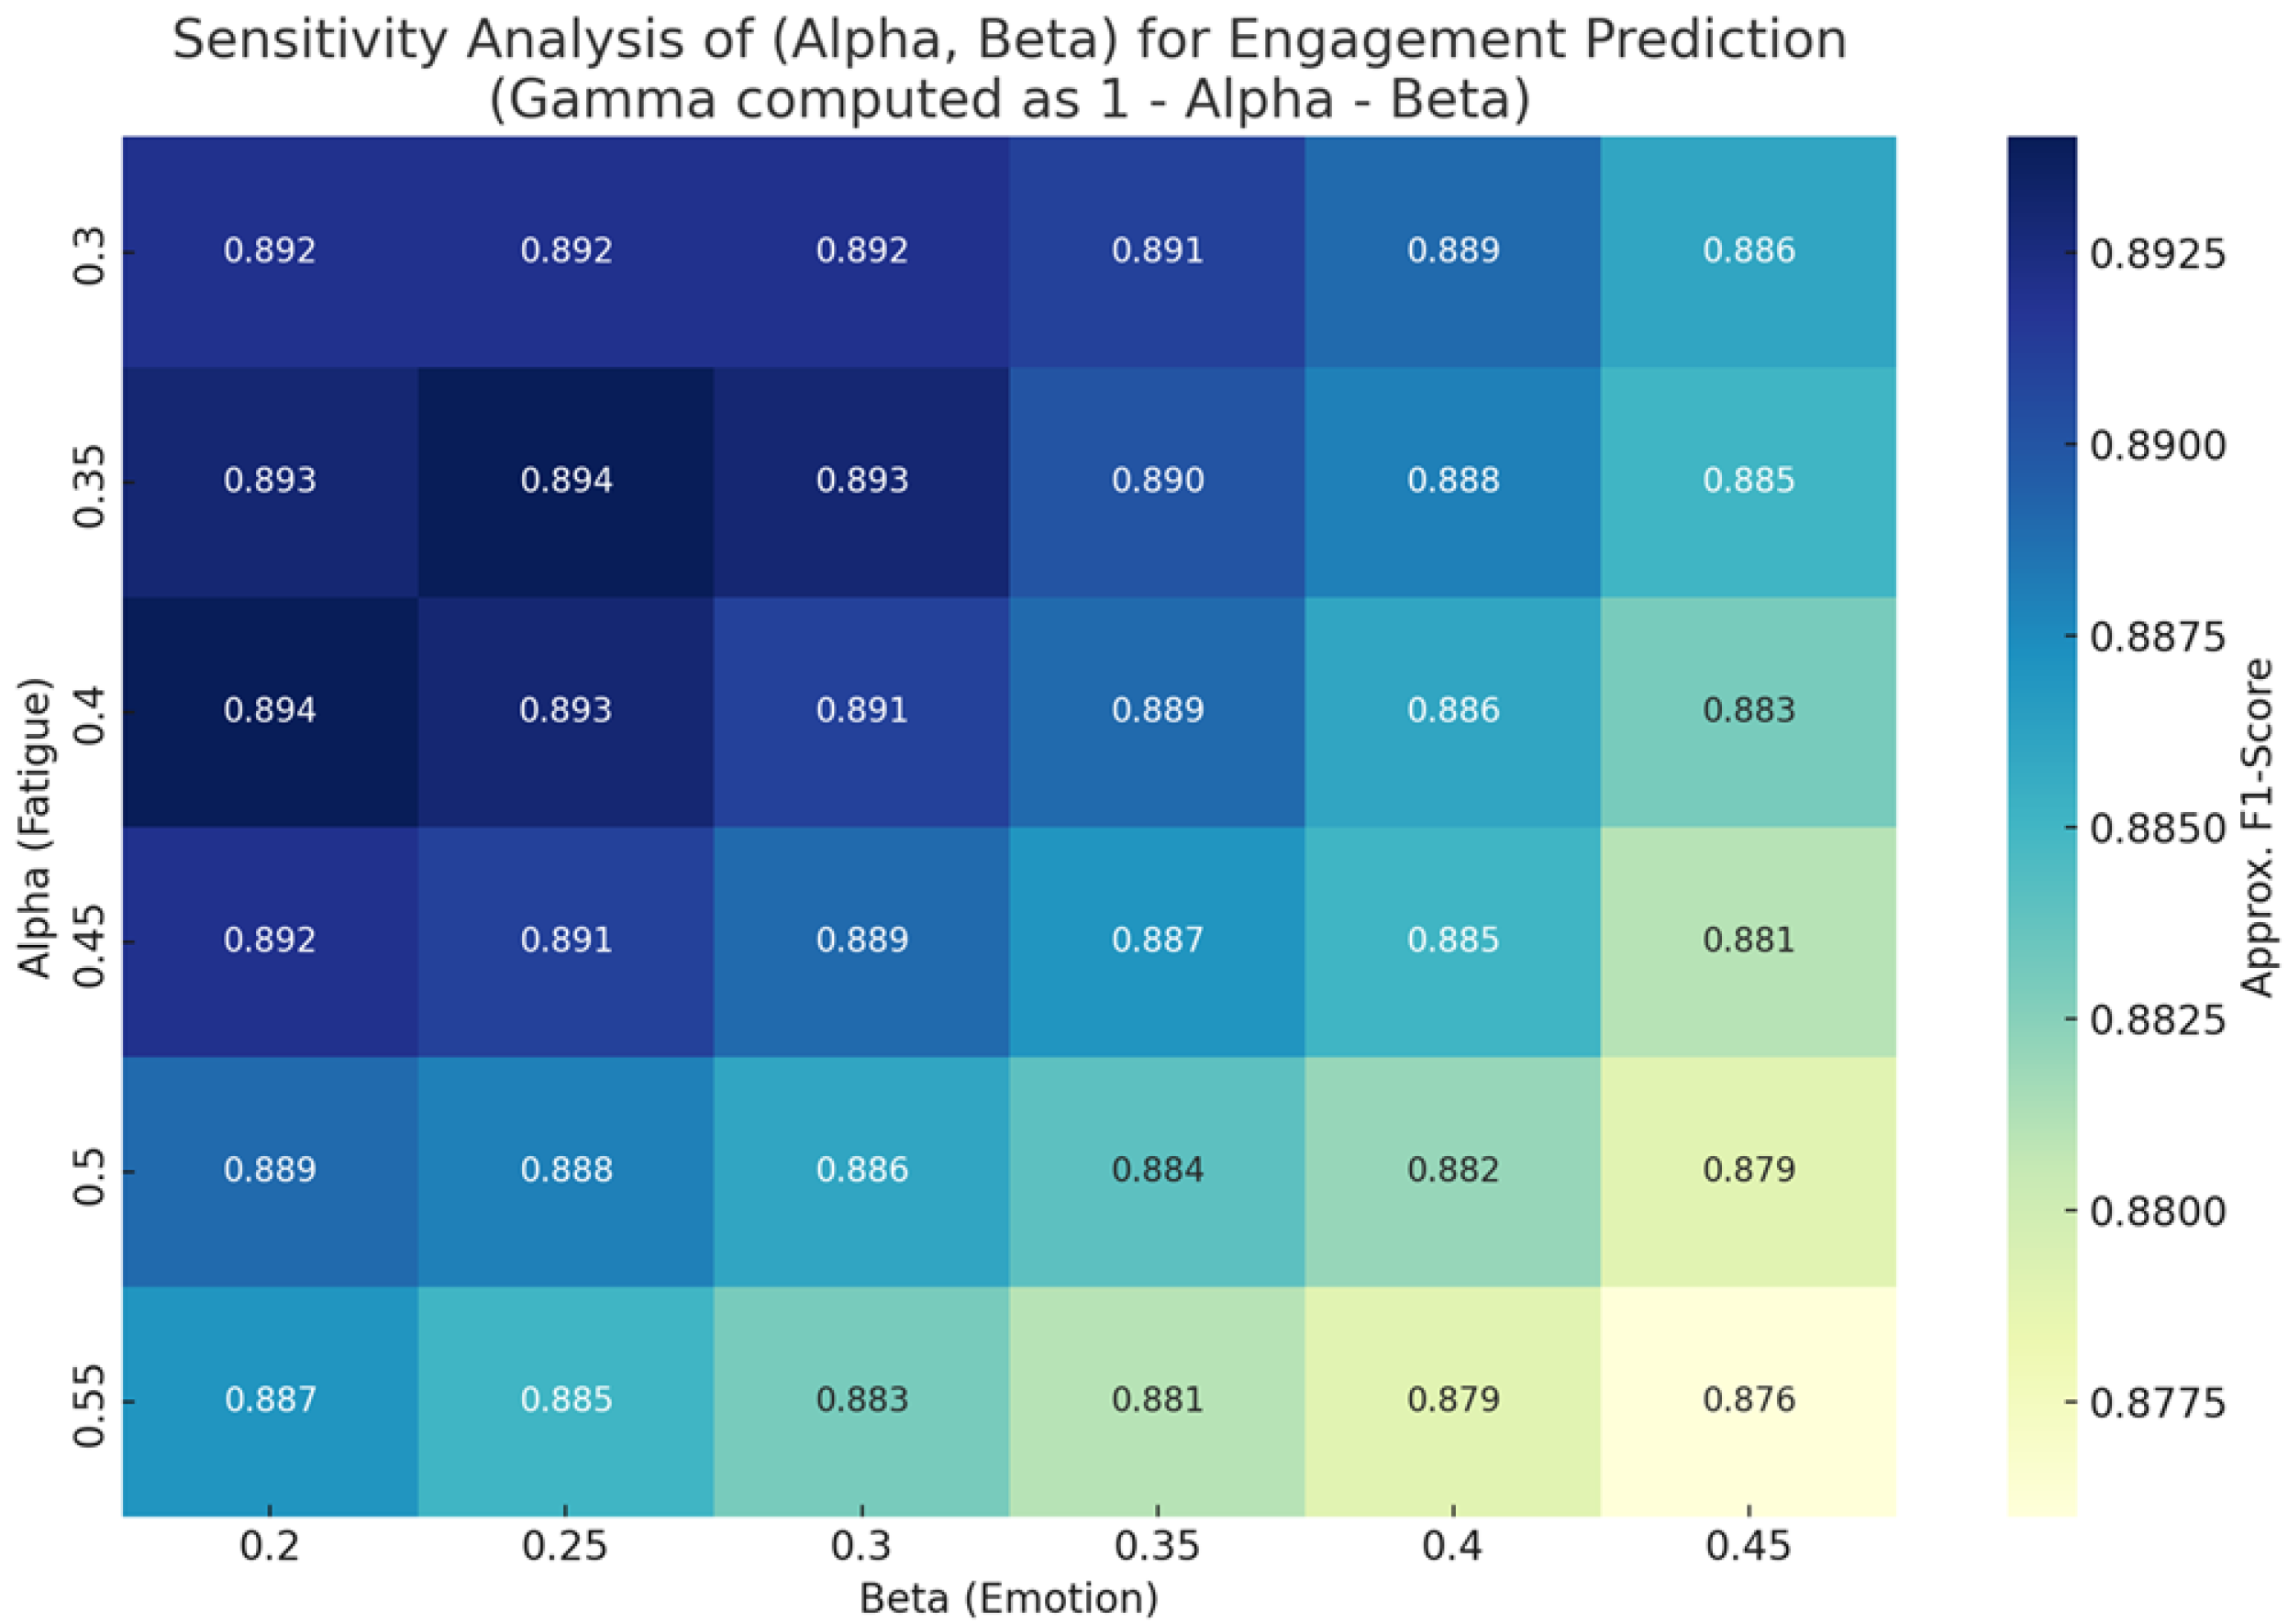
To determine the optimal combination of coefficients ( α , β , γ ) for the engagement fusion formula, we conducted a sensitivity analysis by testing various weighted configurations. The F1-score, which balances precision and recall, was used as the primary evaluation metric to identify the most effective weighting strategy.
As shown in Figure 5, the combination ( α = 0.45 , β = 0.35 , γ = 0.20 ) produced the highest F1-score. This indicates that prioritizing the fatigue dimension—while still accounting for emotional and sentiment cues—results in a more accurate engagement prediction. These findings are consistent with prior research emphasizing the complementary roles of affective and cognitive signals in learner state detection [41].
Table 9 presents a representative sample of 8 cases out of the 30 analyzed videos. Each row details the computed fatigue, emotion, and sentiment scores, along with the predicted global engagement score. Pedagogical recommendations are associated with each profile to guide the adaptation of content and pace.
For instance, in video V2, the learner exhibits moderate fatigue but high emotional and semantic scores, resulting in an “Engaged” prediction. In this case, maintaining the current learning rhythm while offering stimulating content is advised to support motivation.
In contrast, video V7 shows all signals pointing to a clear disengagement: high fatigue, low emotion, and neutral sentiment. A temporary interruption of activities, followed by a gradual re-engagement strategy, is recommended.
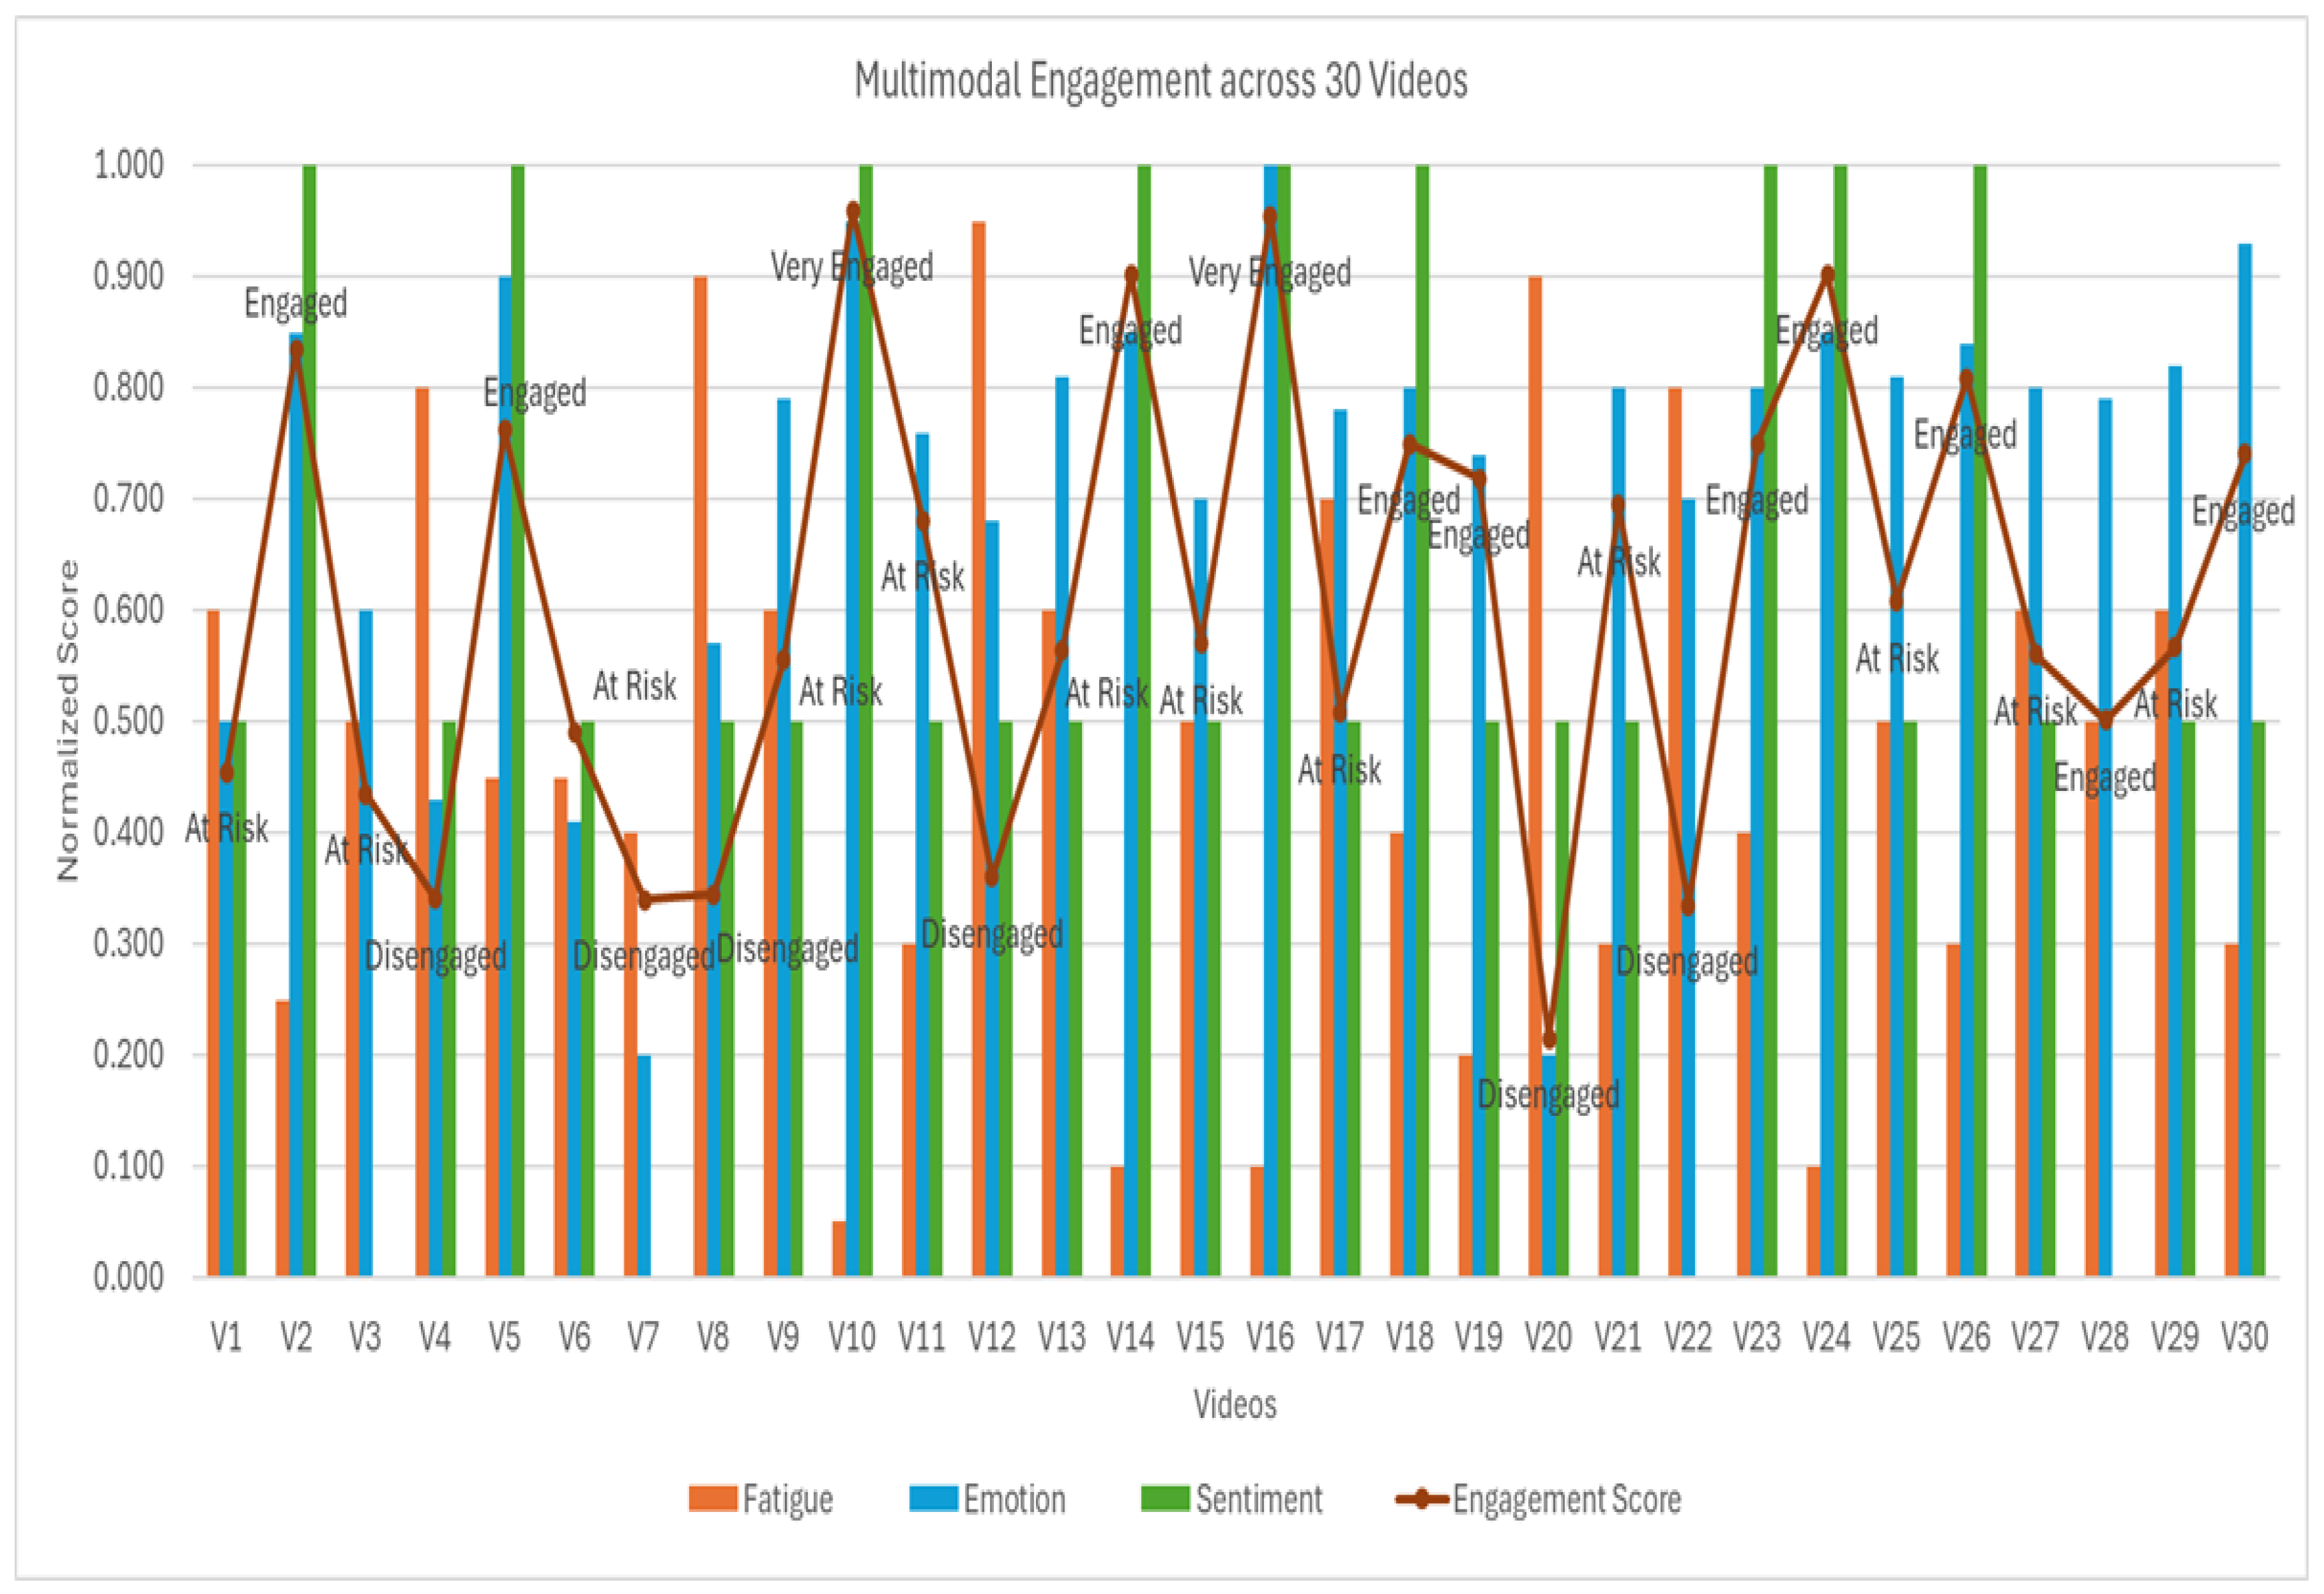
Figure 6 provides an overview of the 30 selected videos, illustrating normalized scores for each dimension (fatigue, emotion, sentiment) and the corresponding engagement classes (Very Engaged, Engaged, At Risk, Disengaged). This visualization highlights the diversity of learner profiles.
These results confirm that engagement detection requires a combined multimodal analysis. Some learners show signs of “At Risk” engagement despite physiological fatigue (e.g., V3), supported by emotional involvement. When all three dimensions converge toward low engagement scores (as in V4 or V7), the system detects significant cognitive and emotional withdrawal.
This cross-modality perspective supports the relevance of a weighted fusion approach, capable of capturing the complexity of learners’ internal states and fueling personalized recommendations to improve the learning experience. As such, this multimodal and weighted approach constitutes not only a robust framework for diagnosing engagement levels but also opens the door to intelligent systems that can deliver adaptive pedagogical responses tailored to each learner’s profile.

5. Conclusions and Future Work

This study addressed the limitations of unimodal approaches in learner engagement detection by introducing a unified multimodal architecture that fuses visual fatigue indicators, facial affect recognition, and textual sentiment analysis from learner feedback. Unlike existing frameworks relying on isolated signals, our model captures the dynamic interplay of cognitive and emotional states, providing a richer understanding of learner engagement.
The proposed system demonstrated promising results across public benchmark datasets: 88.5% accuracy for fatigue detection (DAiSEE), 70% accuracy for emotion recognition (AffectNet), and 91.5% for sentiment classification (MOOC Reviews). These results validate both the performance of individual modules and the effectiveness of their weighted integration into a global engagement index, which successfully enabled personalized pedagogical recommendations (e.g., suggesting breaks, simplifying content, or triggering instructor interventions). Despite these strengths, certain limitations were observed—particularly in low-confidence predictions for neutral sentiments and missed fatigue cues due to technical constraints (e.g., occlusion).
These highlight opportunities for immediate improvements while also reflecting the current proof-of-concept nature of the system, which relies on independently sourced datasets.
As next steps, our future work will include the following directions:
  • Incorporating postural cues using skeletal tracking tools such as OpenPose to enhance fatigue detection in scenarios involving slouching or restlessness.
  • Improving robustness to occlusions and lighting variations by integrating a frame-quality detection module and performing targeted data augmentation.
  • Expanding neutral sentiment coverage through contextualized language models (e.g., RoBERTa, DeBERTa) fine-tuned on a larger and better-balanced sample set.
  • Conducting cross-platform deployment and A/B testing in real e-learning environments to assess real-world pedagogical impact and user satisfaction.
Ethical Considerations. As the proposed model relies on facial and textual data, future deployment scenarios must address ethical and privacy concerns. All experiments in this study were performed on publicly available anonymized datasets. However, real-time applications should ensure on-device processing, face anonymization, and full compliance with data protection regulations such as GDPR. Strategies such as federated learning or edge inference will be explored to preserve user privacy without compromising engagement prediction quality. Ultimately, this work lays the foundation for the development of emotionally adaptive learning environments capable of responding in real time to fluctuations in learner engagement, with the long-term goal of enhancing personalization, retention, and learning outcomes at scale.

Author Contributions

Conceptualization, Q.E.M.; Methodology, Q.E.M. and A.R.; Validation, Q.E.M. and A.R.; Formal analysis, Q.E.M. and A.R.; Writing—original draft preparation, Q.E.M. All authors have read and agreed to the published version of the manuscript.

Funding

This research received no external funding.

Data Availability Statement

The data that support the findings of this study are openly available in Vineethnb and Kaggle at: https://people.iith.ac.in/vineethnb/resources/daisee/index.html (accessed on 2 May 2025), https://www.kaggle.com/datasets/mstjebashazida/affectnet (accessed on 2 May 2025), https://www.kaggle.com/datasets/imuhammad/course-reviews-on-coursera (accessed on 2 May 2025).

Conflicts of Interest

The authors declare no conflicts of interest.

References

  1. Jiang, L.; Zhou, N.; Yang, Y. Student motivation and engagement in online language learning using virtual classrooms: Interrelationships with support, attitude and learner readiness. Educ. Inf. Technol. 2024, 29, 17119–17143. [Google Scholar] [CrossRef]
  2. Gumasing, M.J.; Dahilig, J.A.; Taw, C.A.; Valeriano, C. Effects of Boredom on the Academic Engagement of Students during Online Class. In Proceedings of the 7th North American International Conference on Industrial Engineering and Operations Management, Orlando, FL, USA, 12–14 June 2022; pp. 12–14. [Google Scholar]
  3. Whitehill, J.; Serpell, Z.; Lin, Y.-C.; Foster, A.; Movellan, J.R. The Faces of Engagement: Automatic Recognition of Student Engagementfrom Facial Expressions. IEEE Trans. Affect. Comput. 2014, 5, 86–98. [Google Scholar] [CrossRef]
  4. Zhao, W.; Xie, X.; Wang, M.; Wang, Y.; Nie, K.; Zhao, H.; Xu, Z. Research Progress on Psychological Health Assessment of College Students Based on Eye Movement, EEG, and Facial Expression Recognition. In Health Information Processing. CHIP 2024. Communications in Computer and Information Science; Zhang, Y., Chen, Q., Lin, H., Liu, L., Liao, X., Tang, B., Hao, T., Huang, Z., Eds.; Springer: Singapore, 2025; Volume 2432. [Google Scholar]
  5. Shaik, T.; Tao, X.; Li, Y.; Dann, C.; McDonald, J.; Redmond, P.; Galligan, L. A review of the trends and challenges in adopting natural language processing methods for education feedback analysis. IEEE Access 2022, 10, 56720–56739. [Google Scholar] [CrossRef]
  6. Tan, K.L.; Lee, C.P.; Lim, K.M. A Survey of Sentiment Analysis: Approaches, Datasets, and Future Research. Appl. Sci. 2023, 13, 4550. [Google Scholar] [CrossRef]
  7. Kokoç, M.; Akçapınar, G.; Hasnine, M.N. Mohammad Nehal. Unfolding students’ online assignment submission behavioral patterns using temporal learning analytics. Educ. Technol. Soc. 2021, 24, 223–235. [Google Scholar]
  8. Hossen, M.K.; Uddin, M.S. From data to insights: Using gradient boosting classifier to optimize student engagement in online classes with explainable AI. Educ. Inf. Technol. 2025; online first. [Google Scholar] [CrossRef]
  9. Devlin, J.; Chang, M.-W.; Lee, K.; Toutanova, K. Bert: Pre-training of deep bidirectional transformers for language understanding. arXiv 2018, arXiv:1810.04805. [Google Scholar]
  10. Zhang, F.; Su, J.; Geng, L.; Xiao, Z. Driver Fatigue Detection Based on Eye State Recognition. In Proceedings of the International Conference on Machine Vision and Information Technology (CMVIT), Singapore, 17–19 February 2017; pp. 105–110. [Google Scholar] [CrossRef]
  11. Zhu, T.; Zhang, C.; Wu, T.; Ouyang, Z.; Li, H.; Na, X.; Liang, J.; Li, W. Research on a real-time driver fatigue detection algorithm based on facial video sequences. Appl. Sci. 2022, 12, 2224. [Google Scholar] [CrossRef]
  12. Zhang, S.; Zhang, Z.; Chen, Z.; Lin, S.; Xie, Z. A novel method of mental fatigue detection based on CNN and LSTM. Int. J. Comput. Sci. Eng. 2021, 24, 290–300. [Google Scholar] [CrossRef]
  13. Ren, Z.; Li, R.; Chen, B.; Zhang, H.; Ma, Y.; Wang, C.; Lin, Y.; Zhang, Y. EEG-based driving fatigue detection using a two-level learning hierarchy radial basis function. Front. Neurorobot. 2021, 15, 618408. [Google Scholar] [CrossRef]
  14. Gao, Z.; Chen, X.; Xu, J.; Yu, R.; Zhang, H.; Yang, J. Semantically-Enhanced Feature Extraction with CLIP and Transformer Networks for Driver Fatigue Detection. Sensors 2024, 24, 7948. [Google Scholar] [CrossRef]
  15. Wang, Y.; Yan, S.; Liu, Y.; Song, W.; Liu, J.; Chang, Y.; Mai, X.; Hu, X.; Zhang, W.; Gan, Z. A Survey on Facial Expression Recognition of Static and Dynamic Emotions. arXiv 2024, arXiv:2408.15777. [Google Scholar]
  16. Toisoul, A.; Kossaifi, J.; Bulat, A.; Tzimiropoulos, G.; Pantic, M. Estimation of continuous valence and arousal levels from faces in naturalistic conditions. Nat. Mach. Intell. 2021, 3, 42–50. [Google Scholar] [CrossRef]
  17. Kosti, R.; Alvarez, J.M.; Recasens, A.; Lapedriza, A. Context based emotion recognition using emotic dataset. IEEE Trans. Pattern Anal. Mach. Intell. 2019, 42, 2755–2766. [Google Scholar] [CrossRef] [PubMed]
  18. Kollias, D. Multi-label compound expression recognition: C-expr database & network. In Proceedings of the IEEE/CVF Conference on Computer Vision and Pattern Recognition, Vancouver, BC, Canada, 18–22 June 2023; pp. 5589–5598. [Google Scholar]
  19. Kenton, J.D.; Toutanova, L.K. Bert: Pre-training of deep bidirectional transformers for language understanding. In Proceedings of the 2019 Conference of the North American Chapter of the Association for Computational Linguistics: Human Language Technologies, Volume 1 (Long and Short Papers); Association for Computational Linguistics: Minneapolis, MN, USA, 2019; pp. 4171–4186. [Google Scholar]
  20. Liu, Y.; Ott, M.; Goyal, N.; Du, J.; Joshi, M.; Chen, D.; Levy, O.; Lewis, M.; Zettlemoyer, L.; Stoyanov, V. Roberta: A robustly optimized bert pretraining approach. arXiv 2019, arXiv:1907.11692. [Google Scholar]
  21. Pant, H.V.; Lohani, M.C.; Pande, J. Thematic and Sentiment Analysis of Learners’ Feedback in MOOCs. J. Learn. Dev. 2023, 10, 38–54. [Google Scholar] [CrossRef]
  22. Zhang, L.; Wang, S.; Liu, B. Deep learning for sentiment analysis: A survey. Wiley Interdiscip. Rev. Data Min. Knowl. Discov. 2018, 8, e1253. [Google Scholar] [CrossRef]
  23. Zheng, Z.; Lu, X.Z.; Chen, K.Y.; Zhou, Y.C.; Lin, J.R. Pretrained domain-specific language model for natural language processing tasks in the AEC domain. Comput. Ind. 2022, 142, 103733. [Google Scholar] [CrossRef]
  24. Li, Q. Advancements in driver fatigue detection: A comprehensive analysis of eye movement and facial feature approaches. Appl. Comput. Eng. 2024, 65, 75–80. [Google Scholar] [CrossRef]
  25. Cech, J.; Soukupova, T. Real-Time Eye Blink Detection Using Facial Landmarks; Center for Machine Perception, Department of Cybernetics, Faculty of Electrical Engineering Czech Technical University: Prague, Czech Republic, 2016; pp. 1–8. [Google Scholar]
  26. Fu, B.; Boutros, F.; Lin, C.T.; Damer, N. A survey on drowsiness detection–modern applications and methods. IEEE Trans. Intell. Veh. 2024. [Google Scholar] [CrossRef]
  27. Xu, X.; Teng, X. Classroom attention analysis based on multiple euler angles constraint and head pose estimation. In International Conference on Multimedia Modeling; Springer International Publishing: Cham, Switzerland, 2019; pp. 329–340. [Google Scholar]
  28. Zhang, Z. A flexible new technique for camera calibration. IEEE Trans. Pattern Anal. Mach. Intell. 2002, 22, 1330–1334. [Google Scholar] [CrossRef]
  29. George, A.; Routray, A. Design and implementation of real-time algorithms for eye tracking and PERCLOS measurement for on board estimation of alertness of drivers. arXiv 2015, arXiv:1505.06162. [Google Scholar]
  30. Jia, H.; Xiao, Z.; Ji, P. Real-time fatigue driving detection system based on multi-module fusion. Comput. Graph. 2022, 108, 22–33. [Google Scholar] [CrossRef]
  31. Zhao, L.; Li, M.; He, Z.; Ye, S.; Qin, H.; Zhu, X.; Dai, Z. Data-driven learning fatigue detection system: A multimodal fusion approach of ECG (electrocardiogram) and video signals. Measurement 2022, 201, 111648. [Google Scholar] [CrossRef]
  32. Koelstra, S.; Muhl, C.; Soleymani, M.; Lee, J.S.; Yazdani, A.; Ebrahimi, T.; Pun, T.; Nijholt, A.; Patras, I. Deap: A database for emotion analysis; using physiological signals. IEEE Trans. Affect. Comput. 2011, 3, 18–31. [Google Scholar] [CrossRef]
  33. Soleymani, M.; Garcia, D.; Jou, B.; Schuller, B.; Chang, S.F.; Pantic, M. A survey of multimodal sentiment analysis. Image Vis. Comput. 2017, 65, 3–14. [Google Scholar] [CrossRef]
  34. Russell, J.A. A circumplex model of affect. J. Personal. Soc. Psychol. 1980, 39, 1161. [Google Scholar] [CrossRef]
  35. Mollahosseini, A.; Hasani, B.; Mahoor, M.H. Affectnet: A database for facial expression, valence, and arousal computing in the wild. IEEE Trans. Affect. Comput. 2017, 10, 18–31. [Google Scholar] [CrossRef]
  36. Pekrun, R.; Goetz, T.; Titz, W.; Perry, R.P. Academic emotions in students’ self-regulated learning and achievement: A program of qualitative and quantitative research. Educ. Psychol. 2002, 37, 91–105. [Google Scholar] [CrossRef]
  37. Pintrich, P.R. An achievement goal theory perspective on issues in motivation terminology, theory, and research. Contemp. Educ. Psychol. 2000, 25, 92–104. [Google Scholar] [CrossRef]
  38. D’mello, S.; Graesser, A. AutoTutor and affective AutoTutor: Learning by talking with cognitively and emotionally intelligent computers that talk back. ACM Trans. Interact. Intell. Syst. (TiiS) 2013, 2, 1–39. [Google Scholar] [CrossRef]
  39. Mujahid, M.; Lee, E.; Rustam, F.; Washington, P.B.; Ullah, S.; Reshi, A.A.; Ashraf, I. Sentiment analysis and topic modeling on tweets about online education during COVID-19. Appl. Sci. 2021, 11, 8438. [Google Scholar] [CrossRef]
  40. Baqach, A.; Battou, A. A new sentiment analysis model to classify students’ reviews on MOOCs. Educ. Inf. Technol. 2024, 29, 16813–16840. [Google Scholar] [CrossRef]
  41. D’Mello, S. A selective meta-analysis on the relative incidence of discrete affective states during learning with technology. J. Educ. Psychol. 2013, 105, 1082. [Google Scholar] [CrossRef]
Figure 1. The Proposed Architecture.
Computers 14 00314 g001
Figure 2. Model CNN-LSTM Performance Metrics.
Computers 14 00314 g002
Figure 3. Model Emonet-LSTM Accuracy.
Computers 14 00314 g003
Figure 4. Prediction of Emotion—Valence-Arousal.
Computers 14 00314 g004
Figure 5. Sensitivity Analysis.
Computers 14 00314 g005
Figure 6. Multimodal engagement.
Computers 14 00314 g006
Table 1. Weights used for fatigue score computation.
IndicatorSymbolWeight w i
Eye closure ratePERCLOS0.35
Blink frequencyBlinkFreq0.25
Yawn frequencyYawnFreq0.20
Head nod frequencyNodFreq0.20
Table 2. Emotion score zones and AffectNet-based interpretation.
Affective ZoneEmotionsScore Range S emo Pedagogical Interpretation
Positive engagementJoy, Surprise0.75–1.0Emotionally favorable state for learning; high motivation and attention [36].
Emotional tensionAnger, Fear, Disgust0.40–0.75High arousal but negative valence—may signal stress or cognitive overload [37].
Gradual disengagementNeutral, Contempt0.25–0.40Low emotional involvement; learner may be passive or drifting [38].
Deep disengagementSadness0–0.25Clear affective withdrawal; risk of dropout or strong demotivation.
Table 3. Classification of learner engagement levels.
ScoreEngagement LevelBehavioral ManifestationRecommendation
S eng ≈ 1Very EngagedPositive engagement (joy, motivation, serenity)Continue, encourage active participation
0.7 ≤ S eng < 1EngagedModerate emotional engagement (interest)Stimulate with challenges, offer rewards
0.4 ≤ S eng < 0.7At RiskTendency toward boredom, fatigue, or distractionPause, revise content, provide personalized support
S eng < 0.4DisengagedLack of interest, strong distraction, frustrationUrgent interventions: long pause, contact with tutor
Table 4. Results of Blink and Eye Closure Detection Tests.
TestReal Number of Blinks (Times/min)Detected BlinksPrecision (%)Real Number of Eye Closures (PERCLOS)Detected ClosuresPrecision (%)
178100 %33100 %
2181794.4 %55100 %
3222395.5 %4375 %
4111090.9 %66100 %
5262796.2 %7885.7 %
Table 5. Results of Yawning Detection Tests.
TestReal Number of Yawns (Times/min)Detected YawnsPrecision (%)
122100%
24580%
3100%
434100%
52366.7%
Table 6. Results of the Composite Fatigue Index Experiments.
TestEye Closure FrequencyYawning FrequencyHead Nods FrequencyPERCLOS (%)Fatigue Severity
img.13210.1180.248
img.25420.2510.379
img.34310.4130.548
img.46320.1970.403
img.57240.3120.598
Table 7. Comparison of predicted vs. real valence-arousal pairs, with emotion score S emo and error.
TestEmotionValence Pred.Valence RealArousal Pred.Arousal RealError (Euclid) S emo
Test 1Sadness0.200.25−0.40−0.350.070.60
Test 2Disgust−0.40−0.45−0.40−0.500.110.30
Test 3Fear−0.50−0.550.600.650.070.25
Test 4Surprise0.500.480.700.750.0580.75
Test 5Anger−0.60−0.650.700.720.0530.20
Test 6Happiness0.600.65−0.30−0.250.070.80
Test 7Neutral0.000.05−0.30−0.280.0530.50
Test 8Joy0.700.750.800.820.0530.85
Table 8. Predicted sentiment scores.
TestPredicted Sentiment ScoreReal SentimentReal Sentiment ScoreError
Test 10.809Positive1.00.1905
Test 20.43Neutral0.50.07
Test 30.06Negative0.0−0.06
Test 40.72Positive1.00.28
Test 50.33Neutral0.50.17
Table 9. Engagement Prediction Based on Combined Fatigue, Emotion, and Sentiment -8 Videos.
TestFatigueEmotionSentimentScore.EngPred. EngagementReal EngagementRecommendation
V10.60.50.50.455At RiskAt RiskStimulate with content-based rewards
V20.250.8510.835EngagedEngagedSustain motivation, maintain current rhythm
V30.50.600.435At RiskAt RiskHigh emotion detected, suggest active engagement strategy
V40.80.430.50.34DisengagedDisengagedSuspend activity, recommend gradual re-engagement
V50.450.910.7625EngagedEngagedSustain motivation, maintain current rhythm
V60.450.410.50.491At RiskAt RiskStimulate with content-based rewards
V70.40.200.34DisengagedDisengagedSuspend activity, recommend gradual re-engagement
V80.90.570.50.344DisengagedAt RiskSuspend activity, recommend gradual re-engagement
Disclaimer/Publisher’s Note: The statements, opinions and data contained in all publications are solely those of the individual author(s) and contributor(s) and not of MDPI and/or the editor(s). MDPI and/or the editor(s) disclaim responsibility for any injury to people or property resulting from any ideas, methods, instructions or products referred to in the content.

