1. Introduction
In 2015, the United Nations launched the 17 Sustainable Development Goals (SDGs) as a global call to action to eradicate poverty, protect the planet, and ensure prosperity for all by 2030 [
1]. Additionally, within this framework, digital sustainability (DS) plays a pivotal role by promoting responsible technology use that minimises ecological harm while maximising efficiency, accessibility, and ethical data practices [
2]. Furthermore, key applications of digital sustainability include accelerating clean energy solutions (SDG 7) through smart grids and energy efficient systems [
3]; expanding access to quality education (SDG 4) via e-learning platforms and digital resources [
4]; supporting sustainable infrastructure (SDG 9) through environmentally friendly digital systems [
5]; and advancing climate action (SDG 13) by leveraging AI and big data for environmental monitoring and predictive analytics [
6].
Additionally, these technologies are a critical enabler of ecological sustainability, offering transformative solutions that reduce pollution, optimise resource use, curb dependence on finite natural resources, and mitigate the impacts of climate change [
7]. Across sectors, innovative applications are reshaping approaches to ecological preservation while advancing the Sustainable Development Goals [
8]. However, the digital ecosystem itself carries an environmental cost. Although the energy required for a single internet search or e-mail is minimal, its cumulative impact is substantial [
9]. Notably, approximately 5.56 billion people used the internet at the start of 2025, representing 67.9% of the global population [
10]. Additionally, the number of internet users increased by 136 million (+2.5%) in 2024 [
11]. However, 2.63 billion people remained offline at the beginning of 2025; thus, these small energy demands, along with the associated greenhouse gas emissions from each online activity, add up [
10]. Likewise, according to some estimates, the carbon footprint of our gadgets, the internet, and their supporting systems accounts for about 4.0% of global greenhouse gas emissions [
12].
In the higher education context, the diverse technological models, especially the artificial intelligence models (AIM), catalyse inclusive, equitable, and efficient learning [
13]. Moreover, these models enhance student engagement through key factors such as content availability, learning engagement, motivation, and learner involvement, all of which contribute to greater user satisfaction and support the delivery of interactive and adaptive content [
14,
15]. In particular, AIMs also expand access to global knowledge and enable personalised learning experiences tailored to diverse learner needs [
16]. Additionally, AIMs foster collaboration between educators and students, streamline academic and administrative processes, and ultimately prepare learners for a future driven by technology [
17].
In recent years, several studies, particularly within Saudi Arabia, have focused on notable progress in integrating the SDGs into higher education, primarily through the adoption of information technology frameworks [
18,
19,
20,
21]. However, a critical application gap remains between theoretical alignment and practical application, particularly in linking these frameworks to measurable digital sustainability conceptions. Hence, to bridge this gap, the current study presents an empirical investigation into the relationship between students’ intention to use technologies, particularly artificial intelligence (AI) models, in learning practices and their awareness of digital sustainability conceptions (DSC), introduced as a novel outcome variable. Likewise, this relationship is further explored within the context of the educational application of AI-powered natural language processing (AI-NLP) models. Additionally, to guide this investigation, the study adopts an extended unified theory of acceptance and use of technology (UTAUT) framework. Accordingly, the study seeks to address the following research questions:
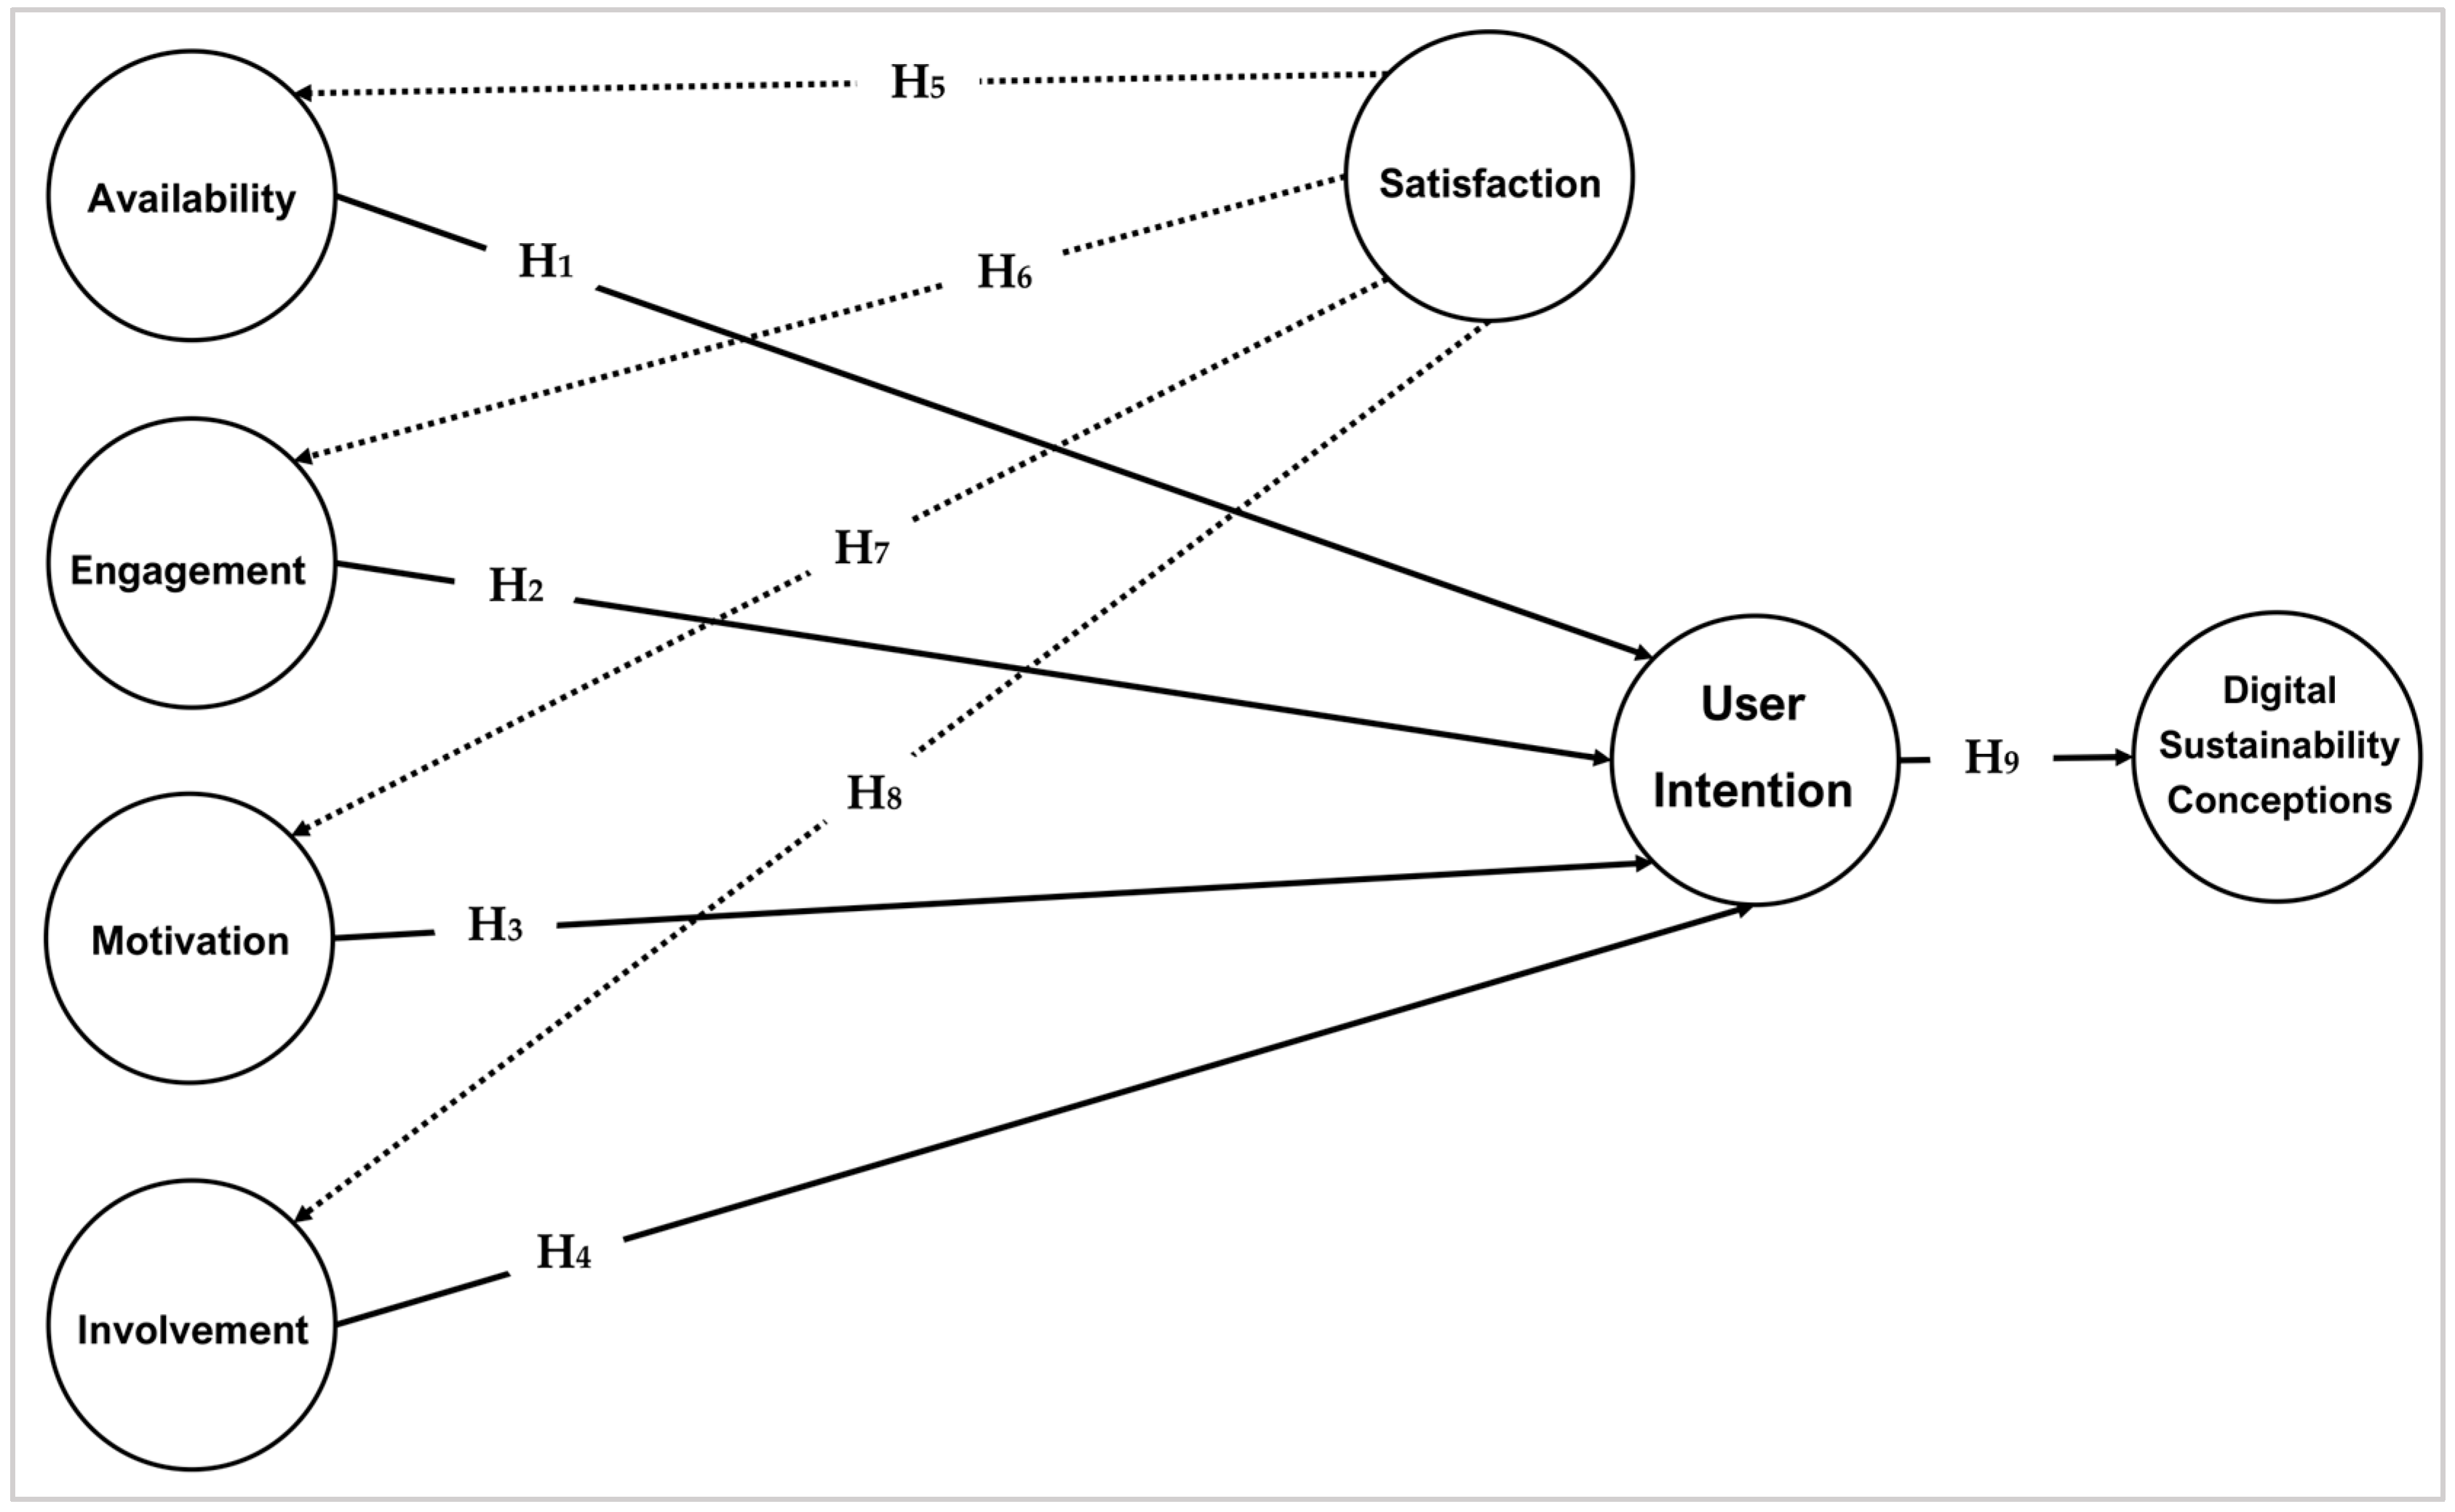
RQ1: To what extent do content availability (CA), learning engagement (LE), learning motivation (LM), and learner involvement (LI) influence user intention (UI) to adopt AI-NLP models in higher education?
RQ2: Does AI satisfaction (AS) moderate the relationships between each cognitive–affective factor (CA, LE, LM, and LI) and UI?
RQ3: What is the effect of UI on students’ DSC?
4. Results
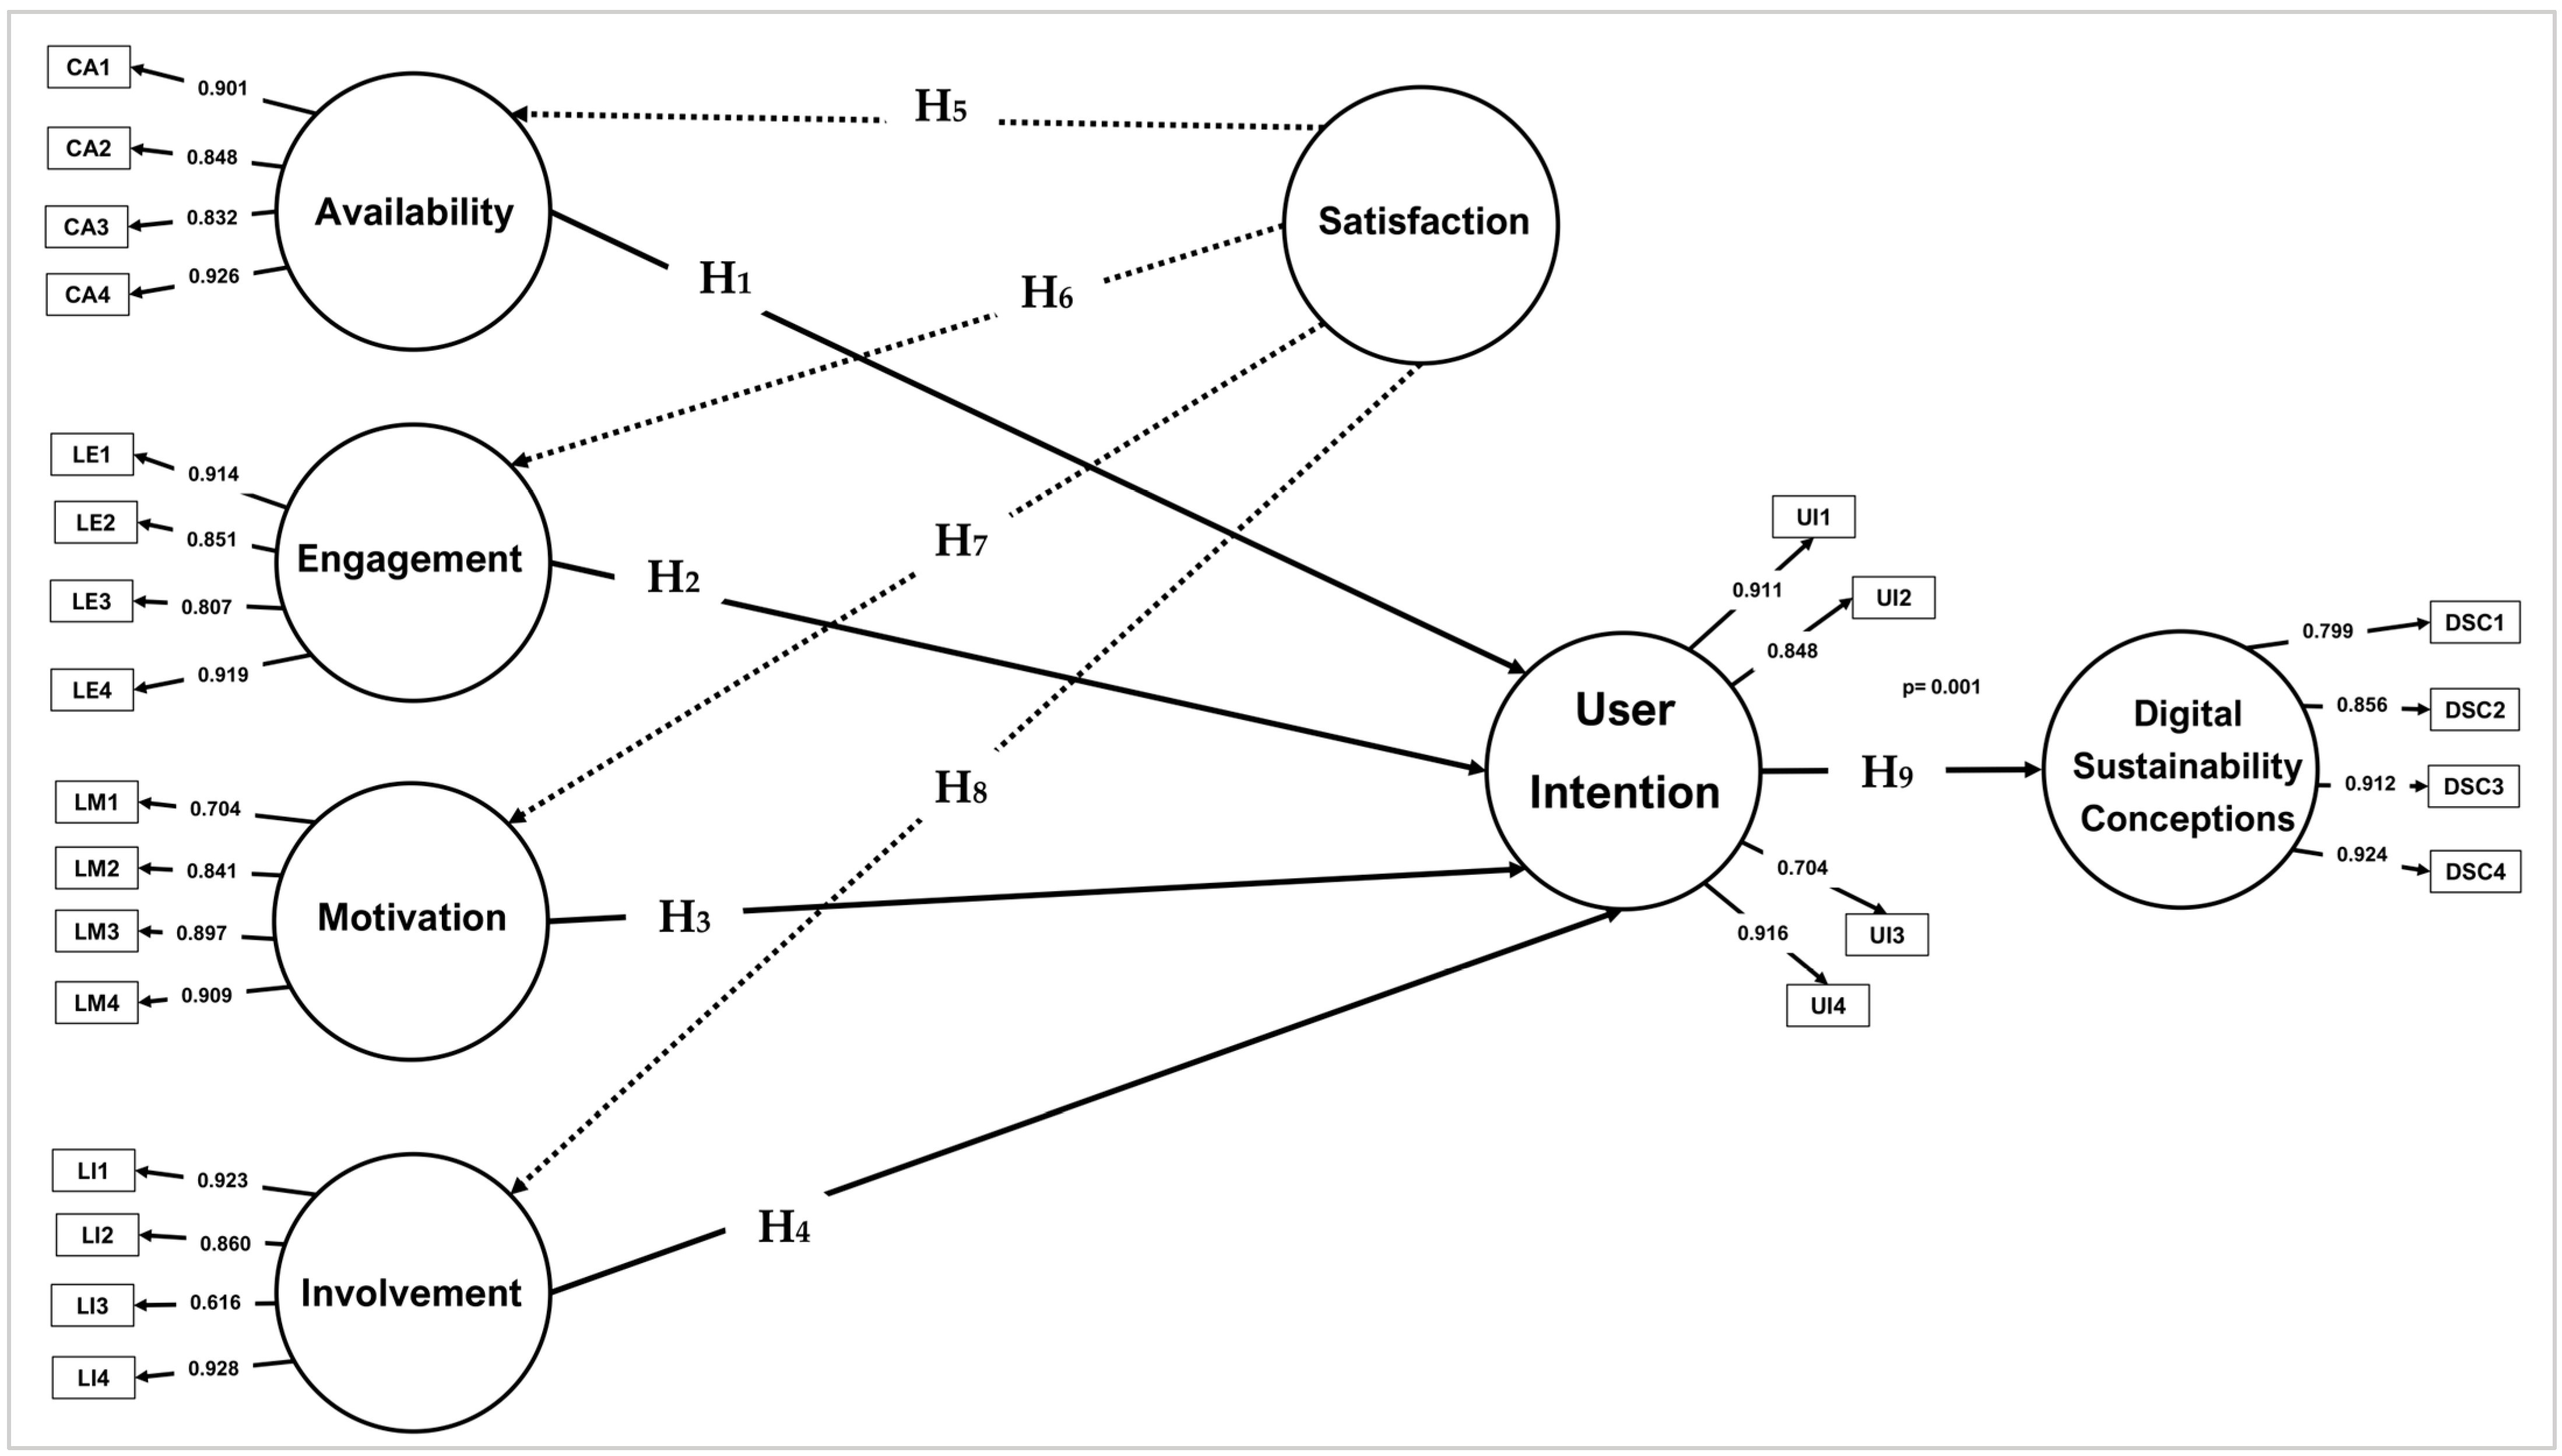
Table 3 outlines the measurement standards for the conceptual model, which comprises seven principal components: CA, LE, LM, LI, AS, UI, and DSC. However, the moderating effect of AS was excluded from the final analysis as it did not demonstrate statistically significant differentiating effects among participants.
Table 3 and
Figure 2 indicate that all constructs in the conceptual model exhibit strong reliability, with item loadings exceeding the conventional threshold of 0.70. This also confirms that each observed variable reliably measures its corresponding latent construct, validating the robustness of the model’s psychometric properties. Additionally, CA results construct indicated strong reliability and convergent validity, with item loadings ranging from 0.832 to 0.926.
Likewise, the results were further supported by excellent measurement quality indicators, including an average variance extracted (AVE) of 0.776, composite reliability (CR) of 0.937, and Cronbach’s α of 0.919. Thus, metrics collectively indicate highly reliable indicators, strong inter-item relationships, and excellent internal consistency. Similarly, LE results indicated high loadings (0.807–0.919), with strong supporting metrics (AVE = 0.761, CR = 0.929, Cronbach’s α = 0.904), confirming its effectiveness in measuring engagement with AI-NLP models.
Additionally, LM findings met all reliability standards, with loadings ranging from 0.704 to 0.909, along with robust validity metrics (AVE = 0.728, CR = 0.911, Cronbach’s α = 0.879), affirming its role as a significant predictor of UI. Furthermore, the LI results construct showed slightly more varied loadings (0.616–0.928), though these remained within acceptable ranges (AVE = 0.714, CR = 0.907, Cronbach’s α = 0.870).
Additionally, although one item (LI3 = 0.616) fell marginally below the ideal threshold, the construct maintained overall psychometric soundness and demonstrated a significant influence on UI. Moreover, the UI results were particularly robust, with loadings ranging from 0.704 to 0.916 and strong measurement metrics (AVE = 0.752, CR = 0.920, Cronbach’s α = 0.891), which support its mediating role between cognitive–affective constructs and DSC.
Similarly, the DSC construct itself demonstrated strong measurement properties, with loadings ranging from 0.799 to 0.924 and strong validity indicators (AVE = 0.775, CR = 0.936, Cronbach’s α = 0.918), confirming its effectiveness in capturing the evolving student understanding of sustainability in AI-enhanced learning environments.
However, analysis of the AI usage satisfaction revealed non-significant predictive relationships with availability, engagement, motivation, and involvement. Thus, findings reflect uniformly high satisfaction levels across the sample, reducing variance and consequently weakening predictive relationships.
Table 4 presents factor cross-loadings analysis used to assess discriminant validity within the PLS-SEM framework. Furthermore, the PLS-SEM examines whether each indicator demonstrates its strongest association with its theoretically assigned construct relative to all other constructs in PLS-SEM. Consistently, with established methodological standards, discriminant validity is confirmed when each indicator’s loading is substantially higher on its corresponding latent construct than on any other construct in the analysis [
73].
Table 4 presents a clear indicator of discriminant validity across all constructs included in the study: CA, LE, LM, LI, UI, and DSC. Additionally, discriminant validity is indicated by the fact that each item loads strongly on its corresponding latent construct and lower on all other constructs, confirming the uniqueness of each factor in the structural model.
Similarly, for the CA, all items (CA1–CA4) load highly on the CA construct (ranging from 0.832 to 0.926) and exhibit notably lower cross-loadings on LE, LM, LI, UI, and DSC. Likewise, CA’s conceptual independence and empirical distinction from other constructs is confirmed.
Furthermore, the LE items (LE1–LE4) exhibit the most substantial loadings on their intended factor (0.807–0.919), with diminished loadings on other constructs, validating LE as a distinct cognitive–affective construct. Identically, the LM indicators (LM1–LM4) load strongly on their designated construct (0.704–0.909) and significantly lower on all others, supporting the unique conceptual role of motivation in driving intention.
Likewise, the LI items demonstrate the same pattern of discriminant separation. Although LI3 exhibits a lower factor loading (0.616), the remaining items (LI1, LI2, LI4) range from 0.860 to 0.928 on LI, with consistently smaller loadings on the rest, thus preserving overall construct distinction.
Moreover, all the UI items (UI1–UI4) exhibit high loadings on their respective construct (0.704–0.916) and lower values across other factors, reinforcing the central role of the findings in the model as a mediator between cognitive–affective dimensions and digital sustainability.
Additionally, the DSC items (DSC1–DSC4) load strongly on their construct (0.799–0.924), with much smaller loadings on preceding constructs, confirming that DSC is a well-characterised outcome variable. Hence, the results reflect students’ enhanced understanding of digital sustainability concepts through the integration of sustainable AI in education. Moreover, to thoroughly verify discriminant validity, we confirmed the results using the Fornell–Larcker criterion and the HTMT ratio, as shown in
Table 4 and
Table 5.
According to
Table 5, the Fornell–Larcker criterion results report confirms discriminant validity for all constructs included in the measurement model. According to this criterion, the square root of AVE for each construct (shown on the diagonal in bold) should be greater than its correlation with any other construct in the model (off-diagonal values).
According to the results, the CA showed a square root of AVE of 0.881, which is stronger than its correlations with LE (0.652), LM (0.613), LI (0.590), UI (0.645), and DSC (0.580). Thus, CA’s distinct role in predicting user intention to adopt AI NLP tools is confirmed. Additionally, the LE has a square root of AVE of 0.872, exceeding its highest correlation with UI (0.665).
Hence, this supports the discriminant validity of LE, validating its unique contribution to user intention. Similarly, the LM demonstrates a square root of AVE of 0.853, surpassing its highest inter-construct correlation of 0.633 with LE.
Therefore, it is confirmed that LM is conceptually and statistically distinct in the model. Likewise, the LI yields a square root of AVE of 0.845, which is greater than its correlation with LE (0.610) and UI (0.603), accordingly confirming its uniqueness as a construct.
Furthermore, the UI, a central mediator in the model, has a square root of AVE of 0.867, which is significantly higher than its correlations with CA (0.645), LE (0.665), LM (0.626), LI (0.603), and DSC (0.602). Consequently, this indicates UI maintains its discriminant validity and mediates relationships between learning variables and digital sustainability perceptions.
Moreover, the DSC, the primary outcome variable, has a square root of AVE of 0.880, clearly exceeding its highest correlation with UI (0.602), further affirming its empirical distinction and validating its conceptual placement as the outcome of sustainable AI adoption.
Table 6 presents the results of the heterotrait–monotrait ratio (HTMT) analysis, an established method for assessing discriminant validity in structural equation modelling [
80]. All HTMT values were substantially below the conservative threshold of 0.85 (with an alternative threshold of 0.90), demonstrating a clear empirical distinction between constructs.
To further validate discriminant validity beyond cross-loadings and Fornell–Larcker analysis, the HTMT method was employed. Moreover, according to widely accepted thresholds (HTMT < 0.85), all construct pairs in the model demonstrate acceptable levels of discriminant validity.
Notably,
Table 5 indicates the HTMT values for key predictor-mediator pairs remain comfortably below the 0.85 threshold: CA ⟷ LE (0.741), LE ⟷ LM (0.726), LM ⟷ UI (0.721), LI ⟷ UI (0.695).
Furthermore, relationships involving the outcome variable, DSC, also remain below the threshold, such as UI ⟷ DSC (0.694), LE ⟷ DSC (0.688), and LM ⟷ DSC (0.657). Therefore, the strongest discriminant separation was observed between LI and DSC (HTMT = 0.616).
Hence, across the entire model, HTMT values ranged narrowly from 0.616 to 0.763, providing robust evidence for the distinctiveness of each latent construct in the measurement model.
Table 7 presents the structural model analysis, including path coefficients (β), t-values,
p-values, and R
2 values. Likewise, the independent variables (inputs) are CA, LE, LM, LI, and AS. In contrast, the dependent variables (outcomes) are UI and DSC. Additionally, five of the nine hypothesised relationships (RH1 to RH4 and RH9) were supported, whereas three (RH5 to RH8) were rejected.
Notably, CA significantly predicts UI (β = 0.25, t = 2.50, p = 0.012), suggesting that students are more likely to adopt AI-NLP models when they perceive them as readily accessible. Similarly, LE shows a significant positive effect on UI (β = 0.22, t = 2.20, p = 0.028), highlighting the importance of active interaction with AI-NLP models.
Furthermore, LM also has a significant influence on UI (β = 0.20, t = 2.00, p = 0.046), confirming the role of motivational factors in the adoption of technology. Moreover, LI exhibits a marginally significant relationship with UI (β = 0.18, t = 1.80, p = 0.072), indicating a modest but notable contribution. Hence, these four predictors collectively explain 52.2% of the variance in UI (R2 = 0.522), demonstrating moderate to strong predictive power.
Also, UI significantly predicts DSC (β = 0.35, t = 3.50, p = 0.001), accounting for 45.1% of the variance (R2 = 0.451), which confirms that stronger AI-NLP models adoption intentions are associated with increased awareness of DSC. On the other hand, the hypotheses proposing a moderator between cognitive–affective variables (CA, LE, LM, LI) and UI (RH5 to RH8) were not supported. All interaction effects were non-significant: CA × AS (β = 0.05, p > 0.6), LE × AS (β = 0.04, p > 0.6), LM × SA (β = 0.03, p > 0.6), and LI × AS (β = 0.02, p > 0.6). Additionally, the model suggests that uniformly high satisfaction levels among PY students may have created a ceiling effect, limiting the moderator’s discriminative power.
5. Discussion
The current study highlights the critical role of key learning variables —CA, LE, LM, and LI—in predicting students’ intention to adopt AI-NLP models, such as ChatGPT, Gemini, and Copilot. Among these, CA (β = 0.25) and LE (β = 0.22) had the strongest effects on UI, consistent with recent studies [
82,
83,
84,
85].
Additionally, the results indicate that students are more likely to integrate AI-NLP models into their learning because they perceive them as accessible and engaging. Also, AI-NLP models enhance learning by analysing student responses, adjusting content difficulty, and providing personalised feedback. This process not only improves academic performance but also enhances awareness of DSC through experiential learning. These findings are consistent with prior research [
21,
86,
87,
88]. These practices are widely endorsed by global frameworks such as the SDGs and UNESCO’s digital education objectives [
89].
Furthermore, the significant influence of LM (β = 0.20) further confirms that students with strong intrinsic motivation are more receptive to AI-enhanced learning environments. Moreover, students using AI-NLP models showed greater engagement than those in traditional learning settings. They asked more questions, interacted more with peers and instructors, and gave more feedback—behaviours linked to deeper learning and supported in the literature [
90,
91].
Although LI (β = 0.18, p = 0.072) did not meet the conventional threshold for statistical significance (α = 0.05), the result is considered marginally significant due to its proximity to the cutoff. This suggests a potential trend worth noting in educational research. In line with statistical norms, this path was interpreted as suggestive rather than confirmatory and should be viewed as a possible trend that requires further investigation in future research. The data further suggest that students who are actively involved in their learning processes may be more inclined to adopt AI-NLP models.
Notably, these students demonstrated increased involvement by asking questions, participating in discussions, and offering feedback, practices well-documented as indicators of successful learning experiences [
74,
92]. Importantly, UI significantly predicted students’ DSC (β = 0.35,
p < 0.001). This finding suggests that a stronger intention to adopt AI tools is linked to a greater awareness of sustainable digital practices, including green computing and digital inclusion [
86,
88].
On the other hand, the moderation hypotheses (H5–H8), which proposed AS as a moderating factor, were not supported. The lack of significance is likely due to the uniformly high satisfaction levels among PY students, which may have introduced a ceiling effect. By the results, responses cluster near the upper limit of a scale, reducing variability and limiting statistical power. This interpretation is consistent with previous research on technology acceptance models, where ceiling effects in satisfaction or perceived usefulness scores have similarly obscured moderation effects or weakened path estimates [
93,
94,
95,
96].
Overall, the model demonstrated strong explanatory power, accounting for 52.2% of the variance in UI (R
2 = 0.522) and 45.1% of the variance in DSC (R
2 = 0.451). AI-NLP models facilitated a learning-by-doing approach, enabling students to engage actively with educational content. This experiential learning process reinforced key sustainability principles relevant to digital education, including energy efficiency, e-waste management, ethical data usage, sustainable digital design, and the circular economy [
14,
19,
97,
98].
However, it remains unclear whether elevated DSC scores reflect a deep, applied understanding of sustainability domains or merely a positive perception of AI-NLP models. Future research should incorporate qualitative methods, such as interviews and open-ended surveys, to evaluate students’ actual knowledge of digital sustainability. These insights could then guide targeted curriculum interventions, ensuring that experiential AI engagement is complemented by explicit instruction in ethical data practices, digital environmental impact, and sustainable technology use.
Furthermore, the study highlights AI’s transformative potential in higher education by examining how UI influences DSC among PY students in Saudi Arabia. Given the demographic focus of the study, further research is recommended, particularly longitudinal studies, to track changes over time across diverse genders, academic specialisations, and cultural contexts.


