Article

White Matter Microstructure Differences Between Congenital and Acquired Hearing Loss Patients Using Diffusion Tensor Imaging (DTI) and Machine Learning

by
Fatimah Kayla Kameela
1,
Fikri Mirza Putranto
2,
Prasandhya Astagiri Yusuf
3,4,
Arierta Pujitresnani
3,
Vanya Vabrina Valindria
3,
Dodi Sudiana
1,5 and
Mia Rizkinia
1,5,*
1
Department of Electrical Engineering, Faculty of Engineering, Universitas Indonesia, Depok 16424, Indonesia
2
Department of Otorhinolaryngology-Head and Neck Surgery, Faculty of Medicine, Universitas Indonesia, Universitas Indonesia Hospital, Depok 16424, Indonesia
3
Medical Technology Cluster, Indonesian Medical Education and Research Institute, Universitas Indonesia, Jakarta 10430, Indonesia
4
Department of Medical Physiology and Biophysics, Faculty of Medicine, Universitas Indonesia, Jakarta 10430, Indonesia
5
Artificial Intelligence and Data Engineering (AIDE) Research Center, Faculty of Engineering, Universitas Indonesia, Depok 16424, Indonesia
*
Author to whom correspondence should be addressed.
Computers 2025, 14(8), 303; https://doi.org/10.3390/computers14080303
Submission received: 22 June 2025 / Revised: 23 July 2025 / Accepted: 24 July 2025 / Published: 25 July 2025

Abstract

Diffusion tensor imaging (DTI) metrics provide insights into neural pathways, which can be pivotal in differentiating congenital and acquired hearing loss to support diagnosis, especially for those diagnosed late. In this study, we analyzed DTI parameters and developed machine learning to classify these two patient groups. The study included 29 patients with congenital hearing loss and 6 with acquired hearing loss. DTI scans were performed to obtain metrics, such as fractional anisotropy (FA), axial diffusivity (AD), radial diffusivity (RD), and mean diffusivity (MD). Statistical analyses based on p-values highlighted the cortical auditory system’s prominence in differentiating between groups, with FA and RD emerging as pivotal metrics. Three machine learning models were trained to classify hearing loss types for each of five dataset scenarios. Random forest (RF) trained on a dataset consisting of significant features demonstrated superior performance, achieving a specificity of 87.12% and F1 score of 96.88%. This finding highlights the critical role of DTI metrics in the classification of hearing loss. The experimental results also emphasized the critical role of FA in distinguishing between the two types of hearing loss, underscoring its potential clinical utility. DTI parameters, combined with machine learning, can effectively distinguish between congenital and acquired hearing loss, offering a robust tool for clinical diagnosis and treatment planning. Further research with larger and balanced cohorts is warranted to validate these findings.

Graphical Abstract

1. Introduction

Hearing loss is a prevalent condition with significant implications for communication, social interactions, and cognitive development. It is broadly categorized as congenital, present at birth or early in life, and acquired, which develops later due to various factors such as infections, trauma, or aging [1,2]. Each group has a different impact on the neural integrity of the auditory system, and differences in both the timing and extent of damage may significantly influence the treatment strategies and outcomes.
Accordingly, in alignment with the early intervention guidelines published by the World Health Organization (WHO), many countries have long implemented programs to optimize support for children with hearing loss [3]. Early screening programs, such as Early Hearing Detection and Intervention (EHDI), are specifically designed to assess the overall health and the functional integrity of a child’s auditory system. Most of these initiatives have been adopted by high-income countries (HICs). While several low- and middle-income countries (LMICs) such as Brazil, the Philippines, and South Africa have also adopted similar strategies, many others, including Indonesia, have yet to fully integrate them into their national health systems [4].
As a result, Indonesia ranks prominently in Asia and reports a high prevalence of hearing impairment at 4.6%, underscoring the urgency of nationwide integration [5]. However, implementation in Indonesia remains challenging due to the limited availability of essential instruments and low public awareness regarding hearing loss, particularly in distinguishing between congenital and acquired types, as well as the importance of early screening. Consequently, many Indonesians are diagnosed at a later stage and often lack a clear medical record specifying the type of hearing loss [6,7,8]. These challenges are further magnified in rural or non-capital areas, where, despite high population density, necessary facilities are often lacking. This is partly due to financial constraints, limited healthcare funding, shortages of professional staff, and restricted access for low-income populations [8,9].
Given this critical need, our study aims to develop a method capable of serving as a classifier for current Indonesian patients with unclear hearing loss categorization. However, initiating such classification is not straightforward because of the inherently complex nature of the brain. The auditory system consists of both the peripheral and central divisions. The central auditory system, which includes the brainstem, thalamus, and auditory cortex, is responsible for processing and interpreting sound, playing a crucial role in auditory perception and comprehension [10,11,12]. In contrast, the peripheral system transduces sound waves into neural signals and involves the outer, middle, and inner ear structures [13,14].
Damage to these two divisions differs significantly and, together with differences in auditory tract maturation between the two types of hearing loss, greatly influences the extent of impairment. The auditory tract is known to undergo prominent maturation during early childhood [12,15,16]. Early hearing loss, particularly congenital, often results in an underdeveloped myelin sheath and an altered brain morphology along the auditory pathway. This contrasts with individuals who experience hearing loss after their auditory system has fully matured in acquired hearing loss [17].
This was further supported by Han et al. [18], whose study on the cross-modal neuroplasticity of deafened patients showed that patients with post-lingual hearing deprivation (acquired) showed higher brain activity and better recovery outcomes than those with longer hearing deprivation [18,19]. This suggests that prior auditory cognitive function is indeed an important factor in deciding the next treatment steps. Therefore, identifying both the extent and location of the damage, along with the level of auditory tract maturation, is essential for refining treatment approaches and developing personalized rehabilitation strategies [12].
Notably, however, the current literature on white matter differences between congenital and acquired hearing loss remains limited. Most studies, such as those by Manno et al. [20] and Grégoire et al. [21], have focused on highlighting the structural brain changes in sensorineural hearing loss by comparing gray and white matter volumes. Meanwhile, studies that included white matter integrity in their analysis, such as Aksoy et al. [15] and Li et al. [22], did not specifically examine the differences between the two types of hearing loss, but instead focused on the comparisons between hearing loss groups and normal hearing controls.
With these considerations in mind, to address the aforementioned conditions in Indonesia, an in-depth investigation of white matter integration along the auditory pathway in both the peripheral and central divisions is essential. This process is made possible by one of magnetic resonance imaging (MRI)’s advanced modalities, diffusion tensor imaging (DTI). DTI is commonly used in white matter microstructure analysis, as it provides insight into the orientation and density of axons and myelin sheaths by measuring water diffusion along axonal pathways. This information is represented through DTI metrics such as axial diffusivity (AD), radial diffusivity (RD), mean diffusivity (MD), and fractional anisotropy (FA) [15,23,24].
However, manually analyzing DTI metrics values to classify hearing loss may prove inefficient due to the large number of brain-related variables involved and the time-consuming nature of manual analysis. To address this, we propose the application of machine learning as a solution to streamline and enhance the classification process. Through our literature review, we observed a limited number of studies that applied machine learning to understand the auditory system, particularly in the context of auditory tract maturity. Most related studies that integrate machine learning have focused primarily on early detection in childhood [25], predicting hearing outcomes [26], incorporating AI-based tools to support hearing loss diagnosis [27], or developing genetic-based models to identify significant genes [28]. Few, if any, studies have aimed to develop a system capable of analyzing auditory maturity to distinguish between congenital and acquired hearing loss.
By leveraging advanced imaging and computational approaches, our study proposes a classification method that utilizes DTI to extract relevant brain variables and combine DTI analysis with machine learning models to distinguish between congenital and acquired hearing loss based on white matter microstructure. The aim of this study was to identify auditory tract maturity levels in patients with unclear hearing loss categorization to support clinical decision-making in treatment planning. Therefore, our contributions are threefold: (1) proposing a method tailored to the Indonesian healthcare context, particularly for supporting hearing loss treatment; (2) providing insights into auditory tract maturity differences between congenital and acquired cases; and (3) presenting a machine learning-based classification approach that offers a practical and efficient tool for differentiating the two types of hearing loss.

2. Materials and Methods

2.1. Selection of Participants

This study included 35 participants (18 girls and 17 boys) diagnosed with hearing loss, comprising 29 with congenital and 6 with acquired conditions. The participants’ ages had a mean of 7.3 years (SD: 11.9), indicating substantial variability, which may be attributed to the limitations in participant recruitment and available resources.
The inclusion criteria involved mild to severe neurological complications and inner ear malformations, which were used to generate the clinical features used in this study, namely the hearing loss type (congenital or acquired). This feature was determined based on anamnesis and medical history surveys.

2.2. Data Collection

Data were collected from the Radiology Department of the University of Indonesia Hospital (RSUI) between September 2020 and March 2023 in collaboration with the Indonesia Medical Education and Research Institute (IMERI). DTI images were acquired using a 1.5 T scanner (Philips Ingenia, Philips Healthcare, Best, Netherlands) with the following imaging protocol: TE/TR: 90.616/3810.6 ms, b = 800 s/mm2 (with b < 1750 s/mm2 for tensor metrics), 2.5 mm slice thickness, 1.0875 mm in-plane resolution, and 33 diffusion sampling directions.
This study was approved by the Ethics Committee of The Faculty of Medicine, Universitas Indonesia, adhering to the Helsinki Declaration of 2013. Informed consent was obtained from all participants or their legal guardians.

2.3. Basic Theory of DTI Metrics

Each of the four DTI metrics provides a distinct measurement and interpretation of water diffusion within brain tissue. AD measures the diffusion of water molecules along the principal axis of the white matter tracts. RD measures the average diffusion rate perpendicular to the principal axis of the white matter tracts. MD represents the average diffusion rate of water molecules within the tissue, regardless of the direction. FA quantifies water diffusion’s degree of anisotropy (directional preference) within the tissue [15,29]. These four values are calculated using the following equations:
F A = 3 λ 1 λ ¯ 2 + λ 2 λ ¯ 2 + λ 3 λ ¯ 2 2 λ 1 2 + λ 2 2 + λ 3 2
R D = λ 1 + λ 2 2
A D = λ 3
M D = λ 1 + λ 2 + λ 3 3
where λ1, λ2, and λ3 are the three eigenvalues of the diffusion tensor. These formulas are derived from the eigenvalues of the diffusion tensor obtained from the DTI data. They provide quantitative measures of diffusion characteristics within the brain tissue, aiding in assessing microstructural changes associated with various neurological conditions, including hearing loss. With this in mind, this study aimed to differentiate between congenital and acquired hearing loss using DTI metrics.

2.4. Data Analysis

Raw DTI data (2040 DICOM files per patient) were converted into FIB format using DSI Studio. FA, MD, AD, and RD metrics were then extracted from the bilateral regions of interest (ROIs). These ROIs encompassed areas associated with the subcortical auditory system—including the inferior colliculus (IC, Figure 1), lateral lemniscus (LL, Figure 2), and cochlear nucleus (CN, Figure 3)—and the cortical auditory system, which included the auditory radiation (AR, Primary) and inferior fronto-occipital fasciculus (IFOF, Secondary), as shown in Figure 4. All of these are associated with the central auditory system, as mentioned in the previous section.
This process yielded 10 ROI areas per patient, resulting in 40 features (4 DTI metrics × 10 ROIs). The extracted DTI metric values typically range from 0 to 1, reflecting the influence of the myelin sheath on water molecule diffusion [30]. Each DTI metric exhibits unique characteristics [31,32]. For example, due to axonal transport characteristics, AD metrics are widely known to tend to have higher DTI values than other metrics. In contrast, due to the perpendicular orientation of the neuron and the presence of the myelin sheath, RD tends to have lower DTI values. As a dependent metric based on AD and RD values (see Equation (4)), MD values tend to follow the generated values according to either of these metrics. FA, on the other hand, is not easily influenced by the other metrics; this is due to the normalization applied when generating this metric’s value (see Equation (1)) [13].
To investigate this matter, comparative plots based on DTI metrics were generated to enhance the understanding of the dataset (Figure 5, Figure 6, Figure 7 and Figure 8). Each figure compared the distributions of both the congenital and acquired groups for each ROI in their specific DTI metrics. Through these figures, we could take a look into the axonal conditions of each or the collective group, as the gathered values—especially those of AD and RD—may reflect the direct condition of the axon and myelin sheath.
For example, across all four figures, many ROIs have similar interquartile and whisker ranges for each hearing loss group, meaning that in these ROIs, both groups have a similar degree of neuronal degeneration. Those with clear range differences may prove to be significant in later analysis. Following this, the differences in FA values (Figure 5) between ROIs indicate that some regions have worse degeneration than others, with the asterisk showing a p-value less than 0.05, indicating significant differences. The MD value (Figure 6), on the other hand, does not show much difference, indicating that when combined, the independent variables behave similarly between the ROIs.
Examining the rest of the metrics, it was found that the AD values (Figure 7) of each ROI behave according to the explanations above, where, due to the one-directional water molecule path, they have a higher diffusion rate than other DTI metrics. RD values (Figure 8), on the other hand, showed values that may also prove significant in the later stage, as they have higher overall values than expected. It is commonly known that water molecules from outside the neuron do not easily cross the axon due to the presence of the myelin sheath, indicating that, in these cases, the group of patients has encountered similar demyelination.

2.5. Statistical Analysis

Independent t-tests assessed the means of DTI metrics (FA, MD, AD, and RD) between the congenital and acquired hearing loss groups. The t-tests provided insights into whether the two groups had statistically significant differences in DTI metrics. The mean (µ) and standard deviation (σ) were used to summarize each group’s central tendency and dispersion of the DTI metric values. This allowed for a clear presentation of the dataset characteristics. Before t-tests, the F distribution was used to verify whether the variances in DTI metrics in the congenital and acquired groups were equal. This step ensured the validity of the t-test results. All statistical analyses were performed using Python 3.11.13 with specialized libraries such as SciPy and NumPy. These tools provide robust capabilities for data manipulation, hypothesis testing, and correlation analysis.

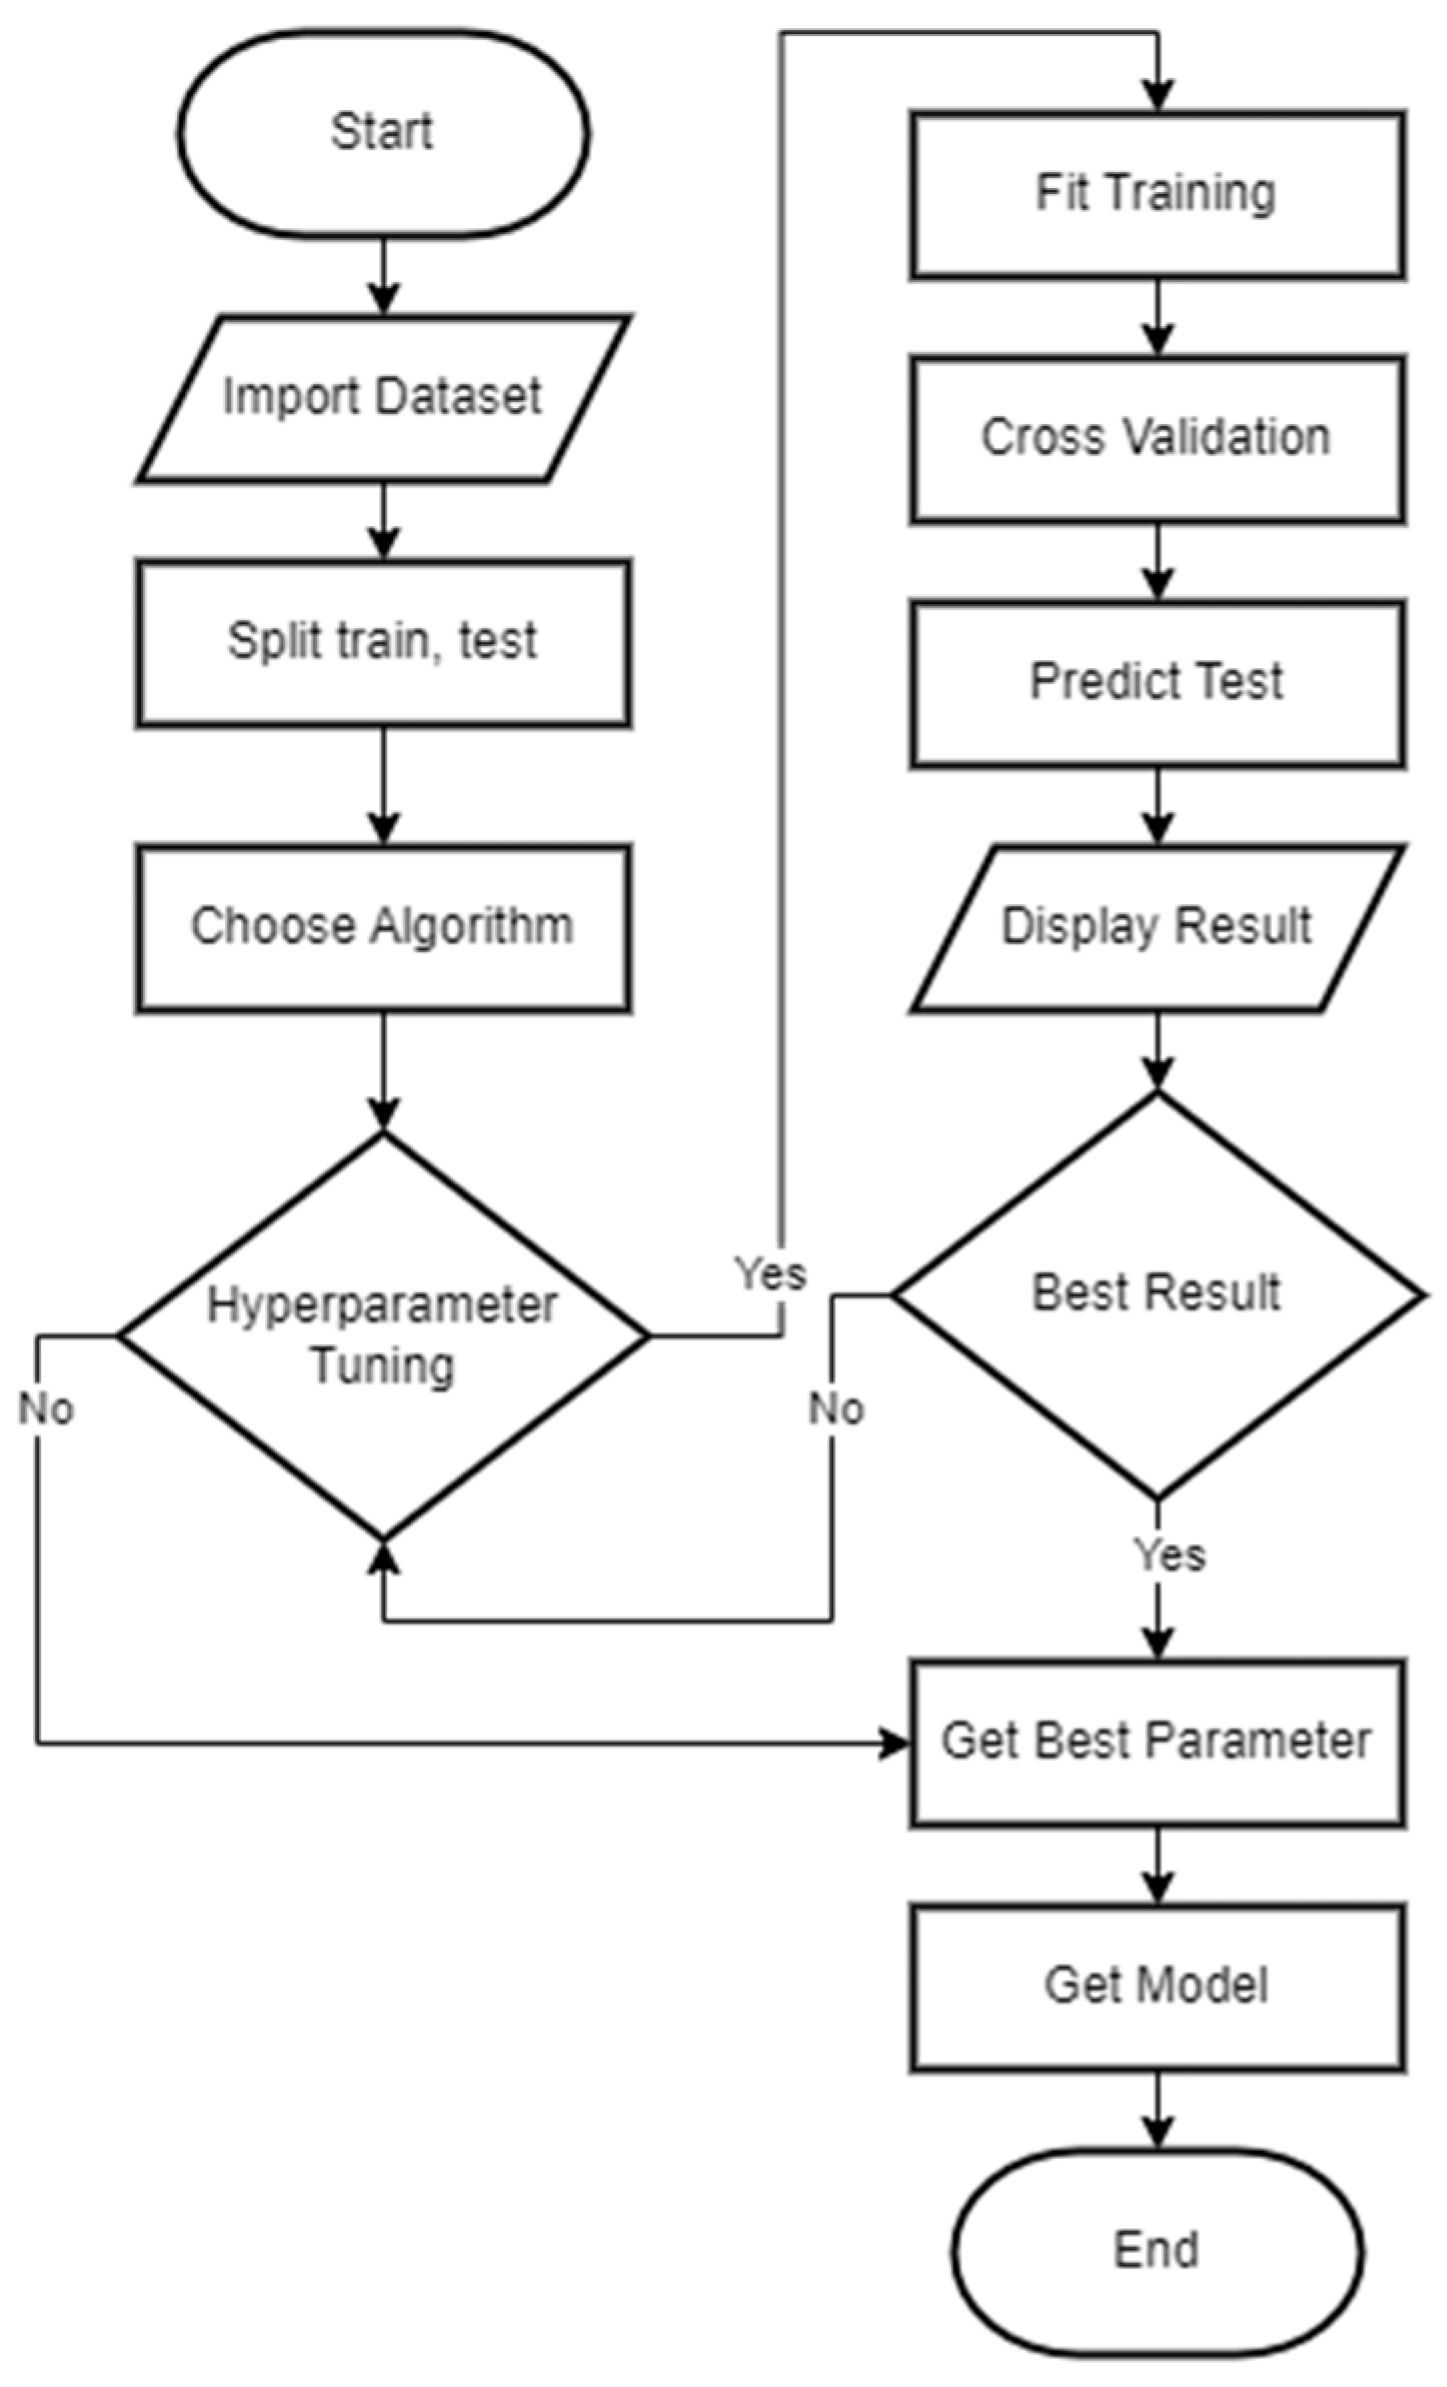
2.6. Machine Learning

Aligned with the study’s focus on understanding auditory system maturation by differentiating between congenital and acquired hearing loss, we developed several machine learning models based on binary classification. To facilitate this process, each hearing loss type was labeled 1 (congenital) or 0 (acquired). Three machine learning algorithms were employed for the classification task:
  • Support vector machine classifier (SVC): A supervised learning model that effectively separates data points by finding the optimal hyperplane that maximizes the margin between different classes. SVC utilizes kernel functions (e.g., linear, polynomial, and radial basis function) to transform the input data into higher-dimensional spaces. This transformation enables SVC to handle complex, nonlinear relationships between the input features. This study used SVC to classify patients based on DTI metrics [33,34].
  • Random forest (RF): An ensemble learning method that constructs multiple decision trees during training. RF employs bootstrapping, a resampling technique, to create multiple datasets from the original dataset. Each decision tree is trained on a different bootstrap sample, ensuring diversity and robustness in the ensemble. At each node of decision trees, RF randomly selects a subset of features for splitting, reducing the correlation between trees and enhancing model generalization. RF is a robust classification model capable of handling small datasets and minimizing bias–variance trade-offs [35].
  • Multilayer perceptron (MLP): MLP is an artificial neural network that utilizes backpropagation algorithms to optimize model parameters (weights and biases) by iteratively adjusting them based on the difference between predicted and actual outputs. MLP consists of input, hidden, and output layers [36].
Hyperparameter tuning of each machine learning model was performed to optimize model performance (Figure 9). This process aimed to enhance the model accuracy, sensitivity, specificity, and overall robustness in classifying hearing loss types based on DTI metrics. The statistical analysis focused on assessing group differences and correlations, whereas machine learning methods were employed to build classification models. These methodologies collectively contributed to the comprehensive analysis and interpretation of DTI data.

2.7. Evaluation Metrics

To evaluate the models’ performance, we employed a range of evaluation metrics, including accuracy, precision, recall, specificity, F1 score, and area under the curve (AUC) score for binary classification. Considering the class imbalance between hearing loss types, the evaluation metrics for both classes were averaged proportionally based on the number of true instances in each class, thereby providing an overall performance summary [37]. In this analysis, with a focus on minimizing the false positive rate (acquired cases classified as congenital), we emphasized the results of specificity, F1 score, and AUC score. The mathematical representations used to describe these metrics are presented in the following equations:
A c c u r a c y = T P + T N T P + T N + F P + F N
P r e c i s i o n = T P T P + F P
S p e c i f i c i t y = T N T N + F P
R e c a l l = T P T P + F N
F 1   S c o r e = 2 × P r e c i s i o n × R e c a l l P r e c i s i o n + R e c a l l
Derived from the confusion matrix, TP, TN, FP, and FN refer to true positive, true negative, false positive, and false negative, respectively, representing the number of cases correctly or incorrectly identified as either positive (congenital) or negative (acquired). The AUC score, a metric derived from the receiver operating characteristics (ROC) curve, evaluates the classifier’s ability to distinguish between classes based on predicted probabilities. It ranges from 0 to 1, with higher values indicating better discriminatory performance, and is influenced by the ratio of samples in each class [38].

3. Results

3.1. Statistical and Correlation Analysis

Statistical analysis of the 10 ROIs encompassing both cortical (Primary and Secondary) and subcortical (IC, LL, and CN) auditory system areas revealed significant differences among certain regions (see Table 1). Specifically, significant differences were observed in the cortical auditory system areas: Primary Left, Primary Right, Secondary Left, and Secondary Right. In contrast, no significant differences were found within the subcortical auditory system areas, indicating uniform damage across the brainstem in all the patients.
Among the four DTI metrics (FA, MD, AD, RD), both RD and MD exhibited the most pronounced differences, showing significance in three of the four significant ROIs. FA was significant in two out of the three ROIs, while AD showed the least significant differences.
Boxplots were generated to visually represent these metrics’ data distributions (Figure 5, Figure 6, Figure 7 and Figure 8). Each figure illustrates the distribution of DTI metrics across the ten ROIs. Notably, MD and AD exhibited relatively similar data ranges across ROIs, suggesting consistent trends in these metrics between the congenital and acquired hearing loss groups.
Note that all DTI metrics in the Secondary Left were significantly different between the two groups. The Secondary Left (IFOF) is important for understanding auditory and language functions, especially in deafness or neuro-audiology (see also Table 1), and the Left hemisphere for language functions, including semantics and phonological processing. The secondary auditory cortex is involved in more complex processing of auditory information, such as interpreting sounds and speech. This function may highlight a significant difference between acquired and congenital hearing loss [14,39].
In Figure 5 and Figure 8, in most of the ROIs (except CN right and left), acquired hearing loss has higher FA values, which indicates more directional diffusion, suggesting better-organized white matter tracts with lower RD that suggest better myelination. Unlike other brain areas, the CN may not undergo significant compensatory reorganization because their primary function is tightly linked to auditory input, which is diminished or absent in acquired hearing loss [15]. FA displayed more distinction between data distribution in the two groups, particularly evident in the subcortical ROIs (IC and LL; Left and Right).

3.2. Model Development and Evaluation

This study aims to analyze the white matter microstructure differences between acquired and congenital hearing loss patients. To achieve this, we designed Experiment Mode 1 and 2 (see Table 2, Table 3 and Table 4) to optimize the investigation and analysis.
In the first experiment, based on the statistical analysis presented in Table 1, we conducted a feature selection. Only nine variables were found to have significant p-values, which are the selected features, indicating differences between the two hearing loss groups (i.e., Primary Left, Primary Right, Secondary Left, and Secondary Right; all ROIs associated with the cortical auditory system). Hence, we developed the first machine learning model using a dataset consisting of only the selected features, hereafter referred to as the selected feature dataset.
In addition, based on previous studies, including Aksoy et al. [15], both subcortical and cortical ROIs were found to differ significantly when compared to normal hearing controls. Therefore, we developed a second machine learning model using a dataset that included all 40 variables, named the all-in dataset. The results of both models were grouped together as Experiment Mode 1 (see Table 2, Table 3 and Table 4) to allow a comparative analysis of how the inclusion of all variables (including non-significant subcortical and cortical regions) affects model performance compared to using only the significant ones. This also serves to evaluate whether the selected features are more effective in distinguishing between the two hearing loss groups.
In the second experiment, the goal was to analyze the contributions of each DTI metric toward the classification. Because the significant variables consist of a mixture of DTI metrics, and there is no clear pattern indicating which specific metrics are particularly influential, we performed a sensitivity analysis. This involved repeatedly testing the performance of machine learning models using datasets containing only one type of DTI metric at a time.
Following the development of both experiments, Table 2, Table 3 and Table 4 present the specificity, F1 score, and AUC-ROC values for different classifiers (SVC, RF, and MLP) applied to the various dataset scenarios explained above.
Specificity measures the proportion of actual negatives correctly identified; high specificity is crucial for reducing false positives (Table 2). RF gives the best performance of 0.8712 with the selected feature dataset. F1 score analysis in Table 3 is useful when the class distribution is imbalanced. The best performance is tied between RF and SVC at 0.9688. AUC-ROC in Table 4 measures the ability of the classifier to distinguish between classes, with a higher AUC-ROC indicating better performance. RF is again shown to perform best with the selected feature dataset (0.8056).
In summary, RF consistently performed best across most metrics and datasets, particularly in terms of specificity and F1 score, indicating its robustness across different DTI metrics. SVC performs very well with FA data, indicating that this metric suits SVC. FA metrics showed higher specificity and F1 scores, indicating that FA is crucial for distinguishing between congenital and acquired deafness.

4. Discussion

4.1. White Matter Microstructure Analysis

Investigation of white matter microstructure differences between the congenital and acquired hearing loss groups using DTI metrics yielded significant differences within the cortical auditory system, specifically in the Primary Left, Primary Right, Secondary Left, and Secondary Right ROIs (see Table 1). These findings align with previous studies suggesting that these areas are crucial for complex sound processing and cognitive functions related to auditory perception [11,12,39], underscoring the impact of early auditory stimulation and pre-defined sound perception on white matter integrity development. In particular, the presence of these differences reflects how these regions adapt or degenerate in response to hearing loss at a higher cognitive level.
In contrast, the subcortical regions (i.e., CN, LL, and IC) did not yield any significant differences, providing a marked contrast to the results observed in the cortical regions. Nevertheless, these regions play a critical role in initial auditory processing and differentiation of sound features [3,40]. The lack of significant differences suggests that damage to these areas may affect both groups similarly, particularly during the early stages of auditory information processing. This further implies that the timing of hearing loss onset may not significantly influence the preservation of white matter integrity in these lower central auditory regions.
A closer look at each group of DTI metrics in Table 1 reveals a trend differentiating congenital from acquired hearing loss. Specifically, the acquired group demonstrated higher FA and lower MD, RD, and AD values across regions than the congenital group. Higher FA values indicate better white matter structural organization and directional diffusivity. In contrast, lower values in other metrics provided more specific indications of the axonal pathway and myelination conditions. In particular, lower RD values in the acquired group suggested better myelin sheath integrity than those in the congenital group. Although AD values are typically high by nature, the elevated values observed in the congenital group may reflect greater white matter alteration and axonal damage [22,41].
This analysis suggests the existence of differential neurodevelopmental and neurodegenerative processes. Notably, the significance observed in cortical areas, as opposed to subcortical areas, indicated a decline in white matter integrity. This also implies that the congenital group experiences more pronounced white matter degradation than the acquired group, highlighting a key distinction between them: the presence or absence of pre-defined neural pathways shaped by years of auditory exposure, including linguistic abilities, as described by Han et al. [18,42].
Our findings also support those of Han et al. [18] regarding the resistance to tonotopic reorganization. The DTI values of the acquired group imply better resistance to cross-modal plasticity, possibly due to preserved metabolic activity in the cortical auditory system resulting from prior speech comprehension skills [1]. Overall, these results suggest that the acquired group maintains better-stabilized white matter integrity following the onset of hearing loss in later life, in contrast to the congenital group, whose white matter microstructure was still undergoing development at the time of auditory deprivation [41,43].

4.2. Machine Learning Analysis

  • Experiment 1
In Experiment 1, we compared two sets of machine learning models that utilized both all available variables as a dataset (all in) and a dataset with variables that had significant p-values (selected feature dataset). The evaluation results (i.e., Specificity, F1 score, and AUC-ROC) presented in Table 2, Table 3 and Table 4 confirmed the influence of the cortical variables, especially those with significant statistical values, in distinguishing between congenital and acquired hearing loss. The results showed that the model with the selected feature dataset dominated the highest value of each evaluation metric, indicating that this set of variables is particularly suited to represent the currently available dataset.
In contrast, the second set of models that include all variables yielded considerably lower values for both F1 score and AUC-ROC. This may be attributed to the inclusion of many variables, including subcortical variables, which may have diluted the model’s ability to focus on the most informative features. As a result, the models inexplicably distributed less weight to the important variables in favor of the broader, less informative set.
Nevertheless, the RF model managed to perform consistently stable values across all three evaluation metrics, each achieving values above 70%. These findings indicate that, while the selected feature dataset currently holds the highest advantage, the other variables also hold potential as valuable markers to differentiate between the two hearing loss groups if appropriately utilized. This is particularly important given the imbalanced nature of the dataset. Therefore, it is worth considering that in future studies with larger and more balanced datasets, the inclusion of broader variables, including those not reaching significance in the current context, may yield different results or even enhance model generalizability.
  • Experiment 2
While the analysis in Experiment 1 shows that RF is the most robust classifier overall, particularly when using the selected feature dataset, Experiment 2 yielded a distinctly different outcome. Comparing the four sets of datasets, each consisting of only one type of DTI metric, it was found that the dataset containing FA performed better than the other DTI metric datasets.
In this FA-specific dataset, the SVC classifier performed exceptionally well, highlighting that this DTI metric contains clear nonlinear decision boundaries that can be effectively captured by SVC. This suggests that FA has strong potential to serve as a sensitive and reliable biomarker for distinguishing between congenital and acquired hearing loss.
Importantly, this finding may offer an initial lead for future datasets, pointing to the critical role that FA might play in the differentiation process. However, this does not undermine the importance of the other three DTI metrics, as each may contribute valuable complementary information under different modeling contexts or in more complex datasets.

5. Limitations and Conclusions

Several limitations of this study warrant consideration when interpreting our findings. The dataset imbalance between the congenital and acquired hearing loss groups may have influenced the statistical and correlation analyses. Additionally, factors such as the use of hearing aids and further segmentation of ROIs were not explored in this study, which could provide deeper insights into the specific functional and structural impacts.
In conclusion, our study contributes to the understanding of the complex interplay between the white matter microstructure and hearing loss etiology. The analysis revealed that cortical regions exhibit significant differences between congenital and acquired hearing loss, likely reflecting differences in auditory system maturity. In contrast, none of the subcortical region variables showed significance, suggesting that both groups share a comparable level of subcortical integrity or damage across hearing loss types. Future research should focus on incorporating additional variables, balancing sample ratios, and expanding ROI segmentation to refine classification models and deepen insights into the neurobiological mechanisms underlying auditory processing deficits associated with different types of hearing loss.

Author Contributions

Conceptualization, F.M.P.; methodology, F.K.K., V.V.V. and M.R.; software, F.K.K.; validation, F.M.P. and V.V.V.; formal analysis, F.M.P., V.V.V. and M.R.; investigation, F.K.K., F.M.P. and V.V.V.; resources, F.M.P. and A.P.; data curation, F.K.K. and F.M.P.; writing—original draft preparation, F.K.K.; writing—review and editing, P.A.Y., V.V.V., D.S. and M.R.; visualization, F.K.K.; supervision, F.M.P., P.A.Y., A.P., V.V.V. and M.R.; project administration, A.P. and D.S.; funding acquisition, D.S. All authors have read and agreed to the published version of the manuscript.

Funding

The authors acknowledge support from Universitas Indonesia under Hibah Publikasi Terindeks Internasional (PUTI) Q2 with grant number NKB-808/UN2.RST/HKP.05.00/2023.

Data Availability Statement

All shareable data generated or analyzed during this study are included in this article. Further inquiries can be directed to the corresponding author.

Conflicts of Interest

The authors declare no conflicts of interest.

Abbreviations

The following abbreviations are used in this manuscript:
DTIDiffusion Tensor Imaging
FAFractional Anisotropy
ADAxial Diffusivity
RDRadial Diffusivity
MDMean Diffusivity
ICInferior Colliculus
LLLateral Lemniscus
CNCochlear Nucleus
ARAuditory Radiation
IFOFInferior Fronto-Occipital Fasciculus
SVCSupport Vector Machine Classifier
RFRandom Forest
MLPMultilayer Perceptron

References

  1. Eggermont, J.J. Acquired hearing loss and brain plasticity. Hear. Res. 2017, 343, 176–190. [Google Scholar] [CrossRef] [PubMed]
  2. Cunningham, L.L.; Tucci, D.L. Hearing loss in adults. N. Engl. J. Med. 2017, 377, 2465–2473. [Google Scholar] [CrossRef] [PubMed]
  3. Moeller, M.P.; Gale, E.; Szarkowski, A.; Smith, T.; Birdsey, B.C.; Moodie, S.T.; Carr, G.; Stredler-Brown, A.; Yoshinaga-Itano, C.; FCEI-DHH International Consensus Panel; et al. Family-centered early intervention deaf/hard of hearing (FCEI-DHH): Introduction. J. Deaf Stud. Deaf. Educ. 2024, 29, SI3–SI7. [Google Scholar] [CrossRef] [PubMed]
  4. Petrocchi-Bartal, L.; Khoza-Shangase, K.; Kanji, A. Early intervention for hearing-impaired children—From policy to practice: An integrative review. Audiol. Res. 2025, 15, 10. [Google Scholar] [CrossRef]
  5. Menteri Kesehatan Republik Indonesia. Keputusan Menteri Kesehatan Republik Indonesia Nomor HK.01.07/MENKES/1989/2022 tentang Pedoman Nasional Pelayanan Kedokteran Tata Laksana Tuli Sensorineural Kongenital; Menteri Kesehatan Republik Indonesia: Jakarta, Indonesia, 2022. [Google Scholar]
  6. Widuri, A.; Arifianto, M.P. The influence of parents knowledge and health care access to the identification of children with hearing impairment. Berk. Kedokteran. 2019, 15, 121. [Google Scholar] [CrossRef]
  7. Allisha, F.; Wijana; Mahdiani, S. Hearing profile of children below three years old at Jatinangor Integrative Health Care Center, West Java, Indonesia. Althea Med. J. 2022, 9, 74–79. [Google Scholar] [CrossRef]
  8. Nugroho, P.S.; Falerina, R.; Perdana, R.F.; Faizah, Z.; Fathoni, A.N.; Kurniawan, A.M.; Arsy, D.H. Early detection of hearing impairments training: Enhacing community hearing health degrees in Pacitan, East Java. J. Layanan Masy. (J. Public Serv.) 2023, 7, 490–502. [Google Scholar] [CrossRef]
  9. UNICEF. Empowering Every Child: Embracing Diversity and Inclusion for all—Landscape Analysis on Children with Disabilities in Indonesia; UNICEF: Jakarta, Indonesia, 2023. [Google Scholar]
  10. Purves, D.; Augustine, G.J.; Fitzpatrick, D.; Hall, W.C.; LaMantia, A.S.; Mooney, R.D.; Platt, M.L.; White, L.E. Neuroscience, 6th ed.; Sinauer Associates: Sunderland, MA, USA, 2018. [Google Scholar]
  11. Michalski, N.; Petit, C. Central auditory deficits associated with genetic forms of peripheral deafness. Hum. Genet. 2021, 141, 335–345. [Google Scholar] [CrossRef]
  12. Ramos Macías, Á.; Borkoski-Barreiro, S.A.; Falcón González, J.C.; de Miguel Martínez, I.; Ramos de Miguel, Á. Single-sided deafness and cochlear implantation in congenital and acquired hearing loss in children. Clin. Otolaryngol. 2018, 44, 138–143. [Google Scholar] [CrossRef]
  13. Salat, D.H. Diffusion tensor imaging in the study of aging and age-associated neural disease. In Diffusion MRI; Elsevier: Amsterdam, The Netherlands, 2014; pp. 257–281. [Google Scholar] [CrossRef]
  14. Korver, A.M.; Smith, R.J.; Van Camp, G.; Schleiss, M.R.; Bitner-Glindzicz, M.A.; Lustig, L.R.; Usami, S.-I.; Boudewyns, A.N. Congenital hearing loss. Nat. Rev. Dis. Primers 2017, 3, 16094. [Google Scholar] [CrossRef]
  15. Aksoy, D.O.; Karagoz, Y.; Kaldirimoglu, K.F.; Ulusan, M.B.; Mahmutoglu, A.S. Diffusion tensor imaging of auditory pathway: A comparison of pediatric cochlear implant candidates and healthy cases. J. Int. Adv. Otol. 2023, 19, 333–341. [Google Scholar] [CrossRef]
  16. Rance, G.; Tomlin, D. Maturation of the central auditory nervous system in children with auditory processing disorder. Semin. Hear. 2016, 37, 074–083. [Google Scholar] [CrossRef] [PubMed]
  17. Koirala, N.; Deroche, M.L.; Wolfe, J.; Neumann, S.; Bien, A.G.; Doan, D.; Goldbeck, M.; Muthuraman, M.; Gracco, V.L. Dynamic networks differentiate the language ability of children with cochlear implants. Front. Neurosci. 2023, 17, 1141886. [Google Scholar] [CrossRef] [PubMed]
  18. Han, J.-H.; Lee, H.-J.; Kang, H.; Oh, S.-H.; Lee, D.S. Brain plasticity can predict the cochlear implant outcome in adult-onset deafness. Front. Hum. Neurosci. 2019, 13, 38. [Google Scholar] [CrossRef] [PubMed]
  19. Boisvert, I.; McMahon, C.M.; Dowell, R.C.; Lyxell, B. Long-term asymmetric hearing affects cochlear implantation outcomes differently in adults with pre- and postlingual hearing loss. PLoS ONE 2015, 10, e0129167. [Google Scholar] [CrossRef]
  20. Manno, F.A.M.; Rodríguez-Cruces, R.; Kumar, R.; Ratnanather, J.T.; Lau, C. Hearing loss impacts gray and white matter across the lifespan: Systematic review, meta-analysis and meta-regression. Neuroimage 2021, 231, 117826. [Google Scholar] [CrossRef]
  21. Grégoire, A.; Deggouj, N.; Dricot, L.; Decat, M.; Kupers, R. Brain morphological modifications in congenital and acquired auditory deprivation: A systematic review and coordinate-based meta-analysis. Front. Neurosci. 2022, 16, 850245. [Google Scholar] [CrossRef]
  22. Li, Y.; Ding, G.; Booth, J.R.; Huang, R.; Lv, Y.; Zang, Y.; He, Y.; Peng, D. Sensitive period for white-matter connectivity of Superior Temporal Cortex in deaf people. Hum. Brain Mapping. 2011, 33, 349–359. [Google Scholar] [CrossRef]
  23. Winklewski, P.J.; Sabisz, A.; Naumczyk, P.; Jodzio, K.; Szurowska, E.; Szarmach, A. Understanding the physiopathology behind axial and radial diffusivity changes—What do we know? Front. Neurol. 2018, 9, 92. [Google Scholar] [CrossRef]
  24. Figley, C.R.; Uddin, M.N.; Wong, K.; Kornelsen, J.; Puig, J.; Figley, T.D. Potential pitfalls of using fractional anisotropy, axial diffusivity, and radial diffusivity as biomarkers of cerebral white matter microstructure. Front. Neurosci. 2022, 15, 799576. [Google Scholar] [CrossRef]
  25. Jin, F.Q.; Huang, O.; Kleindienst Robler, S.; Morton, S.; Platt, A.; Egger, J.R.; Emmett, S.D.; Palmeri, M.L. A hybrid deep learning approach to identify preventable childhood hearing loss. Ear Hear. 2023, 44, 1262–1270. [Google Scholar] [CrossRef]
  26. Bing, D.; Ying, J.; Miao, J.; Lan, L.; Wang, D.; Zhao, L.; Yin, Z.; Yu, L.; Guan, J.; Wang, Q. Predicting the hearing outcome in sudden sensorineural hearing loss via machine learning models. Clin. Otolaryngol. 2018, 43, 868–874. [Google Scholar] [CrossRef] [PubMed]
  27. AlSamhori, J.F.; AlSamhori, A.R.; Amourah, R.M.; AlQadi, Y.; Koro, Z.W.; Haddad, T.R.; Kakish, D.; Kawwa, M.J.; Zuriekat, M.; Nashwan, A.J. Artificial Intelligence for hearing loss prevention, diagnosis, and Management. J. Med. Surg. Public Health 2024, 3, 100133. [Google Scholar] [CrossRef]
  28. Luo, X.; Li, F.; Xu, W.; Hong, K.; Yang, T.; Chen, J.; Chen, X.; Wu, H. Machine learning-based genetic diagnosis models for hereditary hearing loss by the GJB2, SLC26A4 and MT-RNR1 variants. eBioMedicine 2021, 69, 103322. [Google Scholar] [CrossRef] [PubMed]
  29. Kingsley, P.B. Introduction to diffusion tensor imaging mathematics: Part I. Tensors, rotations, and eigenvectors. Concepts Magn. Reson. A 2006, 28A, 101–122. [Google Scholar] [CrossRef]
  30. Poitelon, Y.; Kopec, A.M.; Belin, S. Myelin fat facts: An overview of lipids and fatty acid metabolism. Cells 2020, 9, 812. [Google Scholar] [CrossRef]
  31. Wahyuningsih, H.P.; Kusmiyati, Y. Anatomi Fisiologi; Kementerian Kesehatan Republik Indonesia: Jakarta, Indonesia, 2017; Volume 1. [Google Scholar]
  32. Handayani, S. Anatomi dan Fisiologi Tubuh Manusia; Media Sains Indonesia: Kota Bandung, Indonesia, 2021. [Google Scholar]
  33. Gholami, R.; Fakhari, N. Support vector machine: Principles, parameters, and applications. In Handbook of Neural Computation; Elsevier: Amsterdam, The Netherlands, 2017; pp. 515–535. [Google Scholar] [CrossRef]
  34. Khanna, R.; Awad, M.; Khanna, A. Efficient Learning Machines: Theories, Concepts, and Applications for Engineers and System Designers; Apress: Berkeley, CA, USA, 2015. [Google Scholar]
  35. Belgiu, M.; Drăguţ, L. Random forest in remote sensing: A review of applications and future directions. ISPRS J. Photogramm. Remote Sens. 2016, 114, 24–31. [Google Scholar] [CrossRef]
  36. Aggarwal, C.C. Neural Networks and Deep Learning; Springer: Berlin/Heidelberg, Germany, 2023. [Google Scholar] [CrossRef]
  37. Gu, Q.; Zhu, L.; Cai, Z. Evaluation measures of the classification performance of Imbalanced Data Sets. In Communications in Computer and Information Science; Springer: Berlin/Heidelberg, Germany, 2009; pp. 461–471. [Google Scholar] [CrossRef]
  38. Müller, A.C.; Guido, S. Introduction to Machine Learning with Python; O’Reilly Media: Sebastopol, CA, USA, 2018. [Google Scholar]
  39. Mangold, S.A.; Das, J.M. Neuroanatomy, Cortical Primary Auditory Area. In StatPearls; StatPearls Publishing: Treasure Island, FL, USA, 2024. [Google Scholar] [PubMed]
  40. Felix, R.A.; Gourévitch, B.; Portfors, C.V. Subcortical pathways: Towards a better understanding of auditory disorders. Hear. Res. 2018, 362, 48–60. [Google Scholar] [CrossRef]
  41. Jiang, M.; Wen, Z.; Long, L.; Wong, C.W.; Ye, N.; Zee, C.; Chen, B.T. Assessing cerebral white matter microstructure in children with congenital sensorineural hearing loss: A tract-based spatial statistics study. Front. Neurosci. 2019, 13, 597. [Google Scholar] [CrossRef]
  42. van Wieringen, A.; Boudewyns, A.; Sangen, A.; Wouters, J.; Desloovere, C. Unilateral congenital hearing loss in children: Challenges and potentials. Hear. Res. 2019, 372, 29–41. [Google Scholar] [CrossRef]
  43. Tibussek, D.; Meister, H.; Walger, M.; Foerst, A.; von Wedel, H. Hearing loss in early infancy affects maturation of the auditory pathway. Dev. Med. Child Neurol. 2002, 44, 123. [Google Scholar] [CrossRef]
Figure 1. The regions of interest in the inferior colliculus (IC) area (outlined in yellow). Letter R on top left denotes the right side of the brain. Red lines show the center point of the image.
Computers 14 00303 g001
Figure 2. The regions of interest in the lateral lemniscus (LL) area (circled in red). Letter R on top left denotes the right side of the brain. Red lines show the center point of the image.
Computers 14 00303 g002
Figure 3. The regions of interest in the cochlear nucleus (CN) area (circled in red). Letter R on top left denotes the right side of the brain. Red lines show the center point of the image.
Computers 14 00303 g003
Figure 4. The regions of interest in the Primary (blue) and Secondary (orange) areas. Letter R on top left denotes the right side of the brain. Red lines show the center point of the image.
Computers 14 00303 g004
Figure 5. Comparative boxplot of fractional anisotropy (FA) values between congenital and acquired hearing loss groups.
Computers 14 00303 g005
Figure 6. Comparative boxplot of mean diffusivity (MD) values between congenital and acquired hearing loss groups.
Computers 14 00303 g006
Figure 7. Comparative boxplot of axial diffusivity (AD) values between congenital and acquired hearing loss groups.
Computers 14 00303 g007
Figure 8. Comparative boxplot of radial diffusivity (RD) values between congenital and acquired hearing loss groups.
Computers 14 00303 g008
Figure 9. Machine learning model development flowchart.
Computers 14 00303 g009
Table 1. Statistical analysis of DTI metrics in congenital and acquired hearing loss groups.
Congenital Group (µ ± σ)Acquired Group (µ ± σ)p
IC Left
FA0.545 ± 0.0780.606 ± 0.0420.073
MD0.787 ± 0.1020.730 ± 0.1050.227
AD1.292 ± 0.1571.282 ± 0.2000.898
RD0.534 ± 0.1020.454 ± 0.0660.077
IC Right
FA0.543 ± 0.0690.595 ± 0.0210.075
MD0.850 ± 0.1220.788 ± 0.1200.265
AD1.371 ± 0.1721.347 ± 0.2310.765
RD0.590 ± 0.1130.509 ± 0.0720.105
LL Left
FA0.499 ± 0.0780.545 ± 0.0850.202
MD0.874 ± 0.1620.797 ± 0.0730.270
AD1.347 ± 0.1471.29 ± 0.0860.375
RD0.638 ± 0.1770.551 ± 0.0870.255
LL Right
FA0.525 ± 0.0830.568 ± 0.1220.295
MD0.790 ± 0.0920.795 ± 0.1110.895
AD1.273 ± 0.0971.321 ± 0.0190.241
RD0.548 ± 0.1150.533 ± 0.1610.782
CN Left
FA0.321 ± 0.0940.323 ± 0.1190.967
MD1.018 ± 0.3331.005 ± 0.2440.929
AD1.352 ± 0.3571.346 ± 0.2370.971
RD0.851 ± 0.3300.835 ± 0.2560.908
CN Right
FA0.329 ± 0.1470.28 ± 0.1070.441
MD1.124 ± 0.5531.081 ± 0.2940.853
AD1.482 ± 0.5541.401 ± 0.3080.732
RD0.946 ± 0.5650.921 ± 0.2930.917
Primary Left
FA0.298 ± 0.0540.359 ± 0.0520.016
MD0.924 ± 0.0760.833 ± 0.0680.011
AD1.208 ± 0.1301.161 ± 0.1200.425
RD0.782 ± 0.0680.669 ± 0.0620.001
Primary Right
FA0.304 ± 0.0560.360 ± 0.0910.205
MD0.910 ± 0.0830.841 ± 0.0360.055
AD1.190 ± 0.1171.160 ± 0.0870.549
RD0.770 ± 0.0850.681 ± 0.0800.026
Secondary Left
FA0.402 ± 0.0810.506 ± 0.0390.005
MD1.018 ± 0.0800.838 ± 0.0820.000
AD1.486 ± 0.0931.329 ± 0.1170.001
RD0.784 ± 0.1090.593 ± 0.0690.000
Secondary Right
FA0.401 ± 0.0810.471 ± 0.0510.052
MD1.009 ± 0.3190.901 ± 0.0500.0416
AD1.438 ± 0.3251.386 ± 0.0690.703
RD0.795 ± 0.3220.658 ± 0.0560.312
p-values less than 0.05 are bolded to show significant differences.
Table 2. Specificity value comparison table.
DatasetSpecificityExperiment Mode
SVCRFMLP
Selected features0.85490.87120.8622Experiment 1
All-in0.75120.81650.7278
FA only0.83790.77350.6873Experiment 2
MD only0.72750.75850.6970
AD only0.72680.73730.6892
RD only0.75220.75710.7122
Table 3. F1 score value comparison table.
DatasetF1 ScoreExperiment Mode
SVCRFMLP
Selected features0.96880.96880.9495Experiment 1
All-in0.66120.75830.6335
FA only0.74100.63030.5607Experiment 2
MD only0.63270.63610.5810
AD only0.62310.64060.5633
RD only0.65530.63080.6100
Table 4. AUC-ROC value comparison table.
DatasetAUC-ROCExperiment Mode
SVCRFMLP
Selected features0.74310.80560.7778Experiment 1
All-in0.62420.72740.5758
FA only0.75280.61750.4922Experiment 2
MD only0.58080.59840.5138
AD only0.58080.59400.4964
RD only0.62670.59010.5414
Disclaimer/Publisher’s Note: The statements, opinions and data contained in all publications are solely those of the individual author(s) and contributor(s) and not of MDPI and/or the editor(s). MDPI and/or the editor(s) disclaim responsibility for any injury to people or property resulting from any ideas, methods, instructions or products referred to in the content.

