
Enhanced Multi-Level Recommender System Using Turnover-Based Weighting for Predicting Regional Preferences


Abstract
1. Introduction
1.1. Implication of Collaborative Filtering Technique
1.2. Identified Research Gap
- (i)
- The collaborative filtering approaches previously examined predominantly rely on overall ratings, which are single-criterion in nature. However, utilizing customer ratings as a comprehensive evaluation strategy is inadequate for generalizing across all branches.
- (ii)
- As business operations are distributed across various geographical locations, conventional recommendation systems encounter relevance issues. This pertains to the alignment between user preferences and the items suggested by the model. Consequently, inter-state business organizations necessitate innovative strategies to perform sophisticated recommendations at multiple levels of abstraction with regional implications. This aspect remains unexplored in the existing literature.
- (iii)
- Furthermore, the evaluation of generated recommendations at appropriate taxonomic levels requires further attention. The sequence in which items are recommended based on local features of participatory data sources has not been addressed in the aforementioned research works.
1.3. Research Contribution
- (i)
- Motivation: This study is motivated by the need to incorporate the significance of participatory branch-level data sources in identifying user preferences and computing predicted item ratings by users. The resulting weighted predicted ratings reflect the importance of both participatory data sources and user preferences, facilitating the exploration of recommendations at multiple levels of abstraction.
- (ii)
- Hypothesis: A turnover-based weighting model for participatory data sources is proposed to assign weights to branch data sources. Turnover refers to the revenue generated through total business transactions conducted by the branch. Thus, user ratings can be weighted and evaluated based on branch sales. Additionally, it is logical to establish a voting threshold for participatory data sources to exclude items preferred by a limited number of users. Users can rate purchased items on a scale of 1–5. The rating of the active user in each branch, who has purchased and rated the maximum number of items, can be utilized to calculate the weighted predicted rating. To enhance the predicted rating of recommended items with regional implications, it is appropriate to develop a multi-level recommendation system framework for global, sub-global, and local patterns. To substantiate the proposed weighted predicted rating method, three novel algorithms are introduced.
- (iii)
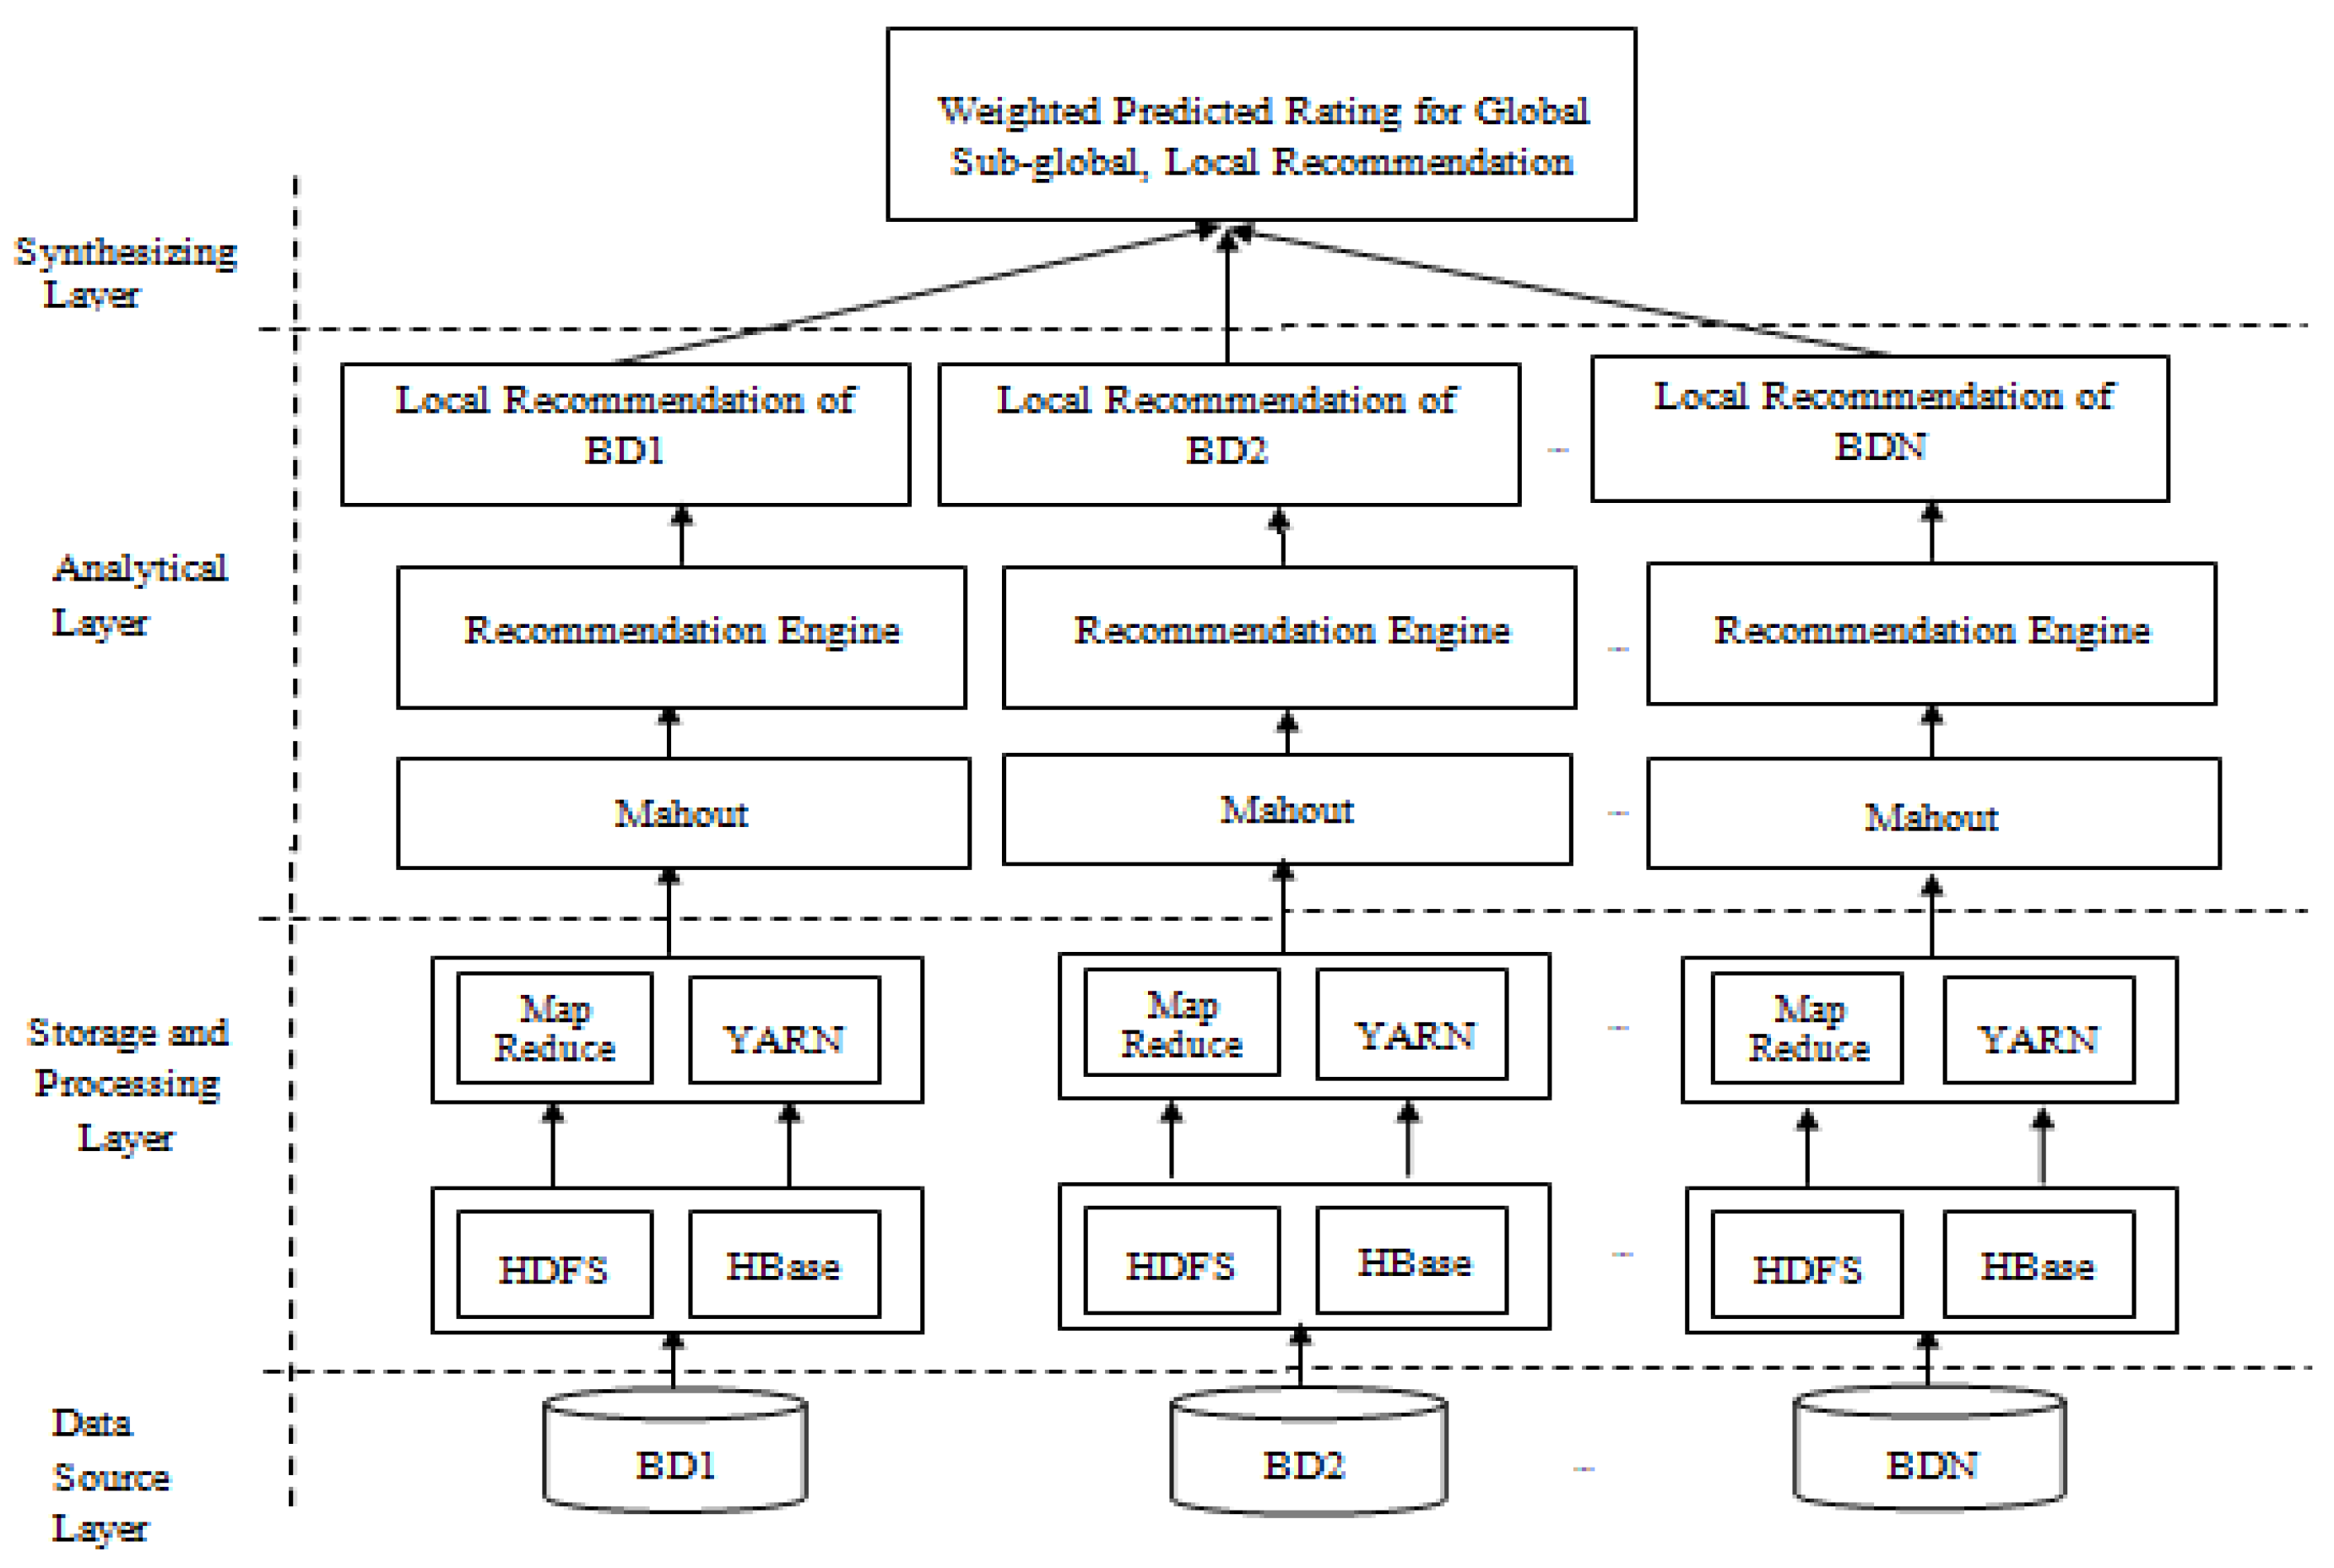
- Technical execution: A Hadoop-based big data processing framework is employed to technically execute the proposed approach. The Mahout machine learning ecosystem of Hadoop has been implemented to generate collaborative item-based recommendations in a distributed manner. To validate the proposed approach, experimental investigations are conducted on the Movie Lenz benchmarking dataset. The results clearly confirm the novelty of the proposed approach in calculating the predicted rating of items compared with the baseline technique.
2. Preliminary Terms in Proposed Approach
2.1. Assigning Weights for the Participatory Data Sources
2.2. Normalized Data Source Weight
2.3. Estimation of Effective Voting Threshold for Participatory Branches
2.4. Item Similarity Computation
2.5. Prediction of Rating
2.6. Active User Rating
2.7. Weighted Predicted Rating
3. Illustration of Proposed Weighting Model
3.1. Algorithms Proposed
| Algorithm 1. Computing-effective-voting-threshold |
| Input: N—Participatory branch data sources WBDi—Weight corresponding to the turnover cost of branch data source BDi Min.Ds = Standard minimum voting threshold uniformly set by a domain expert Output: The effective voting threshold for participatory sites Algorithm: Let TTD = 0; TNW = 0; Begin For each data source i, i = 1 to N do Begin TTD = TTD + WBDi; End; For each data source i, i = 1 to N do Begin W’BDi = WBDi/TTD; TNW = TNW + W’BDi; End; For each data source i, i = 1 to N do Begin End; End all. |
| Algorithm 2: Voting-rate-item-count |
| Input: N—Participatory branch data sources u—No of users for individual branch data sources Output: Voting rate of an item Algorithm: Let rated-item-count = 0; voting-rate-item = 0.00; Begin For each data source i, i = 1 to N do Begin For each rated item j found in data source i; rated-Item-count[j] = rated-item-count[j] + 1; voting-rate-item[j] = rated-item-count[j]/u; End; Output: Voting rate of an item End all. |
| Algorithm 3: Turnover-based predicted rating |
| Input: aurj—Active user rating for the item. i—Effective voting threshold of participatory data sources. Output: Weighted Predicted rating. Algorithm Call computing-effective-voting-threshold (); Call Voting-rate-item-count (); Begin For each data source i, i = 1 to m do Begin For each item j, j = 1 to m do Begin If i ≥ voting-rate-item[j] &&i then Begin G-WPRj = W’BDi; End; else If i ≥ voting-rate-item[j] &&j∃site i then Begin SG-WPRj = W’BDi; End; else If i ≥ voting-rate-item[j] && j ∃!site i then Begin L-WPRj = W’BDi; F-LWPRJ = L-WPRj + W’BDi; End; else Store item j as the uninteresting pattern for further investigation. End; End; End all. |
3.2. Example
- W’BD1 = 100,000/170,000 = 0.5882.
- W’BD2 = 50,000/170,000 = 0.2941.
- W’BD3 = 20,000/170,000 = 0.11764.
- VBD1 = 0.20 * (1 − 0.5882)/0.333 = 0.2471.
- VBD2 = 0.20 * (1 − 0.2941)/0.333 = 0.42396.
- VBD3 = 0.20 *(1 − 0.11764)/0.333 = 0.5299.
4. Experimental Investigations
4.1. Accuracy Evaluation and Baseline Comparison
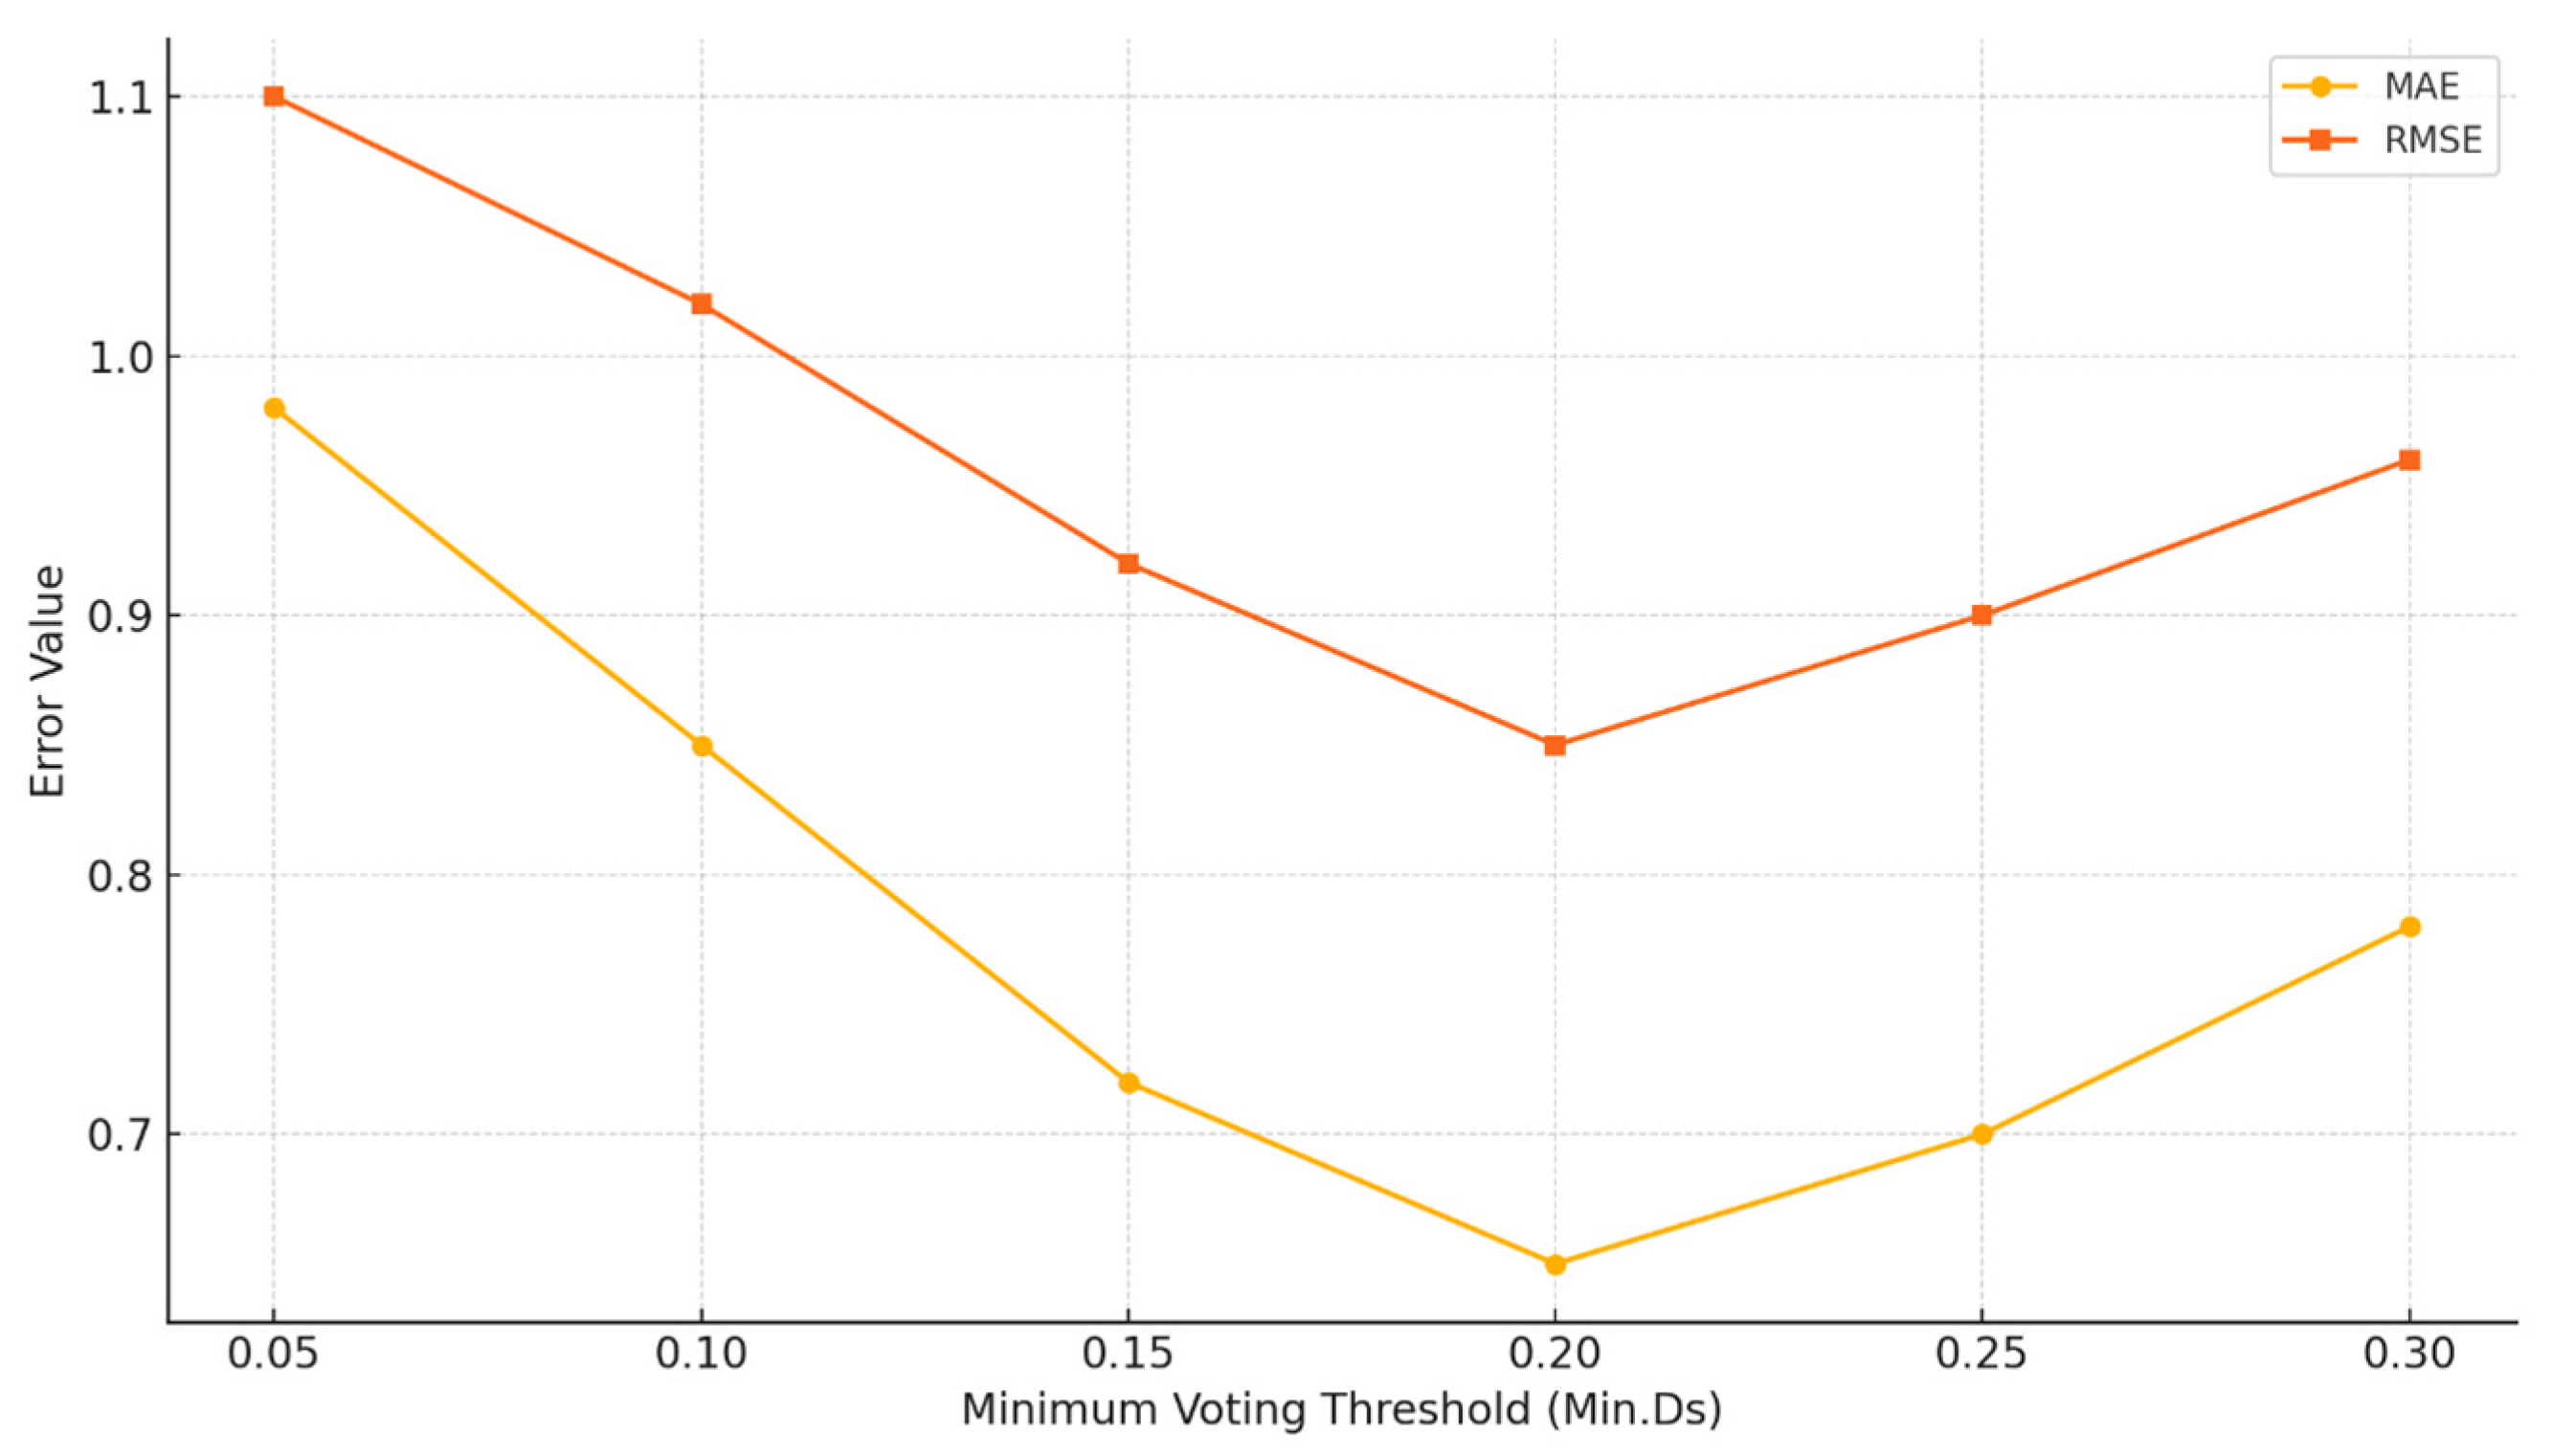
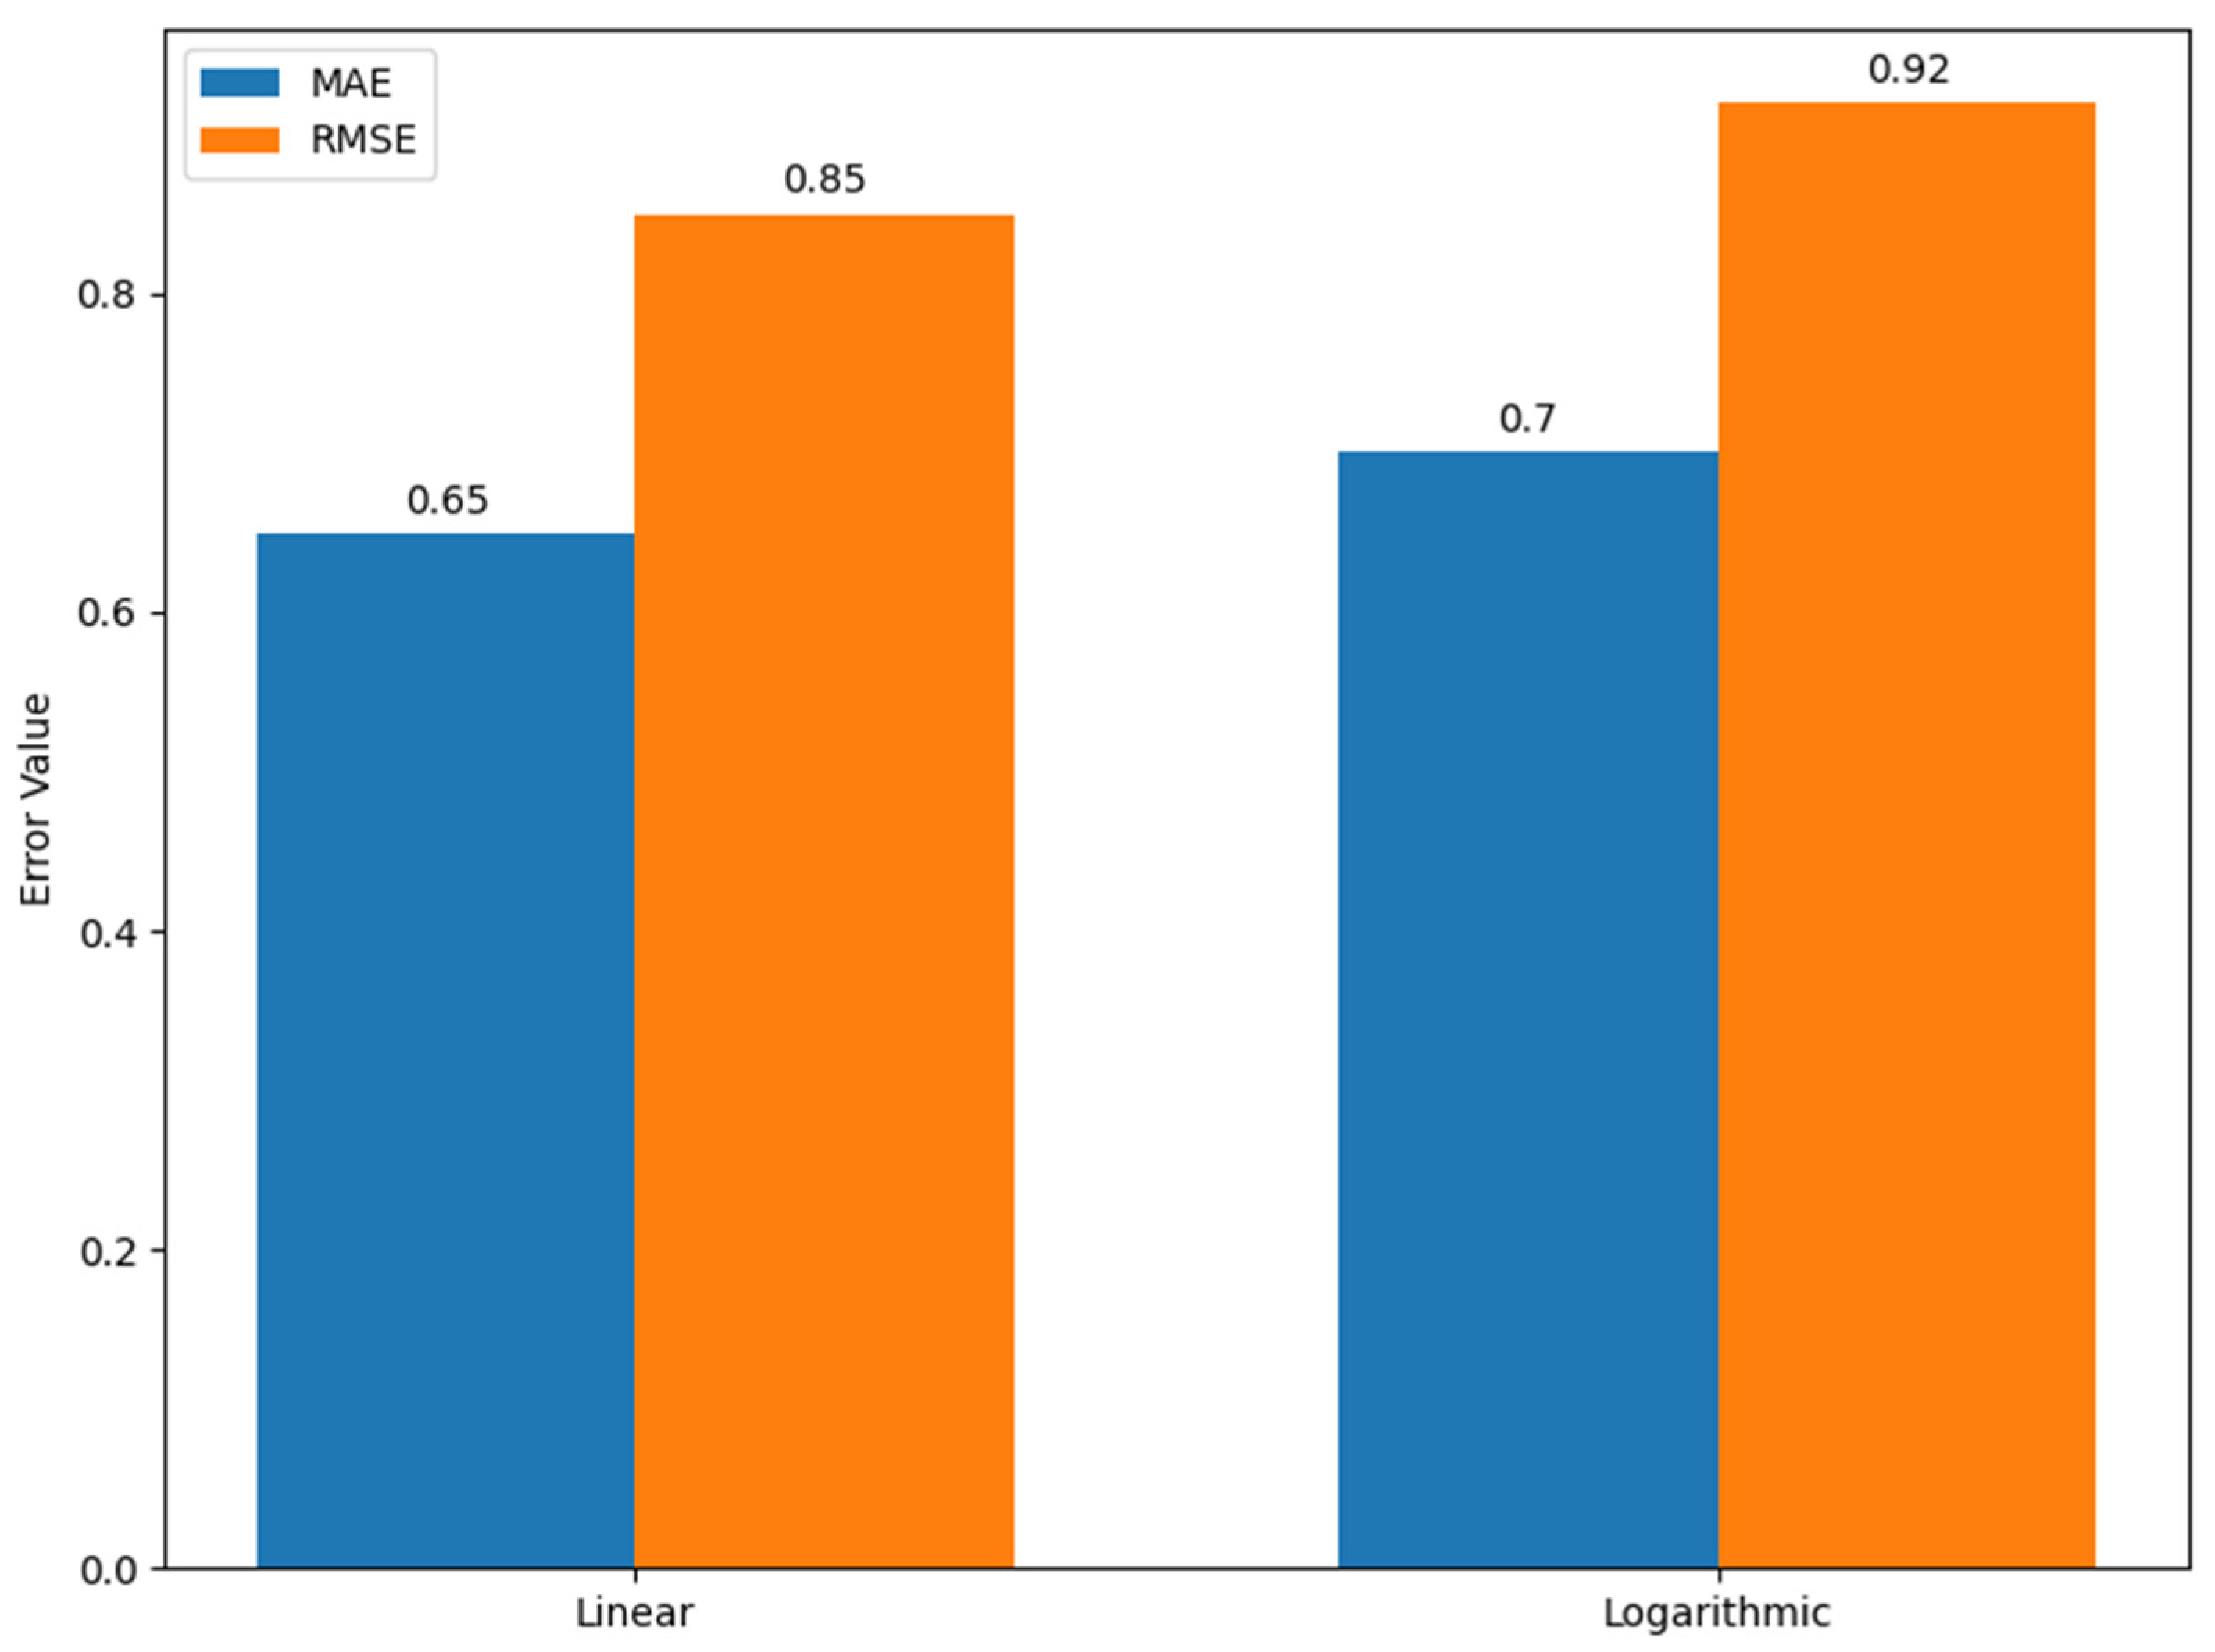
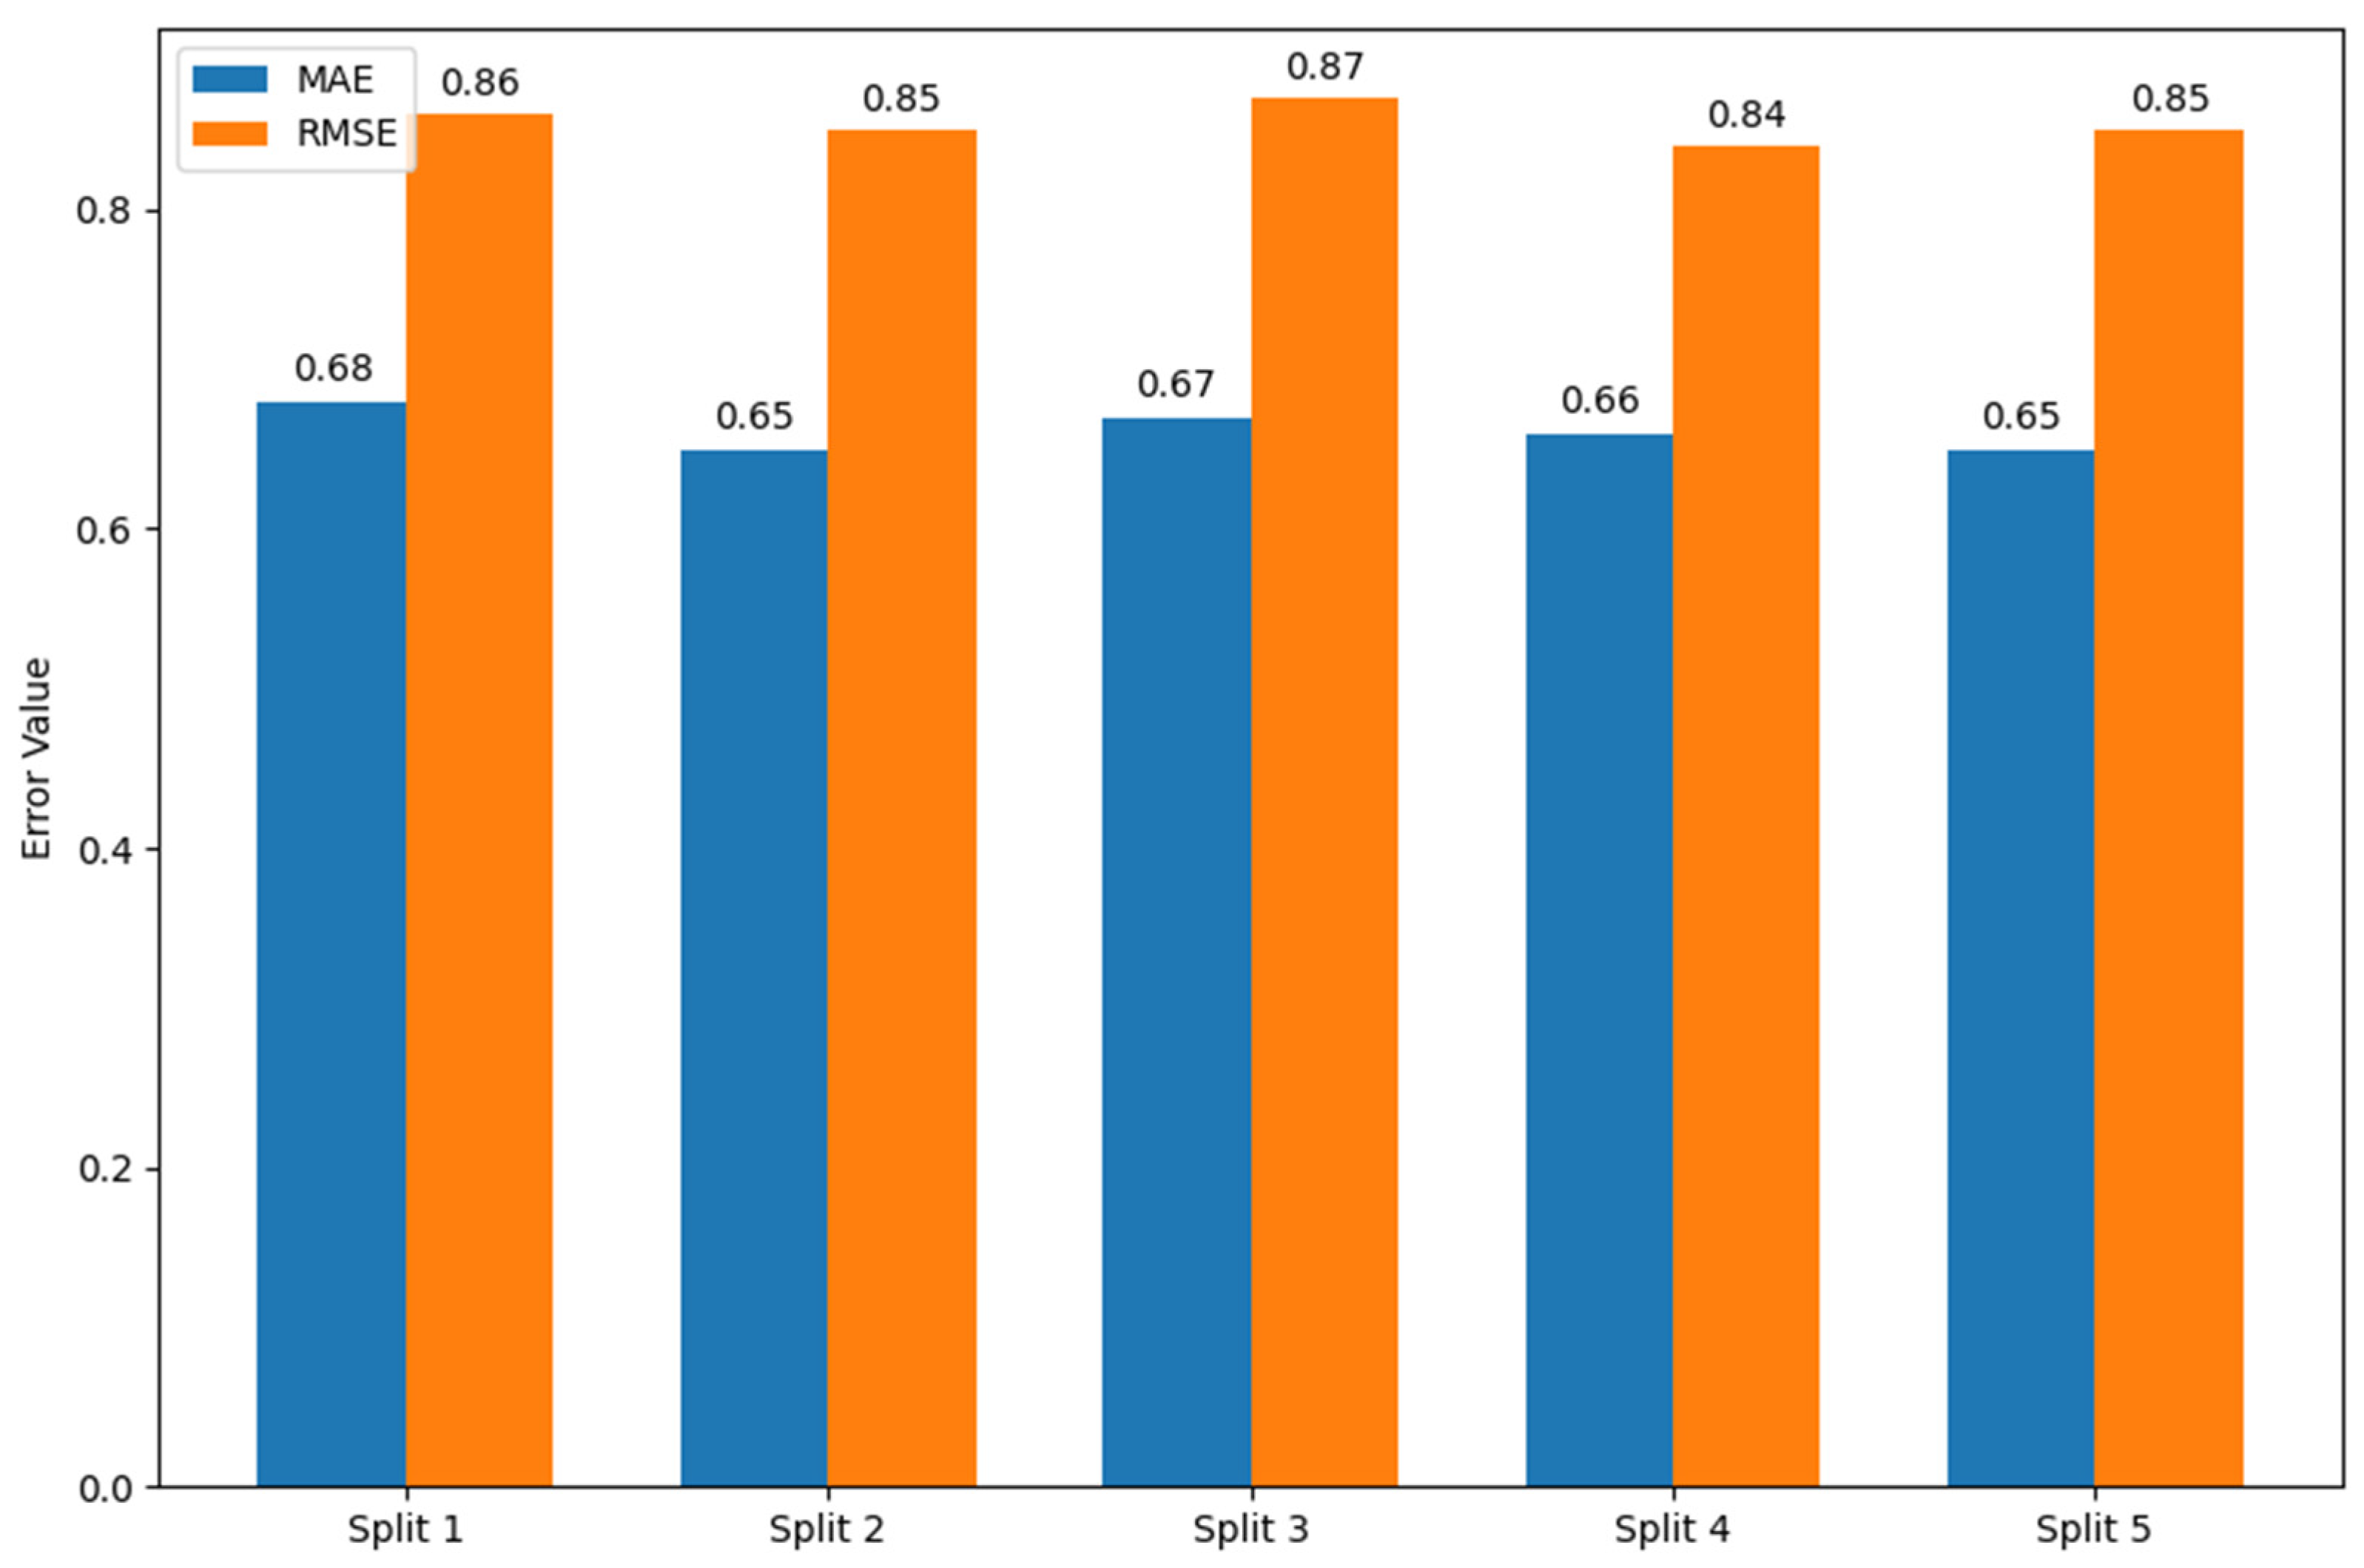
4.2. Sensitivity Analysis and Statistical Validation
5. Conclusions and Future Directions
Author Contributions
Funding
Data Availability Statement
Conflicts of Interest
References
- Zhou, L.; Pan, S.; Wang, J.; Vasilakos, A.V. Machine learning on big data: Opportunities and challenges. Neurocomputing 2017, 237, 350–361. [Google Scholar] [CrossRef]
- Zhang, S.; Zhang, C.; Wu, X.; Zhang, S.; Zhang, C.; Wu, X. Data mining and multi-database mining. In Knowledge Discovery in Multiple Databases; Springer Nature: Berlin/Heidelberg, Germany, 2004; pp. 27–61. [Google Scholar]
- Ramkumar, T.; Hariharan, S.; Selvamuthukumaran, S. A survey on mining multiple data sources. Wiley Interdiscip. Rev. Data Min. Knowl. Discov. 2013, 3, 1–11. [Google Scholar] [CrossRef]
- Akter, S.; Wamba, S.F. Big data analytics in E-commerce: A systematic review and agenda for future research. Electron. Mark. 2016, 26, 173–194. [Google Scholar] [CrossRef]
- Fan, J.; Han, F.; Liu, H. Challenges of big data analysis. Natl. Sci. Rev. 2014, 1, 293–314. [Google Scholar] [CrossRef] [PubMed]
- Latha Bhaskaran, K.; Osei, R.S.; Kotei, E.; Agbezuge, E.Y.; Ankora, C.; Ganaa, E.D. A survey on big data in pharmacology, toxicology and pharmaceutics. Big Data Cogn. Comput. 2022, 6, 161. [Google Scholar] [CrossRef]
- Tian, X.; Liu, L. Does big data mean big knowledge? Integration of big data analysis and conceptual model for social commerce research. Electron. Commer. Res. 2017, 17, 169–183. [Google Scholar] [CrossRef]
- Wu, X.; Zhu, X.; Wu, G.Q.; Ding, W. Data mining with big data. IEEE Trans. Knowl. Data Eng. 2013, 26, 97–107. [Google Scholar] [CrossRef]
- Uzun-Per, M.; Can, A.B.; Gürel, A.V.; Aktaş, M.S. Big data testing framework for recommendation systems in e-science and e-commerce domains. In Proceedings of the 2021 IEEE International Conference on Big Data (Big Data), Orlando, FL, USA, 15–18 December 2021; pp. 2353–2361. [Google Scholar]
- Dean, J.; Ghemawat, S. MapReduce: Simplified data processing on large clusters. Commun. ACM 2008, 51, 107–113. [Google Scholar] [CrossRef]
- Tsai, C.W.; Lai, C.F.; Chao, H.C.; Vasilakos, A.V. Big data analytics: A survey. J. Big Data 2015, 2, 21. [Google Scholar] [CrossRef]
- Bisoyi, S.S.; Mishra, P.; Mishra, S.N. High Frequency Rule Synthesis in a Large Scale Multiple Database with MapReduce. Int. J. Electron. Telecommun. 2022, 68, 177–186. [Google Scholar] [CrossRef]
- Good, I.J. Probability and the Weighing of Evidence; C. Griffin: London, UK, 1950. [Google Scholar]
- Nedunchezhian, R.; Anbumani, K. Post mining-Discovering valid rules from different sized data sources. Int. J. Inf. Technol. 2007, 3, 47–53. [Google Scholar]
- Adhikari, A.; Rao, P.R. Synthesizing heavy association rules from different real data sources. Pattern Recognit. Lett. 2008, 29, 59–71. [Google Scholar] [CrossRef]
- Ramkumar, T.; Srinivasan, R. Modified algorithms for synthesizing high-frequency rules from different data sources. Knowl. Inf. Syst. 2008, 17, 313–334. [Google Scholar] [CrossRef]
- Wu, X.; Zhang, S. Synthesizing high-frequency rules from different data sources. IEEE Trans. Knowl. Data Eng. 2003, 15, 353–367. [Google Scholar] [CrossRef]
- Malhotra, D.; Rishi, O. An intelligent approach to design of E-Commerce metasearch and ranking system using next-generation big data analytics. J. King Saud Univ.-Comput. Inf. Sci. 2021, 33, 183–194. [Google Scholar] [CrossRef]
- Gao, M.; Zhang, J.; Yu, J.; Li, J.; Wen, J.; Xiong, Q. Recommender systems based on generative adversarial networks: A problem-driven perspective. Inf. Sci. 2021, 546, 1166–1185. [Google Scholar] [CrossRef]
- Isinkaye, F.O.; Folajimi, Y.O.; Ojokoh, B.A. Recommendation systems: Principles, methods and evaluation. Egypt. Inform. J. 2015, 16, 261–273. [Google Scholar] [CrossRef]
- Bai, Z.; Huang, Y.; Zhang, S.; Li, P.; Chang, Y.; Lin, X. Multi-Level Knowledge-Aware Contrastive Learning Network for Personalized Recipe Recommendation. Appl. Sci. 2022, 12, 12863. [Google Scholar] [CrossRef]
- Cai, Z.; Yuan, G.; Qiao, S.; Qu, S.; Zhang, Y.; Bing, R. FG-CF: Friends-aware graph collaborative filtering for POI recommendation. Neurocomputing 2022, 488, 107–119. [Google Scholar] [CrossRef]
- Roy, D.; Dutta, M. A systematic review and research perspective on recommender systems. J. Big Data 2022, 9, 59. [Google Scholar] [CrossRef]
- Geuens, S.; Coussement, K.; De Bock, K.W. A framework for configuring collaborative filtering-based recommendations derived from purchase data. Eur. J. Oper. Res. 2018, 265, 208–218. [Google Scholar] [CrossRef]
- Hwangbo, H.; Kim, Y.S.; Cha, K.J. Recommendation system development for fashion retail e-commerce. Electron. Commer. Res. Appl. 2018, 28, 94–101. [Google Scholar] [CrossRef]
- Liu, Z.; Ma, Y.; Zheng, H.; Liu, D.; Liu, J. Human resource recommendation algorithm based on improved frequent itemset mining. Future Gener. Comput. Syst. 2022, 126, 284–288. [Google Scholar] [CrossRef]
- Sanjeev, D.; Singh, K.; Craciun, E.M.; Rabaea, A.; Batra, A. Next-Cart Recommendation by Utilizing Personalized Item Frequency Information in Online Web Portals. Neural Process. Lett. 2023, 55, 9409–9434. [Google Scholar] [CrossRef]
- Sheng, J.; Liu, Q.; Hou, Z.; Wang, B. A collaborative filtering recommendation algorithm based on community detection and graph neural network. Neural Process. Lett. 2023, 55, 7095–7112. [Google Scholar] [CrossRef]
- Su, Y.; Zhang, R.; Erfani, S.; Xu, Z. Detecting beneficial feature interactions for recommender systems. In Proceedings of the AAAI Conference on Artificial Intelligence, Online, 18 May 2021; Volume 35, pp. 4357–4365. [Google Scholar]
- Ding, X.; Li, G.; Yuan, L.; Zhang, L.; Rong, Q. Efficient federated item similarity model for privacy-preserving recommendation. Inf. Process. Manag. 2023, 60, 103470. [Google Scholar] [CrossRef]
- Alrasheed, H.; Alzeer, A.; Alhowimel, A.; Althyabi, A. A multi-level tourism destination recommender system. Procedia Comput. Sci. 2020, 170, 333–340. [Google Scholar] [CrossRef]
- Thakker, U.; Patel, R.; Shah, M. A comprehensive analysis on movie recommendation system employing collaborative filtering. Multimed. Tools Appl. 2021, 80, 28647–28672. [Google Scholar] [CrossRef]
- Lai, X.; Chen, J. Film and television art innovation in network environment by using collaborative filtering recommendation algorithm. Soft Comput. 2023, 27, 7579–7589. [Google Scholar] [CrossRef]
- Deldjoo, Y.; Schedl, M.; Cremonesi, P.; Pasi, G. Recommender systems leveraging multimedia content. ACM Comput. Surv. (CSUR) 2020, 53, 1–38. [Google Scholar] [CrossRef]
- Widiyaningtyas, T.; Hidayah, I.; Adji, T.B. User profile correlation-based similarity (UPCSim) algorithm in movie recommendation system. J. Big Data 2021, 8, 52. [Google Scholar] [CrossRef]
- Fouad, M.A.; Hussein, W.; Rady, S.; Yu, P.S.; Gharib, T.F. An efficient approach for rational next-basket recommendation. IEEE Access 2022, 10, 75657–75671. [Google Scholar] [CrossRef]
- Song, B.; Gao, Y.; Li, X.M. Research on collaborative filtering recommendation algorithm based on mahout and user model. J. Phys. Conf. Ser. 2020, 1437, 012095. [Google Scholar] [CrossRef]
- Yan, B.; Dong, A.; Chai, B.; Han, Y.; Zhou, G.; Zhao, F. Blockchain-assisted collaborative service recommendation scheme with data sharing. IEEE Access 2021, 9, 40871–40883. [Google Scholar] [CrossRef]
- Botangen, K.A.; Yu, J.; Sheng, Q.Z.; Han, Y.; Yongchareon, S. Geographic-aware collaborative filtering for web service recommendation. Expert Syst. Appl. 2020, 151, 113347. [Google Scholar] [CrossRef]
- Wang, H.; Fu, W. Personalized learning resource recommendation method based on dynamic collaborative filtering. Mob. Netw. Appl. 2021, 26, 473–487. [Google Scholar] [CrossRef]
- Jia, H.; Yang, L.; Cui, B. Collaborative filtering recommendation of online learning resources based on knowledge association model. Int. J. Emerg. Technol. Learn. (IJET) 2022, 17, 158–172. [Google Scholar] [CrossRef]
- Sarwar, B.; Karypis, G.; Konstan, J.; Riedl, J. Item-based collaborative filtering recommendation algorithms. In Proceedings of the 10th International Conference on World Wide Web, Hong Kong, China, 1–5 May 2001; pp. 285–295. [Google Scholar]
- MovieLens Dataset. Available online: http://grouplens.org/datasets/movielens/ (accessed on 25 January 2025).


| Notation | Description |
|---|---|
| BDi | Big data source of ithbranch or site |
| WBDi | Turnover-based weight of data source |
| TTD | Total turnover weight of data sources |
| W’BDi | Normalized weight of data source |
| TNW | Total normalized weight |
| Min.Ds | Standard minimum voting threshold |
| VBDi | Effective voting threshold of data source |
| U | Domain of all users |
| u | A user |
| Ru,i | Rating of user ‘u’ on item ‘i’ |
| Ru,j | Rating of user ‘u’ on item ‘j’ |
| Mean rating for item ‘i’ | |
| Mean rating for item ‘j’ | |
| Pu,i | Predicted rating of user ‘u’ on item ‘i’ |
| aurj | Active user rating on item j |
| urj | Weighted predicted rating of user ‘u’ on item ‘j’ |
| G-WPRj | Global weighted predicted rating of item j |
| SG-WPRj | Sub-global weighted predicted rating of item j |
| L-WPRj | Local weighted predicted rating of item j |
| F-LWPRj | Final local weighted predicted rating of item j |
| j∀sitei | For all data items J in site i |
| j∃sitei | Data items j existing in site i |
| j∃! Sitei | Data items j not existing in site i |
| Item/User | 101 | 102 | 103 | 104 | 105 | 106 | 107 | 108 | 109 | 110 | 111 | 112 |
|---|---|---|---|---|---|---|---|---|---|---|---|---|
| 1 | 5 | 3 | 2.5 | 4 | 5 | 3 | 2 | 2.5 | 4 | 3 | ||
| 2 | 5 | 2 | 3 | 4 | 2 | 4 | 2 | 2.5 | 3 | |||
| 3 | 2.5 | 4 | 4.5 | 4.5 | 5 | 3 | 3.5 | 3 | ||||
| 4 | 3 | 5 | 4 | 3 | 3 | 2 | 2 | |||||
| 5 | 3 | 2 | 4 | 4 | 4 | 2.5 | ||||||
| 6 | 4 | 3 | 2 | 3 | 5 | 2 | 3 | |||||
| 7 | 2 | 3 | 3 | 4.5 | 3.5 | 3.5 | 4 | 3 | 3.5 | |||
| 8 | 2 | 3 | 3 | 4.5 | 3.5 | 2.5 | 3 | |||||
| 9 | 3.5 | 3.5 | 4 | 5 | ||||||||
| 10 | 3.5 | 4 | 4 | 4 | 3 | 3.5 | 5 | 4 | ||||
| 11 | 2 | 5 | 1 | 2 | 4.5 | 2.5 | 1.5 | |||||
| 12 | 2.5 | 3 | 4 | 4.5 | 3 | 5 | ||||||
| 13 | 4 | 5 | 3.5 | 4.5 | 3.5 | 4 |
| Item/User | 101 | 102 | 103 | 104 | 105 | 106 | 107 | 108 | 109 | 110 | 111 | 112 |
|---|---|---|---|---|---|---|---|---|---|---|---|---|
| 1 | 5 | 3 | 2.5 | 4 | 5 | 3 | 2 | 4 | ||||
| 2 | 5 | 2 | 3 | 4 | 2 | 4 | 2.5 | 3 | ||||
| 3 | 2.5 | 4 | 4.5 | 4.5 | 5 | 5 | 3 | 3.5 | 3 | |||
| 4 | 3 | 4 | 5 | 3 | 3 | 2 | 2 | |||||
| 5 | 4 | 3 | 4 | 4 | 4 | 2.5 | ||||||
| 6 | 4 | 3 | 2 | 5 | ||||||||
| 7 | 2 | 3 | 3 | 4.5 | 3.5 | 4 | 3 | 3.5 | ||||
| 8 | 2 | 3 | 3 | 4.5 | 3.5 | 2.5 | 3 | |||||
| 9 | 3.5 | 3.5 | 5 | 4 | 5 | |||||||
| 10 | 3.5 | 4 | 4 | 4 | 2.5 | 3.5 | 4 | |||||
| 11 | 2 | 5 | 1 | 2 | 4.5 | 2.5 | 1.5 | |||||
| 12 | 2.5 | 3 | 3 | 4.5 | 3 | 5 | ||||||
| 13 | 4 | 5 | 3.5 | 4.5 | 3.5 | 4 |
| Item/User | 101 | 102 | 103 | 104 | 105 | 106 | 107 | 108 | 109 | 110 | 111 | 112 |
|---|---|---|---|---|---|---|---|---|---|---|---|---|
| 1 | 5 | 3 | 2.5 | 4 | 5 | 3 | 2 | 2.5 | 4 | 3 | ||
| 2 | 5 | 2 | 3 | 4 | 2 | 4 | 2 | 2.5 | 3 | |||
| 3 | 2.5 | 4 | 4.5 | 4.5 | 5 | 3 | 3.5 | 3 | ||||
| 4 | 3 | 5 | 4 | 3 | 3 | 2 | 2 | |||||
| 5 | 3 | 2 | 4 | 4 | 4 | 2.5 | ||||||
| 6 | 4 | 3 | 2 | 3 | 5 | 2 | 3 | |||||
| 7 | 2 | 3 | 3 | 4.5 | 3.5 | 3.5 | 4 | 3 | 3.5 | |||
| 8 | 2 | 3 | 3 | 4.5 | 3.5 | 2.5 | 3 | |||||
| 9 | 3.5 | 3.5 | 4 | 5 | ||||||||
| 10 | 3.5 | 4 | 4 | 4 | 3 | 3.5 | 5 | 4 | ||||
| 11 | 2 | 5 | 1 | 2 | 4.5 | 2.5 | 1.5 | |||||
| 12 | 2.5 | 3 | 4 | 4.5 | 3 | 5 | ||||||
| 13 | 4 | 5 | 3.5 | 4.5 | 3.5 | 4 |
| Item Id | Site1 | Site2 | Site3 | |||
|---|---|---|---|---|---|---|
| No. of User Voted | Voted Rating of Items | No. of User Voted | Voted Rating of Items | No. of User Voted | Voted Rating of Items | |
| 101 | 10 | 71.4 | 5 | 35.7 | 11 | 78.5 |
| 102 | 6 | 42.9 | 11 | 78.6 | 9 | 64.2 |
| 103 | 12 | 85.7 | 10 | 71.4 | 12 | 85.7 |
| 104 | 5 | 35.7 | 7 | 50 | 7 | 50 |
| 105 | 4 | 28.6 | 8 | 57.1 | 7 | 50 |
| 106 | 11 | 78.6 | 10 | 71.4 | 7 | 50 |
| 107 | 11 | 78.6 | 8 | 57.1 | 4 | 28.5 |
| 108 | 3 | 21.4 | 6 | 42.9 | 7 | 50 |
| 109 | 10 | 71.4 | 4 | 28.6 | 10 | 71.4 |
| 110 | 7 | 50 | 10 | 71.4 | 6 | 42.9 |
| 111 | 10 | 71.4 | 9 | 64.2 | 9 | 64.2 |
| 112 | 9 | 64.2 | 11 | 78.6 | 8 | 57.1 |
| Nature of Recommendation | Site Cluster | List of Items |
|---|---|---|
| Global recommended items | (Site1, Site2, Site3) | 102, 103, 111, 112 |
| Sub-global recommended items | (Site1, Site 2) | 104, 105, 106, 107, 110 |
| (Site1, Site3) | 101, 109 | |
| Local recommended items | (Site2) | 108 |
| Uninteresting items | (Site1) | 108 |
| (Site2) | 101, 109 | |
| (Site3) | 104, 105, 106, 107, 108 |
| Item | Weighted Predicted Rating |
|---|---|
| Global recommended items | [{102:4.09}, {103:3.4}, {111:3.5}, {112:3.5}] |
| Sub-global recommended items | [{104:2.64}, {105:3.38}, {106:3.38}, {107:3.76}, {110:3.56}, {101:2.82}, {109:3.27}] |
| Local recommended items | [{108:3.7}] |
| Items | Site Cluster | Weighted Predicted Rating |
|---|---|---|
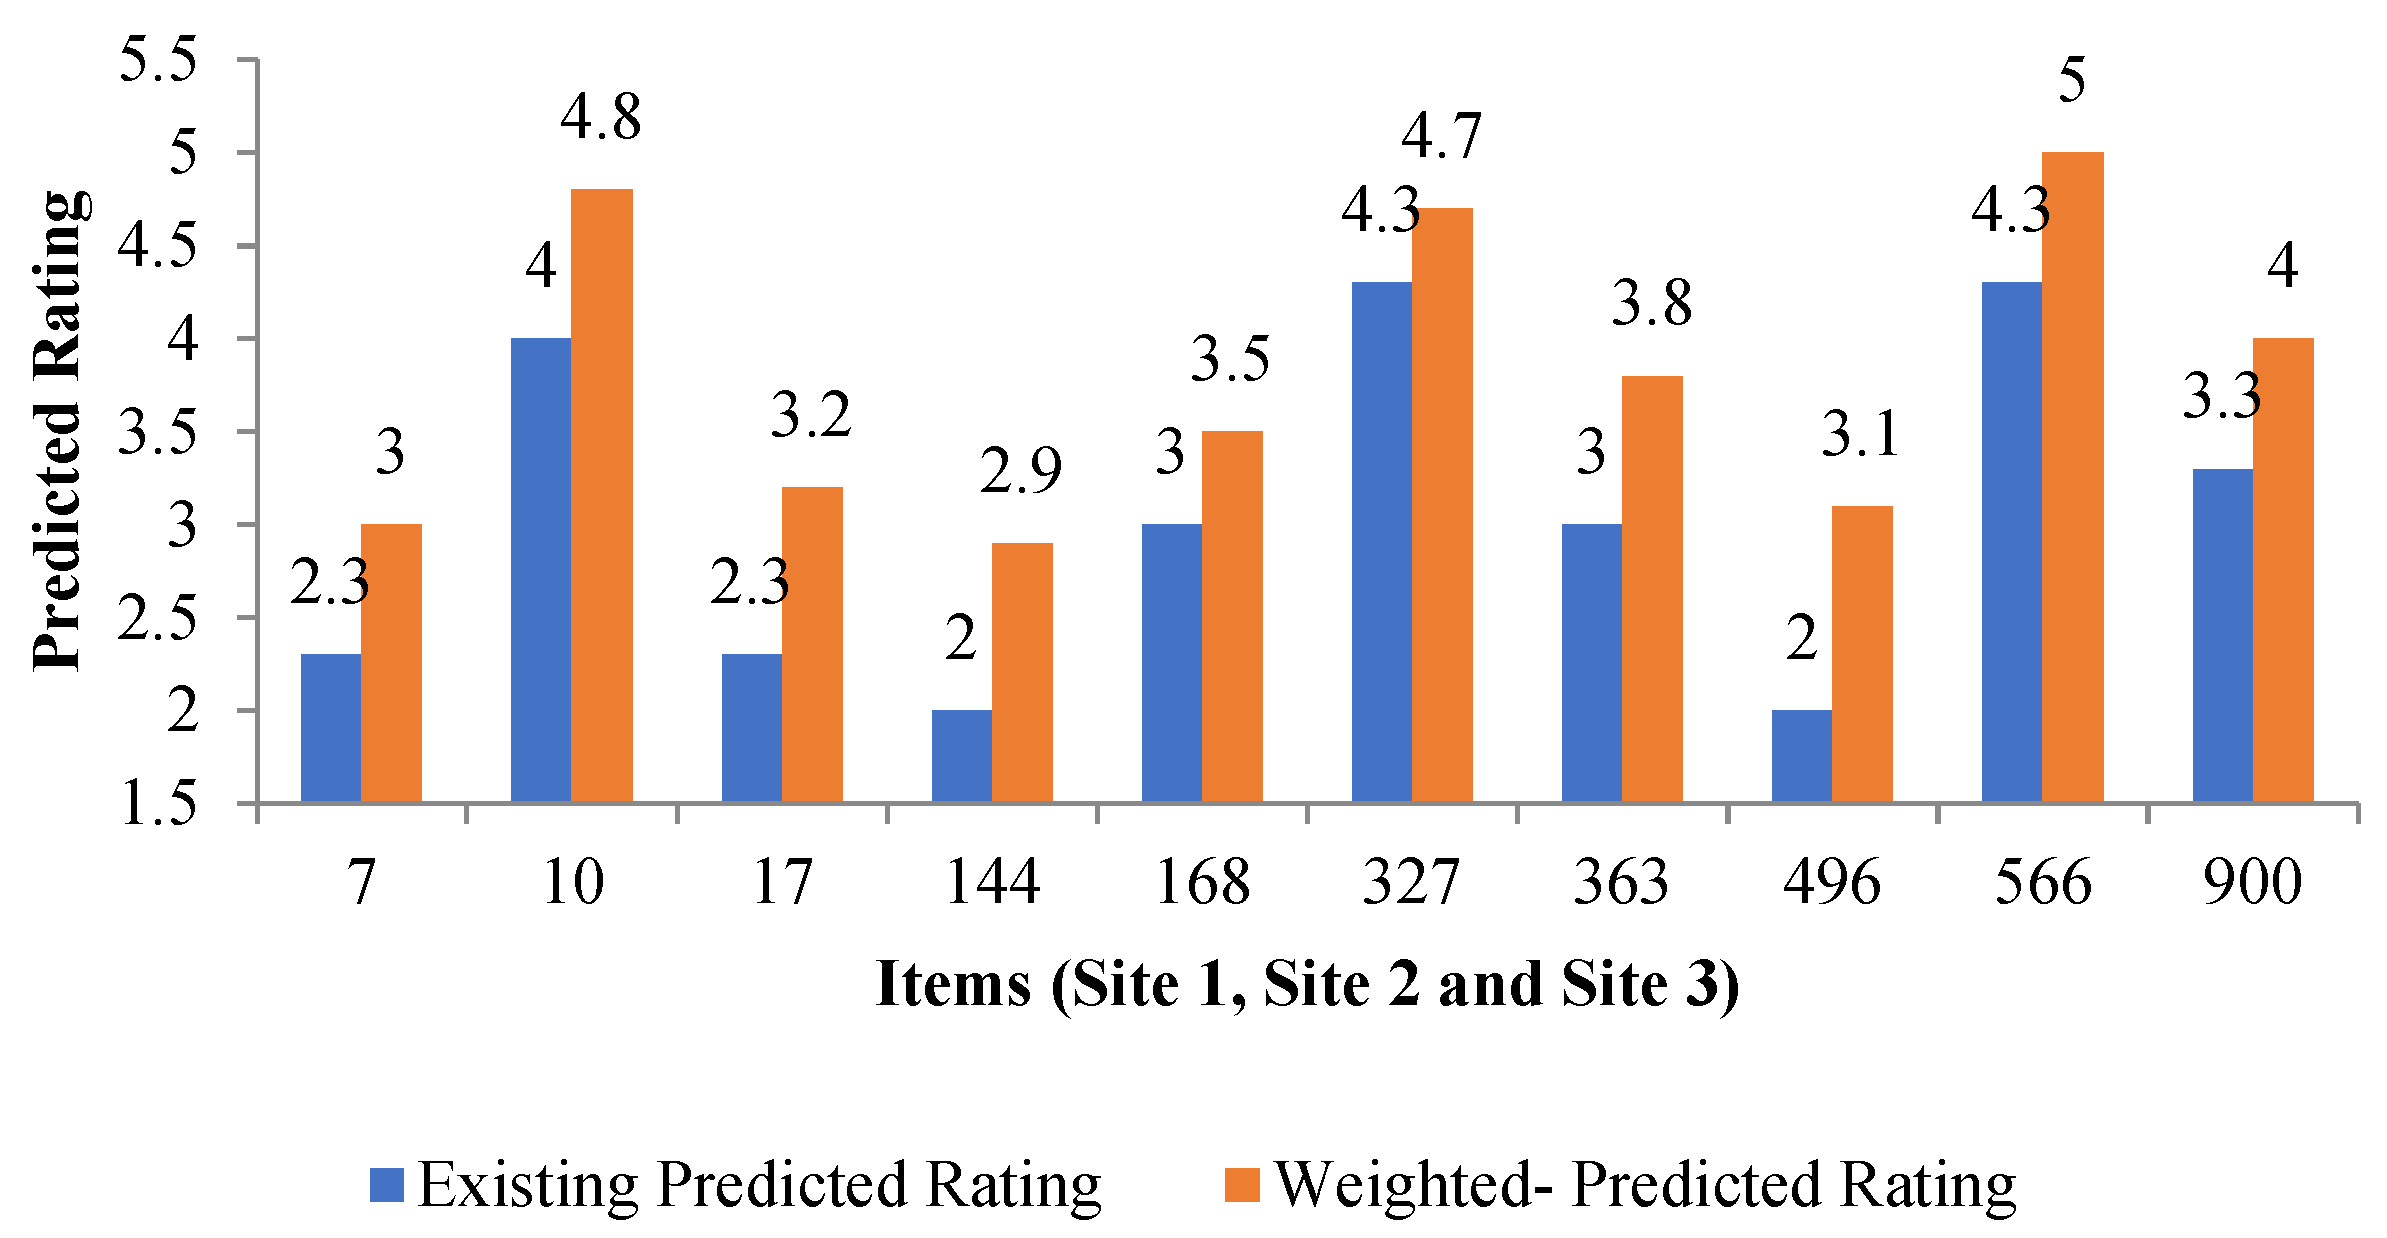
| Global recommended item | (Site1, Site2, Site3) | [{7:3}, {10:4.8}, {17:3.2}, {144:2.9}, {168:3.5}, {327:4.7}, {363:3.8}, {496:3.1}, {566:5}, {900:4}] |
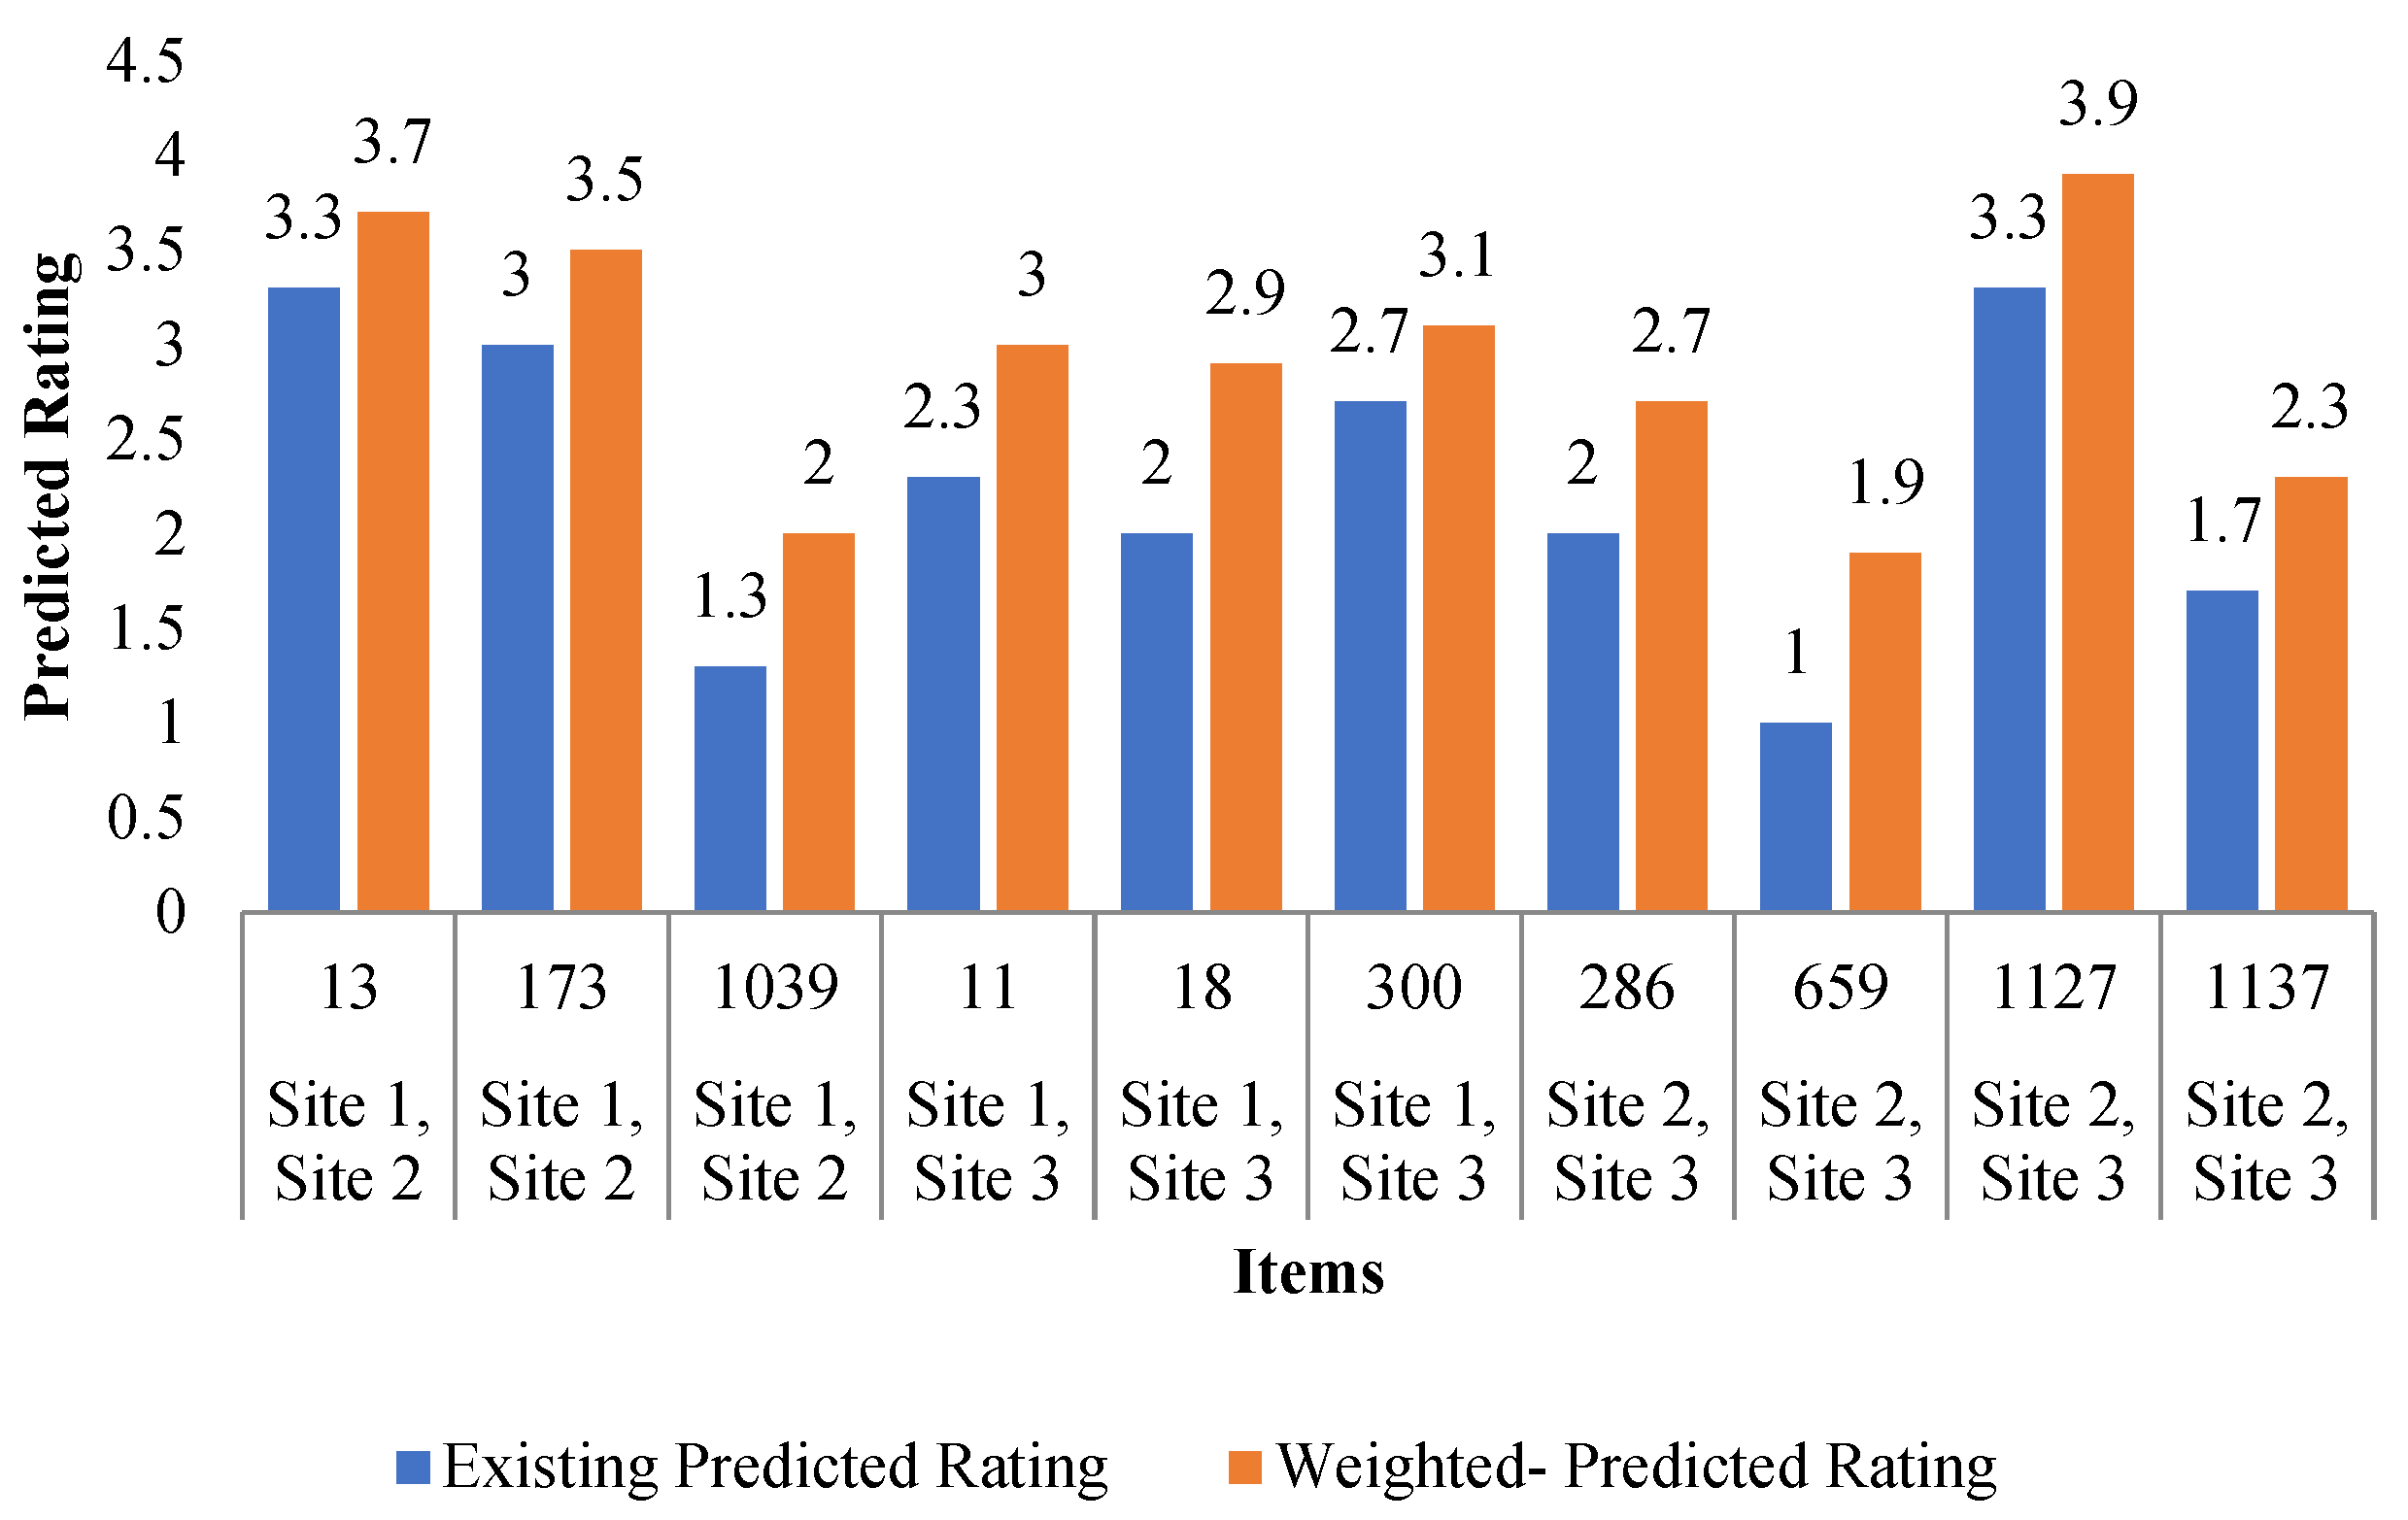
| Sub-global recommended item | (Site1, Site2) | [{13:3.7}, {173:3.5}, {1039:2.0}] |
| (Site1, Site3) | [{11:3.0}, {18:2.9}, {300:3.1}] | |
| (Site2, Site3) | [{286:2.7}, {659:1.9}, {1127:3.9} {1137:2.3}] | |
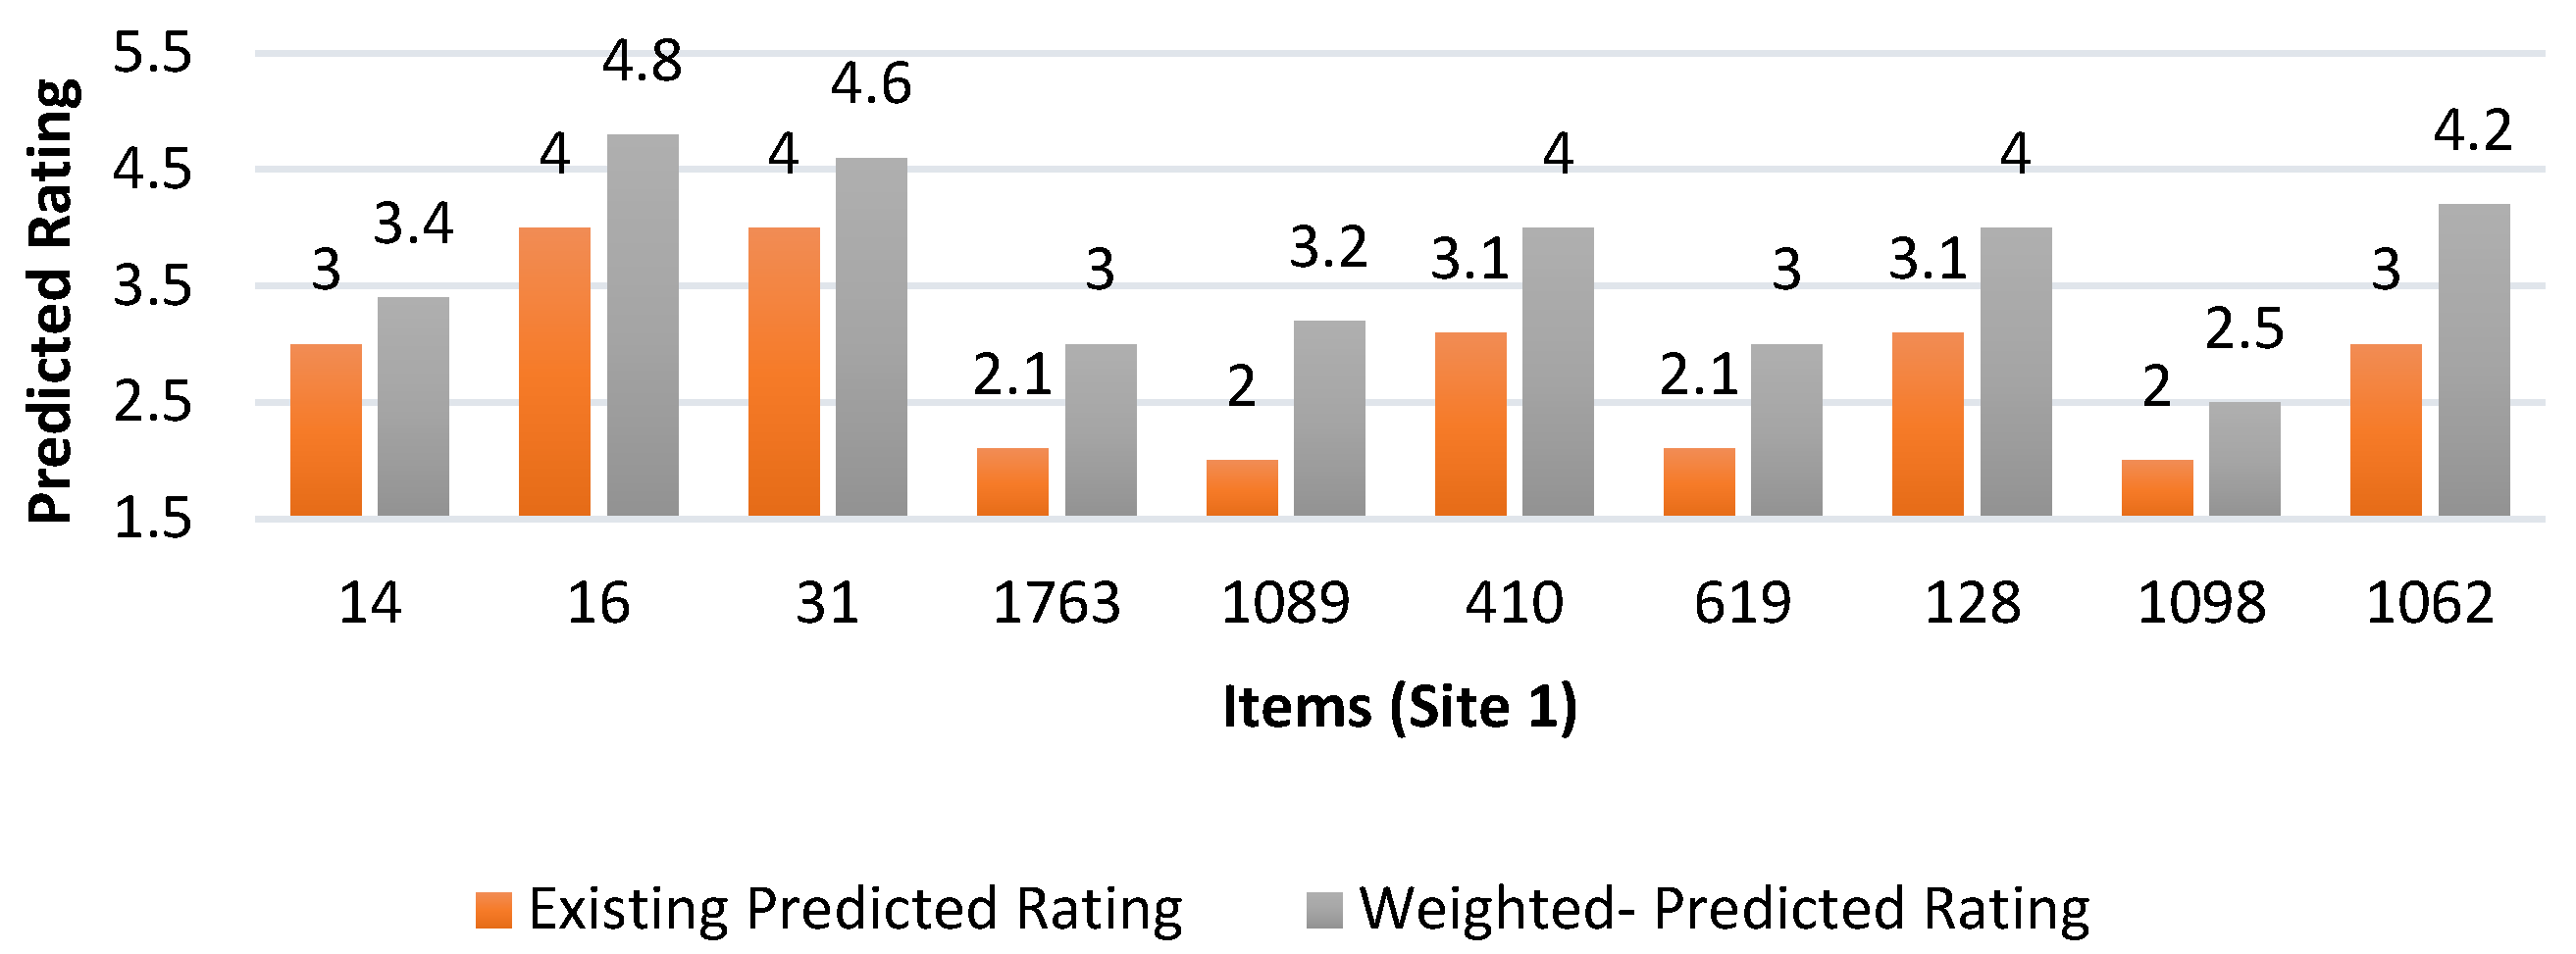
| Local recommended item | (Site1) | [(14:3.4, {16:4.8}, {31:4.6}, {1763:3}, {1089:3.2}, {410:4.0}, {619:3.0}, {128:4.0}, {1098:2.5}, {1062:4.2}] |
| (Site2) | [{114:4.1}, {188:4.7}, {220:3.9}, {270:3.5}, {303:4.0}, {411:2.0}, {686:2.5}, {882:3.0}, {1115:3.5}, {1963:2.0}] | |
| (Site3) | [{22:2.0}, {32:2.2}, {47:2.5}, {134:2.4}, {151:2.0}, {177:2.7}, {451:3.0}, {654:2.2}, {946:2.9}, {1009:3.0}] |
| Metric | Existing Predicted Rating | Weighted Predicted Rating |
|---|---|---|
| RMSE | 0.926 | 0.782 |
| MAE | 0.734 | 0.602 |
| Precision@5 | 0.602 | 0.710 |
| Recall@5 | 0.518 | 0.621 |
Disclaimer/Publisher’s Note: The statements, opinions and data contained in all publications are solely those of the individual author(s) and contributor(s) and not of MDPI and/or the editor(s). MDPI and/or the editor(s) disclaim responsibility for any injury to people or property resulting from any ideas, methods, instructions or products referred to in the content. |
© 2025 by the authors. Licensee MDPI, Basel, Switzerland. This article is an open access article distributed under the terms and conditions of the Creative Commons Attribution (CC BY) license (https://creativecommons.org/licenses/by/4.0/).
Share and Cite
Thillainayagam, V.; Thirunavukarasu, R.; Pandian, J.A. Enhanced Multi-Level Recommender System Using Turnover-Based Weighting for Predicting Regional Preferences. Computers 2025, 14, 294. https://doi.org/10.3390/computers14070294
Thillainayagam V, Thirunavukarasu R, Pandian JA. Enhanced Multi-Level Recommender System Using Turnover-Based Weighting for Predicting Regional Preferences. Computers. 2025; 14(7):294. https://doi.org/10.3390/computers14070294
Chicago/Turabian StyleThillainayagam, Venkatesan, Ramkumar Thirunavukarasu, and J. Arun Pandian. 2025. "Enhanced Multi-Level Recommender System Using Turnover-Based Weighting for Predicting Regional Preferences" Computers 14, no. 7: 294. https://doi.org/10.3390/computers14070294
APA StyleThillainayagam, V., Thirunavukarasu, R., & Pandian, J. A. (2025). Enhanced Multi-Level Recommender System Using Turnover-Based Weighting for Predicting Regional Preferences. Computers, 14(7), 294. https://doi.org/10.3390/computers14070294