1. Introduction
With the rapid development and popularization of computer networks, especially mobile networks, the reach of the Internet has penetrated every aspect of people’s lives [
1]. According to the Statistical Report on China’s Internet Development released by China Internet Network Information Center (CNNIC) on 28 February 2025, by the end of December 2024, the number of Internet users had reached 1.108 billion, with an Internet penetration rate of 78.6%. Along with this growth, various online applications have proliferated, generating massive amounts of different types of network traffic during information communication and data transmission [
2]. This diverse network traffic poses significant challenges to network management and cybersecurity, particularly dark web traffic [
3,
4,
5]. Due to its anonymity, illegality, and untraceability, dark web traffic is often associated with illegal activities, posing serious systemic threats to personal security, social order, and national security [
6,
7,
8,
9].
Therefore, classifying and identifying dark web traffic, further detecting network attacks or intrusions, and improving network operation efficiency have become important prerequisites for network management, ensuring network operation, and guaranteeing network security.
With the rise of deep learning, classification methods based on deep learning have emerged, including convolutional neural networks, recurrent neural networks, and various network structure fusion methods. N. Shone et al. proposed an intrusion detection method based on deep neural networks, which achieves anomaly detection by automatically extracting network traffic features, providing reference for further research on dark web traffic classification [
10]. L. Zhang et al. utilized NetFlow data to train deep learning models for network traffic classification [
11]. S. Dong proposed an anomaly traffic detection algorithm based on Variational Autoencoder (VAE) [
12]. F. Karim et al. combined LSTM with a Fully Convolutional Network (FCN) to propose a multivariate time-series classification model [
13]. J. Li et al. discussed the application of deep learning in network traffic classification and its practical application value in network security and management [
14]. Adelipour proposed a privacy-preserving model predictive control (MPC) framework based on secure multi-party computation (SMPC) [
15]. Meanwhile, from initial traditional classification methods based on port numbers and deep packet inspection to machine-learning-based classification methods such as SVM and decision trees [
16,
17,
18,
19,
20], various classification studies have emerged one after another.
However, existing network traffic classification methods generally suffer from weak deep feature extraction capabilities [
21,
22], overly localized model focus [
23,
24], and insufficient model generalization abilities, requiring further research and improvement [
25,
26], which is particularly evident when dealing with dark web traffic classification [
27,
28,
29].
To address the above issues, this paper proposes a dark web traffic identification model based on multi-channel image visual feature recognition and 3D convolutional neural networks. First, dark web traffic is transformed into three-channel color images through two-dimensional conversion, and the time characteristic dimension is added to form 3D data as input. Then, 3D convolutional neural networks are utilized to improve learning efficiency through multi-dimensional feature extraction, data diversity enhancement, and model optimization, significantly enhancing the ability to identify complex dark web traffic.
The structure of the remaining part of the thesis is as follows:
Section 2 introduces relevant methods and technologies,
Section 3 describes the experimental setup,
Section 4 analyzes the experimental results, and
Section 5 summarizes the entire thesis and draws research conclusions, concluding the existing problems and future research directions.
2. Methods
2.1. Experimental Procedure
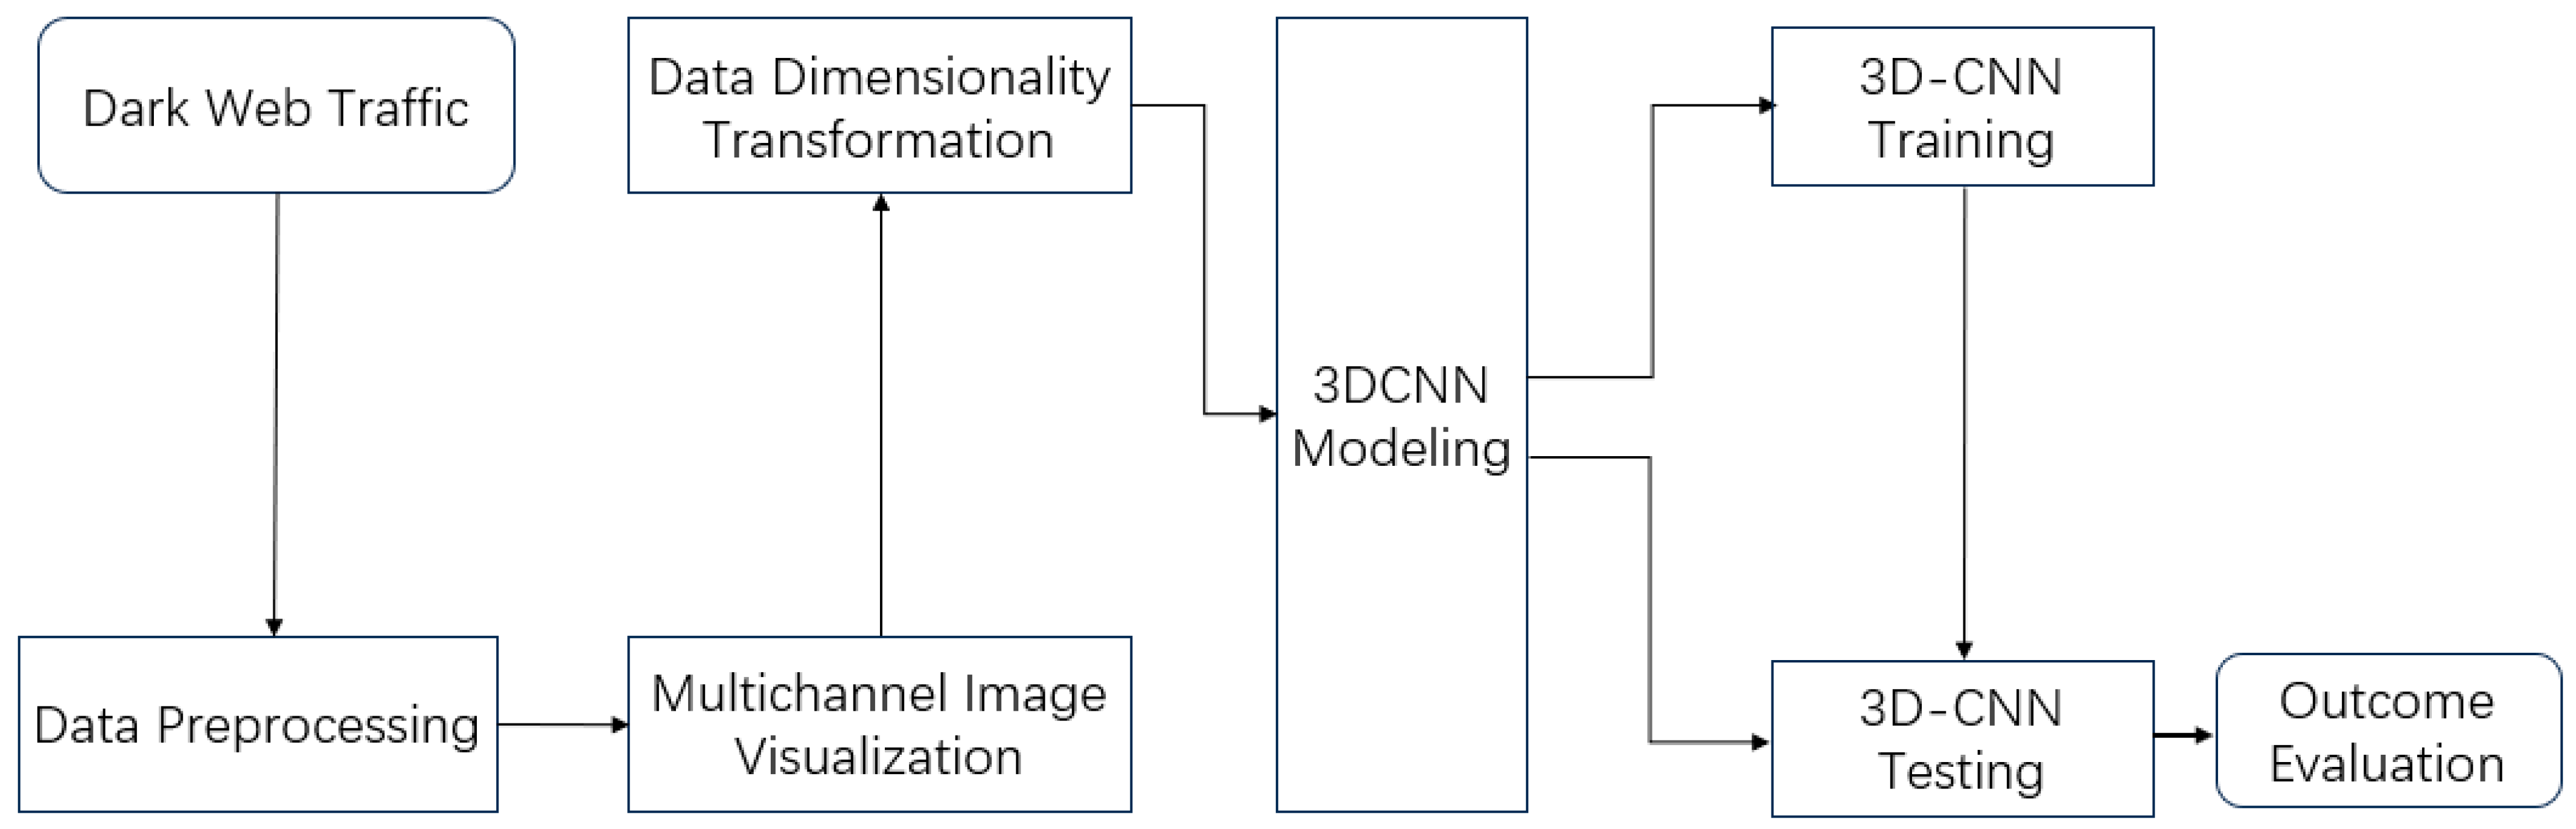
Dark web traffic consists of five aspects based on multi-channel image visual features and 3D convolutional neural networks, systematically achieving the intelligent recognition of dark web traffic, as shown in
Figure 1.
(1) Data Preparing: During this stage, unavailable packets and invalid information within packets are discarded. These mainly include packets that cannot provide useful information for algorithms and may even lead to errors in model prediction results. The remaining packets are used as input features for subsequent processes.
(2) Multichannel Visualization Processing: We transform the dark web traffic files to be detected into standardized image datasets through multi-channel imaging technology. We achieve visual expression of traffic patterns through pixel-level feature mapping, providing structured inputs for subsequent deep learning analysis.
(3) Data Dimensionality Transformation and Processing: To meet the high requirements of 3D-CNN models for data quality, multi-dimensional preprocessing operations are performed, including standardizing image sizes to model-compatible specifications, implementing dataset equalization (such as oversampling) and data augmentation (such as rotation or flipping), in order to eliminate sample distribution bias and enhance model robustness.
(4) 3D-CNN Modeling: Based on the requirements of dark web traffic identification tasks, we design a hierarchical feature extraction network architecture. Through 3D convolutional layers, we gradually abstract the spatiotemporal features of traffic, adding the dimension of time characteristics to form 3D data as input. This is equivalent to transforming flow data into multi-frame grayscale images in video processing, where individual frames are tiled and concatenated into a single large image. We utilize 3D-CNN models to learn the features of these large images, thereby improving learning efficiency.
(5) Training and Optimization: We utilize the labeled dataset to iteratively optimize the 3D-CNN model, adjust hyperparameters (such as learning rate, regularization coefficient) through cross-validation, and achieve global convergence of parameter space using gradient descent algorithm.
(6) Testing and Evaluation: We construct an independent test set to validate the performance of the trained model. We quantify the model’s accuracy and generalization ability using metrics such as the ROC curve and F1-score, and also analyze the causes of misclassification to guide subsequent iterative optimization.
2.2. Data Pre-Processing
2.2.1. Multichannel Image Visualization of Traffic Code
In dark web traffic, flow characteristics of the same type exhibit similarity, while different types show significant structural differences. This similarity and heterogeneity manifest as the repetitiveness and uniqueness of feature patterns at the binary level, which can be effectively captured and quantified by image texture analysis techniques.
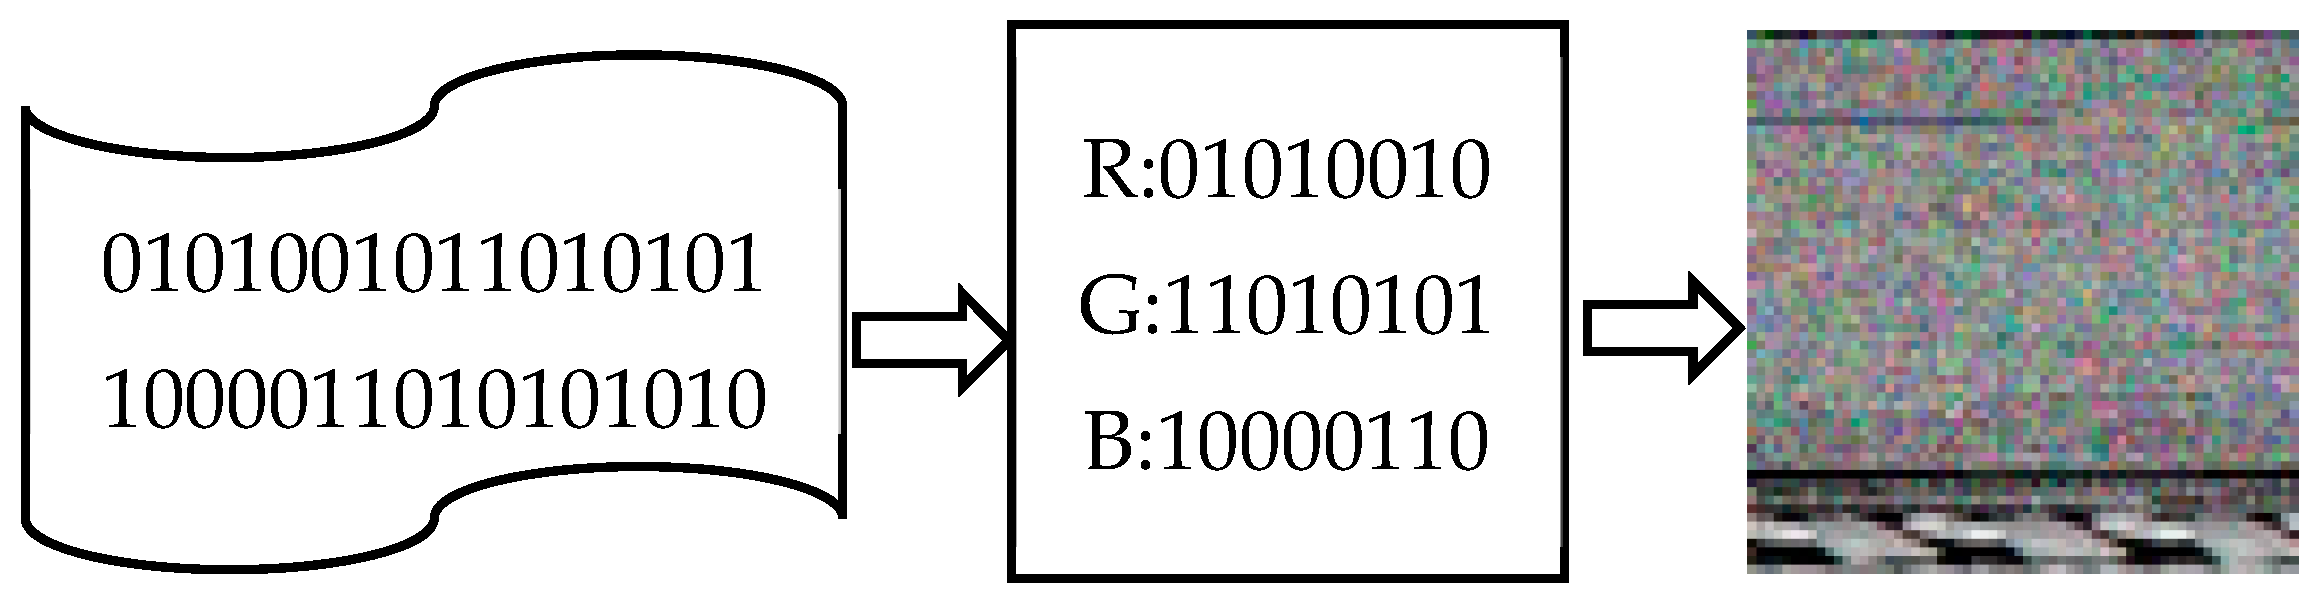
In the concrete implementation, the binary data of dark web traffic files is first processed in blocks: three consecutive bytes are selected as a group, mapped to the pixel values of the RGB three channels, respectively, forming a multi-channel color image. This process iteratively traverses the entire file until all data is completely encoded; if the end data is less than three bytes, it is padded with zeros to ensure the uniformity of the image size. Through this encoding method, the sequence characteristics of the binary code are transformed into visual image features, providing structured input for subsequent image-based deep learning analysis.
For example, 74D918 = (R: 116, G: 217, B: 24). After converting the code file into a one-dimensional pixel sequence, the pixel sequence is squared according to the above method to obtain a color image.
Figure 2 shows the process of converting an executable file into an RGB image, including the executable file data of a certain malware, the pixel sequence obtained by re-encoding the executable file according to bytes, and the color image obtained after squaring the pixel sequence.
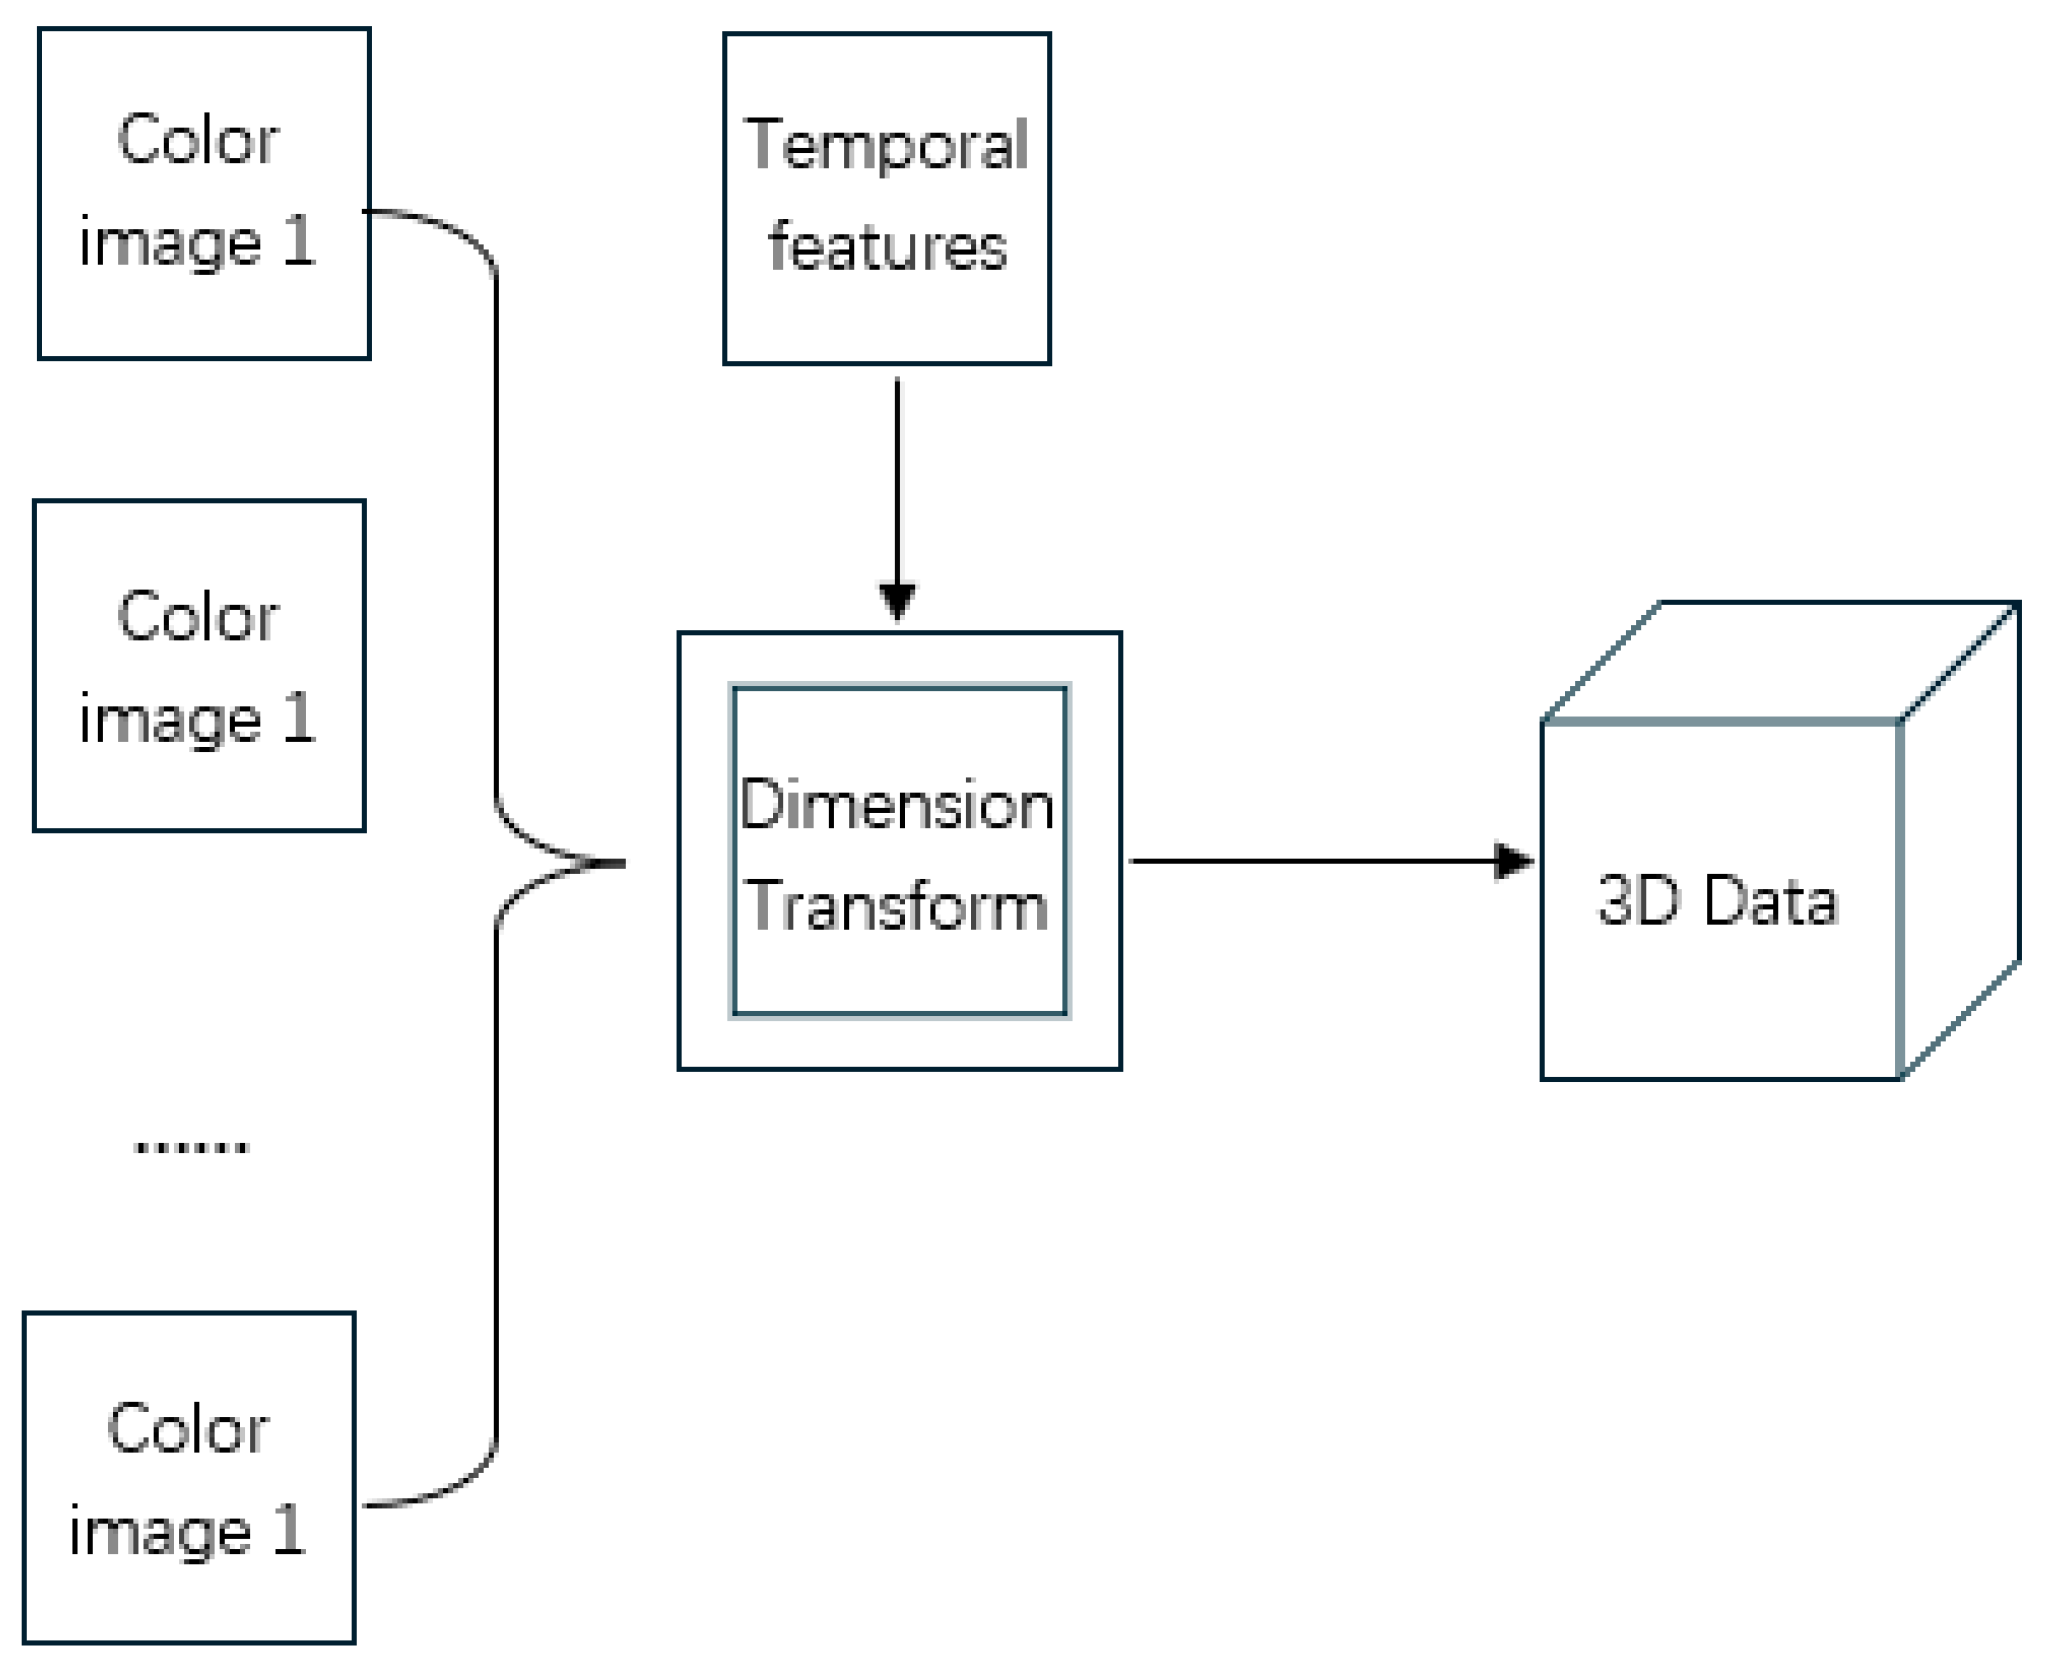
2.2.2. Three-Dimensional Data Transformation
We select the header data of the flow; each header data is encoded as a two-dimensional vector. If each byte of the input data is treated as a pixel value, the output of this step is a two-dimensional grayscale image, which can be analyzed by image-processing methods. This paper adds time features, combining each two-dimensional vector into a three-dimensional vector as input, allowing the model to learn the characteristics of each three-dimensional data, as shown in
Figure 3. By extracting the time dimension separately, the data at the same position of each image is similar, which is beneficial for CNN convolution kernels to extract features. This is equivalent to when processing videos: for each video segment, the control group flattens and combines each frame into one large image to learn the characteristics of each large image. This step does not exist in 1D-CNN and 2D-CNN.
2.3. Model Construction
The 3D convolutional neural network (3D-CNN) mainly consists of convolutional layers, pooling layers, fully connected layers, and output layers. The changes in data scale and dimensionality across the layers are illustrated in
Figure 4. The first and third layers are convolutional layers, producing three-dimensional output data. The second and fourth layers are pooling layers, which halve the input data size. The fifth and sixth layers are fully connected layers, flattening the data and outputting one-dimensional data, with the random dropout of some data. The final layer is the SoftMax output layer, which determines the traffic category and performs the output.
To improve recognition accuracy, the 3D-CNN is specifically designed with 9 layers, as shown in
Figure 5. It should be noted that the arrows represent each layer, while the cubes and rectangles represent the output of each layer.
The 3D-CNN is mainly composed of convolutional layers, pooling layers, fully connected layers, and output layers. The scale and dimensionality of the data change progressively through each layer, as illustrated below:
The first, second, fourth, and fifth layers are convolutional layers with ReLU activation function, producing three-dimensional outputs.
The third and sixth layers are pooling layers, which halve the dimensions of the input data, resulting in three-dimensional outputs.
The seventh and eighth layers are fully connected layers with ReLU activation function, generating one-dimensional outputs. Before the seventh layer, the data is flattened (converted to one dimension) and randomly dropped.
The ninth layer is the output layer, which calculates the probabilities of samples belonging to each category, determines the sample category, and produces the output.
After multiple sets of experimental tuning, the main parameters are selected as follows: the dropout sample retention rate is 0.8, the learning rate is 0.0002, the optimization strategy is AdamOptimizer, Padding is set to SAME, and the number of training epochs is 20.
3. Experimental Setup
3.1. Dataset Construction
We use the Darknet2020 dataset released by the University of New Brunswick (UNB), Canada, which includes Tor direct connections, Shadowsocks proxies, and VPN proxy methods, covering eight categories of encrypted traffic such as web browsing, email, video streaming, and P2P, as shown in
Table 1. The format of this dataset is the same as the raw network traffic data captured by Wireshark, in pcap format. To protect privacy and data security, all data has been anonymized before being used for network traffic analysis and anomaly detection research.
3.2. Experimental Environment
The experimental environment configuration is shown in
Table 2, and GPU acceleration was utilized.
3.3. Evaluation Criteria
For ease of experimental comparison and performance analysis, this paper adopts four performance metrics: accuracy (Acc), error rate (Err), precision (Pre), and recall (Rec). Their definitions are as follows: accuracy equals the number of correctly detected samples divided by the total number of samples, as detailed below.
Accuracy is equal to the number of correctly classified samples divided by the total number of samples. Here,
f represents the classification function,
D represents the dataset,
x is the true label of the data, and
y is the predicted label obtained through the classification function. Accuracy can be expressed as Formula (1).
The error rate equals the number of incorrectly detected samples divided by the total number of samples, which can be expressed as Formula (2).
The relationship between Acc and Err is as shown in Formula (3):
Let
TP represent the number of samples that are correctly identified as malicious,
FP represent the number of samples that are incorrectly identified as malicious,
FN represent the number of samples that are incorrectly identified as benign,
TN represent the number of samples that are correctly identified as benign, and precision represent the ratio of true malicious samples among the detected malicious samples, which is calculated as shown in Formula (4).
The detection rate represents the ratio of all malicious samples that are detected, which can be expressed as Formula (5).
3.4. Experimental Design
The experimental tasks are divided into three parts:
The first is to compare the visualization effects of the same type and different types of dark web traffic.
The second is to conduct a comparative analysis between the 3D-CNN proposed in this paper and other methods, including common 2D-CNN and a few 1D-CNN methods, as detailed in
Section 3.5 Comparative Experimental Design.
The third is to evaluate the parameter complexity of different dark web traffic classification models.
3.5. Comparative Experimental Design
3.5.1. Traffic Classification Based on 2D-CNN
We convert the byte data of network flow into grayscale images byte by byte, transform traffic classification problem into image classification problem, and use 2D-CNN for classification [
30].
During data preprocessing, the input raw data format (network flow, PCAB format) is converted into a format (IDX format) that can be directly processed by convolutional neural networks. That is, the traffic data is visualized, and then the convolutional neural network model is trained to classify the images [
31]. The general process is as follows: First, the traffic is split into several equal-sized data segments, typically 1024 or 784 bytes. Any excess is discarded, and any insufficient data is padded with zeros at the end, resulting in equal-sized traffic data segments. Then, considering that each traffic byte can represent the same range of binary numbers as a grayscale image pixel value (both are 0–255), the traffic data can be directly converted into images.
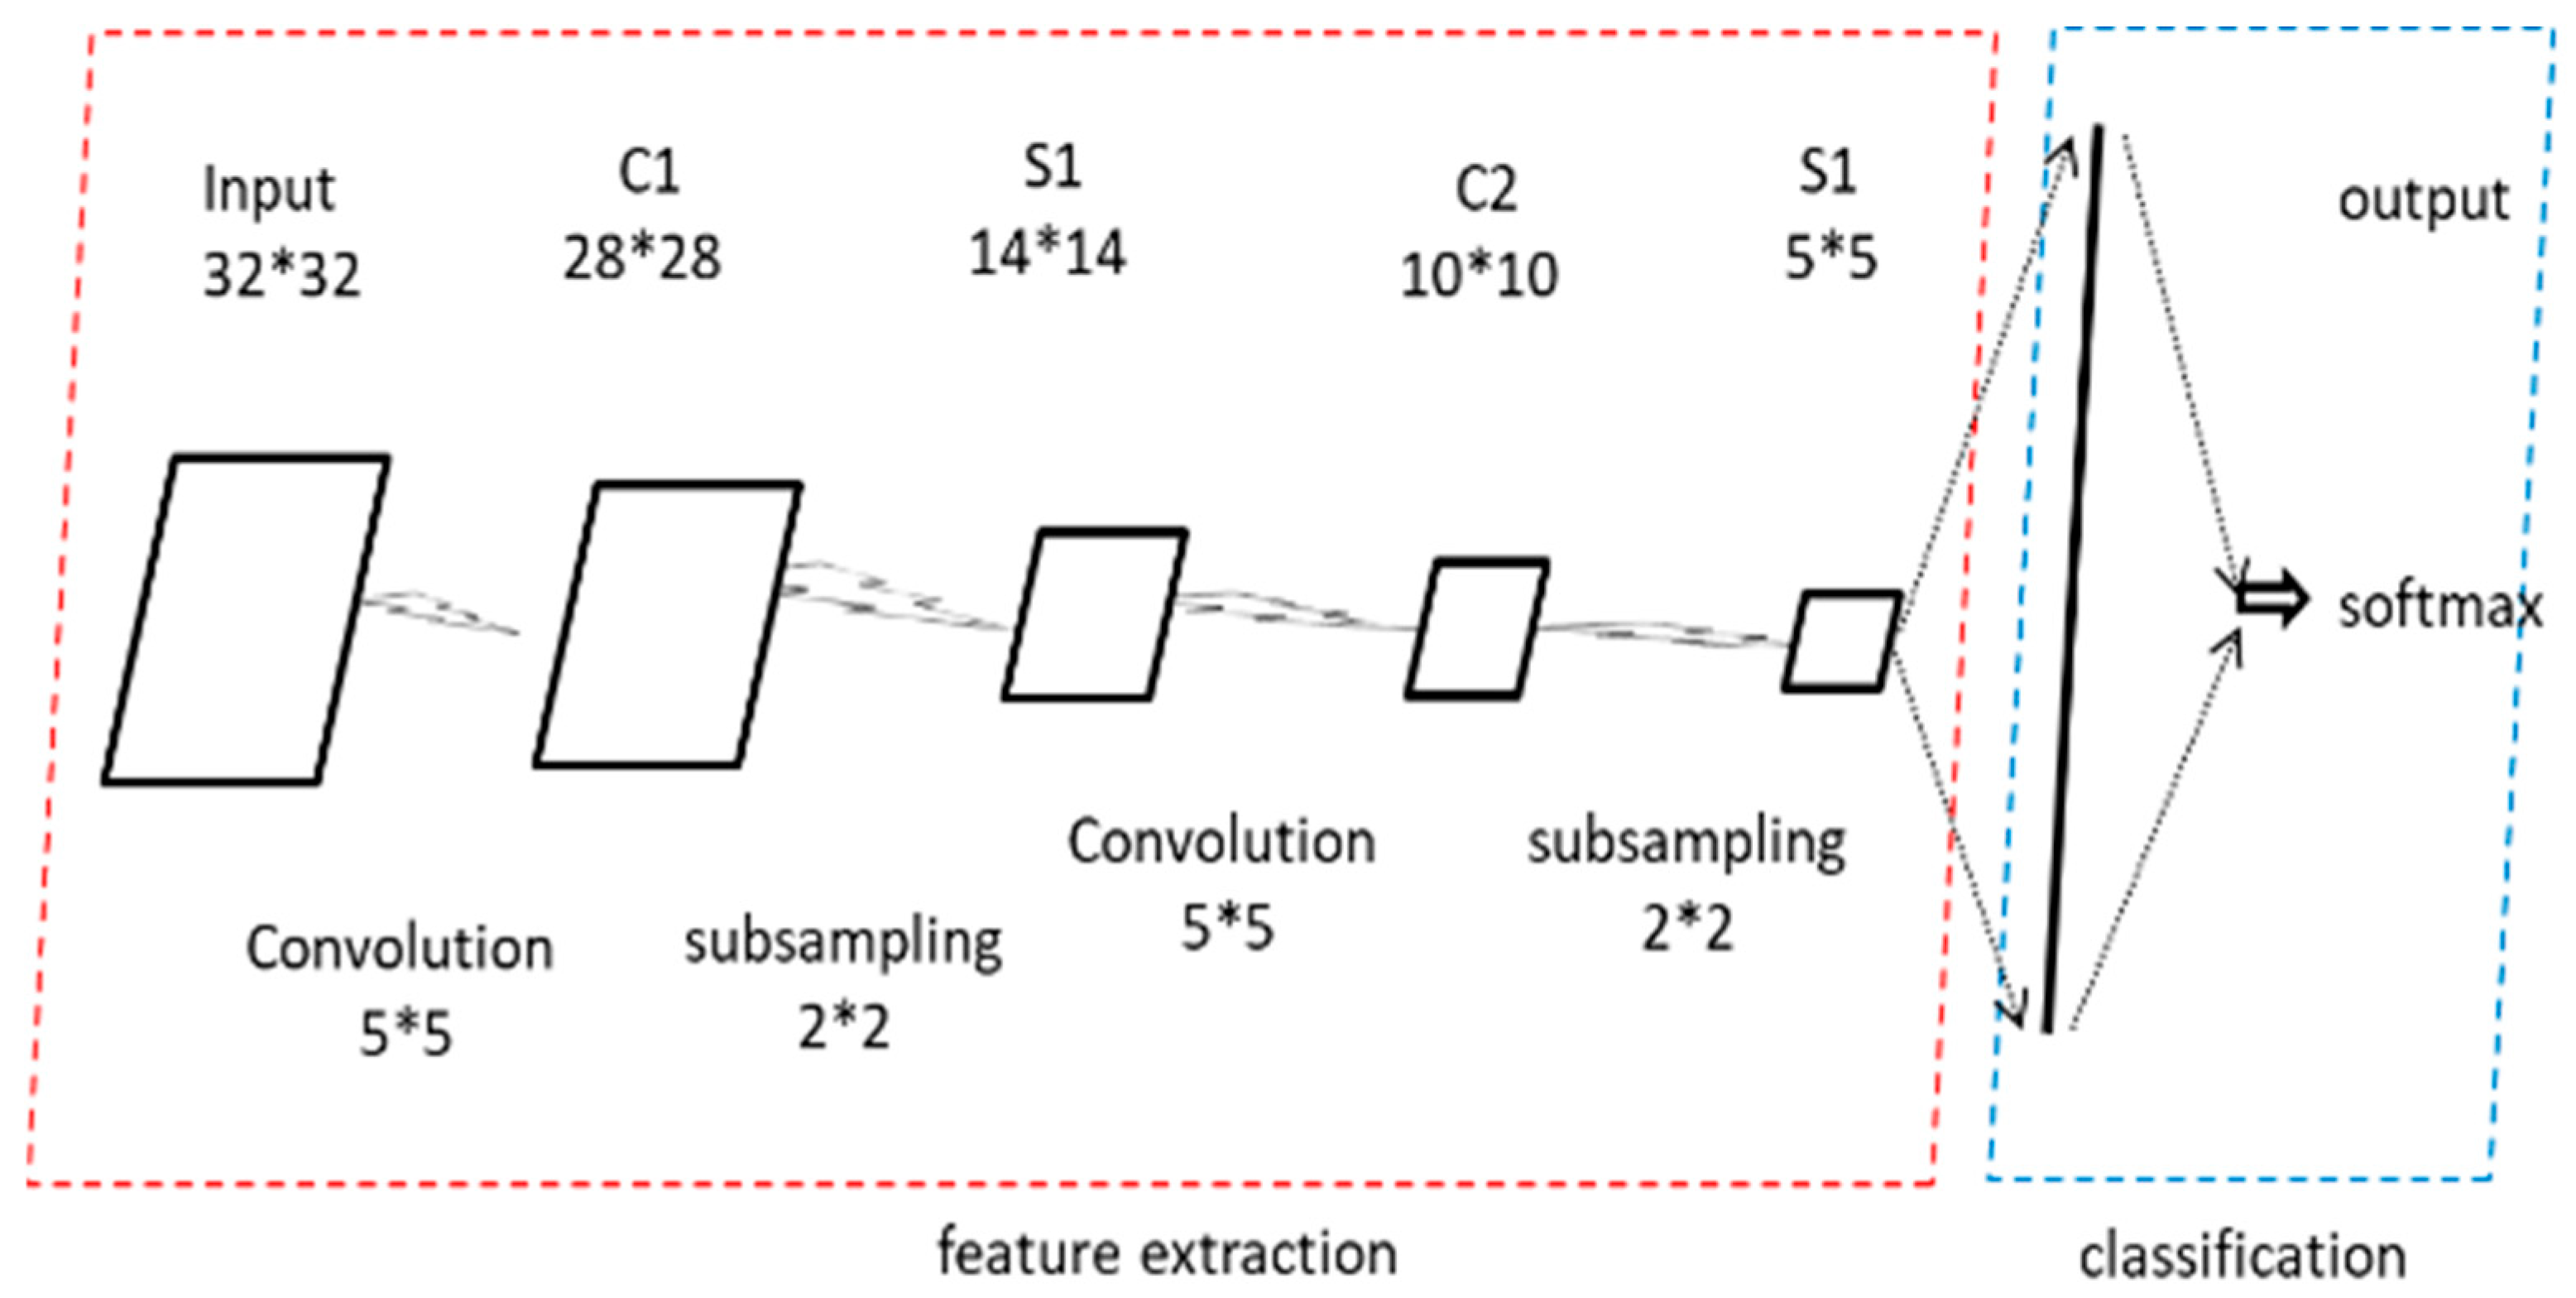
By analyzing the converted grayscale images, we can observe that images converted from the same type of traffic exhibit consistent textures, while images converted from different types of traffic show significant differences. This provides a visual basis for further classification using 2D-CNN. The general structure of 2D-CNN is shown in
Figure 6.
The input data size is 32*32. After passing through the first convolutional layer with a kernel size of 5*5, it becomes 28*28. Then, after passing through a 2*2 pooling layer, it becomes 14*14, completing the first convolution and pooling operation. Similarly, after passing through the second convolutional layer with a kernel size of 5*5, it becomes 10*10. After passing through a 2*2 pooling layer, it becomes 5*5. Finally, it is flattened through a fully connected layer into a one-dimensional vector, and classified through a SoftMax layer. This is an illustration based on an existing network structure, which can be modified according to actual needs.
By following the above steps, we treat network traffic bytes as image grayscale values, transforming the original network traffic classification and recognition tasks into training convolutional neural networks for classification. Through a series of processes including model building, training, and testing, we achieve traffic classification using convolutional neural networks.
3.5.2. Traffic Classification Based on 1D-CNN
We treat the byte data of network traffic as characters in natural language and use document classification techniques from natural language processing to achieve traffic classification [
32]. During data preprocessing, fixed-length byte data is extracted from the stream and directly used as input to 1D-CNN.
The overall structure of the model is somewhat like 2D-CNN, except that both the input data, convolution kernels, and output data are one-dimensional, with changes in dimensions as shown in
Figure 7.
Unlike the method of using 2D-CNN to transform network traffic into images for classification, 1D-CNN treats bytes, frames, packets, and flows in network traffic as letters, words, sentences, and articles, respectively. By adopting text classification techniques, 1D-CNN achieves network traffic classification.
4. Results and Discussion
4.1. Analysis of Experiment 1 Results—Comparative Visualization of Multichannel Images
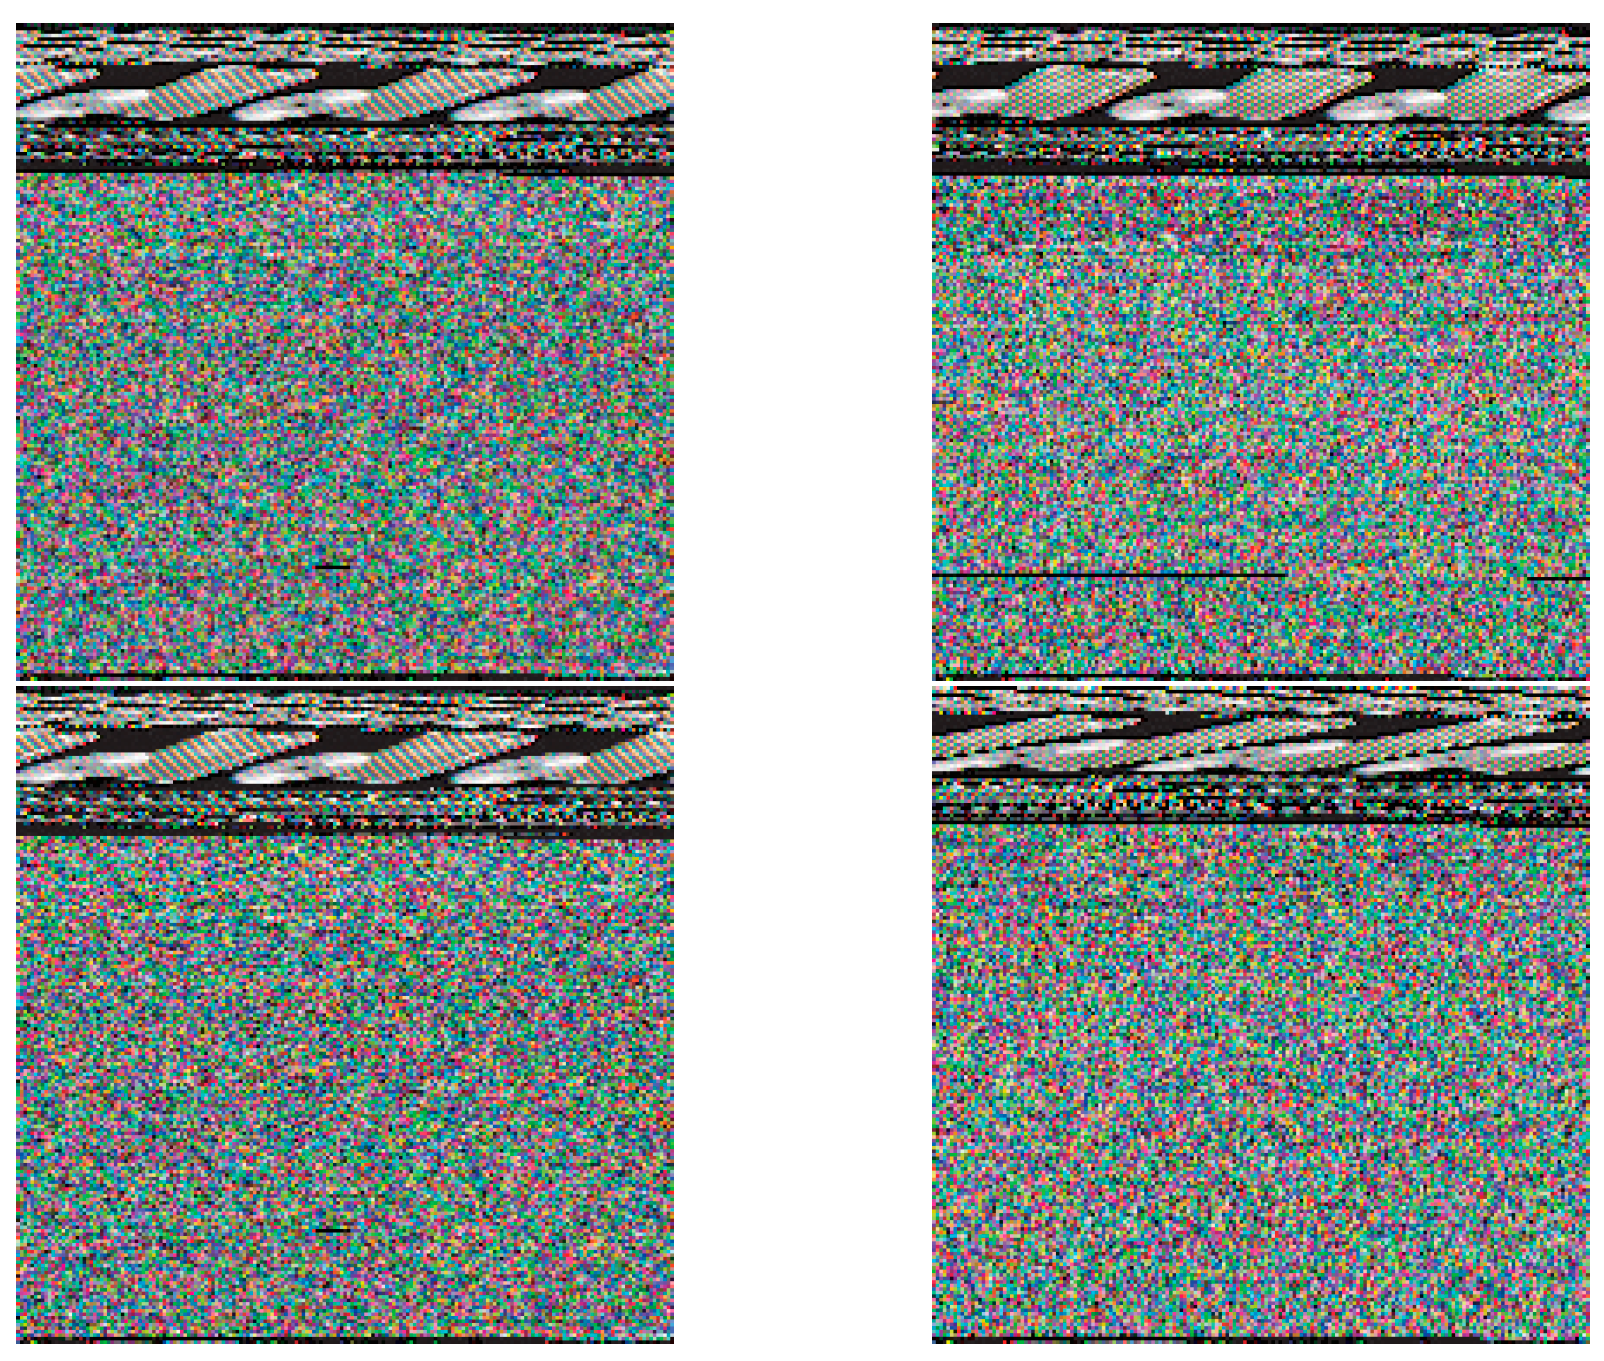
To verify the effectiveness of the features, the traffic is converted into multi-channel images. By observing the texture features of the multi-channel images generated by various malware, it can be found that compared to traditional grayscale images, multi-channel images can better reflect the similarities and differences between dark web traffic.
Figure 8 displays four generated images of the same type of dark web traffic samples, showing high similarity among them.
Figure 9 shows sample instance generation plots of dark web traffic across different categories, demonstrating clear differences between the generated plots for different types of traffic.
4.2. Analysis of Experiment 2 Results—Comparison of Recognition Results from Different-Dimensional CNNs
To verify the accuracy of the network traffic classification system based on the 3D convolutional neural network proposed in this paper, two control groups, 2D-CNN and 1D-CNN, were adopted. The specific structural designs of the experimental group and control groups are detailed in
Section 3.5.1 and
Section 3.5.2, so they will not be repeated here.
Figure 10 shows the classification results of different-dimensional convolutional neural networks. The 3D-CNN proposed in this paper achieves a higher accuracy than 2D-CNN and 1D-CNN networks. This demonstrates that 3D-CNN, through multi-channel image visualization processing, focuses on higher-level image features. Its self-extracted features and time feature extraction can effectively improve classification accuracy, performing better than 2D-CNN which uses grayscale images for classification. 1D-CNN analogizes bytes, frames, data packets, and flows in network traffic to letters, words, sentences, and articles, using text classification methods to classify network traffic. Due to its time-series network traffic data, varying packet lengths may damage some information, resulting in an inferior performance compared to 3D-CNN but slightly better than 2D-CNN using grayscale images. Meanwhile, regardless of the CNN classification method used, all significantly outperform machine-learning classification methods such as RF and SVM. Based on the above analysis, it can be proven that the network traffic classification system proposed in this paper has advantages in classification accuracy.
Table 3 presents more detailed values of Acc, Pre, Rec and F1 for the aforementioned five algorithms, and compares them based on the dimensionality of each algorithm’s data. Among them, since RM and SVM are not convolutional neural networks, they do not involve dimensionality.
For the remaining three algorithms, 2D-CNN uses 2D data, 1D-CNN uses 1D data, and 3D-CNN uses 3D data. In terms of the main characteristics of the data, RM mainly deals with small sample and linearly separable data, SVM data is characterized by high-dimensional data and limited samples, 2D-CNN mainly uses grayscale images, 1D-CNN uses time-series data, while 3D-CNN uses RGB images.
Therefore, the combination of 3D-CNN and multi-channel images can achieve better performance in terms of accuracy, precision, recall, and F1-score.
To more clearly demonstrate the respective contributions of multi-channel image deep learning and 3D-CNN in the dark web traffic classification model, we designed two sets of ablation experiments for comparison. The first experiment uses the 3D-CNN model but does not use multi-channel image learning in preprocessing, instead using grayscale images; the second experiment uses multi-channel image deep learning but does not use 3D-CNN, instead using 2D-CNN.
The experimental results are shown in
Table 4. It can be observed that although the 2D-CNN using multi-channel images performed better than using grayscale images, it still underperformed compared to 3D-CNN, regardless of whether multi-channel learning was used or not, thus verifying the superiority of 3D-CNN. Similarly, when using 3D-CNN models, the performance comparison showed that using multi-channel images was superior to using grayscale images, thereby verifying the advantages of multi-channel images.
4.3. Experimental Results Analysis 3—Network Complexity Evaluation
Table 5 shows the total number of parameters used in the model, the number of parameters in the fully connected layer, and the number of parameters in the feature selection layer for the 3D-CNN network in this paper compared with the control groups of 2D-CNN and 1D-CNN networks. These results indicate that deep learning models can effectively capture complex features in dark web traffic, achieving high-precision classification.
In convolutional neural networks, the main source of parameter quantity is the fully connected layer. Since 3D-CNN focuses on higher-level image features, it designs fewer layers and nodes in the fully connected layer accordingly, resulting in the smallest total parameter quantity. Reducing the number of nodes in the fully connected layer will affect the mapping of output features from the convolutional layer. Therefore, the other two networks have more nodes in the fully connected layer, both more than twice that of 3D-CNN, as shown in
Figure 11.
Regarding the number of feature selection parameters, the 3D-CNN network adopted in this paper has slightly increased feature selection parameters due to its larger neurons and convolution kernels. However, its classification performance is indeed better than that of the 2D-CNN network without extracting temporal features. In comparison with 1D-CNN, 3D-CNN performs better in both accuracy and the number of feature selection parameters, as shown in
Figure 12.
In summary, compared with 1D-CNN, 3D-CNN achieves a higher accuracy with fewer total parameters and fewer feature selection parameters, indicating a significant reduction in computational complexity. Compared with 2D-CNN, while maintaining a comparable number of feature selection parameters, 3D-CNN demonstrates significantly better accuracy with fewer total parameters.
5. Conclusions
Classifying and identifying dark web traffic, and further detecting network attacks or intrusions, to improve network operation efficiency has become an important prerequisite for network management, ensuring network operation, and guaranteeing network security. Existing network traffic classification methods struggle with dark web traffic classification, whether traditional methods based on port numbers and deep packet inspection or machine-learning-based methods using SVM and decision trees, and are not ideal. Although deep learning based on convolutional neural networks and multiple network structure fusion has achieved some results, either by preprocessing traffic data and converting it into 2D grayscale images for classification and detection using 2D-CNN models or treating traffic byte data as characters in natural language to build 1D-CNN models and using document classification techniques in natural language processing for traffic classification, these approaches generally suffer from a weak deep feature extraction ability, overly localized model focus, and insufficient model generalization ability. Dark web traffic classification models need further research and improvement.
To address the above issues, this paper proposes a Darknet traffic identification model based on multi-channel image deep learning and a 3D convolutional neural network. The model first converts Darknet traffic into three-channel color images, adds the time dimension, and forms 3D data as input. This is equivalent to transforming flow data into multi-frame grayscale images in video processing. The model tiles and stitches these frame-by-frame images into a large image, and uses 3D-CNN to learn the features of these large images. Through multi-dimensional feature extraction, data diversity enhancement, and model optimization, the learning efficiency is improved, significantly enhancing the ability to identify complex Darknet traffic.
(1) Data preprocessing based on multi-channel images can provide more distinctive image features compared to grayscale images, offering more feature selection possibilities for distinguishing different types of dark web traffic.
(2) The 3D-CNN combined with image-enhancement technology proposed in this paper provides a new perspective for dark web traffic recognition. By extracting multi-dimensional features and increasing data diversity, the model performance is improved, and the classification performance surpasses those of other dimensional CNNs.
(3) Compared with 1D-CNN, the 3D-CNN proposed in this paper achieves higher accuracy, fewer total parameters, and fewer feature selection parameters, indicating a significant reduction in computational complexity. Compared with 2D-CNN, while ensuring that the number of feature selection parameters does not increase significantly, 3D-CNN achieves significantly better accuracy with fewer total parameters.
However, the 3D-CNN model based on multi-channel image deep learning proposed in this paper also faces a limitation when solving practical problems. This model is very suitable for dark web traffic classification tasks because each type of dark web traffic has a determined training dataset, and the training data is complete. However, in real-world dark web traffic identification tasks, there is often a mix of a large amount of background traffic. How to eliminate the impact of this background traffic and efficiently identify dark web traffic is an important aspect that the model proposed in this paper needs to consider.
Additionally, the measurement of computational complexity for each classification model in this paper is based on the comparison of total parameter quantity and feature selection parameter quantity. Although this method is intuitive, its accuracy needs to be improved. In the future, how to use CPU time to measure model computational complexity is also a question worth exploring.
In the future, further exploration can be conducted to integrate dynamic enhancement strategies and multi-modal fusion techniques to counter stealthy attack behaviors in complex dark web environments.
Author Contributions
J.L.: writing—original draft, visualization, methodology, investigation. Z.P.: supervision, visualization, investigation, suggestions, project administration. K.J.: formal analysis, conceptualization. All authors have read and agreed to the published version of the manuscript.
Funding
This research was funded by the National Natural Science Foundation of China Grant No. 61473149 and No. 62076251 and the Henan Province Young Core Teacher Development Program Project No. 2023GGJS161.
Data Availability Statement
All correspondence and requests for materials should be addressed to ZhiSong Pan.
Acknowledgments
The authors express their gratitude to Yanna Li and Jing Lu for their assistance with the experiments and their valuable discussions.
Conflicts of Interest
The authors declare no conflicts of interest.
References
- Diao, J.; Wei, H.; Zhou, Y.; Diao, Z. A Deep Learning-Based Algorithm for Ceramic Product Defect Detection. Appl. Sci. 2025, 15, 6641. [Google Scholar] [CrossRef]
- Ren, C.; Wang, J.; Zhao, Z. TGAC: Traffic graph adaptive convolutional neural network-based decentralized application encrypted traffic classification. J. Supercomput. 2025, 81, 933. [Google Scholar] [CrossRef]
- Lin, W.; Chen, Y. Robust Network Traffic Classification Based on Information Bottleneck Neural Network. IEEE Access 2024, 12, 150169–150179. [Google Scholar] [CrossRef]
- Luxemburk, J.; Hynek, K. Towards Reusable Models in Traffic Classification. In Proceedings of the 2024 8th Network Traffic Measurement and Analysis Conference (TMA), Dresden, Germany, 21–24 May 2024; pp. 1–4. [Google Scholar] [CrossRef]
- Liu, L.; Yu, H.; Yu, S.; Yu, X. Network Traffic Obfuscation against Traffic Classification. Secur. Commun. Netw. 2022, 2022, 3104392. [Google Scholar] [CrossRef]
- Zhang, X.; Cheng, G.; Zhang, W. Network traffic classification method based on improved deep convolutional neural network. SCI. SIN. Informationis 2021, 51, 56. [Google Scholar] [CrossRef]
- Sadeghzadeh, A.M.; Shiravi, S.; Jalili, R. Adversarial Network Traffic: Towards Evaluating the Robustness of Deep-Learning-Based Network Traffic Classification. IEEE Trans. Netw. Serv. Manag. 2021, 18, 1962–1976. [Google Scholar] [CrossRef]
- Aleisa, M.A. Traffic classification in SDN-based IoT network using two-level fused network with self-adaptive manta ray foraging. Sci. Rep. 2025, 15, 881. [Google Scholar] [CrossRef] [PubMed]
- Ren, X.; Gu, H.; Wei, W. Tree-RNN: Tree structural recurrent neural network for network traffic classification. Expert Syst. Appl. 2021, 167, 114363. [Google Scholar] [CrossRef]
- Shone, N.; Ngoc, T.N.; Phai, V.D. A deep learning approach to network intrusion detection. IEEE Trans. Emerg. Top. Comput. Intell. 2018, 2, 41–50. [Google Scholar] [CrossRef]
- Zhang, L.; Wang, J. Network Traffic Classification Based On A Deep Learning Approach Using NetFlow Data. Comput. J. 2023, 66, 1882–1892. [Google Scholar] [CrossRef]
- Dong, S.; Su, H.; Liu, Y. A-CAVE: Network abnormal traffic detection algorithm based on variational autoencoder. ICT Express 2023, 9, 896–902. [Google Scholar] [CrossRef]
- Karim, F.; Majumdar, S.; Darabi, H. Multivariate LSTM-FCNs for time series classification. Neural Netw. 2019, 116, 237–245. [Google Scholar] [CrossRef]
- Li, J.; Pan, Z. Network Traffic Classification Based on Deep Learning. KSII Trans. Internet Inf. Syst. 2020, 14, 4246–4267. [Google Scholar] [CrossRef]
- Adelipour, S.; Haeri, M. Privacy-Preserving Model Predictive Control Using Secure Multi-Party Computation. In Proceedings of the 2023 31st International Conference on Electrical Engineering (ICEE), Tehran, Iran, 9–11 May 2023; pp. 915–919. [Google Scholar] [CrossRef]
- Ishizawa, R.; Sato, H.; Takadama, K. From Multipoint Search to Multiarea Search: Novelty-Based Multi-Objectivization for Unbounded Search Space Optimization. In Proceedings of the 2024 IEEE Congress on Evolutionary Computation (CEC), Yokohama, Japan, 30 June–5 July 2024; pp. 1–8. [Google Scholar] [CrossRef]
- Xiang, B.; Zhang, J.; Deng, Y.; Dai, Y. Fast Blind Rotation for Bootstrapping FHEs. In Advances in Cryptology—CRYPTO 2023; LNCS; Springer: Cham, Switzerland, 2023; Volume 14084, pp. 3–36. [Google Scholar] [CrossRef]
- Li, X.; Xu, L.; Zhang, H.; Xu, Q. Differential Privacy Preservation for Graph Auto-Encoders: A Novel Anonymous Graph Publishing Model. Neurocomputing 2023, 521, 113–125. [Google Scholar] [CrossRef]
- Hu, Y.J.; Tian, J.; Ma, J. A Novel Way to Generate Adversarial Network Traffic Samples against Network Traffic Classification. Wirel. Commun. Mob. Comput. 2021, 2021, 7367107. [Google Scholar] [CrossRef]
- Shiraly, D.; Eslami, Z.; Pakniat, N. Hierarchical Identity-Based Authenticated Encryption with Keyword Search over encrypted cloud data. J. Cloud Comput. 2024, 13, 112. [Google Scholar] [CrossRef]
- Wen, D.; Li, Y.; Lau, F.C.M. Byzantine-Resilient Online Federated Learning with Applications to Network Traffic Classification. IEEE Netw. 2023, 37, 145–152. [Google Scholar] [CrossRef]
- Kim, K. An Effective Anomaly Detection Approach based on Hybrid Unsupervised Learning Technologies in NIDS. KSII Trans. Internet Inf. Syst. 2024, 18, 494–510. [Google Scholar] [CrossRef]
- Sun, G.; Liang, L.; Chen, T.; Xiao, F.; Lang, F. Network traffic classification based on transfer learning. Comput. Electr. Eng. 2018, 69, 920–927. [Google Scholar] [CrossRef]
- Cooper, D.A.; Apon, D.C.; Dang, Q.H.; Davidson, M.S.; Dworkin, M.J.; Miller, C.A. Recommendation for Stateful Hash-Based Signature Schemes; NIST Special Publication 800-208; NIST: Gaithersburg, MD, USA, 2024. [Google Scholar] [CrossRef]
- Sheikh, A.; Singh, K.U.; Jain, A.; Chauhan, J.; Singh, T.; Raja, L. Lightweight Symmetric Key Encryption to Improve the Efficiency and Safety of the IoT. In Proceedings of the 2024 IEEE International Conference on Contemporary Computing and Communications (InC4), Bangalore, India, 15–16 March 2024; pp. 1–5. [Google Scholar] [CrossRef]
- Chakraborty, I.; Kelley, B.M.; Gallagher, B. Industrial control system device classification using network traffic features and neural network embeddings. Array 2021, 12, 100081. [Google Scholar] [CrossRef]
- Shaw, S.; Dutta, R. Post-quantum secure compact deterministic wallets from isogeny-based signatures with rerandomized keys. Theor. Comput. Sci. 2025, 1035, 115–127. [Google Scholar] [CrossRef]
- Gurpur, S.; Deshpande, V.; John, M.; Moholkar, K.; Gandhi, Y. Post-Quantum Cryptography: Preparing for the Quantum Threat. Comput. Fraud Secur. 2024, 2024, 114–122. [Google Scholar] [CrossRef]
- Su, T.; Wang, J.; Hu, W.; Dong, G.; Gwanggil, J. Abnormal traffic detection for internet of things based on an improved residual network. Comput. Mater. Contin. 2024, 79, 4433–4448. [Google Scholar] [CrossRef]
- Luxemburk, J.; Hynek, K.; Čejka, T. Encrypted traffic classification: The QUIC case. In Proceedings of the 2023 7th Network Traffic Measurement and Analysis Conference (TMA), Naples, Italy, 26–29 June 2023; pp. 1–10. [Google Scholar] [CrossRef]
- Izadi, S.; Ahmadi, M.; Nikbazm, R. Network traffic classification using convolutional neural network and ant-lion optimization. Comput. Electr. Eng. 2022, 101, 108024. [Google Scholar] [CrossRef]
- Yang, J. The Application of Deep Learning for Network Traffic Classification. Highlights Sci. Eng. Technol. 2023, 39, 979–984. [Google Scholar] [CrossRef]
| Disclaimer/Publisher’s Note: The statements, opinions and data contained in all publications are solely those of the individual author(s) and contributor(s) and not of MDPI and/or the editor(s). MDPI and/or the editor(s) disclaim responsibility for any injury to people or property resulting from any ideas, methods, instructions or products referred to in the content. |
© 2025 by the authors. Licensee MDPI, Basel, Switzerland. This article is an open access article distributed under the terms and conditions of the Creative Commons Attribution (CC BY) license (https://creativecommons.org/licenses/by/4.0/).


