Article

Performance Evaluation and QoS Optimization of Routing Protocols in Vehicular Communication Networks Under Delay-Sensitive Conditions

by
Alaa Kamal Yousif Dafhalla
1,
Hiba Mohanad Isam
2,
Amira Elsir Tayfour Ahmed
3,
Ikhlas Saad Ahmed
4,
Lutfieh S. Alhomed
5,
Amel Mohamed essaket Zahou
4,
Fawzia Awad Elhassan Ali
4,
Duria Mohammed Ibrahim Zayan
6,
Mohamed Elshaikh Elobaid
7 and
Tijjani Adam
7,8,9,*
1
Department of Computer Engineering, College of Computer Science and Engineering, University of Hail, Hail 55476, Saudi Arabia
2
Department of Communications Technical Engineering, Al-Farahidi University, Baghdad I10091, Iraq
3
Department of Information System, College of Science & Arts, King Khalid University, Mohyel Asser 62521, Saudi Arabia
4
Computer Department Applied College, Imam Abdulrahman Bin Faisal University, Dammam 31441, Saudi Arabia
5
Department of Information and Computer Science, College of Computer Science and Engineering, University of Hail, Hail 55476, Saudi Arabia
6
Department of Computer Science, Applied College, University of Najran, Najran 61441, Saudi Arabia
7
Faculty of Electronic Engineering & Technology, Universiti Malaysia Perlis, Arau 02600, Perlis, Malaysia
8
Micro System Technology, Centre of Excellence (CoE), Universiti Malaysia Perlis (UniMAP), Arau 02600, Perlis, Malaysia
9
Institute of Nano Electronic Engineering, Universiti Malaysia Perlis, Kangar 01000, Perlis, Malaysia
*
Author to whom correspondence should be addressed.
Computers 2025, 14(7), 285; https://doi.org/10.3390/computers14070285
Submission received: 14 June 2025 / Revised: 12 July 2025 / Accepted: 14 July 2025 / Published: 17 July 2025
(This article belongs to the Special Issue Application of Deep Learning to Internet of Things Systems)

Abstract

Vehicular Communication Networks (VCNs) are essential to intelligent transportation systems, where real-time data exchange between vehicles and infrastructure supports safety, efficiency, and automation. However, achieving high Quality of Service (QoS)—especially under delay-sensitive conditions—remains a major challenge due to the high mobility and dynamic topology of vehicular environments. While some efforts have explored routing protocol optimization, few have systematically compared multiple optimization approaches tailored to distinct traffic and delay conditions. This study addresses this gap by evaluating and enhancing two widely used routing protocols, QOS-AODV and GPSR, through their improved versions, CM-QOS-AODV and CM-GPSR. Two distinct optimization models are proposed: the Traffic-Oriented Model (TOM), designed to handle variable and high-traffic conditions, and the Delay-Efficient Model (DEM), focused on reducing latency for time-critical scenarios. Performance was evaluated using key QoS metrics: throughput (rate of successful data delivery), packet delivery ratio (PDR) (percentage of successfully delivered packets), and end-to-end delay (latency between sender and receiver). Simulation results reveal that TOM-optimized protocols achieve up to 10% higher PDR, maintain throughput above 0.40 Mbps, and reduce delay to as low as 0.01 s, making them suitable for applications such as collision avoidance and emergency alerts. DEM-based variants offer balanced, moderate improvements, making them better suited for general-purpose VCN applications. These findings underscore the importance of traffic- and delay-aware protocol design in developing robust, QoS-compliant vehicular communication systems.

1. Introduction

The rapid increase in the number of vehicles on the road in recent years has led to severe traffic congestion and a corresponding rise in transportation-related accidents. These challenges have become a major concern for governmental and transportation authorities worldwide [1,2]. Expanding road infrastructure is no longer a practical solution due to growing land constraints and the escalating costs of construction and maintenance [3,4]. In response to these limitations, Vehicular Communication Networks (VCNs) have emerged as a promising alternative, attracting significant attention from governments, industries, and the research community [5]. VCNs enable real-time communication and data exchange between vehicles, aiming to reduce traffic incidents, enhance road safety, and improve overall traffic efficiency while also supporting infotainment services [6]. According to the United States Department of Transportation (USDOT), such intelligent vehicular systems have the potential to reduce road collisions by up to 82% through timely warnings and improved situational awareness. Key safety functionalities provided by VCNs include intersection collision alerts, emergency vehicle proximity warnings, road condition updates, and post-crash analysis systems [7]. The architecture of VCNs is typically composed of two core components: Roadside Units (RSUs) and On-Board Units (OBUs). These components are embedded with smart communication and positioning systems that allow vehicles to exchange information and support intelligent decision-making in real time [8]. Communication in VCNs takes place across three major types: Vehicle-to-Vehicle (V2V), Vehicle-to-Infrastructure (V2I), and Infrastructure-to-Infrastructure (I2I) links. These modes are illustrated in Figure 1, offering a holistic view of the VCN communication framework [9]. The communication mechanisms within VCNs are standardized through two primary technologies: Dedicated Short-Range Communication (DSRC) and Wireless Access in Vehicular Environments (WAVE). The U.S. Federal Communications Commission (FCC) has reserved 75 MHz of spectrum in the 5.9 GHz band specifically for DSRC, which operates under the IEEE 802.11p protocol standard [10]. Additionally, IEEE has introduced a comprehensive six-layer protocol stack in the 1906.1 draft, referred to as WAVE, which defines the communication architecture and functionalities necessary for robust VCN operations [10]. Recent studies have made significant strides in addressing the challenges of stochastic routing in dynamic transportation networks, which are particularly relevant to Vehicular Ad Hoc Networks (VANETs). One such study proposes a pre-routing framework that simulates traffic demand variations over discrete time slots, maintaining temporary network equilibrium [11]. Through offline learning across 24,000 demand scenarios, it estimates expected path times and reliability, ultimately selecting a small set of Pareto-optimal paths from thousands of candidates. This multi-objective approach balances efficiency and robustness and is scalable to large networks, making it well-suited for VANET environments. Complementing this, another study introduces a data-driven routing framework that integrates traffic sensor data augmentation and deep learning techniques to improve route reliability and traffic state observability. It includes components such as stochastic traffic assignment, multi-objective route generation, optimal sensor placement, and a Stacked Sparse Auto-Encoder (SAE) for inferring unobserved link flows [12]. This method addresses the gap between limited sensor infrastructure and full network awareness, offering a cost-effective and scalable solution for real-time vehicle routing. Together, these works lay a strong foundation for next-generation VANET routing protocols that leverage probabilistic modeling, optimization, and machine learning to improve performance under uncertainty.
Despite the promising capabilities of VCNs, the WAVE standard still faces several critical research challenges. These stem primarily from the unique characteristics of vehicular networks, including their highly dynamic topology and the predictable yet fast-changing mobility patterns of vehicles [11,13]. Additionally, VCNs inherit several limitations from traditional Mobile Ad Hoc Networks (MANETs), such as unstable wireless links and multi-hop communication issues under varying densities and conditions [14,15]. This study focuses on addressing the dynamic nature of VANET topologies and the need for robust routing protocols that can adapt to diverse and rapidly changing environments. In real-world scenarios, vehicles frequently travel across different network zones (e.g., from urban areas to highways), encountering significant shifts in node density, mobility patterns, and signal propagation conditions [16]. These variations pose major challenges in ensuring consistent routing performance. A protocol that performs well in a dense city environment may experience significant degradation in a sparse highway scenario due to disrupted link connectivity and increased path failure rates [17,18]. While many existing VANET routing protocols are tailored for specific scenarios—urban grids, highways, or intersections—few studies have addressed the design of routing protocols that are adaptable across multiple mobility and topological conditions [19]. To bridge this gap, we propose a systematic optimization approach, referred to as the Chameleon Method, which offers real-time adaptability and efficiency in uncertain, multi-scenario environments. Just as a chameleon dynamically changes its skin color to match its surroundings, our method dynamically tunes routing parameters in response to traffic and topology variations. This approach is coupled with a statistical Design of Experiments (DOE) technique to ensure rigorous, data-driven optimization. The proposed Chameleon Method is integrated into two widely studied VANET routing protocols: Quality of Service-enabled Ad Hoc On-Demand Distance Vector (QOS-AODV) and Greedy Perimeter Stateless Routing (GPSR). Moreover, this integration aims to enhance their adaptability, stability, and QoS performance across both city and highway environments—addressing a critical gap in current VCN protocol design. In this study, we present a robust parameter optimization framework designed to enhance the performance of QOS-AODV and GPSR routing protocols in Vehicular Ad Hoc Networks (VANETs). The framework integrates two tailored optimization profiles: the Traffic-Oriented Model (TOM), which prioritizes throughput and packet delivery, and the Delay-Efficient Model (DEM), which aims to balance delay and reliability. Distinct from prior approaches, our methodology employs a Taguchi-based statistical optimization technique for efficient tuning of protocol parameters. This data-driven approach ensures that the routing protocols are optimally configured under varying network conditions. Furthermore, the optimized protocols are validated through simulation in both urban and highway scenarios, capturing the dynamic topology and traffic fluctuations typical of real-world vehicular networks. The results demonstrate significant performance improvements in packet delivery ratio (PDR), throughput, and end-to-end delay, underscoring the novelty and practical relevance of the proposed models within the VANET research landscape.
Figure 2 presents a taxonomy of VANET routing protocols, categorized based on their core design strategies and awareness mechanisms. The protocols are grouped into five primary categories: Greedy Stateless, Infrastructure-Assisted, Street-Aware, Connectivity-Aware, and baseline protocols. Greedy Stateless protocols (e.g., CBF, GRAMT, GPCR, and AGF) rely on local geographic forwarding without maintaining route state, offering low overhead but limited adaptability in sparse or complex topologies [20]. Infrastructure-Assisted protocols such as SADV and IGRP incorporate fixed Roadside Units to enhance routing stability, particularly in urban settings. Street-Aware protocols (SAR, GSR, TO-GO, and GPDRJ+) utilize road map and city topology information to guide forwarding decisions. Connectivity-Aware protocols are further divided into statistical (A-STAR, GYTAR, and VADD) and real-time (MURU, RBVT, and CAR) subtypes, aiming to improve route reliability based on predicted or real-time link quality [21]. Foundational protocols like GPSR and AODV serve as baselines, from which many specialized protocols are derived. The interconnecting arrows in the diagram represent how newer protocols build upon or enhance existing ones, reflecting the evolution of routing strategies in response to VANET-specific challenges [21]. The manuscript consists of methods where all the techniques, tools, and procedures are presented. The following sections, Methodology, Results and Discussion, Conclusions, and References, are presented, along with Supplementary Materials (Figures S1–S30 and Tables S1–S6) that describe the detailed and comprehensive methodology.

2. Materials and Methods

This study employs a systematic experimental approach to evaluate the performance of four routing protocols, QOS-AODV, GPSR, CM-QOS-AODV, and CM-GPSR, under varying traffic generation conditions in a Vehicular Ad Hoc Network (VANET) environment [20]. The VANET scenarios are based on the roads of Changlun City. Changlun City is a medium-sized city located in the northern region of Malaysia and crossed by the Northern Malaysian Highway. The road situation in Changlun is a city with an inner road crossed by a highway. Thus, the experiments were conducted in a controlled simulation setting using a network simulator based on OMNeT++, which allows for the creation of a hybrid VANET scenario. Parameters like node density, mobility patterns, and network topology are meticulously defined to ensure that the simulations accurately reflect real-world conditions. The standard implementations of QOS-AODV and GPSR are enhanced with Traffic-Oriented (TOM) and Delay-Efficient (DEM) optimization profiles. These profiles adjust the routing parameters to optimize for throughput and packet delivery ratio (PDR) while minimizing delay. The TOM profile focuses specifically on enhancing throughput, whereas the DEM profile seeks a balance between throughput, PDR, and delay, enabling a comparative analysis of their effectiveness in different scenarios. Traffic generation is configured using burst applications, where nodes generate packets directed toward specific destinations. The volume of traffic is controlled through adjustable time intervals between packet transmissions. Different traffic loads are systematically tested to assess the impact on protocol performance, with scenarios including low, medium, and high traffic conditions. The Chameleon Method is an adaptive tuning strategy designed to dynamically adjust routing protocol parameters based on real-time traffic conditions and network delay. It monitors traffic density and end-to-end delay to determine whether to maintain default settings or switch to optimized profiles. Under light traffic, baseline parameters are retained; in moderate traffic, parameters are adjusted to balance delay and throughput; and in high-density scenarios, the method activates either the Delay-Efficient Model (DEM) to minimize delay and improve PDR or the Throughput-Oriented Model (TOM) if high throughput is prioritized. This adaptive logic ensures robust protocol performance in both urban and highway VANET environments. This approach allows for a robust examination of how varying traffic generations affect the routing protocols’ efficiencies. To ensure a comprehensive evaluation, the Taguchi method is employed in the experimental design [22]. This statistical approach optimizes performance by systematically varying multiple factors and analyzing their interactions. The Taguchi method aids in determining the optimal combination of traffic generation parameters that maximizes throughput, minimizes delay, and improves PDR across the evaluated protocols. By employing this methodology, this study not only identifies significant performance metrics but also provides insights into the most influential factors affecting the routing protocols in VCNs. The collected data is analyzed to identify trends and patterns in performance across the different protocols and configurations. Statistical methods are employed to determine the significance of observed differences in performance metrics, ensuring the reliability and accuracy of the results, as shown in Figure 2. By following this method, this study aims to provide comprehensive insights into the performance dynamics of the routing protocols in the context of VCNs, ultimately guiding future research and protocol development. The Taguchi Optimization Method (TOM) was used to measure the effects of a routing protocol’s parameters on the VANET performances. This was achieved by performing the delta analysis of the control factors mechanism in TOM and finding the optimum values for a set of routing protocol parameters that obtain the highest performance in two VANET scenarios (highway and city). The process of TOM involves four steps: problem definition, experiment design, analysis, and verification. Figure 3 depicts these steps and their sub-processes.
The first optimization problem is stated as follows: For the highway scenario, find a set of values for the inner parameters (MAX-JITTER, HELLO-INTERVVAL, and ACTIVE-ROUTE-TIMEOUT) of the QOS-AODV protocols that minimize the delay. Then, this problem is defined as follows:
J k = J ( h 1 ,   h 2 , h 3 )
In Equation (1), J k is the outcome (delay) of experiment k, where the inner parameters of the QOS-AODV values are set to h1, h2, and h3. The inner parameters are then called control factors, and they are tested on a set of experiments (k = 0, 1, …, M). For each experiment k, a control factor h is set to a specific value ( h k , n ), where k is the experiment number and n is the value of the parameter h. Then Equation (1) is as follows:
J k , n = J ( x k , n ,   y k , n , z k , n )
where ( x , y , z ) k , n is the value n of the inner parameter in experiment k; J is the optimization goal (e.g., delay). Based on Equation (2), the optimization problem can be defined as follows: find a set of values (xd,yd,zd “desired values”) that contribute to the best value of the output J. TOM defines this problem in a process diagram (P-Diagram) as shown in Figure 4. In the P-Diagram, a noise factor is added to the problem and refers to any uncontrollable parameters that affect the output, such as the traffic generated by vehicles and the speed of vehicles on the road.
TOM is a single objective optimization mechanism. The desired values of the control factors are obtained to optimize one output at a time. To obtain the desired values, TOM defines three loss functions (LF) to either minimize (LFsmaller-the-better), maximize (LFlarger-the-better), or normalize (LFnominal-the-best) the output. Here, three outputs are defined for the optimization (minimizes delay, maximizes throughput, and PDR). Accordingly, LFsmaller-the-better (Equation (3)) is used for delay optimization, and LFlarger-the-better (Equation (4)) is used for both throughput and PDR optimization.
L F s m a l l e r t h e b e t t e r = 10 l o g l o g   J 2 N  
L F l a r g e r t h e b e t t e r = 10 l o g l o g   1 J 2 N  
TOM is an experimental base optimization method. In other words, TOM analyzes the output of a set of experiments to obtain the desired values of the control factors. The purpose of the experiments is to test the effect of predefined levels for each of the control factors on the target output. The experiment design starts by defining n levels for each control factor. Further, these levels are used as experimental settings for a set of experiments conducted in this thesis by simulation. The Orthogonal Array (OA) method is used to design the required test experiments. In factorial design experiments, the number of experiments required to perform this process is the product of the number of factors and the number of levels for each factor. Given that each factor is affected by noise, the number of test experiments is multiplied by noise levels, and each experiment is iterated to achieve a level of certainty. For example, for k control parameters with n levels. The number of test experiments required is (k × n × (number of noise levels × number of iterations). To reduce the number of test experiments, TOM adopted the Orthogonal Array (OA) design of experiments method. OA is a statistical method for testing the combination of pairs in a way that presents an evenly distributed depth of each pair’s values. For example, to test the effect of MAX_JITTTER, only three levels are used for the testing if OA is used; however, in factorial testing, all possible values of MAX_JITTER should be tested. OA is selected based on a number of factors and levels. For the optimization problem in Equation (2), there are three factors and three levels for each factor. The factor levels are selected as the maximum and minimum allowed values of the routing parameters, and one intermediate value. These values are presented in Table 1 and Table 2 for QOS-AODV and GPSR sequentially. The OA is denoted as L k N m , where k is the number of experiments in the design, N is the number of levels, and m is the number of factors. In this study, the jitter levels of 0.1 s, 0.5 s, and 1.0 s were selected based on commonly adopted practices in VANET simulation environments (e.g., NS-2/NS-3) and align with the timing coordination principles outlined in IEEE 1609.4. Although the standard does not prescribe exact jitter values, it supports multi-channel operations where jitter is used to reduce broadcast collisions. These values are consistent with the DSRC layered architecture and reflect realistic network timing behaviors [23].
In this study, the parameters MAX_JITTER, ACTIVE_ROUTE_TIMEOUT, and HELLO_INTERVAL were specifically selected for optimization due to their critical influence on the performance of reactive routing protocols in VANET environments. MAX_JITTER introduces a randomized delay before the transmission of control packets such as Route Requests or Hello messages, helping to prevent broadcast collisions in dense or dynamic networks. ACTIVE_ROUTE_TIMEOUT determines how long an unused route remains in the routing table before expiring, thereby affecting the freshness of route information and the frequency of route rediscovery processes [24]. HELLO_INTERVAL governs how frequently nodes send Hello messages to monitor link connectivity, directly impacting the protocol’s ability to respond to topology changes caused by high mobility [25]. These parameters are consistently highlighted in the VANET literature as key factors influencing packet delivery, end-to-end delay, and overall protocol robustness. The design and modeling of the Configuration Model (CM) involve the integration of Taguchi and Differential Evolution optimization techniques with the AODV and GPSR protocols, which are implemented using the INET 3.5 framework within the OMNeT++ simulation environment. The proposed optimization-based models are evaluated through realistic VANET simulations in both highway and urban scenarios, utilizing a detailed Changlun City map to reflect real-world mobility patterns.
To evaluate the performance of the proposed routing protocol variants, the following key Quality of Service (QoS) metrics were used: Packet delivery ratio (PDR): PDR is defined as the ratio of the number of data packets successfully received by the destination nodes to the total number of packets generated by the source nodes. It reflects the reliability of the protocol in ensuring successful data delivery. End-to-End Delay: This metric measures the average time a data packet takes to travel from the source node to the destination node. It includes delays due to route discovery, queuing, transmission, and propagation. Lower delay values indicate better performance, especially for real-time and safety-critical applications. Throughput indicates the rate of successful data transmission over the network, which is typically expressed in bits per second (bps) or megabits per second (Mbps). It is a measure of the overall efficiency and capacity of the routing protocol under different traffic loads. The complete open-source code for both optimization algorithms, along with the simulation models for highway and city scenarios and the Changulun mobility setup, is provided in the Supplementary Materials attached to the revised manuscript. Moreover, we included a comprehensive Supplementary Materials spanning 56 pages, which contains in-depth explanations, algorithmic flowcharts, pseudocode, parameter definitions, and the underlying modeling logic used in our proposed framework. Readers can refer to the Supplementary Materials for complete details supporting the reproducibility and transparency of our methodology.
This study is designed based on the OA ( L 9 3 3 ) method. For the similarity between control factors and their level, in this work, two OA tables are used for QOS-AODV and GPSR optimization and presented in Table 3 and Table 4 sequentially. For each optimization problem, a set of 9 experiments was conducted, and each experiment was repeated for different random seed generations. The random seed generation represents the noise factors in Taguchi design, and hence, a minimum of 5 repetitions per experiment were applied. In this study, the L9(33) Orthogonal Array was chosen to balance experimental efficiency and statistical reliability. While a full factorial design would require 27 runs, the L9 design reduces this to 9, significantly lowering computational cost while still capturing the main effects of three factors at three levels. The L9 array ensures orthogonality, enabling unbiased comparison of factor levels, and supports robust optimization through the use of signal-to-noise (S/N) ratios. This approach is widely accepted in engineering and network performance studies for its ability to efficiently screen variables and assess performance trends. Given the exploratory nature of this work, the L9 design is appropriate for identifying key performance influences without the overhead of exhaustive experimentation.
The experimental design of the TOM (Taguchi Orthogonal Method) is structured to evaluate specific output targets, namely Throughput, delay, and packet delivery ratio (PDR), which were analyzed during the TOM analysis phase. The experimental results were collected from multiple trials to facilitate the calculation of objective functions. In this study, the OMNET++ simulator and INET3.5 protocol stack were employed to conduct the experiments with the VEINS for mapping the city to a simulation scenario as presented in our previous publications [23,26]. The TOM method outlines two primary analysis goals. The first is to assess the impact of control factors on the output, which is achieved through delta analysis of the loss function. The second goal is to determine the optimal configuration of control factors for a given output. This is carried out by identifying the highest average signal-to-noise ratio (SNR) corresponding to a specific level of the control factor. Thus, in analyzing the effect of control factors on delay in QOS-AODV protocols under a city scenario, the experimental results are presented in Table 5. Each experiment was repeated for five trials, with the average delay values recorded in columns T1 through T5. The initial step is to apply the “smaller-the-better” loss function (LF) for each experiment. Subsequently, the average SNR of the loss function is calculated for each level of a control factor.
To evaluate the protocol’s performance under increasing node density and traffic volumes to assess its robustness in high-density VANET scenarios, we employed the BAHG simulation. The Backbone-Assisted Hop Greedy (BAHG) protocol is a position-based routing approach designed to enhance routing efficiency in urban VANET environments by minimizing the number of intermediate intersections along a communication path. BAHG operates using a reactive strategy to first determine the destination’s position and then establish a route over selected intersections using designated backbone nodes. These backbone nodes, which form a superset of coordinator nodes, are classified into three types: stable, primary, and secondary. Stable backbones are vehicles that remain stationary near intersections during red traffic signals and are prioritized for their reliability. Primary and secondary backbones are dynamically chosen from moving vehicles crossing the intersection when the signal turns green. This structured categorization ensures consistent path stability and facilitates efficient routing across urban grids.

3. Results and Discussion

3.1. The Evaluation of the Performance of CM-QOS-AODV, CM-GPSR, QOS-AODV, and GPSR Protocols

The evaluation of the performance of CM-QOS-AODV, CM-GPSR, QOS-AODV, and GPSR protocols in terms of throughput, delay, and packet delivery ratio (PDR) is presented in this section. These performance metrics were assessed under varying conditions, including different traffic generation rates, packet sizes, mobility speeds, and pause times. The comparative analysis was conducted within a hybrid Vehicular Ad Hoc Network (VANET) scenario. This series of experiments aims to compare the performance of CM-QOS-AODV, CM-GPSR, QOS-AODV, and GPSR protocols under varying traffic generation conditions. The evaluation focuses on throughput, packet delivery ratio (PDR), and delay to assess the protocols’ efficiency. The primary goal was to examine how different traffic generation rates impact the performance of CM-QOS-AODV and CM-GPSR and to compare their efficiencies with those of QOS-AODV and GPSR. Traffic generation follows a burst application model, where traffic is directed toward a destination, which then responds to the source node. The generated traffic is controlled by adjusting the time interval between consecutive packets. Table 6 details the amount of traffic generated by a node for the time intervals used in these experiments.

3.2. Throughput Comparison

In this study, we analyzed the impact of varying traffic generation rates on the throughput performance of four routing protocols: CM-QOS-AODV, CM-GPSR, QOS-AODV, and GPSR. The evaluation focused on the influence of two optimization profiles: the Throughput Optimized Method (TOM) and the Delay and PDR Enhanced Method (DEM). As illustrated in Figure 5, the throughput of all protocols increased proportionally with higher traffic generation rates, which aligns with expectations since greater traffic loads tend to better utilize available network capacity [11]. Figure 5a demonstrates that both QOS-AODV and GPSR protocols equipped with TOM achieved superior throughput compared to their DEM counterparts and their respective baseline versions. Specifically, QOS-AODV with TOM achieved a peak throughput exceeding 0.45 Mbps, whereas QOS-AODV with DEM showed slightly lower performance, remaining just under 0.4 Mbps [23]. This performance gap highlights TOM’s effectiveness in maximizing throughput, while also indicating that DEM’s additional focus on delay and packet delivery ratio (PDR) can introduce trade-offs that marginally hinder throughput. Similarly, Figure 5b shows that GPSR with TOM achieved the highest throughput relative to both DEM-based GPSR and the baseline GPSR. Notably, TOM’s impact was more pronounced on GPSR than on QOS-AODV [20]. The throughput improvement for QOS-AODV with TOM was approximately 0.08 Mbps, whereas GPSR with TOM outperformed the baseline GPSR by 0.17 Mbps at a 0.11 s interval. This disparity suggests that the GPSR protocol may be inherently more responsive to throughput-specific enhancements introduced by TOM. These findings are consistent with earlier studies that emphasize the importance of optimization strategies in improving protocol throughput under high-traffic conditions [27]. Overall, our results underscore the effectiveness of TOM in enhancing throughput in Vehicular Communication Networks (VCNs), particularly in scenarios where real-time performance is critical. On the other hand, while DEM offers benefits in reducing delay and improving PDR, it entails a trade-off in throughput performance. This analysis contributes to a deeper understanding of the balance between throughput, delay, and reliability in VCN routing and supports the adoption of adaptive optimization strategies based on specific application requirements.

3.3. Packet Delivery Ratio Comparison

The results presented in 
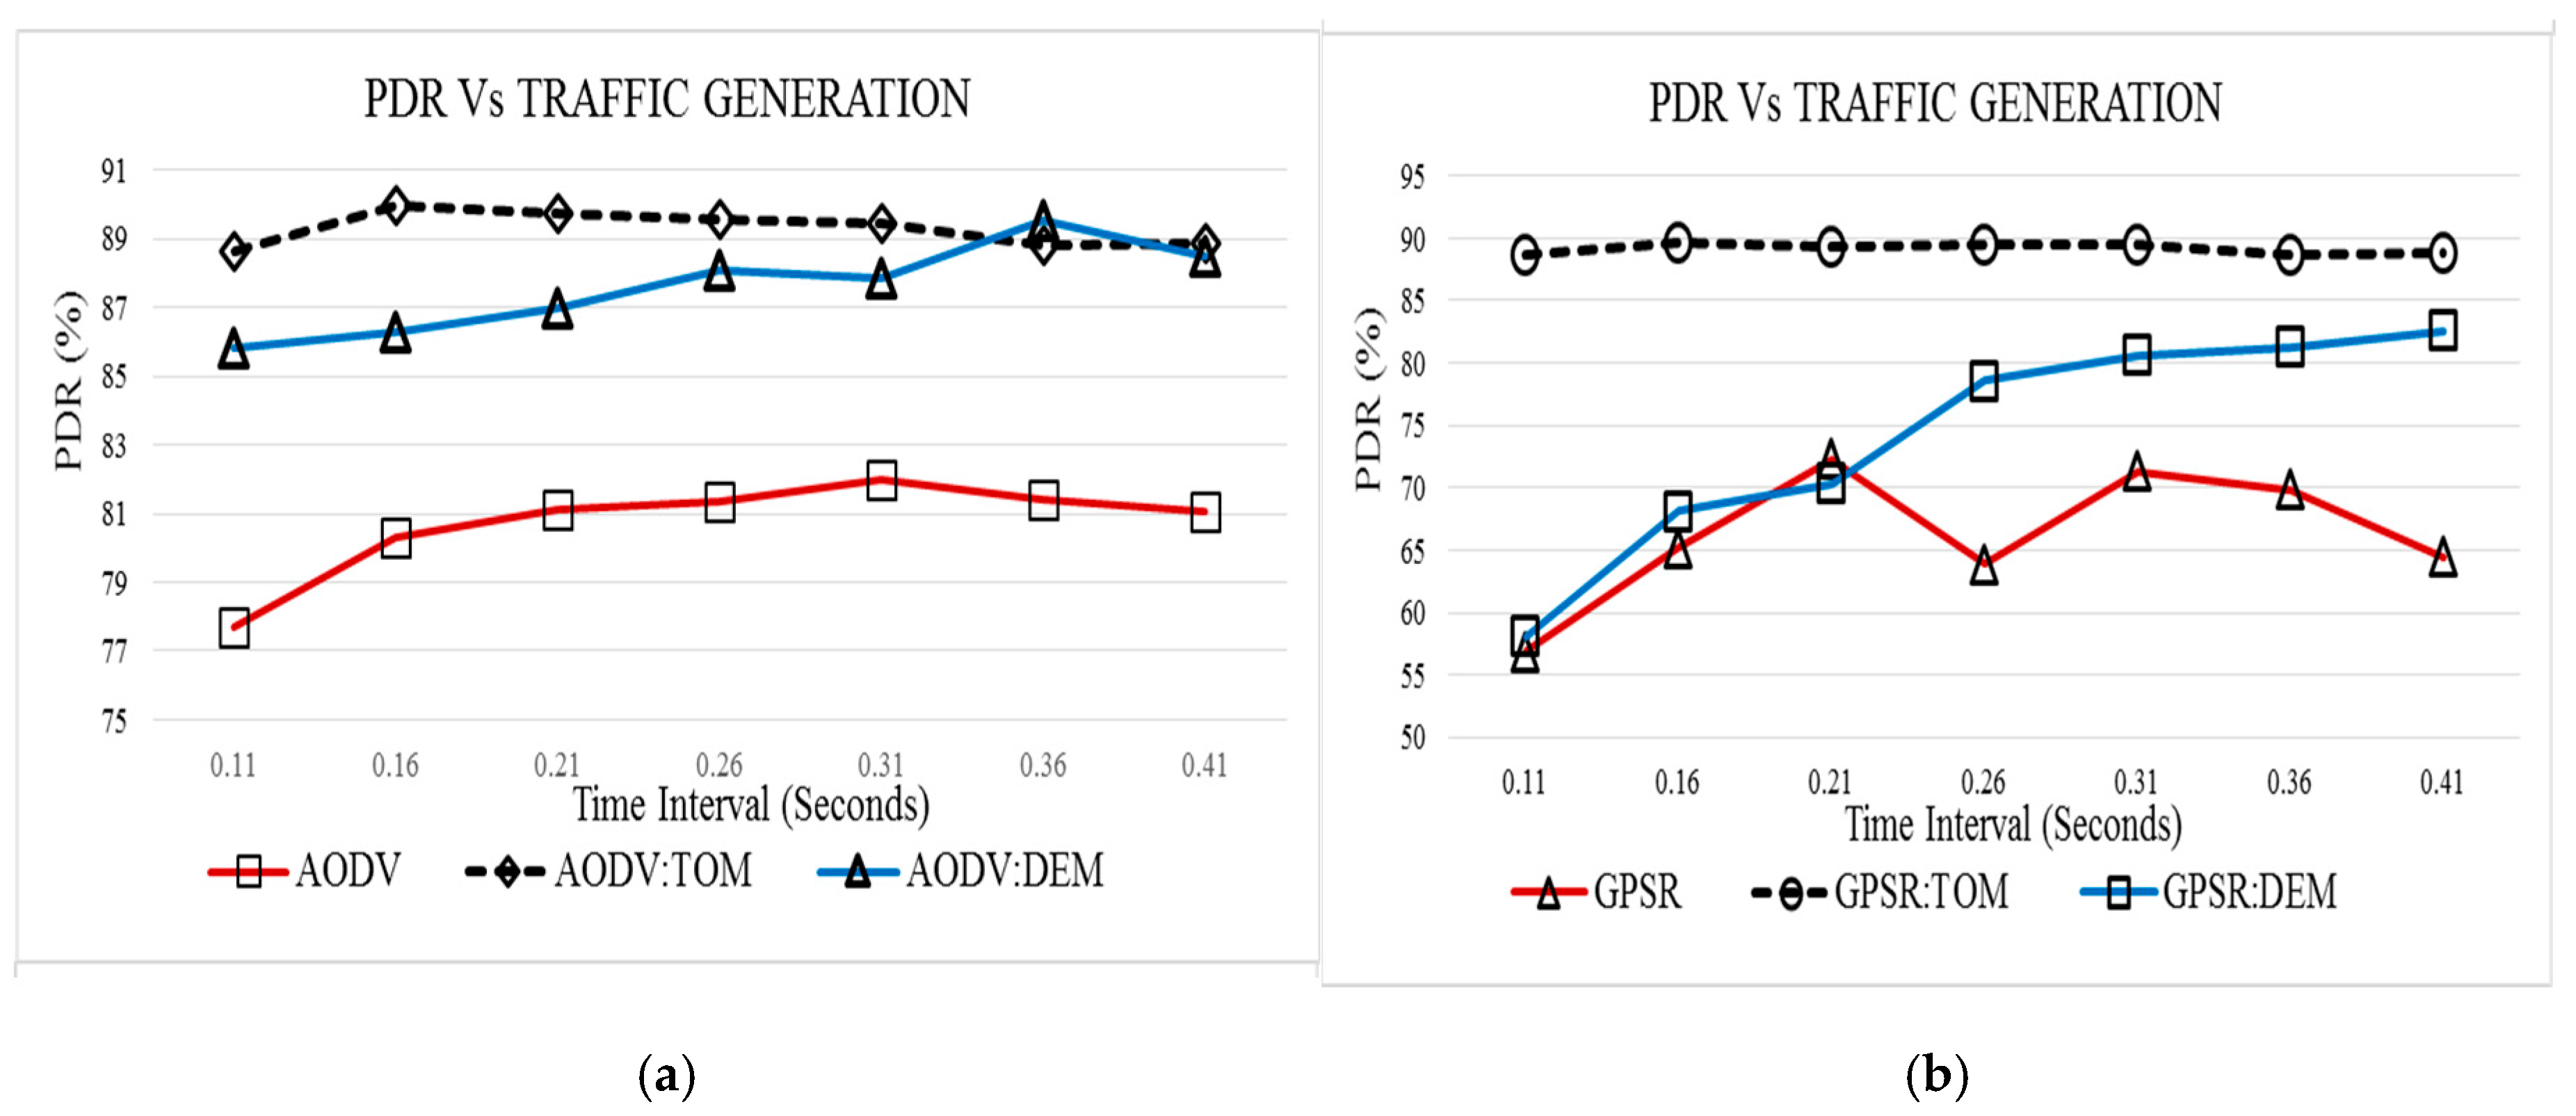
Figure 6 offer a detailed comparison of the packet delivery ratio (PDR) achieved by QOS-AODV, GPSR, CM-QOS-AODV, and CM-GPSR under varying traffic generation rates. As shown in Figure 6a, both QOS-AODV and GPSR, when configured with the TOM (Throughput Optimized Method) profile, maintain high average PDR values around 89%, indicating strong reliability in packet delivery. In contrast, their baseline counterparts—QOS-AODV and GPSR without any optimization—consistently perform below 83%, showing weaker resilience under dynamic traffic conditions [15]. A key observation from these results is that both TOM and DEM (the Delay and PDR Enhanced Method) profiles significantly enhance PDR compared to their unoptimized versions, achieving approximately a 10% average improvement. Notably, the TOM profile exhibits outstanding robustness against increasing traffic, maintaining a relatively stable PDR across all traffic generation rates [16]. This stability suggests that TOM effectively tunes routing parameters to prioritize reliable data transmission, making it particularly suitable for dynamic Vehicular Communication Networks (VCNs) where traffic loads fluctuate frequently. In contrast, Figure 6b reveals that while the DEM profile also improves upon the baseline, it shows greater sensitivity to increasing traffic loads. For instance, GPSR with the DEM profile experiences a noticeable decline in PDR as traffic generation intensifies. This degradation highlights a core trade-off within DEM’s design: by attempting to balance multiple performance metrics (PDR, throughput, and delay), DEM sacrifices some degree of consistency in any single metric, particularly under stress conditions such as high traffic volumes. Further analysis suggests that TOM’s single-objective optimization—specifically targeting PDR—results in more consistent and reliable packet delivery, particularly in high-traffic environments where communication reliability is critical [17]. In contrast, DEM’s multi-objective approach, while beneficial in achieving broader performance improvements, results in a less focused optimization for PDR alone. Consequently, although DEM outperforms the baseline protocols, it falls short of the PDR levels achieved by TOM. This comparison between TOM and DEM underscores the strategic value of targeted optimization in vehicular network routing. TOM’s consistent performance under varying conditions highlights its robustness and suitability for delay-sensitive, high-reliability applications. Meanwhile, DEM’s performance variability reinforces the importance of carefully aligning optimization strategies with specific application requirements and network dynamics in VCNs [17].
TOM’s strong emphasis on PDR makes it particularly well-suited for applications where reliable packet delivery is critical, such as safety-critical systems or real-time data transmissions in Vehicular Communication Networks (VCNs). In contrast, DEM’s trade-offs are more appropriate for scenarios that require a balanced performance across multiple metrics, including throughput and latency, rather than prioritizing packet delivery alone. The results suggest that TOM is the preferred choice for high-throughput, delay-sensitive applications where maintaining high PDR is non-negotiable [18]. Conversely, DEM may be better suited for networks with more flexible PDR requirements but a stronger need to balance overall network efficiency and delay constraints. In conclusion, the findings from Figure 6 clearly illustrate the superior performance of the TOM profile in optimizing PDR for both QOS-AODV and GPSR protocols. TOM consistently outperforms DEM and the baseline configurations, maintaining stable and high PDR even under fluctuating traffic conditions. Although DEM improves upon the unoptimized protocols, its performance is more vulnerable to increased traffic, particularly in the case of GPSR [19]. These observations reinforce the importance of aligning protocol optimization strategies with the specific performance priorities of the network environment, whether the goal is maximizing reliability (PDR), minimizing latency, improving throughput, or achieving a balanced trade-off. Moreover, the insights gained from this study contribute to the broader understanding of control parameter tuning in wireless networks, with promising implications for enhancing the reliability and efficiency of urban vehicular communication systems [20].

3.4. Average Delay Comparison

Figure 7 shows the average delay of QOS-AODV, GPSR, CM-QOS-AODV, and CM-GPSR across varying traffic generation rates, providing insights into each protocol’s ability to handle network delays under different traffic loads. Among all protocols, GPSR achieved the lowest delay, averaging 0.01 s, highlighting its efficiency in maintaining low latency even as traffic increases to the worst-case scenario up to 95%. QOS-AODV also performed well, with an average delay below 0.025 s. These results suggest that the TOM profile in both protocols is effective in optimizing not only throughput and PDR but also minimizing delay, making it suitable for time-sensitive applications within Vehicular Communication Networks (VCNs), Figure 7a. A notable observation is the contrasting behavior of the protocols in relation to traffic generation. For GPSR, delay increased proportionally with higher traffic generation, indicating that these profiles become less efficient as traffic loads rise. This is likely due to congestion in the routing process, where higher traffic leads to longer packet queuing times and slower delivery. On the other hand, QOS-AODV displayed an inverse relationship between traffic generation and delay, suggesting that as traffic increased, QOS-AODV became more efficient in handling packets, possibly due to its reactive nature, which allows it to adapt dynamically to changing network conditions. QOS-AODV, while still improving over the baseline QOS-AODV, exhibited performance that was more stable across different traffic loads but could not achieve the low delays observed in TOM profiles. The delay consistency observed in GPSR, QOS-AODV, and QOS-AODV is an important indicator of their robustness to fluctuations in traffic generation, as shown in Figure 7b. Despite varying levels of traffic, these profiles managed to keep the delay within a narrow range of around 0.01 s, indicating that they are well-optimized for maintaining low and stable latency under different traffic conditions up to 95% worst case. This robustness is critical in VANET environments, where traffic loads can vary dramatically due to the movement of vehicles and the changing density of network nodes. The ability to maintain low delays ensures more timely communication, which is essential for applications requiring rapid data exchange, such as collision avoidance systems or real-time traffic management. In conclusion, the analysis of average delay across different protocols and traffic generation rates highlights the superior performance of TOM profiles, particularly GPSR, in minimizing delay. The consistently low delay observed in both TOM and QOS-AODV profiles demonstrates their adaptability and robustness in handling various traffic loads. However, the proportional increase in delay observed in GPSR and the baseline GPSR points to the challenges these protocols face in high-traffic environments. This suggests that while TOM profiles are well-suited for delay-sensitive applications in VCNs, further optimization may be needed for GPSR to improve its performance under heavier traffic loads.

3.5. Comparison Between the Average Throughputs for PDR and Delay Obtained Against Traffic Generations and Packet Sizes

The throughput comparison in Figure 8 shows that QOS-AODV-TOM and GPSR-TOM achieve the highest throughput under all traffic generation intervals, outperforming their respective baseline protocols (QOS-AODV and GPSR). QOS-AODV-TOM consistently performs above 0.40 Mbps, while GPSR-TOM surpasses 0.47 Mbps at higher traffic loads. This demonstrates the efficiency of TOM profiles in optimizing network parameters for better data transmission performance. TOM’s optimization focus on throughput helps maintain a steady flow of data even as traffic increases, minimizing packet loss and network congestion. QOS-AODV-DEM and GPSR-DEM, though improved compared to their baseline versions, still show a slight decrease in throughput compared to TOM profiles. This is likely due to DEM’s consideration of multiple factors (PDR, delay, and throughput), which may slightly compromise the throughput to improve overall performance balance. In comparison with the recent literature, throughput optimization techniques like TOM show considerable advancements in routing protocol efficiency for Vehicular Communication Networks (VCNs). Studies, such as those by Ref. [21], emphasize the importance of throughput in VCNs due to the high mobility and dynamic topology of nodes. Protocols that emphasize throughput, like TOM, are highly desirable for real-time applications like collision avoidance and traffic management. The improvements seen with TOM profiles align with the trends observed in hybrid protocols like those discussed by Ref. [22], where hybrid routing techniques were employed to maintain high data rates in challenging VANET environments. The results here reinforce that optimized profiles significantly enhance throughput without compromising other performance metrics.
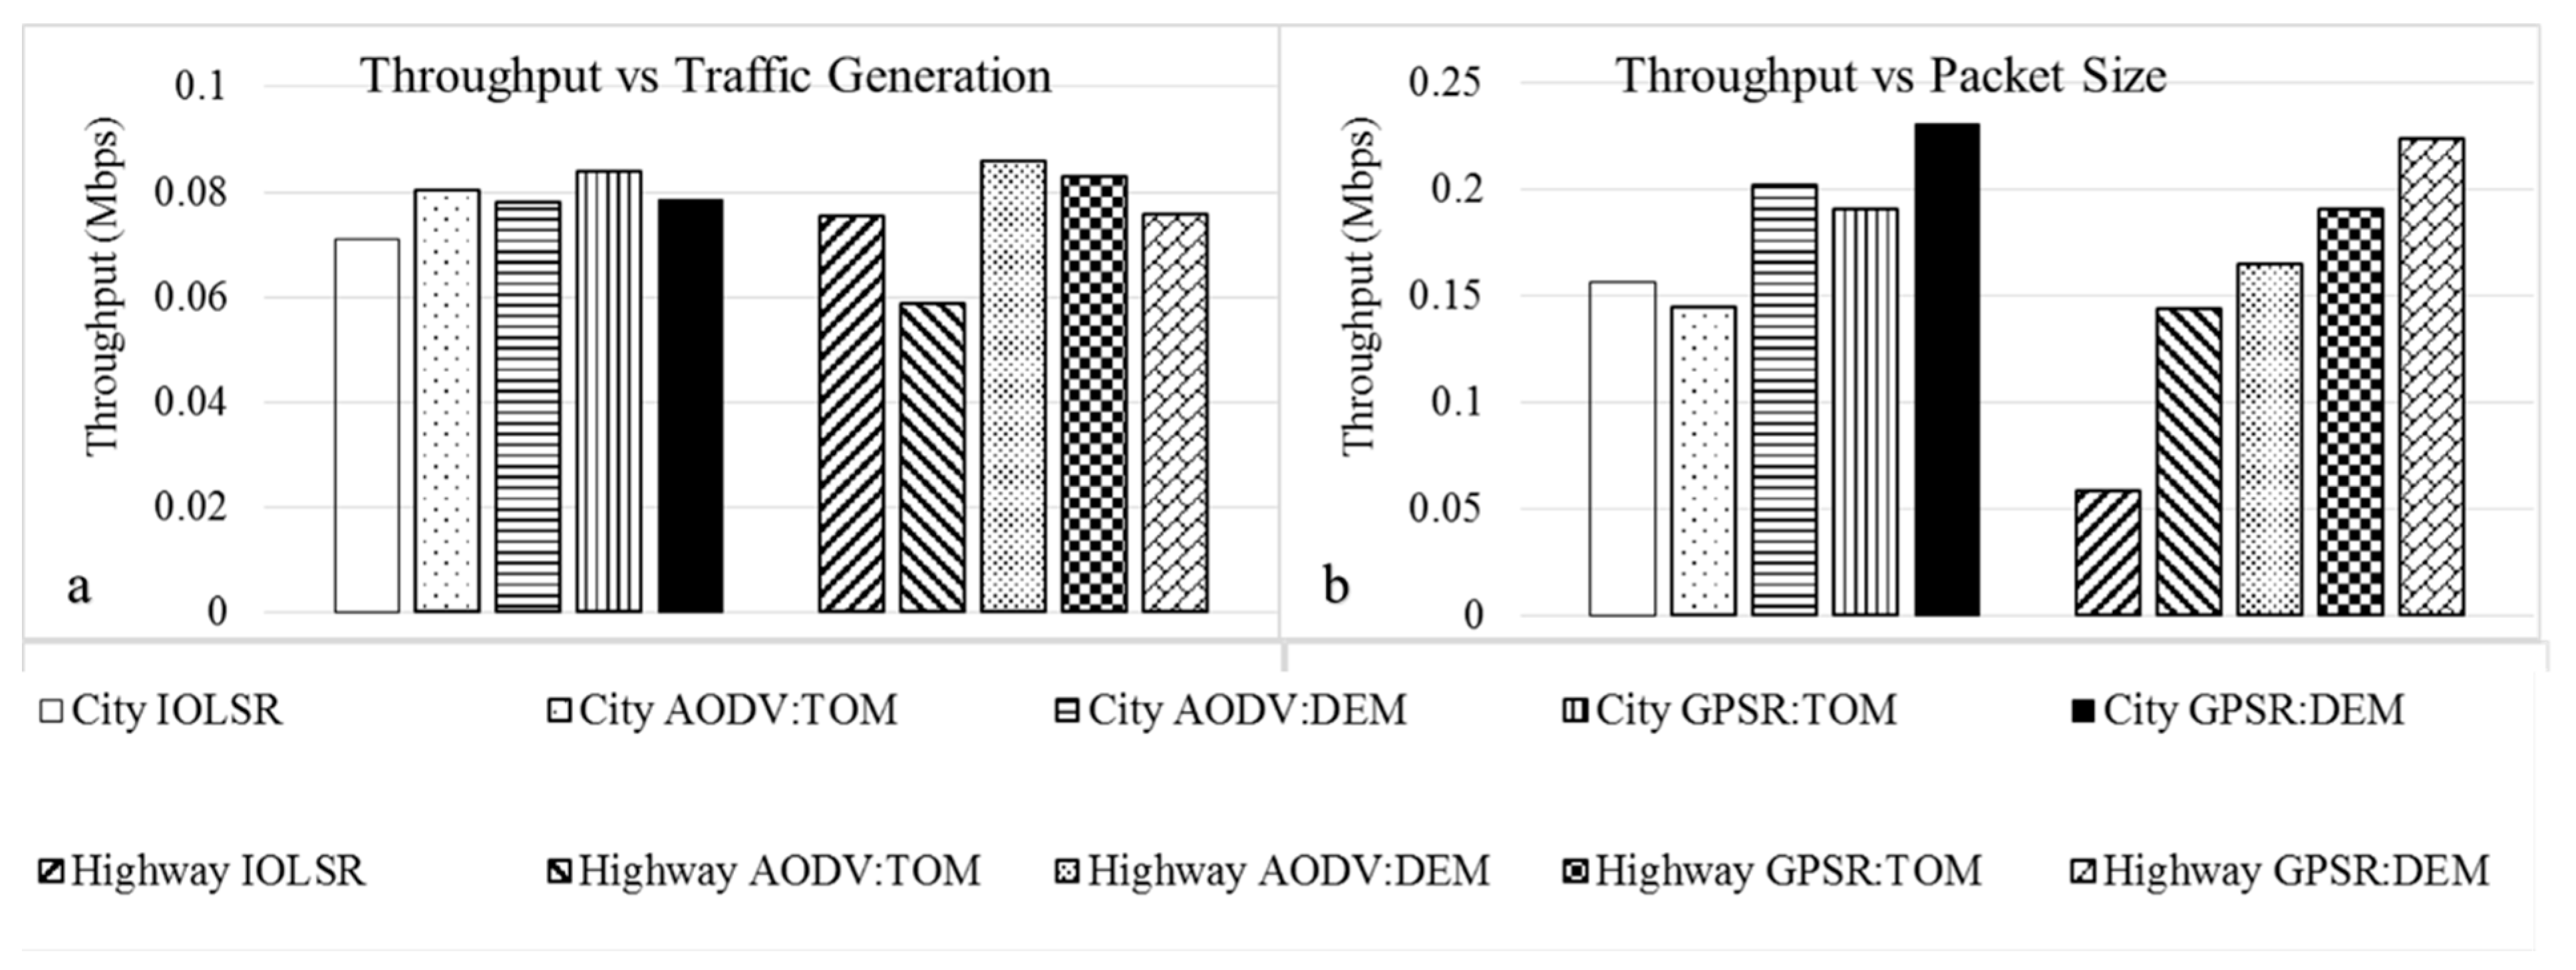
As mentioned above, Figure 9 presents a comprehensive comparison of the average throughputs observed in three different protocols: CM-QOS-AODV, CM-QOS-AODV, and IOLSR in both city and highway scenarios. Throughput is a key performance metric that indicates how effectively a network protocol delivers data over a communication channel by comparing the performance of these protocols in various conditions, such as traffic generation and packet size. In terms of traffic generation, all three protocols, CM-QOS-AODV, CM-QOS-AODV, and IOLSR, show relatively consistent performance, with their throughputs ranging between 0.06 and 0.08 Mbps. This narrow range suggests that the protocols exhibit similar efficiency in handling traffic under varying load conditions, regardless of the city or highway environment. Such close throughput values imply that none of the protocols have a distinct advantage over the others when subjected to moderate traffic conditions. However, the observation that the throughput values for all protocols remain within a relatively narrow range may be attributed to the overall low traffic conditions or the balanced distribution of network load across protocols during the evaluation. To further assess the scalability and robustness of these protocols, future work should incorporate high-traffic scenarios or targeted stress tests to evaluate performance under more demanding network conditions. When analyzing the impact of varying packet sizes, the protocols generally exhibit throughput values ranging between 0.15 and 0.25 Mbps, with the notable exception of IOLSR in the highway scenario, where throughput significantly declines. This decline underscores the limitations of proactive routing protocols like IOLSR in dynamic and rapidly changing environments, such as highways [21]. Proactive protocols continuously update routing tables to maintain a complete view of the network topology, which introduces substantial overhead. In high-mobility scenarios, this overhead becomes increasingly burdensome due to frequent topology changes caused by fast-moving vehicles, resulting in degraded throughput performance. In contrast, reactive protocols such as CM-QOS-AODV demonstrate greater adaptability in such environments. Rather than maintaining constant routing information, these protocols discover routes only when needed, minimizing unnecessary overhead and better coping with dynamic topology shifts [22]. This on-demand nature makes reactive protocols particularly suitable for high-mobility vehicular scenarios, where rapid adaptability and reduced control message overhead are essential for maintaining reliable communication.
Figure 9 provides an in-depth comparison of the packet delivery ratio (PDR) for the routing protocols CM-QOS-AODV, CM-GPSR, and IOLSR in city and highway environments across different design metrics, such as traffic generation and packet sizes. The PDR is a critical performance metric in network protocols, representing the percentage of data packets successfully delivered to the destination relative to the number of packets sent. A higher PDR indicates a more reliable network protocol in ensuring data is transmitted successfully despite network challenges. CM-QOS-AODV vs. CM-QOS-AODV: Figure 8a reveals that CM-QOS-AODV performed better in highway environments than in the city, except when subjected to varying traffic generation. This finding indicates that CM-QOS-AODV, which is likely a time-based optimized version of QOS-AODV, is more suited to dynamic and high-mobility environments like highways. This could be due to its reactive nature, where routes are discovered and maintained only when required, making it agile in responding to frequent topology changes that occur in high-mobility scenarios such as highways. However, the performance of CM-QOS-AODV in city environments, though slightly lower than on highways, remains commendable and may still be effective in lower-mobility scenarios with stable network links. On the other hand, CM-QOS-AODV shows only a small difference in average PDR between city and highway scenarios, suggesting that it handles both environments with relatively similar efficiency. This consistency could be due to its underlying design, which might focus on balancing performance across varied network conditions. The stable performance in both environments indicates that CM-QOS-AODV is versatile, making it suitable for applications that need to function reliably in both urban and highway conditions without significant protocol modifications. CM-GPSR: The CM-GPSR protocol stands out by consistently achieving a PDR above 90% across all scenarios, including both city and highway environments. This impressive performance highlights CM-GPSR ‘s capability to effectively route packets in both environments, which can be attributed to the geographical positioning system (GPSR) nature of the protocol, which is optimized for time-based metrics. Its reliance on location-based routing enables it to quickly identify the best routes in a dynamically changing network, such as highways, while still maintaining high PDR in less dynamic city networks. The performance follows a similar trend, although it is more efficient in the highway environment than in the city. The highway’s less dense network and fewer obstacles might allow CM-GPSR to better exploit its location-based routing, leading to more efficient packet forwarding and higher PDR. In contrast, the city’s more congested network topology could introduce more interference, leading to slightly reduced performance. IOLSR Performance: The IOLSR protocol, which follows a proactive routing approach, managed to achieve an average PDR above 80% in city environments for all scenarios except for high-mobility conditions. This indicates that IOLSR functions effectively when the network topology is relatively stable, as in a typical city scenario with moderate or low mobility. However, as mobility increases, the protocol’s performance degrades, which is expected because IOLSR maintains routes continuously, and frequent changes in topology (due to mobility) require constant updates, leading to increased overhead and potential delays in routing adjustments. In highway environments, IOLSR performs slightly better than in the city, managing to achieve more than 80% PDR across all scenarios, including high-mobility situations. This somewhat improved performance in highways can be attributed to the lower density of nodes, which reduces the frequency of route updates. Although IOLSR maintains routes proactively, the reduced complexity in highway environments might alleviate some of the burdens typically associated with proactive routing, allowing it to maintain reasonably high PDR. Comparative Analysis: In comparing all the protocols across different scenarios, CM-QOS-AODV and CM-GPSR consistently outperformed IOLSR across all scenarios. This result highlights the superior adaptability of reactive and geographical routing protocols in diverse environments. CM-QOS-AODV variants (both TOM and DEM) demonstrate strong performance in handling dynamic network conditions, especially in highways, where reactive protocols excel in managing frequent route changes without the overhead of maintaining continuous route tables. Similarly, CM-GPSR’s reliance on location-based information allows it to maintain highly efficient routing in both city and highway environments, making it one of the top-performing protocols in terms of PDR. Interestingly, IOLSR does outperform CM-GPSR in terms of PDR, which suggests that IOLSR can still be a competitive choice under certain conditions. The proactive nature of IOLSR gives it an advantage in situations where maintaining continuous routes is beneficial, particularly in environments with less mobility and fewer topological changes. However, as the environment becomes more dynamic (as in high-mobility scenarios), IOLSR’s performance drops compared to the reactive and geographical protocols. The analysis of Figure 9 reveals clear distinctions between the routing protocols in terms of their PDR in both city and highway environments. CM-QOS-AODV, CM-QOS-AODV, and CM-GPSR consistently show superior performance, especially in dynamic environments like highways, where their adaptability allows them to handle frequent route changes effectively. IOLSR, while maintaining a reasonable PDR, struggles in high-mobility scenarios due to its proactive nature, though it still performs well in more stable environments. The overall conclusion from these observations is that reactive and geographically optimized protocols are better suited for networks with high mobility, while proactive protocols like IOLSR may still hold an advantage in environments where network topology remains relatively constant.
Figure 10 offers a detailed comparison of the average delays observed for the CM-QOS-AODV, CM-GPSR, and IOLSR protocols across different scenarios, such as traffic generation, packet sizes, pause times, and mobility. Delay is a crucial performance metric in networking, referring to the time taken for a packet to travel from the source to the destination. Lower delays are generally preferred, as they indicate faster communication within the network. The IOLSR protocol consistently achieves the lowest delay across all scenarios, a result that can be attributed to its proactive routing behavior. In IOLSR, routes are continuously maintained and updated, ensuring that there is no need to search for a new route when packets are ready for transmission. This allows for immediate packet forwarding, reducing delay. The proactive nature of IOLSR is especially effective in environments with low mobility, where the network topology remains relatively stable. This protocol’s ability to maintain pre-established routes allows it to quickly adapt to network conditions, thereby minimizing latency even in high-traffic situations up to 95% in the worst-case scenario. The highest observed average delay for IOLSR is 0.06 s, which was observed in the mobility comparison scenario. This relatively low delay, even in high-mobility situations, underscores the protocol’s robustness. However, the slight increase in delay in mobility scenarios indicates that even proactive routing protocols are affected by frequent topology changes, although less so than reactive protocols. CM-QOS-AODV performance among the CM profiles: CM-QOS-AODV demonstrates superior performance in reducing delays in high-mobility scenarios. This outcome reflects the advantages of reactive routing protocols like CM-QOS-AODV in dynamically changing environments such as highways. In reactive protocols, routes are discovered only when needed, which allows for greater flexibility in high-mobility scenarios where network topology frequently changes. In such environments, CM-QOS-AODV can adapt more efficiently, establishing new routes quickly after route breaks, thereby keeping delays lower compared to other protocols. However, CM-QOS-AODV has the highest delay in traffic generation scenarios, which suggests that the protocol struggles when the network experiences heavy traffic loads. The reason could be the overhead associated with route discovery in reactive protocols, which causes delays when the demand for route establishment increases. CM-GPSR’s delay behavior exhibits the highest delay for varying packet sizes and pause times, indicating that its performance is less efficient when dealing with changes in these network parameters. The GPSR protocol relies on the geographic location of nodes for routing decisions. While this approach can be efficient in many cases, it may not handle packet size variations well, leading to higher delays when the network conditions change significantly. For example, when the packet size increases or nodes experience extended pauses, CM-GPSR struggles to maintain optimal performance, resulting in higher delays compared to other protocols. In contrast, CM-GPSR performs better in mobility scenarios, maintaining delay variations within a small range between city and highway environments. This outcome suggests that the location-based nature of GPSR makes it more resilient to changes in node mobility, allowing it to maintain stable performance across varying mobility conditions. CM-QOS-AODV’s balanced delay performance maintains its delay observations between 0.03 and 0.04 s across all scenarios, indicating a balanced and consistent performance. This time-optimized version of QOS-AODV performs well across different network conditions, balancing the need for route discovery with minimizing delay. The uniformity in its performance suggests that CM-QOS-AODV handles dynamic and static network conditions similarly, making it a reliable choice for environments that experience a mix of traffic patterns, packet sizes, and mobility levels. Traffic Generation and Delay: One of the key observations is that the average delay for all compared protocols varies below 0.01 s against different traffic generation scenarios. This outcome indicates that traffic generation does not significantly impact the delay performance of the protocols. It suggests that all protocols, regardless of their reactive or proactive nature, are well-equipped to handle varying amounts of network traffic without introducing significant delays. The efficiency in handling traffic generation can be a result of optimized packet queuing and routing mechanisms, which prevent excessive delays even when the network is experiencing heavy traffic. Mobility and Delay: The mobility comparison in Figure 10a highlights the significant effect of mobility on network delay. Based on the current results, in the worst case, when mobility increases, the network topology changes more frequently, leading to higher chances of route failures and the need for repeated route rediscovery. CM-QOS-AODV, being a reactive protocol, is better equipped to handle these dynamic changes, as it initiates route discovery only when necessary. IOLSR, despite its proactive nature, also performs relatively well but exhibits slight increases in delay under high-mobility conditions, as maintaining up-to-date routes becomes more challenging with frequent topology changes. The analysis of Figure 10 highlights the distinct delay characteristics of the evaluated routing protocols under various network conditions. IOLSR, leveraging its proactive routing mechanism, consistently achieves the lowest delay, making it well-suited for low-mobility environments with stable topologies. In contrast, CM-QOS-AODV exhibits strong performance in dynamic, high-mobility scenarios, benefiting from its reactive routing design that adapts effectively to frequent topology changes. CM-GPSR shows mixed results—while it handles mobility well due to its geographic routing approach, it struggles with variations in packet size and pause times. Notably, CM-QOS-AODV maintains consistent delay performance across all tested scenarios, indicating its robustness and adaptability to diverse traffic patterns and mobility levels. Overall, protocol selection should align with the specific network context: IOLSR for stable, low-mobility networks; CM-QOS-AODV for highly dynamic environments; and CM-GPSR for cases where geographic awareness enhances routing efficiency.
The PDR comparison presented in Table 7 and Table 8 demonstrate that the TOM-optimized profiles (QOS-AODV-TOM and GPSR-TOM) consistently achieved the highest packet delivery ratios, maintaining values around 89% across varying traffic generation rates. This stability underscores TOM’s effectiveness in adapting to changing network conditions without compromising delivery reliability. In contrast, the baseline QOS-AODV and GPSR protocols show a noticeable decline in PDR, dropping below 83% as traffic intensity increases. While the DEM profiles offer a clear improvement over their respective baselines, they still fall short of the high reliability achieved by TOM. This is primarily due to DEM’s multi-metric focus, which balances throughput, delay, and PDR, leading to only modest gains in delivery performance. These findings are consistent with recent studies, such as Ref. [22], which emphasize the benefits of targeted optimization strategies in improving PDR under dynamic VANET conditions, where protocols optimized for PDR, such as TOM, show superior performance in dynamic environments like VCNs. Based on the current results, with packet loss conditions, TOM’s optimization focus on throughput helps maintain a steady flow of data even as traffic increases, thereby minimizing packet loss and reducing network congestion. The ability of TOM profiles to maintain high PDR even with fluctuating traffic generation makes it a favorable choice for environments with high variability in node mobility and data flow. Furthermore, the DEM profiles’ slightly reduced PDR due to balancing with other metric findings in research on robust parameter optimization protocols, as seen in Ref. [28].
In Table 9, the average delay results indicate that GPSR-TOM achieves the lowest delay across all traffic generations, with an average of 0.01 s. QOS-AODV-TOM follows closely, maintaining delays below 0.025 s. The consistently low delay achieved by TOM profiles highlights their efficiency in reducing packet transmission time, making them highly suitable for delay-sensitive applications. In contrast, GPSR and GPSR-DEM show a proportional increase in delay with higher traffic generation, likely due to congestion and routing inefficiencies under higher network load. QOS-AODV demonstrates an inverse relationship with traffic generation, showing slightly improved delay performance as traffic increases, although it still lags behind TOM profiles. The performance of TOM in minimizing delay aligns with findings in the recent literature on low-latency routing protocols in VCNs. Studies like those by Ref. [29] demonstrate that optimizing for delay in highly dynamic environments can significantly improve real-time data transmission, especially in scenarios requiring rapid response times, such as vehicular safety applications. The low delay observed in TOM profiles makes it comparable to other optimized protocols like QoS-Aware Multipath Routing (QAMR) mentioned by Ref. [30], which also focuses on reducing latency in the worst-case scenario up to 95%. DEM’s moderate performance in delay is a result of its balancing approach, which, while improving over the baseline protocols, cannot achieve the same low delays as TOM due to its multi-parameter optimization strategy.

3.6. General Comparison and Impact on Applications

Overall, the comparison between TOM and DEM profiles across all three performance metrics—throughput, PDR, and delay—demonstrates the clear advantages of using TOM-optimized protocols in dynamic environments such as VCNs. TOM’s focus on specific performance metrics (throughput and PDR) ensures high data transmission efficiency and reliability, making it highly suitable for applications where these parameters are critical, such as real-time video streaming, safety alerts, and autonomous vehicle coordination. DEM, on the other hand, while improving over the baseline protocols, provides a balanced approach by considering multiple performance aspects, making it suitable for applications where a trade-off between delay, throughput, and PDR is acceptable. Comparing these findings with the latest research, the optimization methods used in TOM profiles align with recent advancements in hybrid routing protocols for VCNs, which focus on improving specific performance metrics for specialized applications. The performance improvements seen with TOM and DEM profiles echo the results found in studies such as those by Refs. [31,32], where hybrid routing techniques are employed to optimize VANET communications. In conclusion, TOM profiles offer superior performance in terms of throughput, PDR, and delay, making them ideal for critical real-time applications, while DEM profiles provide a well-rounded solution for general-purpose VANET applications where multiple performance metrics need to be considered simultaneously [23,26]. We employed the BAHG simulation to evaluate the protocol’s performance under increasing node density and traffic volumes to assess its robustness in high-density VANET scenarios [24,25]. The simulation of BAHG on a realistic urban map demonstrated its effectiveness compared to existing intersection-based protocols such as GPCR and GyTAR [27,33]. The results showed that BAHG significantly reduced end-to-end delay by up to 85% compared to GPCR and 70% compared to GyTAR [12]. In terms of packet delivery ratio (PDR), BAHG achieved improvements of 50% over GPCR and 30% over GyTAR, highlighting its superior reliability and throughput [34,35]. These performance gains can be attributed to BAHG’s intelligent backbone selection mechanism, which ensures more stable and direct routing paths even in high-mobility and intersection-heavy environments.

4. Conclusions

This study presented a comparative performance evaluation of two widely used VANET routing protocols, QOS-AODV and GPSR, alongside their enhanced variants—CM-QOS-AODV and CM-GPSR—developed using the Traffic-Oriented Model (TOM) and Delay-Efficient Model (DEM). By applying Taguchi-based optimization techniques, key protocol parameters were tuned to adapt to different traffic intensities and delay sensitivities in urban and highway scenarios modeled on Changlun City. The simulation results demonstrated that TOM-optimized protocols significantly improved the packet delivery ratio (PDR) by up to 10%, maintained throughput levels above 0.40 Mbps, and reduced end-to-end delay to as low as 0.01 s—making them suitable for safety-critical applications such as collision avoidance and emergency response. In contrast, DEM-based variants achieved more balanced improvements, offering moderate gains in all QoS metrics, and are therefore better suited for general-purpose vehicular communication use cases. While the findings affirm the potential of traffic- and delay-aware optimization in improving VANET performance, this work is limited to simulation-based evaluation without field deployment or real hardware constraints. Moreover, manually configured mobility was used rather than GPS-based or SUMO-integrated traces. Future work will focus on extending the framework to support GPS-based mobility models, validating the proposed methods in real-world vehicular testbeds, and exploring adaptive optimization mechanisms that respond to live traffic and network conditions. These extensions will further enhance the applicability and robustness of the proposed CM-based routing solutions in dynamic vehicular environments. For future work, we aim to further address key challenges in VANET routing, including route instability from high mobility, difficulty in balancing QoS trade-offs (delay, throughput, and PDR), and the limited adaptability of existing protocols. While our current framework offers a robust parameter optimization approach, future research will explore adaptive, real-time tuning mechanisms and extend validation to larger-scale, heterogeneous vehicular environments. These directions aim to close the remaining gaps identified in the literature and enhance the practical deployment of QoS-aware routing in dynamic VANET scenarios. Moreover, this study does not explicitly examine energy and bandwidth constraints. While vehicular nodes typically face fewer energy limitations than traditional mobile ad hoc networks, bandwidth efficiency and protocol overhead remain relevant, especially in congested scenarios. These aspects are identified as important areas for future research.

Supplementary Materials

The following supporting information can be downloaded at https://www.mdpi.com/article/10.3390/computers14070285/s1. Figure S1: Two stages optimization of the CM-Routing Protocol; Figure S2: Research Methodology Flow Diagram’; Figure S3: Protocol’s Inner-parameters selection Flowchart; Figure S4: Parameters Optimization Process Flowchart; Figure S5: Changlun City Map (2016google 2016); Figure S6: CM-Method Flowchart; Figure S7: CM-Routing Mechanism Overall Process Follow Diagram; Figure S8: Optimization Control Message Structure; Figure S9: Pseudo Code of the Receive OCM Message at OBU; Figure S10: Receive Profile Process Pseudo Code in the OBU; Figure S11: Process follow of the Optimization Implementation in The Road Side Unit (RSU)Roadsiderst step in the RSU is the construction of the OCM messages; Figure S12: Example of OCM Message for AODV with id = 231 and k = 2; Figure S13: The results table of the Optimization Method Structure; Figure S14: REP_receive Method for the RSU Pseudo Code; Figure S15: The Overall Flowchart of the Optimization implementation On RSU; Figure S16: AODV Receive Data Message from Upper Layer Process Flowchart; Figure S17: AODV Process Messages by Type Flowchart; Figure S18: Pseudo Code for Selection of Parent RSU from the AODV Routing Table; Figure S19: The CM-AODV Process Flowchart in the OBU Side; Figure20: GPSR Protocol Send Packet Process Flowchart; Figure S21: GPSR Beaconing Process Flow Diagram; Figure S22: OCM Profile REQ and OCM profile REP Messages Structure; Figure S23: CM-GPSR Overall Process Follow Diagram; Figure S24: Extraction for the City Scenario of Changlun map; Figure S25: Internal Structure of a running Wireless Node with CM-AODV Routing protocol; Figure S26: Snapshot of the Wireless Module Internal Structure; Figure S27: Linear Mobility Configurations in a Running Scenario; Figure S28: Demonstration of a Linear Mobility for a Running Simulation Scenario; Figure S29: Rectangular Mobility Configurations in a Running Scenario; Figure S30: Changlun Map with mobility trails, blue lines represents linear mobility and red lines represents rectangular mobility. Circle represents static mobility node placements; Table S1: AODV inner-parameters; Table S2: GPSR inner-parameters; Table S3: VANET Scenarios Key Simulation Parameters; Table S4: Burst Application Parameters; Table S5. Performance Metrics Summary with Mean and Standard Deviation; Table S6. One-Way ANOVA Results for Performance Metrics.

Author Contributions

Conceptualization, A.K.Y.D., M.E.E. and H.M.I.; methodology, A.E.T.A.; software, I.S.A.; validation, L.S.A. and A.M.e.Z.; formal analysis, F.A.E.A.; investigation, D.M.I.Z.; resources, M.E.E.; data curation, T.A.; writing—original draft preparation, T.A.; writing—review and editing, A.K.Y.D.; visualization, L.S.A.; supervision, M.E.E.; project administration, M.E.E.; funding acquisition, T.A. All authors have read and agreed to the published version of the manuscript.

Funding

The project is funded by Malaysia Ministry of Higher Education through the Fundamental Research Grant Scheme (FRGS) under grant number FRGS/1/2021/ICT11/UNIMAP/03/1 and the Deanship of Research and Graduate Studies Grant at King Khalid University, Saudia Arabia through the Large Research Project under grant number RGP2/353/46.

Data Availability Statement

The original contributions presented in this study are included in the article/Supplementary Materials. Further inquiries can be directed to the corresponding author(s).

Acknowledgments

This work was supported by the Ministry of Higher Education through the Fundamental Research Grant Scheme (FRGS) under grant number FRGS/1/2021/ICT11/UNIMAP/03/1 and the Deanship of Research and Graduate Studies Grant at King Khalid University through the Large Research Project under grant number RGP2/353/46.

Conflicts of Interest

The authors declare no conflict of interest.

References

  1. Tandrayen-Ragoobur, V. The economic burden of road traffic accidents and injuries: A small island perspective. Int. J. Transp. Sci. Technol. 2024, 17, 109–119. [Google Scholar] [CrossRef]
  2. Yetay, B.; Esayas, A.; Dietrich, S. Examining Car Accident Prediction Techniques and Road Traffic Congestion: A Comparative Analysis of Road Safety and Prevention of World Challenges in Low-Income and High-Income Countries. J. Adv. Transp. 2023, 2023, 6643412. [Google Scholar] [CrossRef]
  3. Ahmed, S.K.; Mohammed, M.G.; Abdulqadir, S.O.; El-Kader, R.G.A.; El-Shall, N.A.; Chandran, D.; Rehman, M.E.U.; Dhama, K. Road traffic accidental injuries and deaths: A neglected global health issue. Health Sci. Rep. 2023, 6, e1240. [Google Scholar] [CrossRef] [PubMed]
  4. Mohd Khairul Amri, K.; Noorjima, A.W.; Roslan, U.; Shakir, M.S.A.; Muhammad, S.; Sarah, N.; Muhamad, M.; Abdul, A.; Siti, A.; Asyraff, R. Road Traffic Accident in Malaysia: Trends, Selected Underlying, Determinants and Status Intervention. Int. J. Eng. Technol. 2018, 7, 112. [Google Scholar] [CrossRef]
  5. Hasan, H.A.; Sahar, W. Review Vehicular communication Networks Security Challenges and Future Technology: Networks Security Challenges and Future Technology. Wasit J. Comput. Math. Sci. 2022, 1, 1–14. [Google Scholar] [CrossRef]
  6. Arif, M.; Wang, G.; Bhuiyan, M.Z.A.; Wang, T.; Chen, J. A survey on security attacks in VCNs: Communication, applications and challenges. Veh. Commun. 2019, 19, 100179. [Google Scholar] [CrossRef]
  7. Ali, G.G.M.N.; Sadat, M.N.; Miah, M.S.; Sharief, S.A.; Wang, Y. A Comprehensive Study and Analysis of the Third Generation Partnership Project’s 5G New Radio for Vehicle-to-Everything Communication. Future Internet 2024, 16, 21. [Google Scholar] [CrossRef]
  8. Ganeshkumar, N.; Sanjay, K. OBU (On-Board Unit) Wireless Devices in VANET(s) for Effective Communication—A Review; Springer: Singapore, 2021. [Google Scholar] [CrossRef]
  9. Dutta, A.; Samaniego Campoverde, L.M.; Tropea, M.; De Rango, F. A Comprehensive Review of Recent Developments in VANET for Traffic, Safety & Remote Monitoring Applications. J. Netw. Syst. Manag. 2024, 32, 73. [Google Scholar] [CrossRef]
  10. Hussein, N.H.; Yaw, C.T.; Koh, S.P.; Tiong, S.K.; Chong, K.H. A Comprehensive Survey on Vehicular Networking: Communications, Applications, Challenges, and Upcoming Research Directions. IEEE Access 2022, 10, 86127–86180. [Google Scholar] [CrossRef]
  11. Sindhwani, M.; Singh, R.; Sachdeva, A.; Singh, C. Improvisation of optimization technique and QOS-AODV routing protocol in VANET. Mater. Today Proc. 2022, 49, 3457–3461. [Google Scholar] [CrossRef]
  12. Owais, M.; Alshehri, A. Pareto Optimal Path Generation Algorithm in Stochastic Transportation Networks. IEEE Access 2020, 8, 58970–58981. [Google Scholar] [CrossRef]
  13. Hota, L.; Nayak, B.P.; Kumar, A.; Sahoo, B.; Ali, G.G.M.N. A Performance Analysis of VCNs Propagation Models and Routing Protocols. Sustainability 2022, 14, 1379. [Google Scholar] [CrossRef]
  14. Kaur, K.; Kumar, H.; Kaushal, S. Simulation and Analysis of Routing Protocols Using Real-Time Data in Vehicular Ad Hoc Networks. In Smart Innovation, Systems and Technologies, Proceedings of Conference on Smart Systems: Innovations in Computing. SSIC 2023, Jaipur, India, 26–27 October 2023; Somani, A.K., Mundra, A., Gupta, R.K., Bhattacharya, S., Mazumdar, A.P., Eds.; Springer: Singapore, 2024; Volume 392. [Google Scholar] [CrossRef]
  15. Mukunthan, A.; Cooper, C.; Safaei, F.; Franklin, D.; Abolhasan, M. Leveraging the Propagation Model to Make Greedy Routing Decisions in Urban Environments. In Proceedings of the 2017 IEEE 85th Vehicular Technology Conference (VTC Spring), Sydney, NSW, Australia, 4–7 June 2017; pp. 1–6. [Google Scholar] [CrossRef]
  16. Diaa, M.K.; Mohamed, I.S.; Hassan, M.A. OPBRP—Obstacle prediction based routing protocol in VCNs. Ain Shams Eng. J. 2023, 14, 101989. [Google Scholar] [CrossRef]
  17. ul Hassan, M.; Al-Awady, A.A.; Ali, A.; Sifatullah; Akram, M.; Iqbal, M.M.; Khan, J.; Abdelrahman Ali, Y.A. ANN-Based Intelligent Secure Routing Protocol in Vehicular communication Networks (VCNs) Using Enhanced QOS-AODV. Sensors 2024, 24, 818. [Google Scholar] [CrossRef] [PubMed] [PubMed Central]
  18. Abdeen, M.A.R.; Beg, A.; Mostafa, S.M.; AbdulGhaffar, A.; Sheltami, T.R.; Yasar, A. Performance Evaluation of VANET Routing Protocols in Madinah City. Electronics 2022, 11, 777. [Google Scholar] [CrossRef]
  19. Zineb, H.; Imane, Z.; Mohammed, O.; El Alaoui Said, O. Comparative study of routing protocols performance for Vehicular Communication Networks. Int. J. Appl. Eng. Res. 2017, 12, 3867–3878. [Google Scholar]
  20. Zardari, N.A.; Ngah, R.; Hayat, O.; Sodhro, A.H. Adaptive mobility-aware and reliable routing protocols for healthcare vehicular network. Math. Biosci. Eng. MBE 2022, 19, 7156–7177. [Google Scholar] [CrossRef] [PubMed]
  21. Ravi, B.; Varghese, B.; Murturi, I.; Donta, P.K.; Dustdar, S.; Dehury, C.K.; Srirama, S.N. Stochastic Modeling for Intelligent Software-Defined Vehicular Networks: A Survey. Computers 2023, 12, 162. [Google Scholar] [CrossRef]
  22. Marwah, G.P.K.; Jain, A. A hybrid optimization with ensemble learning to ensure VANET network stability based on performance analysis. Sci. Rep. 2022, 12, 10287. [Google Scholar] [CrossRef] [PubMed]
  23. Dafhalla, A.K.Y.; Elobaid, M.E.; Tayfour Ahmed, A.E.; Filali, A.; SidAhmed, N.M.O.; Attia, T.A.; Mohajir, B.A.I.; Altamimi, J.S.; Adam, T. Computer-Aided Efficient Routing and Reliable Protocol Optimization for Autonomous Vehicle Communication Networks. Computers 2025, 14, 13. [Google Scholar] [CrossRef]
  24. Eltahlawy, A.M.; Aslan, H.K.; Abdallah, E.G.; Elsayed, M.S.; Jurcut, A.D.; Azer, M.A. A Survey on Parameters Affecting MANET Performance. Electronics 2023, 12, 1956. [Google Scholar] [CrossRef]
  25. Vanek, B.; Farkas, M.; Rózsa, S. Position and Attitude Determination in Urban Canyon with Tightly Coupled Sensor Fusion and a Prediction-Based GNSS Cycle Slip Detection Using Low-Cost Instruments. Sensors 2023, 23, 2141. [Google Scholar] [CrossRef] [PubMed]
  26. Dafhalla, A.K.Y.; Ahmed, A.E.T.; Sid Ahmed, N.M.O.; Filali, A.; Alhomed, L.S.; Ali, F.A.E.; Eldeen, A.I.G.; Elobaid, M.E.; Adam, T. High-Performance Data Throughput Analysis in Wireless Ad Hoc Networks for Smart Vehicle Interconnection. Computers 2025, 14, 56. [Google Scholar] [CrossRef]
  27. Schöttler, S.; Yang, Y.; Pfister, H.; Bach, B. Visualizing and Interacting with Geospatial Networks: A Survey and Design Space. Comput. Graph. Forum 2021, 40, 5–33. [Google Scholar] [CrossRef]
  28. Teixeira, L.H.; Huszák, Á. Reinforcement Learning Environment for Advanced Vehicular communication Networks Communication Systems. Sensors 2022, 22, 4732. [Google Scholar] [CrossRef] [PubMed]
  29. Al-Qassas, R.; Qasaimeh, M. An empirical evaluation of link quality utilization in ETX routing for VCNs. PeerJ Comput. Sci. 2024, 10, e2259. [Google Scholar] [CrossRef] [PubMed]
  30. Parsa, A.; Moghim, N.; Haghani, S. Joint congestion and contention avoidance in a scalable QoS-aware opportunistic routing in wireless ad-hoc networks. PLoS ONE 2023, 18, e0288955. [Google Scholar] [CrossRef] [PubMed]
  31. Hussain, M.; Mohammed, A.; Mustafa, H. Performance evaluation for Vehicular Communication Networks based routing protocols. Bull. Electr. Eng. Inform. 2021, 10, 1080–1091. [Google Scholar] [CrossRef]
  32. Hanah, A.; Farook, R.S.M.; Rejab, M.R.A.; Fadzil, M.F.M.; Elias, S.J.; Dawam, S.R.M. Cross-layer optimization for VANET city scenario using Taguchi mechanism. In Proceedings of the 2021 6th IEEE International Conference on Recent Advances and Innovations in Engineering (ICRAIE), Kedah, Malaysia, 1–3 December 2021; pp. 1–5. [Google Scholar] [CrossRef]
  33. Almutairi, A.; Owais, M. Reliable Vehicle Routing Problem Using Traffic Sensors Augmented Information. Sensors 2025, 25, 2262. [Google Scholar] [CrossRef] [PubMed]
  34. Tho, M.C.; Binh, L.H.; Vo, T. GPSR-CB: A novel routing algorithm for FANET using cross-layer models in combination with multi-level backbone UAV. Ad Hoc Netw. 2025, 173, 103828. [Google Scholar] [CrossRef]
  35. Cui, J.; Ma, L.; Wang, R.; Liu, M. Research and optimization of GPSR routing protocol for vehicular ad-hoc network. China Commun. 2022, 19, 194–206. [Google Scholar] [CrossRef]
Figure 1. VANET Architecture: An overview of the Vehicular Ad Hoc Network structure illustrating communication between vehicles (V2V), between vehicles and roadside infrastructure (V2I), and integration with centralized systems via the internet or cloud to support intelligent transportation services.
Computers 14 00285 g001
Figure 2. Geographical Protocol Taxonomy and Relation Diagram: The dotted lines represent the direct and indirect relationship between protocols.
Computers 14 00285 g002
Figure 3. Taguchi Optimization Method (TOM) Processes and Steps: A structured representation of the Taguchi method, outlining key phases such as problem definition, selection of control factors and levels, design of experiments using Orthogonal Arrays, execution of experiments, analysis using signal-to-noise (S/N) ratios, and determination of optimal conditions for robust system performance.
Computers 14 00285 g003
Figure 4. Taguchi Process Diagram (P-Diagram): A schematic representation of the Taguchi P-Diagram illustrating the relationship between input signals, control factors, noise factors, and the desired output response, which is used to analyze and improve the robustness of a system against variations.
Computers 14 00285 g004
Figure 5. (a) Throughput comparison between (a) QOS-AODV, QOS-AODV-TOM, and QOS-AODV-DEM and (b) GPSR, GPSR-TOM, and GPSR-DEM for different traffic generations.
Computers 14 00285 g005
Figure 6. PDR comparison between (a) QOS-AODV, QOS-AODV-TOM, and QOS-AODV-DEN and (b) GPSR, GPSR-TOM, and GPSR-DEN for different traffic generations.
Computers 14 00285 g006
Figure 7. Delay comparison between (a) QOS-AODV, QOS-AODV-TOM, and QOS-AODV-DEN and (b) GPSR, GPSR-TOM, and GPSR-DEN for different traffic generations.
Computers 14 00285 g007
Figure 8. Comparison of average throughputs across varying traffic generations, packet sizes. (a) Throughput vs. traffic generation; (b) throughput vs. packet size.
Computers 14 00285 g008
Figure 9. Comparison of average throughputs across varying traffic PDR and packet sizes. (a) PDR with traffic generation; (b) PDR with packet size.
Computers 14 00285 g009
Figure 10. Comparison of average throughputs across varying traffic delay and packet sizes. (a) Delay with traffic generation; (b) delay with packet size.
Computers 14 00285 g010
Table 1. QOS-AODV Inner Parameter Levels: The table lists the selected inner parameters of the QoS-enhanced AODV routing protocol along with their corresponding levels. The parameters are used for performance optimization and experimental design in network simulations.
Parameter (x, y, z)k,nLevel k,1Level k,2Level k,3
MAX_JITTER0.1 s0.5 s1.0 s
ACTIVE_ROUTE TIMEOUT20 s30 s40 s
HELLO_INTERVAL1 s10 s20 s
Table 2. GPSR Inner Parameter Levels: The table displays the key configurable parameters of the GPSR (Greedy Perimeter Stateless Routing) protocol along with their respective levels. The parameters are utilized for evaluating and optimizing protocol performance under varying network conditions.
Parameter (x, y, z)k,nLevel k,1Level k,2Level k,3
MAX_JITTER0.1 s0.5 s1.0 s
NEIGHBOR_VALIDITY_INTERVAL20 s30 s40 s
BEACON_INTERVAL1 s10 s20 s
Table 3. Orthogonal Array for QOS-AODV Experiment Design: The table presents the structured experimental design matrix based on an Orthogonal Array. The matrix was used to systematically evaluate the effects of multiple QoS-AODV inner parameters on network performance with a minimal number of simulation runs.
NoMaxJitterActiveRouteTimeOutHelloInterval
10.1 s20 s1 s
20.1 s30 s10 s
30.1 s40 s20 s
40.5 s20 s10 s
50.5 s30 s20 s
60.5 s40 s1 s
71.0 s20 s20 s
81.0 s30 s1 s
91.0 s40 s10 s
Table 4. Orthogonal Array of GPSR Experiment Design: The table shows the experimental layout using an Orthogonal Array for the GPSR protocol, which enabled efficient analysis of multiple parameter combinations to determine their impact on routing performance metrics.
NoBeaconMaxJitterN. Validity
Time
12 s0.1 s20 s
22 s0.5 s30 s
32 s1 s40 s
410 s0.1 s30 s
510 s0.5 s40 s
610 s1 s20 s
720 s1 s40 s
820 s0.5 s20 s
920 s0.1 s30 s
Table 5. Delay Results of the OA Experimental Design with 9 Experiments: The table summarizes the end-to-end delay outcomes obtained from the nine orthogonally designed experiments, highlighting the impact of varying GPSR or QoS-AODV parameter combinations on network latency performance.
EXP. NOBeacon MaxJitter, N.
Validity Time
T1T2T3T4T5Equation
1(1, 0.1, 20) s0.049940.052420.052440.052680.04925 S N R B e a c o n L 1 = A v e ( S N R e 1 + S N R e 2 + S N R e 3 = B e a c o n 1
2(1, 0.5,30) s0.063860.071420.064200.065090.06090
3(1, 1,40) s0.070080.063910.058820.066480.06683
4(10, 0.1, 30) s0.070110.066260.067970.066980.06325 S N R B e a c o n L 1 = A v e ( S N R e 4 + S N R e 5 + S N R e 6 = B e a c o n 10
5(10, 0.5, 40) s0.063020.068560.069980.066440.06755
6(10, 1, 20) s0.069700.069690.066420.067930.06891
7(20, 0.1, 40) s0.069700.065560.066460.069930.06821 S N R B e a c o n L 1 = A v e ( S N R e 7 + S N R e 8 + S N R e 9 = B e a c o n 20
8(20, 0.5, 20) s0.068640.070840.063610.069520.07004
9(20, 1, 30) s0.049940.052420.053440.052680.04925
Table 6. Traffic Generation Values in Time Interval and Data per Node per Second: The table details the configured traffic generation parameters, including time intervals and the amount of data generated per node per second, which were used to simulate network load conditions during performance evaluation experiments.
Experiment12345
Time Interval (s)0.110.160.210.260.31
Traffic (bps)74,472.7351,20039,009.5231,507.6926,425.81
Table 7. Throughput comparison (Mbps).
Traffic Generation (Interval)QOS-AODVQOS-AODV-TOMQOS-AODV-DEMGPSRGPSR-TOMGPSR-DEM
0.11 s0.380.450.430.300.470.33
0.21 s0.360.430.410.280.440.31
0.31 s0.340.400.390.250.420.29
Table 8. PDR comparison (%).
Traffic Generation (Interval)QOS-AODVQOS-AODV-TOMQOS-AODV-DEMGPSRGPSR-TOMGPSR-DEM
0.11 s808987798985
0.21 s798885788884
0.31 s788784778783
Table 9. Average delay comparison (seconds).
Traffic Generation (Interval)QOS-AODVQOS-AODV-TOMQOS-AODV-DEMGPSRGPSR-TOMGPSR-DEM
0.11 s0.0220.0200.0230.0300.0100.025
0.21 s0.0240.0210.0240.0320.0110.027
0.31 s0.0250.0220.0250.0350.0120.029
Disclaimer/Publisher’s Note: The statements, opinions and data contained in all publications are solely those of the individual author(s) and contributor(s) and not of MDPI and/or the editor(s). MDPI and/or the editor(s) disclaim responsibility for any injury to people or property resulting from any ideas, methods, instructions or products referred to in the content.

