Abstract
Driver distraction can have severe safety consequences, particularly in public transportation. This paper presents a novel approach for detecting bus driver actions, such as mobile phone usage and interactions with passengers, using Kolmogorov–Arnold networks (KANs). The adversarial FGSM attack method was applied to assess the robustness of KANs in extreme driving conditions, like adverse weather, high-traffic situations, and bad visibility conditions. In this research, a custom dataset was used in collaboration with a partner company in the field of public transportation. This allows the efficiency of Kolmogorov–Arnold network solutions to be verified using real data. The results suggest that KANs can enhance driver distraction detection under challenging conditions, with improved resilience against adversarial attacks, particularly in low-complexity networks.
1. Introduction
The evolving nature of transportation is marked by increasing traffic, highlighting the need for safer transport methods. Despite the integration of advanced driver assistance systems (ADAS), such as emergency braking technologies, drivers remain a crucial component within this framework [1]. A longitudinal analysis of passenger kilometers traveled by passenger cars demonstrates a generally increasing trend from 2012 to 2019, peaking at approximately 4298.8 billion passenger-kilometers (pkms) in 2019 (Table 1). The advent of the COVID-19 pandemic precipitated a significant reduction in 2020, which was followed by a gradual recovery in 2021 and a further rise in 2022 to 4099.6 billion [2]. This pattern illustrates the profound yet ephemeral impact of the pandemic on mobility behaviors. In contrast, while experiencing an initial decrease in usage, bus and coach services have shown resilience with a notable recovery. Passenger kilometers for buses and coaches dipped to 292 billion in 2020 but rebounded to 330.8 billion in 2021 and reached 406.2 billion in 2022.

Table 1.
Road fatalities with passenger cars, buses, and coaches in EU-27 countries [2,3].
The statistics on road safety reflect a complex interplay between increased transport volumes and enhanced safety measures. Fatalities involving buses and coaches showed variability, decreasing to a low of 47 in 2020, then increasing in 2021, and stabilizing at 90 in 2023 [3]. These fluctuations underscore the ongoing challenges in road safety and the critical need for continued advancements in vehicle safety features. As shown in Figure 1, fatalities involving buses and coaches are more common in urban areas than those involving car occupants, highlighting the prominent role of buses in city transport. Unlike car occupant fatalities, which are mainly concentrated on rural roads, bus-related fatalities are more evenly spread across all road types.

Figure 1.
Distribution of fatalities by road type and transport mode (own formatting based on [3]).
The relationship between mobile phone usage and traffic accidents also warrants attention. A Finnish study involving 15 thousand working-age participants found that males and younger individuals reported more accidents and near-miss incidents related to mobile phone use [4]. Employment status correlated with higher incidences, and there was a noticeable increase in reports from individuals experiencing sleep disturbances or minor aches. In California, the expansion of 3G coverage between 2009 and 2013 was linked to an approximate 2.9% increase in traffic accident rates, a figure comparable to impacts seen from other risk factors like higher minimum wages and increased alcohol consumption [5]. These findings underscore the necessity for stringent regulations and robust enforcement to curtail the risks associated with smartphone use while driving.
Recent advancements in vehicle sensor technology have significantly enhanced the detection of driving patterns and behaviors. Analyzing vehicle sensor data during maneuvers such as a single turn reveals distinct driving patterns [6]. Applying deep learning frameworks to CAN-BUS data has proven effective in distinguishing various driving behaviors [7]. Furthermore, monitoring systems that employ principal component analysis are adept at tracking real-time metrics such as fuel consumption, emissions, driving styles, and driver health [8] (Campos-Ferreira et al., 2023). The optimization of energy efficiency in rail vehicles also involves detecting energy losses [9].
Behavioral assessments using tools like the Driver Behavior Questionnaire indicate that although professional drivers generally adhere to safer driving practices, their prolonged driving hours elevate their accident risk [10]. Driver comfort levels have been shown to influence driving performance significantly [11]. Extensive psychometric evaluations of bus drivers through instruments such as the Multidimensional Driving Style Inventory and Driver Anger Scale highlight the critical need to distinguish between safe and unsafe driving behaviors [12].
A robust correlation exists between in-vehicle data and physiological driver signals, which highly indicate driver behavior [13]. High-quality cameras and eye-tracking systems measure cognitive load by analyzing fixation frequency, pupil diameter, and blink rates [14]. Experienced drivers exhibit unique fixation patterns that differ markedly from those of novice drivers [15]. Furthermore, variations in pupil size during driving tasks can reflect attention levels and are influenced by the complexity of the tasks and the type of user interfaces employed, such as touchscreens [16].
Driver fatigue and distraction are commonly assessed through biometric signals, steering patterns, and facial monitoring techniques [17]. An elevated heart rate often suggests engagement in complex tasks [18], and heart rate variability, supported by electroencephalography data, helps detect driver drowsiness [19]. Wearable devices that measure galvanic skin responses have been proven to detect driver distraction accurately under real-world conditions [20]. Innovations in single-channel EEG systems utilize brief time windows and single-feature analysis, which are ideal for integrating into embedded systems with minimal processing and storage requirements [21]. Additionally, electromyograms (EMGs) are employed to monitor muscle fatigue, thus aiding in predicting driver alertness [22].
Enhancing machine learning algorithms through feature selection significantly improves accuracy and efficiency in driver behavior classification, focusing on behaviors like normal, aggressive, and drowsy driving [23]. Another study developed a driver inattention detection system using multi-task cascaded convolutional networks (MTCNN), which outperformed other algorithms like HOG and Haar features in various conditions such as lighting and head movements, effectively detecting inattention and drowsiness [24]. Additionally, a cost-effective and adaptive model that combines computer vision with time series analysis was proposed to monitor driver states like distraction and fatigue, aligning with safety standards and using advanced algorithms for real-time assessments of driver attentiveness [25]. These studies underscore the potential of machine learning and computer vision to enhance road safety by improving driver monitoring technologies.
Recent studies have explored the application of the Kolmogorov–Arnold representation theorem to construct deep ReLU networks, presenting new KA representations that optimize neural network parameters for enhanced approximation of smooth functions [26]. Similarly, the utilization of the Kolmogorov superposition theorem has been investigated for its potential to break the curse of dimensionality in high-dimensional function approximations [27]. In this context, Liu et al. introduced Kolmogorov–Arnold networks (KANs) as a novel alternative to traditional multi-layer perceptrons (MLPs) [28]. These networks distinguish themselves by having learnable activation functions on the edges and employing univariate functions parametrized as splines, enhancing both the accuracy and interpretability of function-fitting tasks and facilitating user interaction in scientific explorations.
Moreover, DropKAN, a specific regularization technique for KANs, addresses the unpredictability seen with traditional dropout methods by applying dropout directly to activations within KAN layers, demonstrating improved generalization across multiple datasets [29]. Furthermore, developing convolutional KANs integrates spline-based activations into convolutional layers, offering a promising alternative to standard convolutional neural networks by potentially reducing parameter count while maintaining competitive accuracy [30].
The Chebyshev Kolmogorov–Arnold network (Chebyshev KAN) represents another advancement in this area, utilizing Chebyshev’s polynomials for function approximation along the network’s edges [31]. This approach enhances parameter efficiency and improves interpretability, showing promising results in tasks like digit classification and synthetic function approximation. Despite these innovations, a comprehensive comparison of KANs and MLPs across various domains, including machine learning, computer vision, and audio processing show that while MLPs generally outperform KANs, the latter excel in symbolic formula representation due to their unique activation functions [32]. This study also notes that KANs face more significant challenges in continual learning settings than MLPs, which retain better performance across tasks.
2. Materials and Methods
2.1. Kolmogorov–Arnold Network Theory
The Kolmogorov–Arnold representation theorem provides a powerful theoretical foundation for functional approximation. It states that any multivariate continuous function
can be represented as a finite sum of continuous univariate functions applied to linear combinations of the input. Expressly, the theorem guarantees the existence of continuous functions and such that
This decomposition highlights that complex multivariate functions can be constructed entirely from compositions and additions of univariate functions—an idea that underpins the architecture of Kolmogorov–Arnold networks (KANs).
KANs operationalize this insight by replacing the standard linear transformation in neural networks with a structure where each connection (edge) learns a univariate nonlinear function, rather than a fixed scalar weight. In contrast to traditional linear layers, which compute
where is the input and is the learnable weight matrix, a KAN layer computes the output as
Here is a learnable univariate function that replaces the static weight in conventional layers. These functions are typically parameterized using low-order splines or polynomials, making them both expressive and computationally tractable.
This formulation allows a KAN layer to serve as a drop-in replacement for fully connected (linear) layers in standard neural networks. The main difference lies in the representational flexibility: While a linear layer can only scale and sum input dimensions, a KAN layer can learn rich nonlinear transformations along each edge, effectively embedding functional composition directly into the architecture.
2.2. Models
The densely connected convolutional network (DenseNet), introduced by Huang et al., employs a novel architecture where each layer is connected to every other layer in a feed-forward fashion [33]. This design creates extremely deep networks that alleviate the vanishing gradient problem, strengthen feature propagation, encourage feature reuse, and substantially reduce the number of parameters. The DenseNet architecture is especially effective in maintaining the flow of information and gradients throughout the network, making it suitable for tasks where feature extraction from complex visual data is crucial.
The deep residual network (ResNet), developed by He et al., utilizes skip or shortcut connections that allow gradients to flow through the network directly [34]. By enabling each set of layers to learn residual functions regarding the layer inputs, ResNet facilitates the training of much deeper networks than previously possible. This approach addresses the degradation problem typically faced with increased network depth, enhancing the network’s ability to learn and perform effectively on deep learning tasks without suffering from training difficulties due to added depth.
The very deep convolutional network (VGG), crafted by Simonyan and Zisserman, focuses on significantly deep networks that use very small (3 × 3) convolution filters [35]. This model has demonstrated that increasing the depth of the network while maintaining a simple architectural approach can lead to substantial improvements in accuracy on large-scale image recognition tasks. The VGG’s straightforward architecture, which stacks small convolution filters to build depth, simplifies the model while capturing complex features, making it highly effective for image-based applications.
Each of these models brings a unique perspective to handling the complexities of neural networks, particularly in the context of visual recognition tasks required in bus driver monitoring systems. DenseNet’s feature reuse capabilities, ResNet’s ease of training for very deep networks, and the VGG’s depth with simple configurations provide robust options for developing accurate and efficient monitoring solutions. These architectural innovations underline the importance of depth and connectivity in improving the performance of convolutional neural networks in practical applications.
2.3. Dataset
In this work, the driver-action image classification dataset, which was executed in partnership with a public transport company, is presented. The dataset comprises different real bus drivers performing distinct actions while driving a bus: calling, drowsy, normal, talking, and texting. The recordings featured real bus drivers in actual traffic situations, captured on urban and suburban routes in Hungary, Europe. The images were captured over several days, but not in different seasons, resulting in only minor environmental variations such as cloudy or sunny conditions at different times. Ethnic diversity could not be included in the dataset due to local circumstances. The same camera setup was used in the driver’s cab, pointing at the driver. Each sample is captured as an RGB image with a resolution of pixels, where every image has the driver’s face in the middle. The dataset is split into training and validation subsets, with images in the training set and images in the validation set, for a total of images. Figure 2 shows some sample images from the dataset for each class.
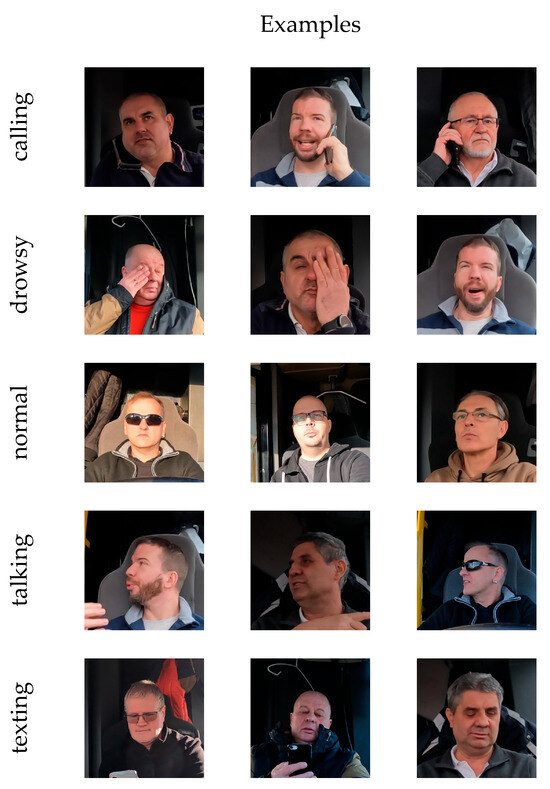
Figure 2.
Sample images from the dataset.
Figure 3 shows how many samples are in each class’s training and validation dataset.

Figure 3.
Number of samples by class in the training dataset (left) and the validation dataset (right).
In the training subset, the talking action contains the most images (), while the drowsy action has the fewest (). The texting class also has a low number of elements (). The number of elements in the calling and normal classes is similar ( and ) but less than the number of samples in the talking class. The structure of the validation set is very similar. In the design of the two subsets, images were randomly assigned to each set, where each sample was assigned to the training set with a probability of 0.8 and to the validation set with a probability of . Therefore, the number of samples belonging to the drowsy class is the lowest in the validation set (), followed by texting (). The next in line is the calling class () and then the normal class (). Finally, talking samples are the most numerous in the dataset ().
Figure 4 shows the number of samples for the bus drivers included in the study.
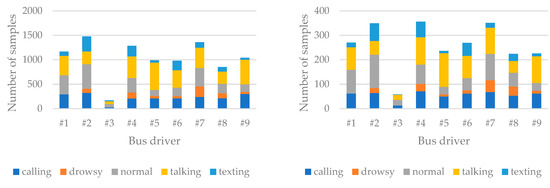
Figure 4.
Number of samples for each bus driver per class in the training dataset (left) and the validation dataset (right).
There is a considerable variation in the number of samples for each driver. The lowest number of recordings was for bus driver #3 (). He is followed by #8 (), then #5 (), #6 (), and #9 () in roughly similar proportions. Next in line is driver #1 (). This driver is followed by #4 () and #7 () with a minimal margin. Finally, participant #2 closes the row with the most samples ().
3. Results
In the current study, a total of different neural networks were created. Each solution was trained and validated with the dataset created and presented in Section 2.3. In this study, the tolerance of the networks was tested using the FGSM attack method, which requires strong resilience per se [36]. This method is a widely used adversarial attack technique introduced to evaluate the robustness of neural networks. It generates adversarial examples by making a single-step perturbation in the direction of the gradient of the loss function concerning the input. Given a clean input , model parameters , the true label , and the loss function , the adversarial example is computed as follows:
where controls the perturbation size. In this research, all training was performed with for maximum perturbation. For all solutions, two training phases were performed: the first without applying any adversarial attack method, and in the second case, using the FGSM attack method. In each case, the training was done over epochs using the Adam optimization algorithm [37], and the cross entropy loss function was used to calculate the loss during the training. We trained our neural networks using a learning rate of and a batch size of ; a fixed random seed of was used for data splitting into training and validation sets, as well as for shuffling the data to ensure reproducibility.
In this work, six minimal complexity networks were made to test the efficiency of KAN layers for simple architectures. The first is LinNet, which consists of only linear layers. The second is LinKAN, which consists of both linear and KAN layers. The next is KANNet1, which consists of only one KAN layer, and KANNet2, which consists of two KAN layers. For these, the authors want to investigate how the LinKAN, KANNet1, and KANNet2 solutions improve the performance compared to the baseline LinNet solution. Figure 5 summarizes the training process. The first case shows the accuracy and loss values during the training process without using an adversarial attack, followed by the FGSM attack method.
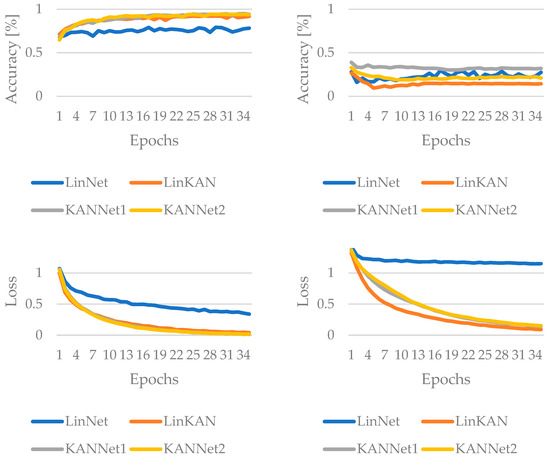
Figure 5.
The result of the training for low-complexity networks without convolution, without adversarial attack (left columns) and with FGSM attack (right column).
KANNet1 appears to balance high clean-data performance with the strongest resilience to FGSM, while LinKAN offers a significant jump in clean accuracy over LinNet but pays a notable penalty in adversarial robustness. KANNet1 and KANNet2 exceed final accuracy on clean data, with KANNet1 slightly higher. Under FGSM, KANNet1 outperforms KANNet2, making KANNet1 the strongest adversarial performer in this case.
The fifth and sixth solutions of the minimal complexity networks include a convolution layer. The ConvNet solution uses a linear layer after convolution, while the ConvNet+KAN network uses a KAN layer instead of a linear layer. The results measured during training for these are shown in Figure 6. ConvNet+KAN outperforms the baseline ConvNet on both clean data and FGSM tests. Overall, incorporating KAN substantially boosts both standard accuracy and adversarial attack in this architecture.
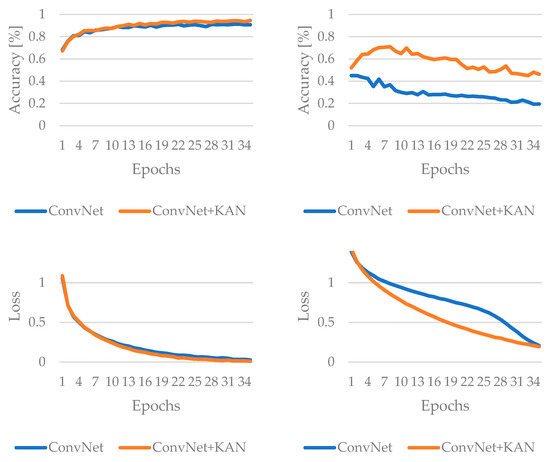
Figure 6.
The result of the training for low-complexity convolutional based networks, without adversarial attack (left columns) and with FGSM attack (right column).
The study’s second phase was based on state-of-the-art architectures of high complexity, using different versions of the ResNet, DenseNet, and VGG models. A KAN-based equivalent was created for each model, where KAN layers of the same size replaced the linear layers. A minimum-size counterpart was created and modified for each of the three architectures. These are called ResNet_s, DenseNet_s, and VGG_s and their KAN-based counterparts are ResNet_s+KAN, DenseNet_s+KAN, and VGG_s+KAN networks.
In the case of ResNet, using KAN generally boosts adversarial robustness across all tested ResNet architectures without substantially compromising clean-data performance. In fact, ResNet101+KAN stands out for maintaining the highest final accuracy under normal (without attack) conditions, whereas ResNet18+KAN shows the greatest resilience under FGSM attacks. While exact improvements vary by model, the overall trend indicates that KAN effectively offsets adversarial vulnerabilities and, in some cases, can even enhance performance in benign environments. Figure 7 and Figure 8 summarize the results of ResNet during the training process: in the first case, without adversarial attack, while in the second case, when the FGSM attack method is applied.
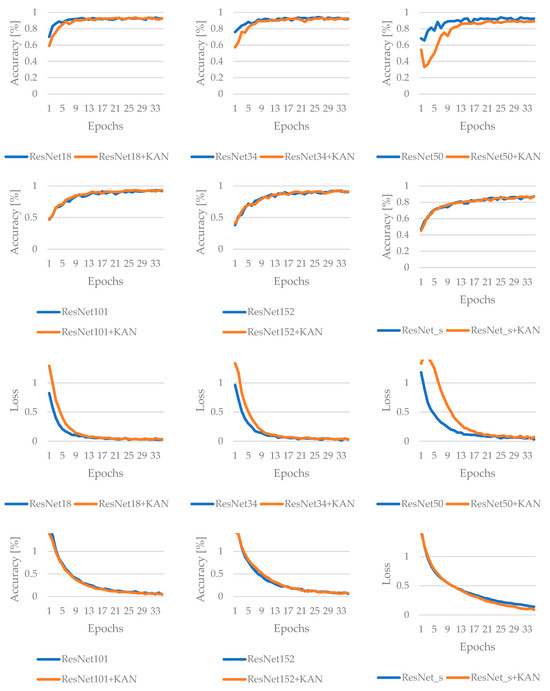
Figure 7.
Results of the training for ResNet-based networks, without adversarial attack.
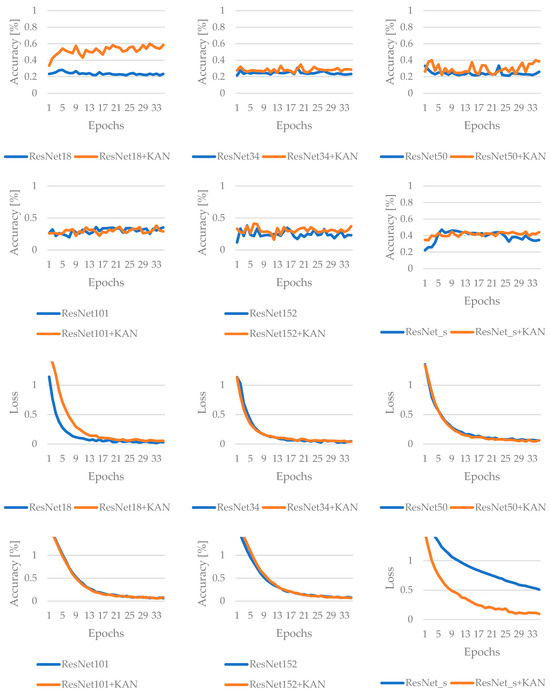
Figure 8.
Results of the training for ResNet-based networks, with FGSM attack.
The results for the DenseNet family of models are as follows. DenseNet201+KAN demonstrates the most consistently strong performance, achieving the highest final accuracy without attack and also showing the best robustness under the FGSM attack method. However, DenseNet169 provided the best peak accuracy. While the KAN layer’s effect on clean-data results varies by architecture—e.g., it sometimes yields anomalously high peaks or smaller final improvements—it generally brings clear gains in adversarial resilience. In practice, this suggests that the KAN is a valuable enhancement for DenseNet models that must contend with adversarial threats while maintaining competitive performance on benign data. The results are summarized in Figure 9 and Figure 10.
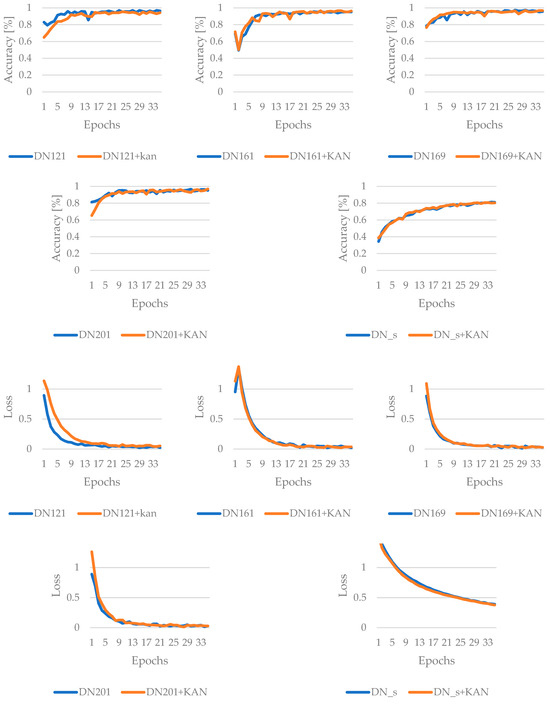
Figure 9.
Results of the training for DenseNet-based networks, without adversarial attack.
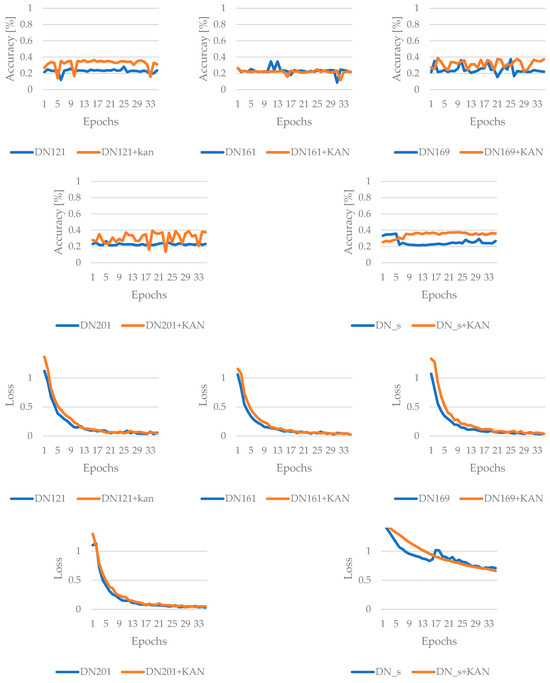
Figure 10.
Results of the training for DenseNet-based networks, with FGSM attack.
The third and last family of state-of-the-art and complex structured networks to be examined is the VGG. These results indicate that VGG11 finishes with the highest clean-data accuracy, while VGG13 exhibits the best overall robustness against the FGSM attack method. Although the KAN boosts certain architectures at specific epochs, it does not universally guarantee top final accuracies under adversarial conditions. Only in the case of the VGG_s architecture does VGG_s+KAN initially perform better, achieving good efficiency sooner. However, based on the results of the last epoch, it does not perform better; only the best-achieved performance became more efficient. The training results for the VGG models are summarized in Figure 11 and Figure 12.
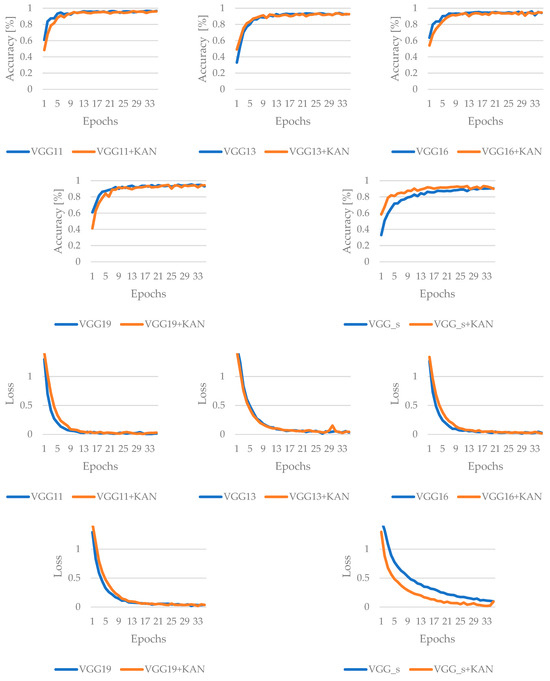
Figure 11.
Results of the training for VGG-based networks, without adversarial attack.
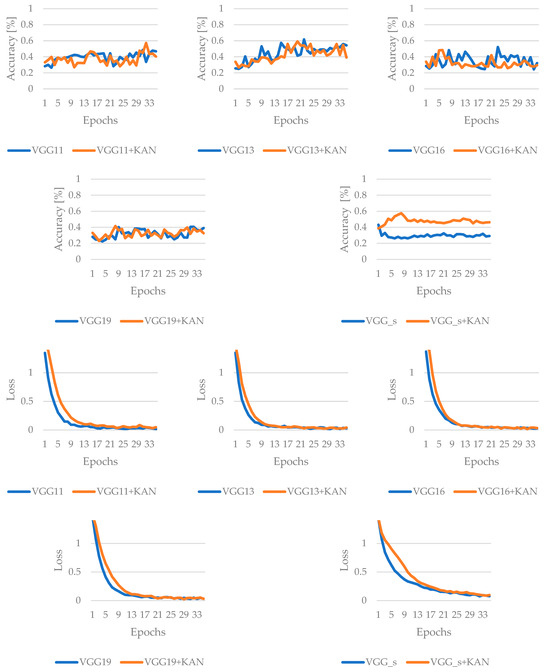
Figure 12.
Results of the training for VGG-based networks, with FGSM attack.
Table 2, Table 3, Table 4, Table 5, Table 6, Table 7, Table 8 and Table 9 summarize the best results obtained during the training process and the results obtained in the last iteration of training for all neural networks without using any adversarial attack method and after using the FGSM attack technique. The tables also show that the KAN-based solution of each variant performed better than its counterpart with a linear layer. Figure 13, Figure 14, Figure 15 and Figure 16 show the confusion matrices in both cases. Each matrix represents the performance of a different classification model on a multi-class task involving five classes: calling, drowsy, normal, talking, and texting. These matrices visually present how well the model predicted the actual class of each activity. The rows represent the actual (true) labels, and the columns represent the predicted labels. The diagonal values indicate correct classifications, while off-diagonal values represent misclassifications.

Table 2.
Best and last accuracy result for low-complexity networks without adversarial attack. The best results are highlighted in bold text.

Table 3.
Best and last accuracy result for low-complexity networks with FGSM attack. The best results are highlighted in bold text.

Table 4.
Best and last accuracy result for ResNet-based networks without adversarial attack. The best results are highlighted in bold text.

Table 5.
Best and last accuracy result for ResNet-based networks with FGSM attack. The best results are highlighted in bold text.

Table 6.
Best and last accuracy result for DenseNet-based networks without adversarial attack. The best results are highlighted in bold text.

Table 7.
Best and last accuracy result for DenseNet-based networks with FGSM attack. The best results are highlighted in bold text.

Table 8.
Best and last accuracy result for VGG-based networks without adversarial attack. The best results are highlighted in bold text.

Table 9.
Best and last accuracy result for VGG-based networks with FGSM attack. The best results are highlighted in bold text.
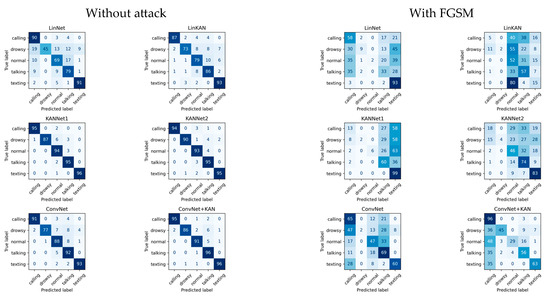
Figure 13.
Confusion matrices for the low-complexity networks.
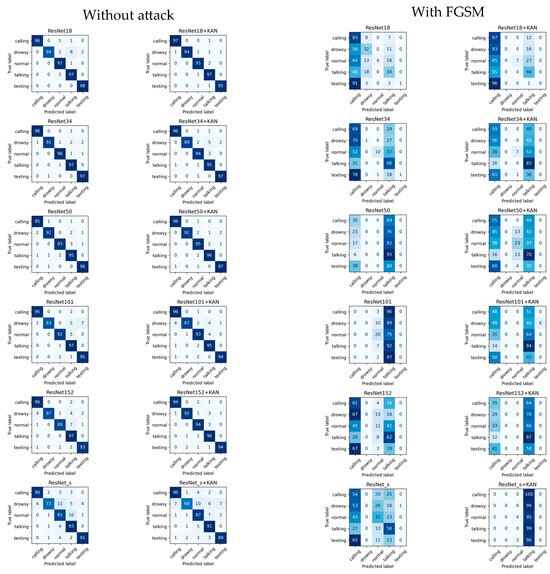
Figure 14.
Confusion matrices for ResNet-based networks.
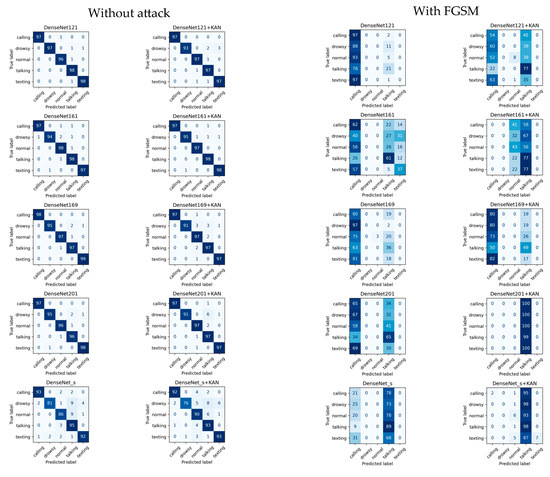
Figure 15.
Confusion matrices for DenseNet-based networks.
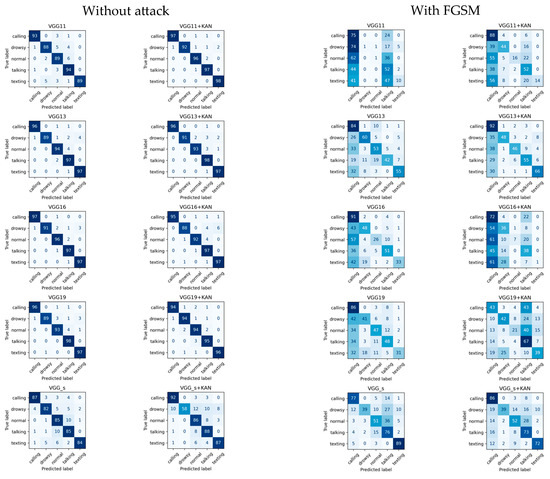
Figure 16.
Confusion matrices for VGG-based networks.
Table 2 shows the final results for the low-complexity models when the attack method is not used. The best result was obtained with the KANNet1 solution; however, the ConvNet+KAN solution performed best in the last epoch accuracy. It can be seen that the LinKAN, KANNet1, and KANNet2 methods have also been used to improve the LinNet model. The same can be observed for convolution-based solutions. In both cases, the ConvNet+KAN network improves over the ConvNet model.
Table 3 shows the results for low-complexity solutions using the FGSM technique. In both cases (best accuracy and last accuracy), the ConvNet+KAN solution achieved the best results. Regarding best accuracy, the LinKAN model did not improve on the LinNet solution. The KANNet1 and ConvNet+KAN models improved for the last result thanks to the KAN-based layer.
Table 4 summarizes the final results of the ResNet models without the attack method. The ResNet34 solution performed best, while the ResNet101+KAN solution was the best for the last epoch. Regarding best efficiency, half of the cases could be improved with the KAN layer (ResNet18+KAN, ResNet101+KAN, and ResNet152+KAN). For the last epoch, the situation was similar, but ResNet34+KAN was in this category instead of ResNet18+KAN.
When using the FGSM attack method, the effect of the KAN layer is visible. This is shown in Table 5. In both cases, the ResNet18+KAN method was the best, and in both cases, of the models tested improved with the KAN layer. In the case of the best efficiency test, only ResNet_s+KAN showed no improvement, and based on the results of the last epoch, only ResNet101+KAN did not result in better efficiency.
Table 6 shows the results of the DenseNet-based solutions, where the DenseNet169 model gave the best results. However, for the last epoch, the DenseNet201+KAN method was the best. For the best epoch, better efficiency was achieved with the KAN layer in of the cases. The DenseNet161+KAN and DenseNet201+KAN models achieved this. For the accuracy of the last epoch, the result is , where the DenseNet169+KAN method is added to the set of DenseNet161+KAN and DenseNet201+KAN.
Table 7 shows the training results of the DenseNet model with the FGSM attack. The best results were obtained using the KAN method. The DenseNet201+KAN method was the best for both the best and last epoch accuracy. For the best performance, only DenseNet161+KAN did not yield any improvement. Thus, an improvement was achieved in of the cases. For the efficiency of the last epoch, the KAN-based method gave better results in all cases.
Table 8 summarizes the results for VGG-type networks without attack. Here, the least increase in efficiency was achieved. In both cases, the VGG11 network showed the best efficiency. For the best accuracy, only VGG_s+KAN improved efficiency (20%). For the last epoch accuracy, efficiency improved for VGG16+KAN and VGG19+KAN ().
Table 9 shows the efficiencies measured for the FGSM attack on the VGG models. In both cases, the VGG13 model provided the best accuracy. However, in the case of the best accuracy, the appearance of the KAN-based layer improved the results in three cases (VGG11+KAN, VGG19+KAN, and VGG_s+KAN), which means 20%. However, for the efficiency of the last epoch, only the VGG_s+KAN method could improve the results by .
Table 10, Table 11, Table 12, Table 13 and Table 14 illustrate each neural network’s run times per epoch. In all cases, we see the times measured in both traditional and KAN-based solutions. The measurements were performed on RTX A4000 GPUs under the same conditions. For low-complexity solutions, KAN-based networks always had shorter runtimes. This is no longer the case for more complex networks. However, in all cases, the difference in runtimes is minimal.

Table 10.
Training time per epoch for the low-complexity networks. The best results are highlighted in bold text.

Table 11.
Training time per epoch for the ResNet-based networks. The best results are highlighted in bold text.

Table 12.
Training time per epoch for the DenseNet-based networks. The best results are highlighted in bold text.

Table 13.
Training time per epoch for the VGG-based networks. The best results are highlighted in bold text.

Table 14.
Summary of best results by network architecture from training data.
4. Discussion
Our study contributes to the discussion on transportation safety by utilizing advanced machine learning models, such as KAN layers, in driver monitoring systems. It emphasizes the importance of hardware (sensors and cameras) and software (machine learning algorithms) in enhancing road safety.
The results indicated that networks incorporating KAN layers, such as KANNet1 and ConvNet+KAN, generally outperformed their counterparts without these layers, especially in clean-data scenarios (Table 14). For instance, KANNet1 achieved a clean-data accuracy of 95.08%, compared to 79.19% for the basic LinNet model, demonstrating a substantial improvement of nearly 16%. This suggests that the flexibility and adaptability of KAN layers could make them particularly valuable in dynamic real-world applications like driver monitoring, where conditions can vary greatly.
The study also highlights the improved adversarial robustness of models incorporating KAN layers. For example, ResNet18+KAN showed a robustness increase, maintaining 59.96% accuracy under the FGSM attack compared to only 28.21% for the standard ResNet18. This aspect is critical as it reflects the systems’ robustness against potential cyber threats, crucial for safety-critical applications like autonomous driving. These are not realistic efficiency values for real-world use cases; however, the attack methods used in this study apply extreme noise levels to the input, significantly higher than what is typically experienced in real-life situations (such as lens contamination, partial coverage, or glare due to direct sunlight). The aim is to demonstrate performance under these extreme conditions and to identify which method performs better in such scenarios.
The DenseNet and ResNet models have fewer parameters, with approximately 8 million and 25 million, respectively. In the case without attacks, the improvement provided by the KAN method is significant, reaching 40% for DenseNet and 50% for ResNet. In contrast, the VGG model, which has around 138 million parameters, sees only a 20% improvement with KAN.
When considering the FGSM attack scenario, the VGG model performs much better, achieving a 60% improvement, three times higher than its performance without the FGSM attack. The enhancements for DenseNet and ResNet in this context are more minor. For DenseNet, the improvement with the KAN-based method rises from 40% to 80%, while for ResNet, it increases from 50% to 83.33% compared to the traditional approach.
However, the varying performance across different architectures indicates the need for further research. Future studies should explore different KAN layer configurations, their resilience to other attack techniques, testing their performance in other real-world scenarios, and their integration with various neural network types. Additionally, examining the scalability of these solutions in larger datasets is essential for their practical application in diverse driving environments.
Some challenges need to be addressed. While KAN layers improve model performance in specific scenarios, they also add complexity to the network architecture. Future studies need to balance this complexity with the computational cost, especially for real-time applications in driver monitoring. The study’s results are promising but indicate that performance can significantly vary depending on the conditions and specific tasks. Extensive testing under different environmental conditions and driving scenarios would be crucial to validate the general applicability of the findings. Integrating advanced ML models like those tested in this study with existing transportation infrastructure and systems poses practical challenges. Data compatibility, system interoperability, and user acceptance need careful consideration.
5. Conclusions
This study highlights the potential of integrating KAN layers into neural network architectures to enhance the accuracy and robustness of driver monitoring systems. The improved performance of these networks, especially in terms of their resilience against adversarial attacks (specifically FGSM), demonstrates their suitability for use in safety-critical areas of transportation. However, the KAN does not consistently outperform traditional solutions and currently demands more resources than they do, and further research must assess its scalability and effectiveness in various real-world scenarios. Although this research concentrated on the performance of KAN-based solutions, future iterations could incorporate feedback loops with additional models.
In summary, integrating machine learning innovations, such as KANs, into transportation safety initiatives represents a promising opportunity that could significantly enhance the effectiveness of future driver monitoring systems.
Author Contributions
Conceptualization, J.H. and V.N.; methodology, J.H. and V.N.; software, J.H.; validation, J.H. and V.N.; formal analysis, J.H. and V.N.; investigation, J.H. and V.N.; resources, J.H. and V.N.; data curation, J.H. and V.N.; writing—original draft preparation, J.H., G.K., M.S., D.K., S.F. and V.N.; writing—review and editing, J.H., M.S., D.K., G.K., S.F. and V.N.; visualization, J.H.; supervision, J.H., M.S., D.K., G.K., S.F. and V.N.; project administration, J.H., S.F. and V.N.; funding acquisition, J.H., S.F. and V.N. All authors have read and agreed to the published version of the manuscript.
Funding
This research received no specific grant from any funding agencies.
Data Availability Statement
All data of this research were presented in the article.
Acknowledgments
The research was supported by the European Union within the framework of the National Laboratory for Artificial Intelligence (RRF-2.3.1-21-2022-00004).
Conflicts of Interest
The authors declare no conflicts of interest.
Correction Statement
This article has been republished with a minor correction to the existing affiliation information. This change does not affect the scientific content of the article.
References
- Blades, L.; Douglas, R.; Early, J.; Lo, C.Y.; Best, R. Advanced Driver-Assistance Systems for City Bus Applications. SAE Tech. Pap. 2020, 4, 274–284. [Google Scholar] [CrossRef]
- European Commission. Eurostat Passenger Transport by Buses and Coaches by Type of Transport—Vehicles Registered in the Reporting Country; European Commission: Brussels, Belgium, 2023. [Google Scholar]
- European Commission. Road Safety Annual Statistical Report on Road Safety in the EU 2025; European Commission: Brussels, Belgium, 2025. [Google Scholar]
- Korpinen, L.; Pääkkönen, R. Accidents and Close Call Situations Connected to the Use of Mobile Phones. Accid. Anal. Prev. 2012, 45, 75–82. [Google Scholar] [CrossRef] [PubMed]
- Hersh, J.; Lang, B.J.; Lang, M. Car Accidents, Smartphone Adoption and 3G Coverage. J. Econ. Behav. Organ. 2022, 196, 278–293. [Google Scholar] [CrossRef]
- Hallac, D.; Sharang, A.; Stahlmann, R.; Lamprecht, A.; Huber, M.; Roehder, M.; Sosič, R.; Leskovec, J. Driver Identification Using Automobile Sensor Data from a Single Turn. In Proceedings of the IEEE Conference on Intelligent Transportation Systems, Proceedings, ITSC, Rio de Janeiro, Brazil, 1–4 November 2016; pp. 953–958. [Google Scholar] [CrossRef]
- Zhang, Z.; Tang, Y.; Zhao, S.; Zhang, X. Real-Time Surface EMG Pattern Recognition for Hand Gestures Based on Support Vector Machine. In Proceedings of the IEEE International Conference on Robotics and Biomimetics, ROBIO, Dali, China, 6–8 December 2019; pp. 1258–1262. [Google Scholar] [CrossRef]
- Campos-Ferreira, A.E.; Lozoya-Santos, J.d.J.; Tudon-Martinez, J.C.; Mendoza, R.A.R.; Vargas-Martínez, A.; Morales-Menendez, R.; Lozano, D. Vehicle and Driver Monitoring System Using On-Board and Remote Sensors. Sensors 2023, 23, 814. [Google Scholar] [CrossRef]
- Fischer, S.; Szürke, S.K. Detection Process Of Energy Loss In Electric Railway Vehicles. Facta Univ. Ser. Mech. Eng. 2022, 21, 81–99. [Google Scholar] [CrossRef]
- Maslać, M.; Antić, B.; Lipovac, K.; Pešić, D.; Milutinović, N. Behaviours of Drivers in Serbia: Non-Professional versus Professional Drivers. Transp. Res. Part F Traffic Psychol. Behav. 2018, 52, 101–111. [Google Scholar] [CrossRef]
- Fancello, G.; Daga, M.; Serra, P.; Fadda, P.; Pau, M.; Arippa, F.; Medda, A. An Experimental Analysis on Driving Behaviour for Professional Bus Drivers. Transp. Res. Procedia 2020, 45, 779–786. [Google Scholar] [CrossRef]
- Karimi, S.; Aghabayk, K.; Moridpour, S. Impact of Driving Style, Behaviour and Anger on Crash Involvement among Iranian Intercity Bus Drivers. IATSS Res. 2022, 46, 457–466. [Google Scholar] [CrossRef]
- Bonfati, L.V.; Mendes Junior, J.J.A.; Siqueira, H.V.; Stevan, S.L. Correlation Analysis of In-Vehicle Sensors Data and Driver Signals in Identifying Driving and Driver Behaviors. Sensors 2023, 23, 263. [Google Scholar] [CrossRef]
- Biondi, F.N.; Saberi, B.; Graf, F.; Cort, J.; Pillai, P.; Balasingam, B. Distracted Worker: Using Pupil Size and Blink Rate to Detect Cognitive Load during Manufacturing Tasks. Appl. Ergon. 2023, 106, 103867. [Google Scholar] [CrossRef]
- Underwood, G.; Chapman, P.; Brocklehurst, N.; Underwood, J.; Crundall, D. Visual Attention While Driving: Sequences of Eye Fixations Made by Experienced and Novice Drivers. Ergonomics 2003, 46, 629–646. [Google Scholar] [CrossRef] [PubMed]
- Nagy, V.; Földesi, P.; Istenes, G. Area of Interest Tracking Techniques for Driving Scenarios Focusing on Visual Distraction Detection. Appl. Sci. 2024, 14, 3838. [Google Scholar] [CrossRef]
- Sigari, M.H.; Fathy, M.; Soryani, M. A Driver Face Monitoring System for Fatigue and Distraction Detection. Int. J. Veh. Technol. 2013, 2013, 263983. [Google Scholar] [CrossRef]
- Biondi, F.; Coleman, J.R.; Cooper, J.M.; Strayer, D.L. Average Heart Rate for Driver Monitoring Systems. Int. J. Hum. Factors Ergon. 2016, 4, 282–291. [Google Scholar] [CrossRef]
- Fujiwara, K.; Abe, E.; Kamata, K.; Nakayama, C.; Suzuki, Y.; Yamakawa, T.; Hiraoka, T.; Kano, M.; Sumi, Y.; Masuda, F.; et al. Heart Rate Variability-Based Driver Drowsiness Detection and Its Validation With EEG. IEEE Trans. Biomed. Eng. 2019, 66, 1769–1778. [Google Scholar] [CrossRef]
- Dehzangi, O.; Rajendra, V.; Taherisadr, M. Wearable Driver Distraction Identification On-the-Road via Continuous Decomposition of Galvanic Skin Responses. Sensors 2018, 18, 503. [Google Scholar] [CrossRef]
- Balam, V.P.; Chinara, S. Development of Single-Channel Electroencephalography Signal Analysis Model for Real-Time Drowsiness Detection: SEEGDD. Phys. Eng. Sci. Med. 2021, 44, 713–726. [Google Scholar] [CrossRef]
- Rahman, N.A.A.; Mustafa, M.; Sulaiman, N.; Samad, R.; Abdullah, N.R.H. EMG Signal Segmentation to Predict Driver’s Vigilance State. Lect. Notes Mech. Eng. 2022, 29–42. [Google Scholar] [CrossRef]
- Bouhsissin, S.; Sael, N.; Benabbou, F.; Soultana, A. Enhancing Machine Learning Algorithm Performance through Feature Selection for Driver Behavior Classification. Indones. J. Electr. Eng. Comput. Sci. 2024, 35, 354–365. [Google Scholar] [CrossRef]
- Soultana, A.; Benabbou, F.; Sael, N.; Bouhsissin, S. Driver Inattention Detection System Using Multi-Task Cascaded Convolutional Networks. IAES Int. J. Artif. Intell. 2024, 13, 4249–4262. [Google Scholar] [CrossRef]
- Sim, S.; Kim, C. Proposal of a Cost-Effective and Adaptive Customized Driver Inattention Detection Model Using Time Series Analysis and Computer Vision. World Electr. Veh. J. 2024, 15, 400. [Google Scholar] [CrossRef]
- Montanelli, H.; Yang, H. Error Bounds for Deep ReLU Networks Using the Kolmogorov—Arnold Superposition Theorem. Neural Netw. 2020, 129, 1–6. [Google Scholar] [CrossRef] [PubMed]
- Lai, M.-J.; Shen, Z. The Kolmogorov Superposition Theorem Can Break the Curse of Dimensionality When Approximating High Dimensional Functions. arXiv 2021, arXiv:2112.09963. [Google Scholar]
- Liu, Z.; Wang, Y.; Vaidya, S.; Ruehle, F.; Halverson, J.; Soljačić, M.; Hou, T.Y.; Tegmark, M. KAN: Kolmogorov-Arnold Networks. arXiv 2024, arXiv:2404.19756. [Google Scholar]
- Altarabichi, M.G. DropKAN: Regularizing KANs by Masking Post-Activations. arXiv 2024, arXiv:2407.13044. [Google Scholar]
- Bodner, A.D.; Tepsich, A.S.; Spolski, J.N.; Pourteau, S. Convolutional Kolmogorov-Arnold Networks. arXiv 2024, arXiv:2406.13155. [Google Scholar]
- Sidharth, S.S.; Keerthana, A.R.; Gokul, R.; Anas, K.P. Chebyshev Polynomial-Based Kolmogorov-Arnold Networks: An Efficient Architecture for Nonlinear Function Approximation. arXiv 2024, arXiv:2405.07200. [Google Scholar]
- Yu, R.; Yu, W.; Wang, X. KAN or MLP: A Fairer Comparison. arXiv 2024, arXiv:2407.16674. [Google Scholar]
- Huang, G.; Liu, Z.; van der Maaten, L.; Weinberger, K.Q. Densely Connected Convolutional Networks. In Proceedings of the IEEE Conference on Computer Vision and Pattern Recognition, Las Vegas, NV, USA, 27–30 June 2016. [Google Scholar]
- He, K.; Zhang, X.; Ren, S.; Sun, J. Deep Residual Learning for Image Recognition. In Proceedings of the IEEE Conference on Computer Vision and Pattern Recognition, Boston, MA, USA, 7–12 June 2015. [Google Scholar]
- Simonyan, K.; Zisserman, A. Very Deep Convolutional Networks for Large-Scale Image Recognition. arXiv 2014, arXiv:1409.1556. [Google Scholar]
- Kurakin, A.; Goodfellow, I.; Bengio, S. Adversarial Examples in the Physical World. In Artificial Intelligence Safety and Security; CRC Press: Boca Raton, FL, USA, 2016. [Google Scholar]
- Kingma, D.P.; Ba, J. Adam: A Method for Stochastic Optimization. arXiv 2014, arXiv:1412.6980. [Google Scholar]
Disclaimer/Publisher’s Note: The statements, opinions and data contained in all publications are solely those of the individual author(s) and contributor(s) and not of MDPI and/or the editor(s). MDPI and/or the editor(s) disclaim responsibility for any injury to people or property resulting from any ideas, methods, instructions or products referred to in the content. |
© 2025 by the authors. Licensee MDPI, Basel, Switzerland. This article is an open access article distributed under the terms and conditions of the Creative Commons Attribution (CC BY) license (https://creativecommons.org/licenses/by/4.0/).