Abstract
Mango productivity suffers greatly from leaf diseases, leading to economic and food security issues. Current visual inspection methods are slow and subjective. Previous Deep-Learning (DL) solutions have shown promise but suffer from imbalanced datasets, modest generalization, and limited interpretability. To address these challenges, this study introduces the ViX-MangoEFormer, which combines convolutional kernels and self-attention to effectively diagnose multiple mango leaf conditions in both balanced and imbalanced image sets. To benchmark against ViX-MangoEFormer, we developed a stacking ensemble model (MangoNet-Stack) that utilizes five transfer learning networks as base learners. All models were trained with Grad-CAM produced pixel-level explanations. In a combined dataset of 25,530 images, ViX-MangoEFormer achieved an F1 score of 99.78% and a Matthews Correlation Coefficient (MCC) of 99.34%. This performance consistently outperformed individual pre-trained models and MangoNet-Stack. Additionally, data augmentation has improved the performance of every architecture compared to its non-augmented version. Cross-domain tests on morphologically similar crop leaves confirmed strong generalization. Our findings validate the effectiveness of transformer attention and XAI in mango leaf disease detection. ViX-MangoEFormer is deployed as a web application that delivers real-time predictions, probability scores, and visual rationales. The system enables growers to respond quickly and enhances large-scale smart crop health monitoring.
1. Introduction
Mango is a tropical fruit with global significance, generating over USD 30 billion in annual revenue and supporting the livelihoods of more than 20 million farmers worldwide [1,2]. Despite its economic and nutritional importance, mango cultivation faces serious challenges due to leaf diseases such as Anthracnose, Powdery Mildew, and Bacterial Canker, which can lead to yield losses of up to 30% [3]. In India alone, these diseases result in annual financial losses ranging from USD 50 million to USD 100 million [4], while on a global scale, plant diseases cause over USD 5 billion in losses each year [5]. The implications for food security are also concerning. Mangoes contribute significantly to local diets by providing essential vitamins and minerals. Consequently, a decline in mango production not only diminishes dietary diversity but also threatens food supply in regions where agriculture is a primary source of income.
Traditional methods of detecting plant diseases rely on experts who conduct manual visual inspections. Research shows that the accuracy of these assessments for early-stage mango leaf diseases can fall to 65% [6]. This decline in accuracy is primarily due to the inherent subjectivity and variability in human judgment. Additionally, evaluations by different experts often produce inconsistent results, leading to unreliable diagnoses. On average, an expert can spend up to 30 minutes inspecting a single tree [7]. As a result, they can examine only about 20 trees per day, which is insufficient in regions with large mango plantations. This slow inspection process not only delays the identification of disease outbreaks but also hinders timely intervention. The heavy reliance on expert knowledge also limits the scalability of traditional methods. In many rural areas, fewer than 37% of smallholder farms have regular access to trained agricultural diagnosticians [8]. This lack of access increases the risk of undetected diseases, contributing to additional yield losses estimated at around 10–15% over the growing season [9].
The automated classification of mango leaf diseases through DL and ensemble methods has become the focus of several research investigations [10,11]. However, each of these approaches has its limitations. CNNs excel at extracting features from images and can achieve high accuracy rates. However, they require large annotated datasets for training, which are difficult to gather in agriculture. Additionally, training these models demands significant computational resources and time, making them less accessible in low-resource settings. Transfer learning employs pre-trained models to reduce the need for extensive data and expedite training. This is particularly useful when labeled data are scarce, allowing for more efficient adaptation in detecting mango leaf diseases [12]. However, differences between the pre-trained datasets and actual mango leaf images can lead to performance issues. Fine-tuning is necessary to accurately capture the specific features of these diseases. Their “black-box” nature can also impede understanding and trust in their predictions [13]. ensemble methods have also been proposed to enhance classification scores by combining predictions from multiple models. However, managing multiple models increases computational complexity [14], making real-time deployment challenging in rural areas. ViTs have become a promising alternative to these models for image classification, as they effectively capture long-range dependencies and global context. They use self-attention mechanisms to evaluate relationships across the entire image and can improve the detection of subtle disease patterns on plant leaves. However, ViTs have not been widely adopted for mango leaf disease classification due to the lack of large annotated datasets and their higher computational requirements.
Several research gaps and challenges remain in the field of mango leaf disease classification. Firstly, many studies are limited by datasets that are not only small in size but also lack diversity. This often leads to issues like severe domain shifts and overfitting when models are trained on region-specific data. As a result, their ability to generalize across different agroecological zones is restricted [15]. Furthermore, there is a prevalent problem of class imbalance, where certain disease types are underrepresented in the datasets. This skewed distribution negatively impacts recall and precision, especially for rare disease categories [16]. The ambiguity of transfer learning architectures adds to the challenge of interpretability. The absence of intrinsic explainability mechanisms limits their usefulness in critical agricultural decision-making processes where trust and clarity are essential [17,18]. Moreover, while ViTs provide enhanced contextual feature representation, their high computational demands and significant inference latency hinder real-time deployment in resource-constrained field environments [19]. Lastly, although some mobile-based diagnostic applications have been created, they often lack model interpretability and do not incorporate rigorous post hoc explainability techniques. Consequently, there is an urgent need for a reliable diagnostic tool in precision agriculture.
This study aims to develop an interpretable and computationally efficient DL model for mango leaf disease classification, ensuring high accuracy, transparency, and real-time deployment. The primary objectives of this study are as follows:
- Develop a transformer-based classification system that combines convolutional layers and self-attention to effectively identify different mango leaf diseases.
- Improve the discriminatory power of the model by integrating statistical texture descriptors derived from the GLCM.
- Embed explainable features into the model to provide visual explanations for predictions, enhancing user trust and supporting decision-making in agriculture.
- Address the limitations of single-dataset training by validating the model on heterogeneous, multi-regional datasets to ensure robust generalization and adaptability to varying agroecological conditions.
- Integrate the XAI-enabled transformer model within a web application for an accessible and interpretable tool for real-time mango leaf disease detection.
An overview of the proposed pipeline is presented in Figure 1. The approach utilizes four datasets—two balanced and two imbalanced—to ensure diversity. Preprocessing involves anisotropic diffusion filtering, followed by data augmentation to improve generalization. GLCM-based texture features are fused with high-level features extracted by transfer learning models and the proposed ViX-MangoEFormer architecture. The MangoNet-Stack ensemble learning is implemented by utilizing base learners such as ResNest, ResNeXt, CapsuleNet, and EfficientNet-B8. Features from these models are pooled and concatenated, then passed to a Flatten layer functioning as the meta-learner. All the models are compared to our proposed ViX-MangoEFormer model, a transformer-based architecture that uses MBConv4D and MBConv3D modules to capture local and global features in diseased leaf images. Multi-Head Self-Attention (MHSA) was used to improve the model’s capability to learn long-range dependencies. Finally, fully connected layers map the extracted feature embeddings to the corresponding mango leaf disease classes. Grad-CAM was used to provide visual explanations that enhance transparency and build trust among end-users. The best-performing model is integrated into a web platform that outputs disease classes, prediction probabilities, and Grad-CAM heatmaps for transparent interpretation.
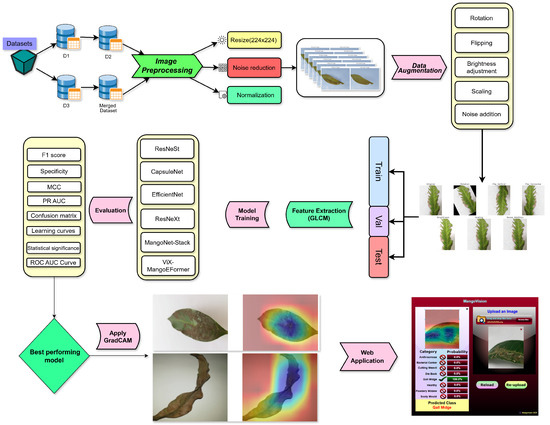
Figure 1.
Overview of the proposed methodology.
While Vision Transformers have shown promise in agricultural image classification tasks [20,21,22], most existing models face challenges, including high computational demands, inadequate fine-grained texture modeling, and limited applicability for real-time use. Previous approaches [19,23,24] often require large-scale training data, are difficult to interpret, and tend to overlook the integration of handcrafted domain-relevant features. Unlike existing transformer-based studies that consider explainability as an afterthought [25,26,27], our MangoEFormer model features native Grad-CAM integration within a web interface. This ensures that disease prediction outputs are not only accurate and fast but also transparent and actionable. Furthermore, our system demonstrated superior adaptability by validating performance across multi-source datasets, effectively addressing the domain shift. Our key contributions are as follows:
- Developed an extensive mango leaf disease classification dataset comprising 25,530 high-quality images across eight distinct classes by combining four publicly available datasets. Its improved data diversity and sample size helped our study achieve state-of-the-art performance over prior studies.
- Proposed a dual approach featuring a transfer learning-based ensemble MangoNet-Stack and a transformer-based ViX-MangoEFormer model, addressing key limitations in previous studies and achieving superior feature extraction and classification performance.
- Compared the performance of all models on both augmented and non-augmented training sets, and on balanced versus imbalanced datasets, to thoroughly assess the impact of data augmentation and distribution on model accuracy.
- Conducted class-wise error analysis to identify and mitigate misclassification issues and validated the optimized model on different crop leaves exhibiting similar disease classes as mango.
- Deployed the optimized model via a web interface that delivers real-time disease detection along with probability scores and visual explanations.
The rest of the paper is organized as follows: Section 2 reviews the research on using AI for classifying mango leaf diseases. Section 3 outlines the methodology, including details about the dataset, feature extraction methods, and model architecture. Section 4 presents the experimental results, evaluation metrics, and performance comparisons. Section 5 discusses the findings, their implications, and practical applications. It also addresses the study’s limitations and suggests directions for future research. Finally, Section 6 concludes with key findings and final thoughts.
2. Related Works
Transfer learning, hybrid models, and explainable AI (XAI) have been extensively applied to recognize mango leaf diseases, achieving state-of-the-art results. This section organizes previous studies to highlight their contributions, limitations, and how they inform the development of ViX-MangoEFormer.
2.1. Transfer Learning Approaches
Transfer learning has become a cornerstone in plant pathology due to its ability to generalize across limited datasets. Varma et al. [28] and Swapno et al. [29] applied pretrained CNNs, such as InceptionV3 and EfficientNetV2L, on a Kaggle dataset of 4000 mango leaf images, reporting accuracies of 99.87% and 96.87%, respectively. Rizvee et al. [30] introduced LeafNet on the MangoLeafBD dataset with 98.55% accuracy, focusing on lower complexity. Similarly, Ghosh et al. [31] used EfficientNet-B0 on 5000 images and achieved 99.91% accuracy. However, these studies are predominantly trained on region-specific or artificially augmented datasets, resulting in limited real-world applicability and generalization under diverse field conditions—a recurring issue across mango disease detection studies [32,33].
2.2. Ensemble and Hybrid Approaches
To address overfitting and performance degradation, researchers have explored ensemble models. Bezabh et al. [34] integrated GoogLeNet and VGG16 with Mask R-CNN for segmentation, achieving 99.21% accuracy on 4721 augmented images. Gautam et al. [35] proposed the Ensemble Stacked Deep Neural Network (ESDNN), combining CNN outputs through logistic regression, reaching 98.57% accuracy on a small dataset. Seetha et al. [36] combined handcrafted features (LBP, LDP, LOOP) with neural networks optimized via CO-GWO to outperform SVM and k-NN. Ali et al. [37] constructed a dense ensemble of EfficientNetB0/B3, DenseNet201, and InceptionResNetV2, achieving 99.89% accuracy. These methods show strong performance but often have large parameter footprints, complicating deployment and scalability.
2.3. Vision Transformers and Emerging Architectures
Transformer-based models have gained attention for their capacity to capture long-range dependencies and global patterns. Islam et al. [38] introduced WaveVisionNet, integrating attention blocks and dilated convolutions, achieving 96.11% on public data and 95.21% on MangoFolioBD. Salamai et al. [39] developed a Visual Modulation Network (VMN), which applied patch embeddings and modulator blocks for 99.23% accuracy on MangoLeafBD. Ramadan et al. [40] fused ViT-B/16, BiT-M-R50x1, and CNNs using CycleGAN-based augmentation, achieving perfect binary classification accuracy. Rani et al. [41] used ConvNeXtXLarge for pest/pathogen classification on over 60,000 images, reporting over 99% accuracy across datasets. While powerful, these models are computationally expensive and remain opaque in decision-making, which limits their transparency and usability in real-time, low-power environments.
2.4. Explainable AI Approaches
Interpretability is vital for trust in AI systems in agriculture. Patel et al. [42] employed Grad-CAM in a Total Variation Filter and VMD framework using DenseNet121 and VGG19, reaching 98.85% accuracy. Raval et al. [43] combined MobileNetV3 and EfficientNetV2B3 in LITENET, applying LIME for local explanation, achieving up to 99.89% accuracy. Chang et al. [44] introduced the Edge-Feature Guidance (EFG) module to enhance Swin Transformer transparency, achieving 99.5% accuracy on cabbage and 98.3% on wheat datasets using Grad-CAM. While effective, these approaches apply XAI post hoc, meaning explanations are generated separately after inference. In contrast, our approach natively integrates Grad-CAM into the ViX-MangoEFormer pipeline, offering real-time interpretability within the deployed web interface.
2.5. Deployment-Oriented Solutions and Remaining Challenges
Several works have demonstrated mobile/web deployment for plant disease detection. Rahaman et al. [45] built a smartphone app for mango diagnosis and pesticide suggestions, achieving 97.81% accuracy using DenseNet169. Hossain et al. [46] optimized a DeiT model for mobile deployment, reporting 99.75% accuracy. Islam et al. [47] deployed DeepCrop—a CNN-based web tool using ResNet50 and PlantVillage data—for real-time monitoring. Additional tools like LEAFLET [48] and MVGG16 [49] demonstrated practical feasibility with accuracies above 94% for various crops. However, these applications still suffer from limited transparency, over-reliance on synthetic data, and lack of support for multi-class classification across broader datasets.
2.6. Summary of Limitations and Research Gap
Several major limitations remain evident in the existing literature. First, many studies depend on region-specific, class-imbalanced, or synthetically augmented datasets, which restricts the generalizability of their models across varied field conditions. Second, most of the research relies on post hoc explainability methods that are not integrated into the inference process. As a result, they fail to provide real-time insights. Third, numerous high-performing models are computationally intensive, making them unsuitable for deployment in resource-constrained agricultural environments. These challenges underscore the need for a unified framework that achieves high accuracy, interpretability, and practical usability. In response, we propose a hybrid architecture that merges EfficientFormer and Vision Transformer modules, enhanced with GLCM-based texture features. This model enables real-time inference and includes native Grad-CAM integration, serving as a tool for field-ready disease diagnosis.
3. Methodology
3.1. Data Description
Initially, three publicly available datasets were utilized in this study to train and evaluate the classifiers. Each dataset covers seven mango leaf diseases alongside healthy samples. Each disease presents distinct visual symptoms, such as black necrotic patches for Anthracnose, water-soaked spots that turn into cankers for Bacterial Canker, and pimple-like protrusions caused by Gall Midge. Additionally, a merged dataset was created by combining all three datasets.
The MangoLeafBD [50] dataset (D1) is a publicly available benchmark designed for classifying diseased and healthy mango leaves. Initially, 1800 unique mango leaves were collected. To enhance the dataset’s robustness, image augmentation techniques such as zooming and rotation were employed, resulting in a total of 4000 samples. The final dataset was categorized into eight classes, as shown in Figure 2, which includes seven types of diseases and one category for healthy leaves. All images were manually labeled by agriculture experts. The images were collected from four mango orchards across Bangladesh: Sher-e-Bangla Agricultural University in Dhaka, Jahangirnagar University in Savar, Udaypur Village in Rajbari District, and Itakhola Village in Nilphamari District. Each image was captured using a mobile phone camera under controlled conditions to ensure a white background and minimal noise interference.
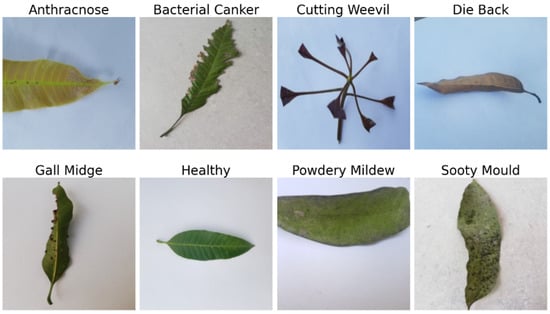
Figure 2.
Representative samples from the MangoLeafBD Dataset (D1).
The Mango Leaf Disease Dataset [51] (D2) was developed by researchers to support the ML-based classification of mango leaf diseases and to aid in plant health monitoring. It contains 2336 processed images organized into eight categories that include seven distinct leaf diseases and one healthy leaf category. Figure 3 depicts sample image from each class. The dataset was compiled through comprehensive fieldwork in mango orchards located in Kashinathpur (Pabna) and Changao (Savar, Dhaka), Bangladesh. Image collection took place over 20 days, from 15 October to 4 November 2024, using a mobile phone camera to capture high-quality images in natural conditions. To enhance the dataset size for DL applications, data augmentation techniques were employed, bringing the total number of images to 12,730. This dataset is especially valuable for researchers and agricultural experts developing models for automated plant disease classification.
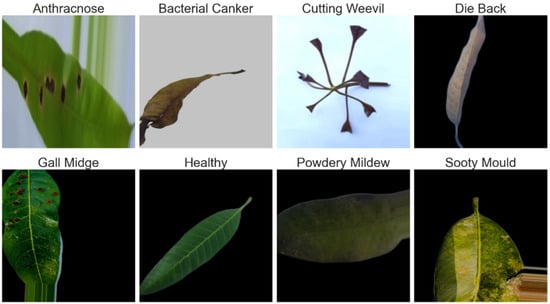
Figure 3.
Representative samples from each class of the D2 dataset.
The MLD24 [52] dataset (D3) is a balanced dataset intended for classifying mango leaf diseases. It comprises 6400 images, evenly distributed across eight classes, similar to the D1 and D2 datasets. The images were gathered from various mango orchards in Kushtia, Bangladesh, ensuring a diverse representation of leaf samples (Figure 4). Each class contains 800 images, resulting in a balanced dataset that is ideal for training ML models without any class bias. The images were originally captured using an iPhone SE at a high resolution of 3024 × 4032 pixels. To optimize storage and computational efficiency, the images have been resized to 240 × 240 pixels and saved in JPG format. This dataset is particularly well-suited for developing automated disease detection models, supporting precision agriculture by enabling the early identification of diseases.
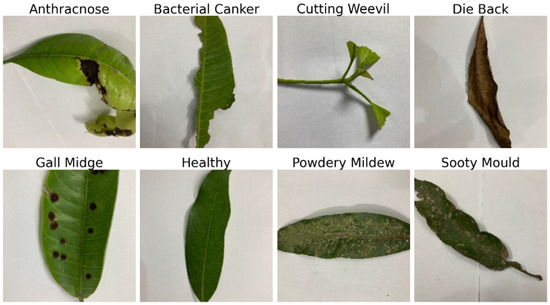
Figure 4.
Representative samples from each class of the D3 dataset.
Lastly, we created a merged dataset (D4) by combining datasets D1, D2, and D3. Since all three datasets share the same class labels, this merging resulted in a unified and well-structured dataset suitable for our study, as shown in Figure 5. The D4 dataset consists of a total of 25,530 images, obtained from the original datasets as follows: 4000 images from D1, 15,066 images from D2, and 6400 images from D3. This dataset captures a broader range of disease variations and environmental conditions by incorporating images from various geographical locations across Bangladesh (Dhaka, Rajbari, Nilphamari, Kushtia, Pabna, and Savar). Each category within D4 contains a large number of images, ensuring unbiased model training. Specifically, it includes 3834 images of Bacterial Canker, 3533 images of Gall Midge, 3049 images of Anthracnose, 2883 images of Cutting Weevil, 2625 images of Sooty Mould, 2580 images of Die Back, 2550 images of Healthy Leaves, and 2076 images of Powdery Mildew. The increased class diversity, balanced distribution, and larger sample size make this dataset an ideal resource for DL-based plant disease detection.
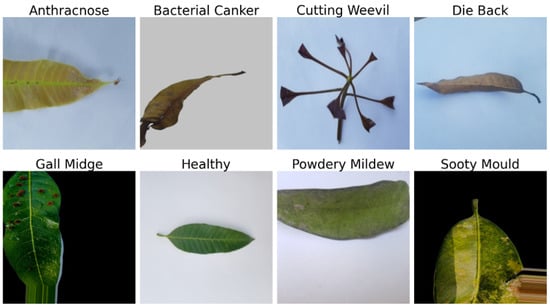
Figure 5.
Representative samples from each class of the D4 dataset.
3.2. Data Preprocessing
3.2.1. Resizing
To ensure consistent input dimensions for the DL models, all images were resized to pixels. The resizing process employed the Bilinear Interpolation method, which calculates a weighted average of the pixel intensities from the four nearest neighbors of the original image. Let represent the intensity of the pixel at coordinates in the original image. The intensity at the corresponding coordinates in the resized image, , is computed as shown in Equation (1), where are the interpolation weights and are the coordinates of the neighboring pixels.
3.2.2. Noise Reduction
To reduce noise while preserving critical image features such as edges, Anisotropic Diffusion was applied. This method iteratively smooths the image while inhibiting diffusion across edges, as shown in Figure 6. The process is mathematically defined by Equation (2). Here it represents the pixel intensity; t is the time step, ∇ is the gradient operator, and is the diffusion coefficient. The coefficient controls the extent of smoothing and is defined as a function of the gradient magnitude , ensuring that diffusion is inhibited at edges where the gradient is high.
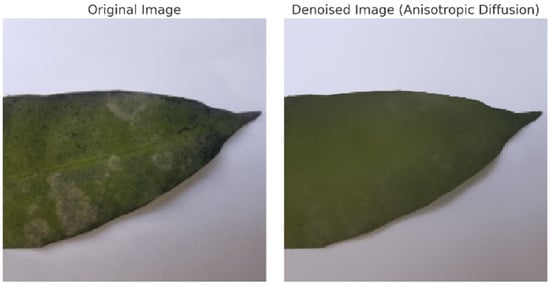
Figure 6.
Noise reduction on a sample image using an anisotropic diffusion approximation. The result shows reduced noise while preserving important edges and features.
3.2.3. Normalization
To ensure that the training progress was stable and also to increase on the rate of convergence, min–max normalization was used to scale the range of pixel intensities between 0 and 1. Let represent the intensity of the pixel at coordinates in the original image, and let and be the minimum and maximum pixel intensities, respectively. The normalized intensity is computed using Equation (3). This preprocessing ensures that all pixel values are scaled uniformly.
3.3. Data Augmentation and Balancing
Each augmentation method aimed to improve the model’s ability to handle real-world variations in agricultural settings. Table 1 present the values for the techniques used in this study. Images were randomly rotated to make the model rotation-invariant, allowing accurate leaf classification regardless of position. Vertical and horizontal flipping was used to simulate upside-down views and left–right symmetries, enabling the model to learn features without regard to orientation. Brightness adjustments helped the model adapt to different lighting conditions, such as sunlight and indoor light. Scaling resized images allowed the model to recognize variations in leaf size, making it scale-invariant for detecting both fine details and broader patterns. Introducing Gaussian noise replicated common image imperfections, enhancing the model’s resilience to noisy data. Figure 7 illustrates the effects of these techniques, showcasing examples of an original plant leaf image alongside its augmented counterparts, including rotated, flipped, brightness-adjusted, scaled, and noise-added variations.

Table 1.
Data augmentation techniques and parameters.
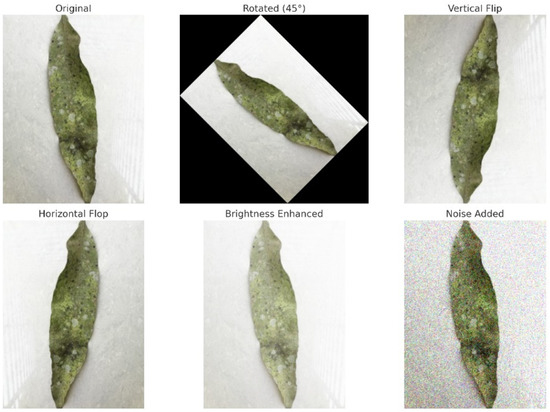
Figure 7.
Visualization of each step of augmentation technique.
From Figure 8, a clear distinction is observed between the characteristics of D1 and D3 compared to D2 and D4. D1 and D3 have a balanced distribution, with each class having the same number of images, preventing any class from being over or underrepresented. On the other hand, D2 and D4 exhibit a class-imbalanced distribution, where certain classes have more samples than others. However, as shown in Figure 9, the training set size is small for D1 (400 images) and D3 (640 images). This can hinder the performance, as we experimented with pretrained models, which usually need larger datasets to learn complex features effectively. In D4, “Bacterial Canker” contains 3067 training samples, while “Powdery Mildew” has only 1661 training samples. Although D2 and D4 have a larger total number of images compared to D1 and D3, the uneven distribution of samples can lead to bias in model training. Moreover, despite having more images, the number of training samples for some classes remains insufficient to fully optimize pretrained models.
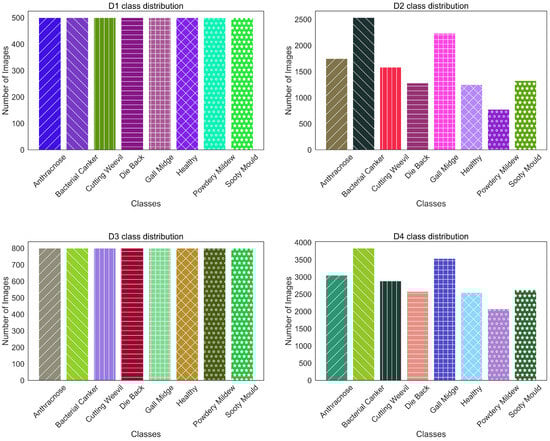
Figure 8.
Class distribution of experimental datasets.
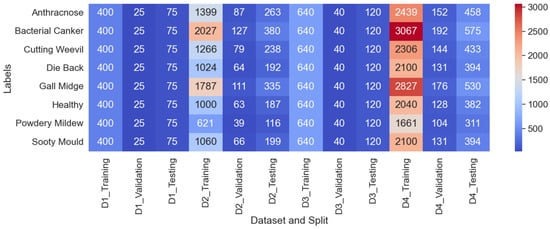
Figure 9.
Training, validation, and testing distribution across experimental datasets.
To address the class imbalance issues and limited training samples in the datasets, the above discussed data augmentation techniques were applied. This augmentation process aimed to mitigate the class imbalance issue by increasing the number of training samples for each class across all datasets. Table 2 summarizes the number of training images for each class in the datasets after performing augmentation. The training set for each class in D1 was increased to 1000 images, while D2, D3, and D4 reached 2500, 1500, and 4000 images per class, respectively.
Table 2.
Number of training samples after performing augmentation techniques.
3.4. GLCM-Based Texture Feature Extraction
In plant leaf disease classification, early symptoms often appear as subtle textural changes, such as small lesions, color mottling, or roughness on the surface of leaves. These variations may not be easily noticeable in the raw pixel intensities, but they are crucial for distinguishing between visually similar disease classes [53]. To effectively capture this subtle texture information, we use the GLCM as a complementary feature extraction technique. This feature extraction takes place early in the process, before the images are fed into deep-learning models. The GLCM operates on the grayscale versions of the images to quantify the frequency at which specific pairs of pixel intensities occur together at defined spatial relationships (such as offset distances and orientations) [54]. This results in a co-occurrence matrix that encodes the local structural patterns found on the leaf surface [55]. Compared to features learned by deep-learning models, which are extracted from a latent space and optimized through backpropagation, GLCM features provide domain-specific interpretability and are robust against moderate changes in lighting conditions or capture angles [56]. This robustness is particularly valuable given the variability of natural lighting conditions in the field.
The normalized GLCM is computed by dividing each entry by the total number of co-occurrences, yielding a probability distribution as shown in Equation (4). From this matrix, we derive four well-established second-order texture features. Contrast (Equation (5)) measures the intensity differences between neighboring pixels; it increases with greater variation. Energy, detailed in Equation (6), evaluates the uniformity of the co-occurrence distribution and yields higher values when textures are more homogeneous. Homogeneity (Equation (7)) assesses how close the elements of the GLCM are to the main diagonal, imposing a steeper penalty for larger intensity differences. Finally, Correlation (Equation (8)) indicates the degree to which pixel intensities are linearly related, based on the means and standard deviations of their row and column distributions. Together, these features are concatenated with the learned embeddings from the transformer backbones at the feature fusion stage, allowing the model to benefit from both data-driven abstraction and handcrafted textural insight.
3.5. Model Training Execution Process
3.5.1. ResNeSt
ResNeSt improves the ResNet model is by incorporating split-attention blocks, which process feature maps in parallel within distinct “cardinal groups” that are further divided into multiple “splits”. Each split undergoes a sequence of convolutions to first reduce the number of channels, followed by a convolution focused on spatial feature extraction, and finally another convolution to restore the dimensionality. This approach allows for efficient and detailed feature learning. Once the convolutions for the parallel splits are completed, a split-attention mechanism adaptively reweights the outputs from each split, highlighting the most discriminative features. The reweighted features are then concatenated, merged through a final convolution, and added back to the block’s input via a residual connection (see Figure 10). This multi-split attention strategy is particularly beneficial for our task, where even slight differences in texture, color, or shape are critical. By enabling each split to specialize in different aspects of the image and selectively reinforcing the most relevant outputs, the network retains high representational power without significantly increasing computational costs [57,58]. In practice, this allows the model to effectively identify key class indicators, even under varying lighting conditions or different orientations of leaves.
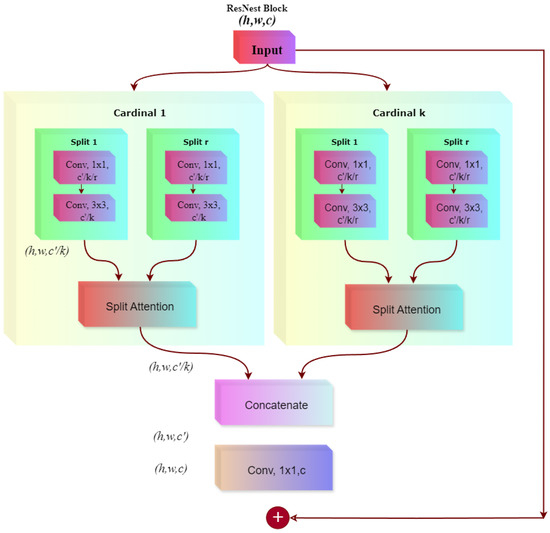
Figure 10.
ResNest architecture used for mango leaf disease classification.
3.5.2. CapsuleNet
Traditional CNNs excel at image classification but struggle to retain spatial hierarchies, making them sensitive to variations in object orientation and perspective. Capsule Networks (CapsuleNet) address this limitation by using vector-based neurons (capsules) that encode spatial relationships. The CapsuleNet architecture for mango leaf disease classification (Figure 11) processes a 9 × 9 pixel input image through an initial convolutional layer (kernel size: 9 × 9), extracting 256 feature maps to capture disease-specific textures. These features are then transformed in the PrimaryCaps layer, consisting of 32 capsules (each with 8 dimensions), which encode spatial and hierarchical information. Using an 8 × 16 transformation matrix, the primary capsules are projected into a higher-dimensional space, generating 10 capsules (16 dimensions each) corresponding to disease categories. Dynamic routing between the PrimaryCaps and DigitCaps layers ensures that only relevant features contribute to classification, mitigating the misclassification of visually similar diseases. The final prediction is based on the L2 norm of each output capsule, selecting the class with the highest value. CapsuleNet surpasses CNNs by preserving spatial relationships and improving robustness to variations in leaf orientations. Its vector-based encoding enhances classification accuracy, ensuring better generalization across diverse datasets.
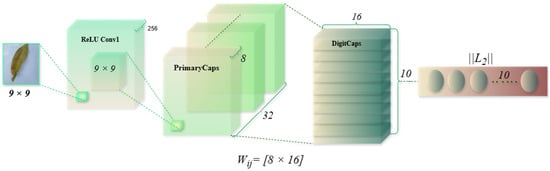
Figure 11.
CapsuleNet architecture used for mango leaf disease classification.
3.5.3. EfficientNetB8
EfficientNetB8 is utilized in this study for mango leaf disease classification due to its balanced scaling of depth, width, and resolution, ensuring optimal computational efficiency. Figure 12 provides a detailed overview of the architectural components. It starts with a convolutional layer with a stride of 2, reducing spatial dimensions and increasing feature depth. This is followed by batch normalization and Swish activation for effective feature extraction. The network’s core consists of inverted residual blocks that utilize depthwise separable convolutions, starting with a convolution to expand channels, followed by a depthwise convolution for filtering, and ending with another convolution to compress channels. Squeeze-and-Excitation modules are included to adjust channel importance dynamically, while residual connections ensure efficient gradient flow. The architecture progresses through these blocks, refining feature representations. It concludes with a convolution, global average pooling into a vector, and a fully connected layer for classification. The model excels at identifying subtle leaf disease differences in various real-world conditions by effectively extracting relevant features [59].
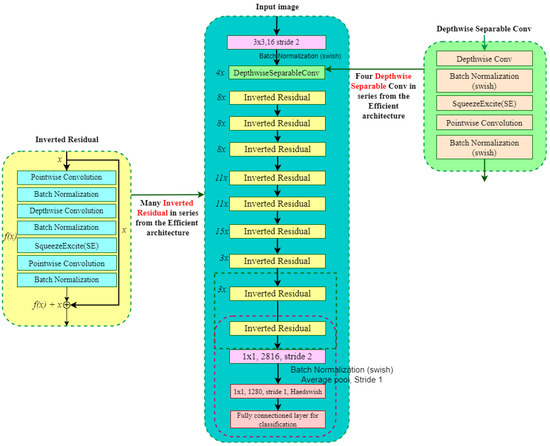
Figure 12.
EfficientNetB8 architecture used for mango leaf disease classification.
3.5.4. ResNeXt
The ResNeX architecture, as illustrated in Figure 13, is designed for complex image classification tasks. Building on the foundational principles of ResNet, it introduces the concept of cardinality, which refers to the number of parallel transformation groups within each layer. This allows the network to process input data through multiple pathways and learn the nuanced features of leaf diseases. Our model employs grouped convolutions, which divide input channels into independent groups, with each group processed by separate filters. This approach enhances the model’s capacity to capture diverse feature representations without greatly increasing the number of parameters [60]. Residual connections are used to promote efficient gradient flow, addressing the vanishing gradient problem in deeper networks. By balancing depth, width, and cardinality, ResNeXt delivers improved performance while keeping a compact design [61]. It is particularly effective for classifying mango leaf diseases, where symptoms may display subtle variations across different types or stages of disease. Its capability to capture intricate patterns through grouped convolutions, combined with its robust learning dynamics facilitated by residual connections, ensures high accuracy and reliability.
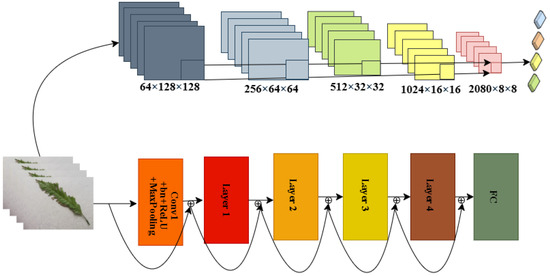
Figure 13.
ResNeXt-101 architecture used for mango leaf disease classification.
3.5.5. MangoNet-Stack
The MangoNet-Stack is a stacking ensemble architecture designed to enhance mango leaf disease classification by utilizing multiple pretrained deep-learning models. As shown in Figure 14, it consists of two levels: base learners that extract complementary features from input images and a meta-learner that combines these features to produce final predictions.
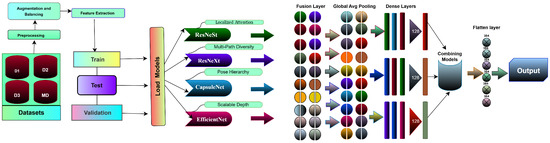
Figure 14.
MangoNet-Stack model architecture.
The base learner layer includes four pretrained models: ResNest, ResNeXt, CapsuleNet, and EfficientNet-B8. Each model is chosen for its specific feature extraction capabilities: ResNest enhances channel-wise focus with split-attention; ResNeXt captures multi-path representations through grouped convolutions; CapsuleNet preserves spatial hierarchies for localized patterns; and EfficientNet-B8 optimizes depth for hierarchical features. These models process the same input image simultaneously, capturing both low-level textures and high-level semantics related to mango leaf diseases. Images from four datasets are independently fed through all base learners. The outputs undergo global pooling to reduce dimensionality while retaining essential features. These pooled outputs are combined into a single feature matrix, representing the various aspects learned by each model. This feature matrix is then passed to the meta-learner. Unlike traditional stacking methods that use separate classifiers (e.g., logistic regression or decision trees), MangoNet-Stack employs a Flatten layer as the meta-learner. This ensures end-to-end differentiability and enables the integration of diverse feature representations into a cohesive vector, which is mapped directly to the output prediction layer.
Algorithm 1 presents the pseudocode of the MangoNet-Stack model. For each dataset , the input image is processed independently by each base model to extract feature representations , where i represents the i-th base model. The feature extraction can be expressed as Equation (9), where is the function of the i-th base model, is the input from the j-th dataset, and denotes the parameters of the i model trained on the j dataset. These features are then pooled globally to reduce dimensionality using Equation (10), where represents the pooled features of the i model trained on the j dataset. The pooled features from all base models across all datasets are concatenated to form the feature matrix using Equation (11), where n is the total number of base models and is the concatenated feature matrix for the j dataset. This matrix is passed through a Flatten layer, which acts as the meta-learner to prepare the features for the final classification stage. The final classification for the j-th dataset is obtained by Equation (12), where the Flatten layer combines the diverse features into a single cohesive prediction.
The model is trained using a categorical cross-entropy loss function, as shown in Equation (13), where C is the number of classes, is the true label, and is the predicted probability for class k in dataset . The total loss is computed using Equation (14). From previous studies [62,63,64], it is evident that this stacking architecture is highly effective for classifying leaf diseases. The modular design of MangoNet-Stack allows it to adapt to different datasets, regardless of variations in image quality and disease manifestations. This architecture minimizes the risk of overfitting, enhances classification accuracy, and is suitable for deployment in real-world agricultural environments where leaf disease patterns may be subtle.
| Algorithm 1: Training Procedure of MangoNet-Stack Ensemble Model |
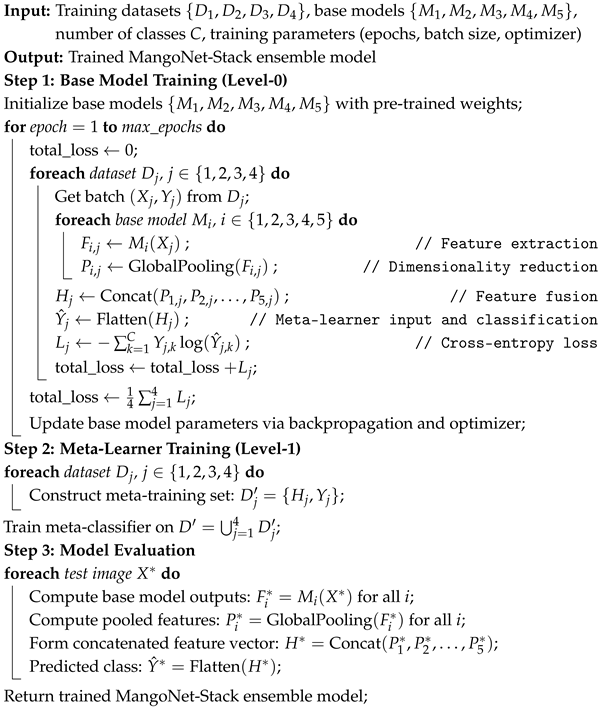 |
3.5.6. Proposed ViX-MangoEFormer Implementation
The proposed ViX-MangoEFormer model is designed to integrate convolutional and transformer-based components to achieve efficient feature extraction. The architecture (Figure 15) processes input images hierarchically through multiple stages, combining the strengths of MBConv4D and MBConv3D modules to effectively capture both local and global features. The model begins with a Conv Stem, which performs an initial convolution operation on the input image of size B × 3 × H × W, where B is the batch size, H and W are the image dimensions, and 3 represents the RGB channels. This step reduces the spatial resolution and prepares the input for deeper feature extraction in subsequent stages [65]. The block ensures that the features are efficiently initialized for hierarchical processing.
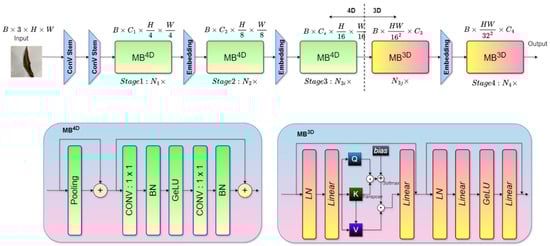
Figure 15.
The proposed ViX-MangoEFormer architecture combines convolutional and transformer-based modules for efficient image classification. It begins with Conv Stem layers for initial downsampling, followed by MB4D blocks (Stages 1–3) utilizing pooling, 1 × 1 convolutions, batch normalization, and GeLU activation for feature extraction. Stage 4 employs MB3D blocks with linear layers, layer normalization, and multi-head self-attention (QKV mechanism) for global context learning. Embedding layers refine features between stages, leading to the final output.
The first two stages of the architecture employ the MBConv4D module, which focuses on local feature extraction. In Stage 1, the MBConv4D module performs depthwise convolutions followed by pointwise convolutions. Each operation is followed by batch normalization (BN) and GeLU activation, ensuring stable learning. The module reduces the spatial dimensions of the feature maps to and while increasing the number of channels to . In Stage 2, another MBConv4D module continues processing the features, further reducing spatial dimensions to and while increasing the channels to . These stages provide hierarchical local feature representations, critical for capturing intricate patterns in leaf diseases.
In Stage 3, the architecture transitions to the MBConv3D module, which integrates attention mechanisms to capture long-range dependencies in the feature maps. The module leverages multi-head self-attention (MHSA), where query (Q), key (K), and value (V) matrices are computed to determine attention scores. These attention scores help the model focus on the most relevant regions of the feature maps [66]. After the attention operation, layer normalization (LN) and linear transformations are applied to refine the embeddings, enabling the model to learn global relationships within the data [67]. The final stage continues with MBConv3D modules to further consolidate the features. The spatial dimensions are reduced to and , while the channels are expanded to . This stage ensures that the model captures both global and fine-grained patterns. The output embeddings are passed through a fully connected layer to generate the final predictions, mapping the extracted features to the corresponding disease classes.
The ViX-MangoEFormer architecture is particularly effective because of its hybrid and hierarchical design. It processes image features at multiple spatial resolutions, allowing the model to capture both fine-grained textures of lesions and broader structural patterns across various disease categories. As illustrated in Figure 16, the architecture incorporates two key modules: MBConv4D and MBConv3D with Attention. Together, these modules enhance computational efficiency while preserving spatiotemporal dependencies in the feature space [68]. The MBConv4D block’s design enables it to model local features, such as subtle margin blight or lesions, with high spatial fidelity. On the other hand, the MBConv3D block integrates MHSA by projecting the input into Q, K, and V matrices. It then applies scaled dot-product attention to reweight value vectors and combines them through linear projection and normalization. This process allows the model to encode long-range contextual relationships and capture global dependencies across the leaf surface. By combining these two mechanisms, the ViX-MangoEFormer effectively balances localized sensitivity and holistic context modeling, while remaining robust to variations in leaf orientation and occlusion.
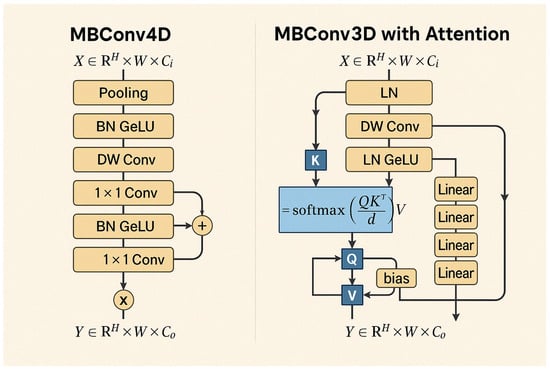
Figure 16.
Architectural flowcharts of MBConv4D and MBConv3D with Attention modules. MBConv4D emphasizes local feature extraction using depthwise and pointwise convolutions with normalization and activation layers. MBConv3D integrates self-attention via QKV projections and softmax scaling to capture global dependencies across spatial dimensions.
3.6. Training Parameters
The ViX-MangoEFormer architecture and the MangoNet-Stack ensemble model required a robust computing setup. Training occurred on a workstation with an NVIDIA RTX 3090 GPU (24 GB VRAM), an Intel Core i9 processor, and 64 GB RAM to effectively manage batch sizes, cross-validation, and ensemble training. The development used Python 3.10, PyTorch (https://pytorch.org/), and CUDA 11.7 for efficient computation.
Table 3 summarizes the key training parameters used in our study. We selected 30 epochs from candidates 20, 30, 50, 100 as it was adequate for model convergence without overfitting. To combat overfitting, we implemented several regularization techniques, including dropout layers in both base and ensemble models, weight decay in the optimizer, and early stopping to halt training when validation performance plateaued. We chose AdamW over other optimizers (Adam, SGD) for its adaptive learning rate and weight decay features, which improve stability and generalization. A learning rate of 0.001 was selected for its balance between fast convergence and stability. Model checkpoints were employed to save the best-performing model during training. Although we tested reducing the learning rate on plateau, it proved unnecessary due to consistent convergence. A batch size of 10 was chosen from 8, 10, 16, 32 for optimal stability in gradient estimates and classification performance in cross-validation.
Table 3.
Training parameters of models with ranges and selected values.
3.7. Evaluation
To assess the performance of the experimental models on multi-class mango leaf disease classification tasks, we employ four core evaluation metrics: Specificity, MCC, PR AUC, and F1 Score. Given the class imbalance in the datasets, these metrics are computed using micro-averaging, which aggregates contributions from all classes and provides a global view of the model’s predictive capabilities. Specificity measures the ability of the model to correctly identify negative instances (i.e., non-members of a class). In the micro-averaged formulation, all true negatives and false positives across classes are summed, as formulated in Equation (15), where and are true negatives (TN) and false positives (FP) for class c. The micro-averaged MCC (Equation (16)) is computed by summing true positives (TP), FP, false negatives (FN), and TN across all classes.
PR AUC is calculated using a one-vs-rest approach per class and then aggregated using micro-averaging, where precision–recall pairs are weighted by the number of true instances per class. This allows the model’s ability to detect relevant instances without excessive false alarms to be evaluated holistically. The micro-averaged F1 Score is computed by first aggregating all true positives, false positives, and false negatives across all classes. From these aggregated values, the overall precision and recall are computed using Equation (17). Once the micro-averaged precision and recall are obtained, the micro F1 Score (Equation (18)) is calculated using the harmonic mean of these values.
To reduce any potential bias in model training and evaluation, we employ 10-fold stratified cross-validation. This method systematically divides the dataset into ten folds, maintaining an equal distribution of classes across each fold. Each fold alternates as the validation set once, with the remaining folds used for training. This process repeats ten times, allowing each fold to serve as the validation set once, ensuring that each segment of the dataset is used for both training and validation.
4. Result Analysis
4.1. Comparative Performance Analysis
Table 4 presents a comparative evaluation of all models across balanced datasets (D1–D4). As shown in Figure 17, ViX-MangoEFormer consistently ranks highest, securing the top position in three out of four datasets. In D1, it leads with a Specificity of 98.89 and an F1 Score of 99.43, outperforming both MangoNet-Stack (with scores of 97.14 and 98.91) and CapsuleNet (with scores of 95.54 and 96.80). ViX-MangoEFormer also demonstrates remarkable stability, with the lowest deviation in F1 Score (0.2), while ResNeXt shows greater variability, with a deviation of 1.2 in Specificity. In the more competitive D2 setting, CapsuleNet achieves the highest MCC of 95.44 and a PR AUC of 98.91, while ViX-MangoEFormer leads in Specificity and F1 Score. The differences between these top models are minimal, as both exhibit low variability (≤0.5). MangoNet-Stack remains a strong contender but does not surpass either model in any of the metrics. ResNeXt again displays instability, particularly in Specificity (1.6).
Table 4.
Performance comparison of classifiers on different datasets for 10 folds.
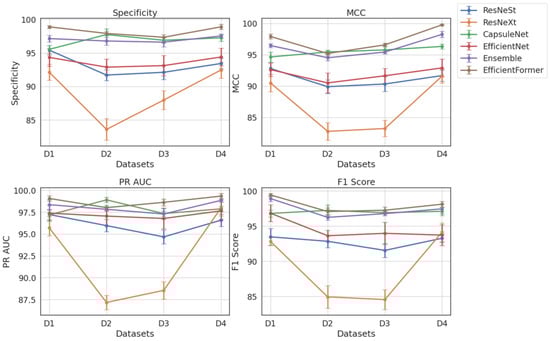
Figure 17.
Dataset and metrics-wise comparison of experimented classifiers.
In D3, ViX-MangoEFormer maintains its lead, with a Specificity of 97.34 and a PR AUC of 98.63, closely followed by CapsuleNet and MangoNet-Stack. The proposed model exhibits consistent precision, with deviations in PR AUC and F1 Score of ≤0.5. In contrast, EfficientNet and ResNeXt show higher standard deviations (≥1.2), indicating less reliable predictions. Finally, in D4, ViX-MangoEFormer again dominates with the highest Specificity and MCC. Although MangoNet-Stack (with scores of 97.53 and 98.26) and CapsuleNet (with scores of 97.25 and 96.33) perform well, neither of them surpasses the proposed model. Notably, ViX-MangoEFormer maintains one of the lowest variances. Meanwhile, ResNeXt continues to demonstrate instability, with a variation in MCC reaching 1.3.
Analyzing the performance gaps in the non-augmented training datasets (see Table 5) confirms the dominance of the ViX-MangoEFormer and MangoNet-Stack models. ViX-MangoEFormer consistently leads across most metrics, with its F1 Score in D1 surpassing the MangoNet-Stack’s by a noticeable margin. However, the MangoNet-Stack model remains competitive. The gap between MangoNet-Stack and CapsuleNet is more significant, particularly in D4, where MangoNet-Stack outperforms CapsuleNet in MCC. In D2, CapsuleNet performs best, with slightly higher MCC and F1 Score than ViX-MangoEFormer, but the difference falls within the standard deviation range.
Table 5.
Performance comparison of classifiers on different datasets for 10 folds (non-augment datasets).
Analyzing model performance on imbalanced data shows that ViX-MangoEFormer consistently outperforms the others, especially in D1 and D4, with scores of 98.71 in F1 Score and 98.23 in Specificity for D4 and the lowest variance. MangoNet-Stack is a strong second, particularly in D1 (95.52 MCC, 97.45 F1 Score) and D3 (95.56 MCC, 95.68 F1 Score), maintaining low variability. In D2, CapsuleNet leads in MCC and F1 Score, but ViX-MangoEFormer is better in Specificity. The close scores indicate comparable performance. CapsuleNet also competes well in D3, achieving 95.78 Specificity and 95.44 F1 Score, but it falls short in D1 and D4. ResNeXt consistently underperformed, with D2 and D3 metrics dropping to 81.46 MCC and 83.92 F1 Score, and showed high variability (e.g., ±2.3 Specificity in D2). ResNeSt and EfficientNet yield moderate results, with ResNeSt achieving 94.53 Specificity in D1 and EfficientNet a PR AUC of 96.10, but both fall behind top-tier models. ViX-MangoEFormer and MangoNet-Stack provide reliable predictions with low metric deviations, while CapsuleNet shows slightly higher variability. ResNeXt and ResNeSt exhibit the greatest fluctuations.
Figure 18 illustrates how data augmentation boosts performance across all datasets. Improvements are most notable in F1 Score and MCC of D1 and D3. D2 shows marginal gains, suggesting sufficient inherent diversity, while D4 sees moderate improvements in ViX-MangoEFormer and MangoNet-Stack. These results confirm that augmentation benefits hybrid ViT and ensemble models the most, whereas traditional CNNs like ResNeXt and ResNeSt exhibit limited responsiveness.
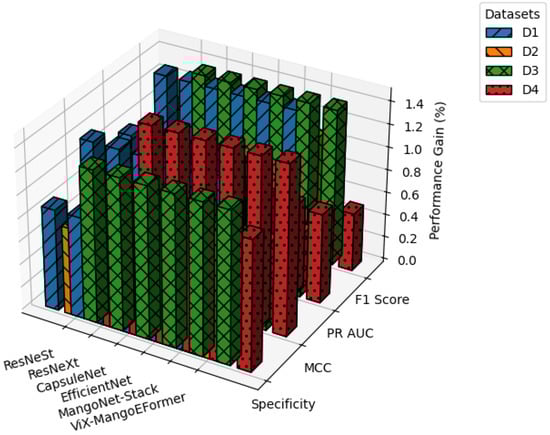
Figure 18.
Performance improvement analysis for models after augmentation.
4.2. Performance Validation
The misclassification pattern of ViX-MangoEFormer and MangoNet-Stack on balanced and imbalanced datasets are summarized in Table 6 and Table 7, respectively. ViX-MangoEFormer and MangoNet-Stack performed similarly overall, but a detailed class-wise evaluation revealed that ViX-MangoEFormer consistently outperforms MangoNet-Stack, particularly in class imbalance situations. In balanced datasets (D1, D3), both models generally performed well on common classes like Healthy, Bacterial Canker, and Cutting Weevil. However, ViX-MangoEFormer achieved higher MCC scores (97.5–98.0) and PR AUCs (up to 99.5), while MangoNet-Stack scored lower (MCC 96.2–97.5). Minor misclassifications in Anthracnose and Gall Midge for MangoNet-Stack resulted in F1 Scores that were 0.2–0.3 points less, mainly due to visual similarities that ViX-MangoEFormer’s attention-based architecture managed to handle better.
Table 6.
Classification report comparison across MangoNet-Stack and ViX-MangoEFormer model on balanced data (D1 and D3).
Table 7.
Classification report comparison across MangoNet-Stack and ViX-MangoEFormer model on imbalanced data (D2 and D4).
In imbalanced datasets (D2, D4), ViX-MangoEFormer showed a stable performance, with MCCs above 97.0 and PR AUCs of 99.2–99.4. In contrast, MangoNet-Stack experienced significant drops in performance, especially for rare classes like Sooty Mould and Powdery Mildew. For example, in D4, MangoNet-Stack’s MCC for Sooty Mould dropped to 96.4, compared to 97.3 for ViX-MangoEFormer. The misclassifications mainly resulted in false negatives where rare classes were incorrectly identified as more common diseases, highlighting MangoNet-Stack’s bias in skewed distributions. Also, both Die Back and Gall Midge showed moderate performance declines moving from balanced to imbalanced datasets, with MangoNet-Stack struggling more with visually overlapping classes. Overall, misclassification patterns indicate that ViX-MangoEFormer is more resilient to distribution shifts, with fewer false positives and negatives across all datasets. In contrast, MangoNet-Stack, while effective on balanced data, shows degraded performance under class imbalance.
The paired t-test results (see Table 8 and Table 9) indicate that ViX-MangoEFormer significantly outperforms other models across all datasets. It shows substantial improvements in MCC and F1 Score, with p-values often below 0.005. On dataset D2, ResNeXt has p-values ranging from 0.0001 (MCC and PR AUC) to 0.0002 (Specificity and F1 Score), maintaining similar low values on D3. ResNeSt performs slightly better than ResNeXt but remains inferior, with p-values between 0.0001 and 0.0008 on D4 and 0.0036 to 0.0047 on D1. CapsuleNet is more competitive, with higher p-values on D2 showing no significant difference. However, on D3, it has lower p-values (0.0147 for MCC and 0.0175 for F1 Score), indicating better performance. EfficientNet is also a strong contender but is outperformed statistically, with p-values decreasing from D1 to D4, suggesting it lacks the context modeling for highly imbalanced data. MangoNet-Stack is the next closest competitor, with p-values near the significance threshold. In D3, it has p-values for MCC and F1 Score, just above the significance level. However, in D2, ViX-MangoEFormer outperforms it, with p-values of 0.0125 for MCC and 0.0138 for F1 Score, highlighting that while MangoNet-Stack is strong, its ensemble approach does not match the attention-driven representation of ViX-MangoEFormer.
Table 8.
Statistical significance comparison between ViX-MangoEFormer and baseline models using paired t-test () on D2 and D4.
Table 9.
Statistical significance comparison between ViX-MangoEFormer and baseline models using paired t-test () on D1 and D3.
To assess the generalizability and adaptability of ViX-MangoEFormer beyond mango leaf disease classification, the model was evaluated on datasets from Guava, Tomato, Grape, Apple, and Jute crops. These crops include the leaf disease category common in our dataset. The results in Table 10 show that ViX-MangoEFormer demonstrates strong versatility and accuracy in handling diverse plant species and their disease categories. It excels in identifying Guava leaf diseases, with a Specificity of 98.51% and an MCC of 97.85%. Its MCC for Jute is even higher, indicating variability in symptoms among different species. However, the model faces challenges with Tomato leaf classification, achieving its lowest MCC at 95.95% and a PR AUC of 96.47%, showing difficulty in distinguishing similar symptoms. In contrast, Grape leaf disease classification yields the highest PR AUC of 99.58% and an F1 Score of 98.91%, demonstrating excellent accuracy. For Apple leaf diseases, the model records an MCC of 96.89% and an F1 Score of 97.43%, which are slightly lower than Grape due to subtler symptom variations. Notably, in Jute leaf classification, it achieves an F1 Score of 99.01% and a Specificity of 99.15%, showcasing its ability to reduce false positives.
Table 10.
Results of our ViX-MangoEFormer model on different types of crop leaf disease.
The learning curves presented in Figure 19 illustrate the training behavior of ViX-MangoEFormer on the balanced datasets. The loss curves show a steep decline during the initial 10 epochs, followed by a gradual stabilization near zero, indicating effective convergence. D3 achieves a slightly lower final loss compared to D1. The close alignment between training and validation losses in both datasets indicates minimal overfitting. The accuracy curves also demonstrate rapid increases during the early epochs, with accuracy surpassing 98% after 15 to 20 epochs. Notably, D3 reaches peak accuracy at around 99% by epoch 10, while D1 takes more epochs to converge. This implies that ViX-MangoEFormer learns more efficiently from D3, possibly due to clearer class separability. The recall curves show the model’s capacity to identify true positives over epochs. By epoch 20, recall approaches 99% for both datasets. D1 has some fluctuation in validation recall during early training but starts with higher validation recall than training recall, indicating strong performance on unseen data. Precision also improves steadily, stabilizing between 98% and 99%. D3 achieves faster and smoother convergence, while D1 shows mild early variations. These trends suggest that ViX-MangoEFormer extracts features more effectively from D3, leading to more stable training results.
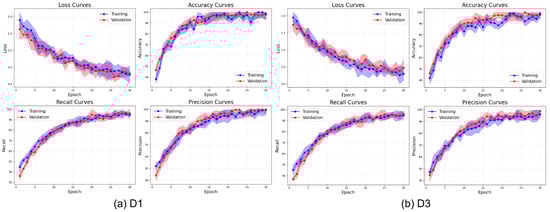
Figure 19.
Learning curve of the ViX-MangoEFormer model on balanced datasets.
Figure 20 illustrates the learning behavior of ViX-MangoEFormer on the imbalanced D2 and D4 datasets. Both datasets show a rapid reduction in loss during the first 10 epochs; however, D4 converges more smoothly and achieves a lower final loss, indicating more efficient learning. The close alignment of training and validation loss in both cases suggests strong regularization and minimal overfitting. The accuracy curves exhibit similar trends, with both datasets surpassing 98% accuracy by epoch 15. However, D4 stabilizes earlier, implying that the model adapts more quickly when the class distributions are less skewed. In contrast, D2 takes more epochs to converge and demonstrates instability, particularly in the early recall and precision curves. D4’s steady progression in recall and precision reflects a balanced representation across classes, while D2’s variability, especially early in the training process, indicates that the model struggles to consistently detect minority classes. Although precision in D2 improves, it fluctuates more, reinforcing the model’s difficulty in establishing clear decision boundaries. These observations reveal that while ViX-MangoEFormer is generally robust, it performs more confidently and effectively on datasets with less severe class skew, such as D4.
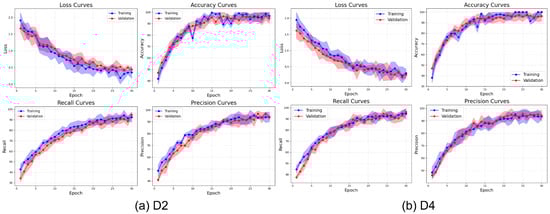
Figure 20.
Learning curve of the ViX-MangoEFormer model on imbalanced datasets.
4.3. Time Complexity and Runtime Analysis
In addition to evaluating classification performance, we analyzed each model’s computational overhead by measuring training duration, model complexity (number of trainable parameters), and inference speed per image. Figure 21 visually compares these aspects among the models. MangoNet-Stack and EfficientNet-B8 have the highest complexity rating of 5.0, indicating they are heavy architectures. ViX-MangoEFormer has a moderate complexity rating of 3.5, balancing performance and efficiency. CapsuleNet is the simplest model at 2.0, offering faster execution but limited capacity. In terms of inference time, CapsuleNet and ViX-MangoEFormer are the fastest, while MangoNet-Stack and ResNeXt-101 are the slowest, making ViX-MangoEFormer suitable for real-time applications. For training, CapsuleNet and ViX-MangoEFormer require less time compared to MangoNet-Stack and EfficientNet-B8, which demand more computational resources. In summary, ViX-MangoEFormer offers the best trade-off between model complexity, inference speed, and training time, making it particularly well-suited for efficient, real-time mango disease classification in practical settings.
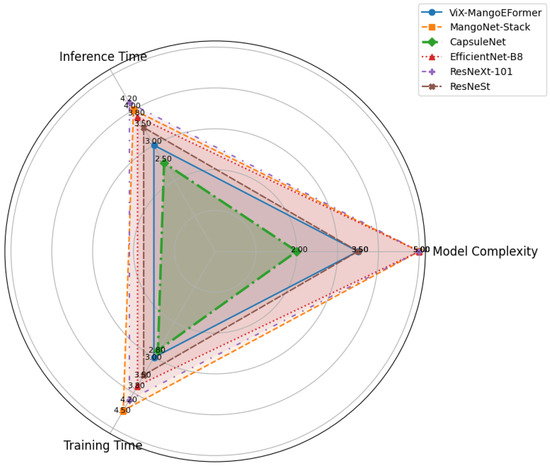
Figure 21.
Radar chart comparing models based on training time, model complexity, and inference speed.
Overall, ViX-MangoEFormer effectively balances speed, size, and accuracy, outperforming the ensemble-based MangoNet-Stack. Although it has more parameters than standard CNNs like ResNeXt-101 and EfficientNet-B8, its enhanced performance justifies the additional overhead. For large-scale or real-time mango leaf disease detection, ViX-MangoEFormer offers a practical trade-off between high accuracy and manageable computational costs. On the other hand, while MangoNet-Stack delivers superior overall accuracy, it requires more resources for training and inference. These insights can aid researchers and agricultural practitioners in selecting the best model based on their performance needs.
4.4. Grad-CAM Prediction Analysis
Grad-CAM was applied to the final convolutional layer of ViX-MangoEFormer to generate heatmaps that highlight critical areas in the input images of mango leaves. These heatmaps visually indicate which regions of the leaf were most influential in predicting disease presence or in classifying a leaf as healthy. By overlaying the heatmaps on the original images, professionals can verify whether the model correctly identified disease-affected areas or mistakenly focused on irrelevant regions. Figure 22 presents class-wise Grad-CAM visualizations for ViX-MangoEFormer’s predictions on the D4 dataset. These output show that the model successfully highlighted regions that align with recognizable expert symptoms.
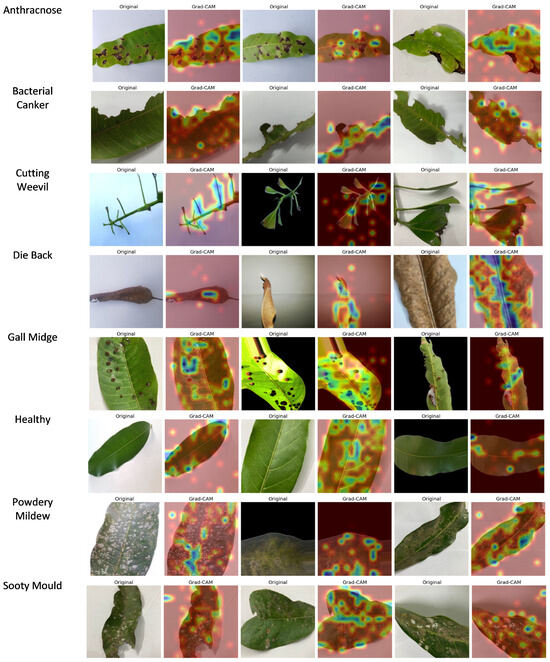
Figure 22.
Sample Grad-CAM predictions of ViX-MangoEFormer model for each class.
The Grad-CAM prediction for Anthracnose highlights dark, irregular necrotic spots on the leaves, indicating a focus on the characteristics of fungal infection. This suggests that the model effectively recognizes the severity and distribution of lesions, while ignoring background distractions. For Bacterial Canker, attention is drawn to brownish areas with yellowish halos, particularly near the midrib and veins. These features correlate with sites of bacterial infection and internal tissue degradation. The model successfully distinguishes this condition from other necrosis-based diseases, such as Anthracnose and Die Back, by concentrating on damage around the veins. In the case of Cutting Weevil, highlighted regions exhibit sharp, torn edges and missing tissue, reflecting the feeding behavior of the insect. The model accurately identifies these structural issues, demonstrating its understanding of the disease based on shape rather than color. With Die Back, Grad-CAM focuses darkened regions of the petiole and withered leaf tips, which are signs of nutrient deprivation and tissue death. This indicates that the model has developed a spatial understanding of how the disease progresses from the stem to the tip of the leaf.
For Gall Midge, predictions highlight small, round bumps on the leaf caused by insect larvae activity. The model focuses on the size, distribution, and surface distortion of these bumps, effectively distinguishing them from other diseases like Powdery Mildew by analyzing their 3D structure rather than just 2D visuals. In healthy leaves, there is low-intensity activation around the midrib, indicating that there are no disease features present and reinforcing confidence in the model’s classification abilities. For Powdery Mildew, heatmaps reveal white, chalky patches characteristic of the infection, confirming the model’s proficiency in detecting low-contrast textures. This class requires detailed texture learning, and the visualizations support the model’s capabilities. In the Sooty Mould class, activations appear on the black deposits found on leaves, which are linked to fungal growth resulting from insect honeydew. The model successfully differentiates these deposits from shadows or darker textures, showcasing its ability to recognize the subtle, unique features of Sooty Mould. These visual explanations are crucial for validating the model and serve as practical tools for agronomists and plant pathologists in diagnostic work.
4.5. Web Application
The web application utilizes the Grad-CAM-enabled ViX-MangoEFormer model to classify diseases in mango leaves. It is specifically designed to assist farmers, agricultural experts, and researchers by allowing them to upload images of mango leaves for immediate disease detection. Once an image is uploaded, the model processes it and provides detailed classification results. The prediction results are displayed in a structured format, showing the probability scores for each disease category. For instance, in Figure 23 the application accurately classifies the uploaded leaf image as Gall Midge with 100% confidence, while all other categories show a 0% probability, indicating the model’s certainty in its prediction. The left section of the interface displays a Grad-CAM-generated heatmap, which visually highlights the most influential areas in the input image that contributed to the classification. In this case, the activation map focuses on the gall formations along the leaf surface, confirming that the model correctly identifies the affected regions. This feature enhances the explainability of the decision-making process, allowing users to visually verify the areas that influenced the diagnosis. Its user-friendly interface allows easy reloading of images, enabling the testing of multiple samples and comparison of results.
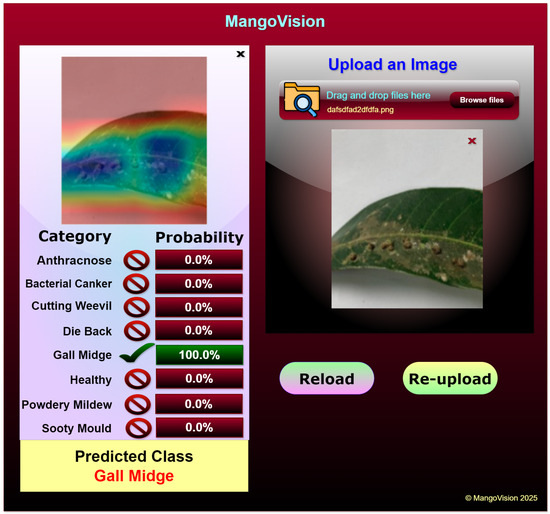
Figure 23.
Mango leaf disease classification web application.
In future, features such as real-time disease monitoring, predictive analytics, and integrated crop health systems could be added to expand its capabilities. For example, IoT-enabled sensors could be used to continuously monitor environmental factors like temperature, humidity, and soil moisture, all of which are crucial to plant health. These sensors could send data to the cloud via Bluetooth Low Energy (BLE) or Wi-Fi, where advanced predictive models could analyze the information and identify correlations with disease outbreaks. The application could also be linked to agricultural data platforms or government databases to create region-specific disease prediction maps. Notifications or alerts, delivered via Firebase Cloud Messaging (FCM) or SMS gateways, could inform farmers of potential risks, enabling them to take preventive measures. Integrating geographic information systems (GISs) could allow large-scale monitoring, providing policymakers with actionable insights for regional agricultural planning. Incorporating edge computing capabilities would further enhance the application’s performance by enabling real-time data processing with minimal latency. Such developments would make the application even more efficient and adaptable to various field conditions. With its scalable and modular design, the application bridges the gap between disease classification technology and practical agricultural applications.
4.6. State-of-the-Art Comparison
The analysis presented in Table 11 shows that our ViX-MangoEFormer model outperforms existing models in classifying mango leaf diseases. It achieves this by combining high accuracy, comprehensive dataset coverage, explainability, and practical applicability. Previous studies, including those using InceptionV3 [28], EfficientNetV2L [29], and DeiT [46], reported competitive results. However, they did not incorporate XAI or develop web applications. Additionally, these studies primarily assessed models on single datasets. While the ViT-B/16 model achieved a perfect accuracy of 100%, this result was based on a smaller dataset and focused only on binary classification. In contrast, our ViX-MangoEFormer model was trained on a much larger dataset consisting of 25,530 images, significantly surpassing the typical dataset sizes in prior studies, which usually ranged from 4000 to 6000 images. This extensive dataset is a key factor in the superior performance and robustness of ViX-MangoEFormer, ensuring its reliability across various scenarios.
Table 11.
Comparison of our performance against previous studies on crop leaf disease classification.
ViX-MangoEFormer stands out for maintaining high accuracy across various datasets, achieving 99.43% on 4000 images, 98.02% on 12,730 images, and 98.63% on 6400 images. Its strong generalization capability makes it suitable for real-world applications. The model incorporates XAI techniques—this is a significant advantage over many earlier models that lack these features. Unlike most previous studies, which remain experimental, ViX-MangoEFormer has practical applications, making it accessible to farmers and agricultural experts. While other models, such as ConvNeXtXLarge [41] and Swin Transformer [44], are large and resource-intensive, ViX-MangoEFormer strikes a balance between complexity and efficiency, achieving top performance without excessive resource demands, making it ideal for real-time use.
5. Discussion
This study shows that data augmentation effectively reduces overfitting and improves classification performance across all tested models and datasets. By increasing training data while maintaining class labels, augmentation acts as a regularization strategy that enhances generalization, especially on imbalanced datasets (D2 and D4). It particularly helped underrepresented classes like Sooty Mould and Powdery Mildew, resulting in better metrics like MCC and PR AUC. The ViX-MangoEFormer model consistently outperformed all baselines, owing to its hybrid architecture that integrates convolutional modules for local feature extraction with transformer-based self-attention for long-range contextual modeling. This dual design allows the model to capture subtle lesion textures while attending to broader discoloration patterns. Moreover, its memory-efficient inference design, based on MBConv layers and sparse attention, further ensures low latency without sacrificing depth or resolution.
While ensemble learning has previously shown strong performance in leaf disease classification, ViX-MangoEFormer outperformed traditional CNN ensembles by effectively capturing long-range spatial correlations. Its transformer modules reweighted feature importance, allowing for better identification of subtle disease patterns. Additionally, integrating GLCM features improved the model’s sensitivity to fine texture statistics, which is essential for differentiating similar diseases like Sooty Mould and Powdery Mildew. By utilizing second-order intensity co-occurrence patterns, the model enhanced its discrimination capabilities. Furthermore, incorporating explainability mechanisms enhances the model’s trustworthiness. By integrating GLCM-based texture features with Grad-CAM visualizations, users can see which areas of the leaf were considered during classification. This transparency is crucial in agriculture as it helps build user confidence and supports regulatory compliance. Visual indicators like mold textures, leaf speckling, and vascular damage can be easily interpreted, allowing experts to validate model decisions and take action when necessary.
The implementation of ViX-MangoEFormer in a web application demonstrates its practical use. Designed for accessibility on laptops and smartphones, the application allows farmers and agronomists to conduct on-site disease diagnosis. The application is modular and can be extended to support additional crop types, disease categories, or geographic zones. This enables rapid decision-making regarding pesticide use, plant isolation, and irrigation adjustments. It features an interactive interface for real-time feedback and collaboration among agricultural extension teams. Despite its deep architecture, ViX-MangoEFormer achieves inference speeds of less than 120 milliseconds per image on mid-tier GPUs by optimizing attention computation and utilizing compact convolutional blocks. However, training the model remains resource-intensive, requiring approximately 18.7 GB of GPU memory and 42 GB of RAM over a span of 9.5 h on the merged dataset. While inference is optimized for edge devices such as the NVIDIA Jetson Xavier NX and T4 GPUs, the training pipeline currently relies on access to high-performance hardware.
However, there are limitations to consider. While the model has achieved high performance across various datasets, most leaf images were collected under consistent lighting conditions and clean backgrounds. This does not accurately reflect the variability encountered in real-world agricultural environments, where differences in lighting, occlusion, background clutter, and camera resolution can significantly alter the data distribution. To enhance generalizability, we plan to expand our dataset to include images captured in diverse field conditions and incorporate domain adaptation methods such as CycleGAN-based style transfer, test-time adaptation, and domain adversarial learning. These strategies aim to bridge the gap between laboratory conditions and practical deployments.
Although ViX-MangoEFormer is optimized for low-memory inference, its training complexity presents a challenge for institutions that lack high-end GPUs. The inclusion of GLCM-based feature fusion is advantageous for texture modeling but increases the computational load. To address this, future versions will explore model compression techniques such as quantization-aware training, structured pruning, and knowledge distillation. We are also considering the use of learnable texture encoders to replace handcrafted GLCM modules and to apply texture extraction selectively to disease-prone regions, thereby reducing overhead. Furthermore, integrating adaptive inference mechanisms, such as early exit branches, may enable dynamic computation in latency-sensitive scenarios.
Regarding interpretability, our Grad-CAM visualizations effectively localized critical disease areas, including necrotic zones, marginal blight, and chlorotic speckling. While this provides spatial insights, it does not fully elucidate the internal decision-making process of transformer modules. We propose incorporating advanced explainable AI (XAI) techniques, such as layer-wise relevance propagation (LRP) and concept-based interpretation, to achieve greater transparency. Additionally, using multispectral imaging, hyperspectral sensors, or RGB–NIR fusion can help differentiate similar disease types in complex conditions.
From a deployment and policy perspective, practical scalability requires a clear understanding of implementation costs, training logistics, and maintenance protocols. Anticipated implementation costs include GPU requirements, cloud hosting, and data storage infrastructure for large-scale adoption. Moreover, technical training for end-users and periodic model updates are essential to ensure ongoing accuracy and system relevance in dynamic agricultural environments. While formal usability testing has not yet been conducted, future studies will include a comprehensive cost-benefit analysis. This analysis will address model deployment, investments in cloud and edge hardware, training requirements, and the anticipated return on investment (ROI) in terms of yield improvement and pesticide reduction. Additionally, we plan to create a low-resource training pipeline that requires minimal hardware, allowing field officers to fine-tune models without needing extensive technical expertise. Lastly, pilot deployments across various agricultural zones will evaluate the framework’s scalability, adaptability, and stakeholder engagement, ensuring that the system can effectively influence real-world decision-making at scale.
6. Conclusions
This study introduces ViX-MangoEFormer, designed to enhance the classification of mango leaf diseases. It integrates statistical texture features and data augmentation to tackle the challenges associated with both balanced and imbalanced datasets. By effectively recognizing diseases that are often underrepresented but critical, the model consistently outperformed transfer learning-based individual and ensemble architectures across key performance metrics. The combination of transformer-based attention mechanisms and GLCM-enhanced texture analysis greatly reduced misclassification among disease classes that share similar visual characteristics. Additionally, the model’s real-time deployment through an XAI-enabled web application demonstrated its practical utility in precision agriculture. Its scalability and transparency encourage the adoption of AI in monitoring crop health. Despite its strong performance, this study has some limitations. The gap between controlled imaging conditions and real-world variability, along with the high computational cost of transformers, limits broader implementation. Future research should investigate unsupervised domain adaptation and federated learning to enhance generalizability. Furthermore, incorporating layer-wise relevance propagation could provide deeper insights into model predictions. As agricultural digitization continues to accelerate, this research represents a promising advancement toward reliable, interpretable, and scalable AI solutions for diagnosing plant diseases.
Author Contributions
Conceptualization, A.A.N., A.H., A.S., J.D., H.F., A.A.S., A.W.R. and M.A.A.D.; methodology, A.A.N., A.H., A.S., J.D., H.F. and A.A.S.; validation, R.H., A.W.R. and M.A.A.D.; formal analysis, A.H., H.F. and A.A.S.; investigation, J.D., M.R.A., A.S., R.H. and H.F.; data curation, A.A.N., M.R.A. and R.H.; writing—original draft, A.A.N., A.H., A.S., J.D., H.F. and A.A.S.; writing—review and editing, A.S., A.A.S., R.H., M.R.A. and A.W.R.; visualization, R.H., M.R.A. and A.W.R.; supervision, A.W.R. and M.A.A.D.; funding acquisition, M.A.A.D. All authors have read and agreed to the published version of the manuscript.
Funding
This research received no external funding.
Institutional Review Board Statement
Not applicable.
Informed Consent Statement
Not applicable.
Data Availability Statement
The datasets used in this study are publicly available and sourced from MangoLeafBD [50], Mango Leaf Disease Dataset [51], and MLD24 [52].
Conflicts of Interest
The authors declare no conflicts of interest.
References
- Sudomo, A.; Leksono, B.; Tata, H.L.; Rahayu, A.A.D.; Umroni, A.; Rianawati, H.; Asmaliyah; Krisnawati; Setyayudi, A.; Utomo, M.M.B.; et al. Can Agroforestry Contribute to Food and Livelihood Security for Indonesia’s Smallholders in the Climate Change Era? Agriculture 2023, 13, 1896. [Google Scholar] [CrossRef]
- Tengsetasak, P.; Tongkoom, K.; Yomkerd, J.; Susawaengsup, C.; Khongdee, N.; Chatsungnoen, T.; Dangtungee, R.; Bhuyar, P. Sustainable Strategies for Fresh Mangosteen: Adapting to Climate Challenges. Earth Syst. Environ. 2024, 8, 1829–1847. [Google Scholar] [CrossRef]
- Uddin, M.; Shefat, S.; Afroz, M.; Moon, N. Management of Anthracnose Disease of Mango Caused by Colletotrichum gloeosporioides: A Review. Acta Sci. Agric. 2018, 2, 169–177. [Google Scholar]
- Rudrappa, S. Discounted Life: The Price of Global Surrogacy in India; NYU Press: New York, NY, USA, 2015. [Google Scholar]
- Mwangi, R.W.; Mustafa, M.; Charles, K.; Wagara, I.W.; Kappel, N. Selected Emerging and Reemerging Plant Pathogens Affecting the Food Basket: A Threat to Food Security. J. Agric. Food Res. 2023, 14, 100827. [Google Scholar] [CrossRef]
- Ngugi, L.C.; Abelwahab, M.; Abo-Zahhad, M. Recent Advances in Image Processing Techniques for Automated Leaf Pest and Disease Recognition—A Review. Inf. Process. Agric. 2021, 8, 27–51. [Google Scholar] [CrossRef]
- Velásquez, C.; Prieto, F.; Palou, L.; Cubero, S.; Blasco, J.; Aleixos, N. New Model for the Automatic Detection of Anthracnose in Mango Fruits Based on Vis/NIR Hyperspectral Imaging and Discriminant Analysis. J. Food Meas. Charact. 2024, 18, 560–570. [Google Scholar] [CrossRef]
- Talwana, H.; Sibanda, Z.; Wanjohi, W.; Kimenju, W.; Luambano-Nyoni, N.; Massawe, C.; Manzanilla-López, R.H.; Davies, K.G.; Hunt, D.J.; Sikora, R.A.; et al. Agricultural Nematology in East and Southern Africa: Problems, Management Strategies, and Stakeholder Linkages. Pest Manag. Sci. 2016, 72, 226–245. [Google Scholar] [CrossRef]
- Kumar, N. High Density Planting in Mango-Prospects and Problems. Adv. Agri. Res. Technol. J. 2019, 3, 47–53. [Google Scholar] [CrossRef]
- Kumar, S.; Gupta, B.; Garg, L. A Review of Mango Leaf Diseases Classification, Causes and Management Strategies. In Proceedings of the 2023 International Conference on Advanced Computing & Communication Technologies (ICACCTech), Banur, India, 23–24 December 2023; pp. 434–439. [Google Scholar]
- Faye, D.; Diop, I.; Dione, D. Mango Diseases Classification Solutions Using Machine Learning or Deep Learning: A Review. J. Comput. Commun. 2022, 10, 16–28. [Google Scholar] [CrossRef]
- Bhagat, M.; Kumar, D.; Kumar, S. Optimized Transfer Learning Approach for Leaf Disease Classification in Smart Agriculture. Multimed. Tools Appl. 2024, 83, 58103–58123. [Google Scholar] [CrossRef]
- Hassija, V.; Chamola, V.; Mahapatra, A.; Singal, A.; Goel, D.; Huang, K.; Scardapane, S.; Spinelli, I.; Mahmud, M.; Hussain, A. Interpreting Black-Box Models: A Review on Explainable Artificial Intelligence. Cogn. Comput. 2024, 16, 45–74. [Google Scholar] [CrossRef]
- Li, W.; Zheng, T.; Yang, Z.; Li, M.; Sun, C.; Yang, X. Classification and Detection of Insects from Field Images Using Deep Learning for Smart Pest Management: A Systematic Review. Ecol. Inform. 2021, 66, 101460. [Google Scholar] [CrossRef]
- Sarkar, C.; Gupta, D.; Gupta, U.; Hazarika, B.B. Leaf Disease Detection Using Machine Learning and Deep Learning: Review and Challenges. Appl. Soft Comput. 2023, 145, 110534. [Google Scholar] [CrossRef]
- Goel, L.; Nagpal, J. A Systematic Review of Recent Machine Learning Techniques for Plant Disease Identification and Classification. IETE Tech. Rev. 2023, 40, 423–439. [Google Scholar] [CrossRef]
- Simhadri, C.G.; Kondaveeti, H.K.; Vatsavayi, V.K.; Mitra, A.; Ananthachari, P. Deep Learning for Rice Leaf Disease Detection: A Systematic Literature Review on Emerging Trends, Methodologies and Techniques. Inf. Process. Agric. 2024; in press. [Google Scholar] [CrossRef]
- Sajitha, P.; Andrushia, A.D.; Anand, N.; Naser, M.Z. A Review on Machine Learning and Deep Learning Image-Based Plant Disease Classification for Industrial Farming Systems. J. Ind. Inf. Integr. 2024, 38, 100572. [Google Scholar] [CrossRef]
- Yunusa, H.; Qin, S.; Chukkol, A.H.A.; Yusuf, A.A.; Bello, I.; Lawan, A. Exploring the Synergies of Hybrid CNNs and ViTs Architectures for Computer Vision: A Survey. arXiv 2024, arXiv:2402.02941. [Google Scholar]
- Sharma, V.; Tripathi, A.K.; Mittal, H.; Nkenyereye, L. SoyaTrans: A novel transformer model for fine-grained visual classification of soybean leaf disease diagnosis. Expert Syst. Appl. 2025, 260, 125385. [Google Scholar] [CrossRef]
- Isinkaye, F.O.; Olusanya, M.O.; Akinyelu, A. A multi-class hybrid variational autoencoder and vision transformer model for enhanced plant disease identification. Intell. Syst. Appl. 2025, 26, 200490. [Google Scholar] [CrossRef]
- Aboelenin, S.; Elbasheer, F.A.; Eltoukhy, M.M.; El-Hady, W.M.; Hosny, K.M. A hybrid framework for plant leaf disease detection and classification using convolutional neural networks and vision transformer. Complex Intell. Syst. 2025, 11, 142. [Google Scholar] [CrossRef]
- Huang, X.; Xu, D.; Chen, Y.; Zhang, Q.; Feng, P.; Ma, Y.; Dong, Q.; Yu, F. EConv-ViT: A strongly generalized apple leaf disease classification model based on the fusion of ConvNeXt and transformer. Inf. Process. Agric. 2025; in press. [Google Scholar]
- Karthik, R.; Aswin, R.; Geetha, K.S.; Suganthi, K. An explainable deep learning network with transformer and custom CNN for bean leaf disease classification. IEEE Access 2025, 13, 38562–38573. [Google Scholar] [CrossRef]
- Srivathsan, M.S.; Jenish, S.A.; Arvindhan, K.; Karthik, R. An explainable hybrid feature aggregation network with residual inception positional encoding attention and EfficientNet for cassava leaf disease classification. Sci. Rep. 2025, 15, 11750. [Google Scholar] [CrossRef] [PubMed]
- Karimanzira, D. Context-aware tomato leaf disease detection using deep learning in an operational framework. Electronics 2025, 14, 661. [Google Scholar] [CrossRef]
- Zhang, M.; Lin, Z.; Tang, S.; Lin, C.; Zhang, L.; Dong, W.; Zhong, N. Dual-attention-enhanced MobileViT network: A lightweight model for rice disease identification in field-captured images. Agriculture 2025, 15, 571. [Google Scholar] [CrossRef]
- Varma, T.; Mate, P.; Azeem, N.A.; Sharma, S.; Singh, B. Automatic Mango Leaf Disease Detection Using Different Transfer Learning Models. Multimed. Tools Appl. 2025, 84, 9185–9218. [Google Scholar] [CrossRef]
- Swapno, S.M.M.R.; Nobel, S.N.; Islam, M.B.; Haque, R.; Meena, V.P.; Benedetto, F. A Novel Machine Learning Approach for Fast and Efficient Detection of Mango Leaf Diseases. In Proceedings of the 2024 IEEE 3rd International Conference on Computing and Machine Intelligence (ICMI), Mt Pleasant, MI, USA, 13–14 April 2024; pp. 1–7. [Google Scholar]
- Rizvee, R.A.; Orpa, T.H.; Ahnaf, A.; Kabir, M.A.; Rashid, M.R.A.; Islam, M.M.; Islam, M.; Jabid, T.; Ali, M.S. LeafNet: A Proficient Convolutional Neural Network for Detecting Seven Prominent Mango Leaf Diseases. J. Agric. Food Res. 2023, 14, 100787. [Google Scholar] [CrossRef]
- Ghosh, H.; Rahat, I.S.; Lenka, R.; Mohanty, S.N.; Chauhan, D. Benchmarking ML and DL Models for Mango Leaf Disease Detection: A Comparative Analysis. In Proceedings of the International Conference on Applied Machine Learning and Data Analytics; Springer: Berlin/Heidelberg, Germany, 2023; pp. 97–110. [Google Scholar]
- Zhang, B.; Wang, Z.; Ye, C.; Zhang, H.; Lou, K.; Fu, W. Classification of Infection Grade for Anthracnose in Mango Leaves Under Complex Background Based on CBAM-DBIRNet. Expert Syst. Appl. 2025, 260, 125343. [Google Scholar] [CrossRef]
- Khandelwal, S.; Raut, A.; Vyawahare, H.; Theng, D.; Dhande, S. Optimizing Performance in Mango Plant Leaf Disease Classification Through Advanced Machine Learning Techniques. Eng. Technol. Appl. Sci. Res. 2024, 14, 18476–18480. [Google Scholar] [CrossRef]
- Bezabh, Y.A.; Ayalew, A.M.; Abuhayi, B.M.; Demlie, T.N.; Awoke, E.A.; Mengistu, T.E. Classification of Mango Disease Using Ensemble Convolutional Neural Network. Smart Agric. Technol. 2024, 8, 100476. [Google Scholar] [CrossRef]
- Gautam, V.; Ranjan, R.K.; Dahiya, P.; Kumar, A. ESDNN: A Novel Ensembled Stack Deep Neural Network for Mango Leaf Disease Classification and Detection. Multimed. Tools Appl. 2024, 83, 10989–11015. [Google Scholar] [CrossRef]
- Seetha, J.; Ramanathan, R.; Goyal, V.; Tholkapiyan, M.; Karthikeyan, C.; Kumar, R. Mango Leaf Disease Classification Using Hybrid Coyote-Grey Wolf Optimization Tuned Neural Network Model. Multimed. Tools Appl. 2024, 83, 17699–17725. [Google Scholar] [CrossRef]
- Ali, A.H.; Youssef, A.; Abdelal, M.; Raja, M.A. An Ensemble of Deep Learning Architectures for Accurate Plant Disease Classification. Ecol. Inform. 2024, 81, 102618. [Google Scholar] [CrossRef]
- Fahim-Ul-Islam, M.; Chakrabarty, A.; Rahman, R.; Moon, H.; Piran, M.J. Advancing Mango Leaf Variant Identification with a Robust Multi-Layer Perceptron Model. Sci. Rep. 2024, 14, 27406. [Google Scholar] [CrossRef] [PubMed]
- Salamai, A.A. Enhancing Mango Disease Diagnosis through Eco-Informatics: A Deep Learning Approach. Ecol. Inform. 2023, 77, 102216. [Google Scholar] [CrossRef]
- Ramadan, S.T.Y.; Sakib, T.; Rahat, M.A.; Mosharrof, S.; Rakin, F.I.; Jahangir, R. Enhancing Mango Leaf Disease Classification: ViT, BiT, and CNN-Based Models Evaluated on CycleGAN-Augmented Data. In Proceedings of the 2023 26th International Conference on Computer and Information Technology (ICCIT), Cox’s Bazar, Bangladesh, 13–15 December 2023; pp. 1–6. [Google Scholar]
- Asha Rani, K.P.; Gowrishankar, S. ConvNext-Based Mango Leaf Disease Detection: Differentiating Pathogens and Pests for Improved Accuracy. Int. J. Adv. Comput. Sci. Appl. 2023, 14. [Google Scholar] [CrossRef]
- Patel, R.K.; Chaudhary, A.; Chouhan, S.S.; Pandey, K.K. Mango Leaf Disease Diagnosis Using Total Variation Filter-Based Variational Mode Decomposition. Comput. Electr. Eng. 2024, 120, 109795. [Google Scholar] [CrossRef]
- Raval, H.; Chaki, J. Ensemble Transfer Learning Meets Explainable AI: A Deep Learning Approach for Leaf Disease Detection. Ecol. Inform. 2024, 84, 102925. [Google Scholar] [CrossRef]
- Chang, B.; Wang, Y.; Zhao, X.; Li, G.; Yuan, P. A General-Purpose Edge-Feature Guidance Module to Enhance Vision Transformers for Plant Disease Identification. Expert Syst. Appl. 2024, 237, 121638. [Google Scholar] [CrossRef]
- Rahaman, M.; Chowdhury, M.; Rahman, M.A.; Ahmed, H.; Hossain, M.; Rahman, M.H.; Biswas, M.; Kader, M.; Noyan, T.A.; Biswas, M. A Deep Learning-Based Smartphone Application for Detecting Mango Diseases and Pesticide Suggestions. Int. J. Comput. Digit. Syst. 2023, 13, 1. [Google Scholar] [CrossRef]
- Hossain, M.A.; Sakib, S.; Abdullah, H.M.; Arman, S.E. Deep Learning for Mango Leaf Disease Identification: A Vision Transformer Perspective. Heliyon 2024, 10, 17. [Google Scholar] [CrossRef]
- Islam, M.M.; Adil, M.A.A.; Talukder, M.A.; Ahamed, M.K.U.; Uddin, M.A.; Hasan, M.K.; Sharmin, S.; Rahman, M.M.; Debnath, S.K. DeepCrop: Deep Learning-Based Crop Disease Prediction with Web Application. J. Agric. Food Res. 2023, 14, 100764. [Google Scholar] [CrossRef]
- Lobaton, P.G.O.; Magtiay, J.E.C.; Mendez, V.G.E.; Moster, G.J.G.; Casabuena, M.M.; Gaspar, M.M.; Mojares, P.V. LEAFLET: A Web-Based Leaf Classification System Using Convolutional Neural Networks. J. Electr. Syst. 2024, 20, 18. [Google Scholar] [CrossRef]
- Babatunde, R.S.; Babatunde, A.N.; Ogundokun, R.O.; Yusuf, O.K.; Sadiku, P.O.; Shah, M.A. A Novel Smartphone Application for Early Detection of Habanero Disease. Sci. Rep. 2024, 14, 1423. [Google Scholar] [CrossRef] [PubMed]
- Ahmed, S.I.; Ibrahim, M.; Nadim, M.; Rahman, M.M.; Shejunti, M.M.; Jabid, T.; Ali, M.S. MangoLeafBD: A Comprehensive Image Dataset to Classify Diseased and Healthy Mango Leaves. Data Brief 2023, 47, 108941. [Google Scholar] [CrossRef]
- Rahman, M.S.; Hasan, R.; Mojumdar, M.U. Mango Leaf Disease Dataset. Mendeley Data 2024, V1. Available online: https://data.mendeley.com/datasets/7ghdbftp54/1 (accessed on 30 November 2024).
- Shakib, M.M.H.; Mustofa, S.; Ahad, M.T. MLD24: An Image Dataset for Mango Leaf Disease Detection. Mendeley Data 2024, V1. Available online: https://data.mendeley.com/datasets/6dvpywm2m2/1 (accessed on 30 November 2024).
- Khan, R.; Ud Din, N.; Zaman, A.; Huang, B. Automated tomato leaf disease detection using image processing: An SVM-based approach with GLCM and SIFT features. J. Eng. 2024, 2024, 9918296. [Google Scholar] [CrossRef]
- Kabir, M.; Unal, F.; Akinci, T.C.; Martinez-Morales, A.A.; Ekici, S. Revealing GLCM metric variations across a plant disease dataset: A comprehensive examination and future prospects for enhanced deep learning applications. Electronics 2024, 13, 2299. [Google Scholar] [CrossRef]
- Iqbal, N.; Mumtaz, R.; Shafi, U.; Zaidi, S.M.H. Gray Level Co-Occurrence Matrix (GLCM) Texture-Based Crop Classification Using Low Altitude Remote Sensing Platforms. PeerJ Comput. Sci. 2021, 7, e536. [Google Scholar] [CrossRef]
- Shakya, A.K.; Vidyarthi, A. Comprehensive Study of Compression and Texture Integration for Digital Imaging and Communications in Medicine Data Analysis. Technologies 2024, 12, 17. [Google Scholar] [CrossRef]
- Cong, S.; Zhou, Y. A Review of Convolutional Neural Network Architectures and Their Optimizations. Artif. Intell. Rev. 2023, 56, 1905–1969. [Google Scholar] [CrossRef]
- Verma, P.R.; Singh, N.P.; Pantola, D.; Cheng, X. Neural Network Developments: A Detailed Survey from Static to Dynamic Models. Comput. Electr. Eng. 2024, 120, 109710. [Google Scholar] [CrossRef]
- Kotwal, J.G.; Kashyap, R.; Shafi, P.M. Artificial Driving-Based EfficientNet for Automatic Plant Leaf Disease Classification. Multimed. Tools Appl. 2024, 83, 38209–38240. [Google Scholar] [CrossRef]
- Luo, Y.; Xu, Y.; Wang, C.; Li, Q.; Fu, C.; Jiang, H. ResNeXt-CC: A Novel Network Based on Cross-Layer Deep-Feature Fusion for White Blood Cell Classification. Sci. Rep. 2024, 14, 18439. [Google Scholar] [CrossRef] [PubMed]
- Priya, A.; Bharathi, P.S. SE-ResNeXt-50-CNN: A Deep Learning Model for Lung Cancer Classification. Appl. Soft Comput. 2025, 171, 112696. [Google Scholar] [CrossRef]
- Sharma, A.; Dalmia, R.; Saxena, A.; Mohana, R. A Stacked Deep Learning Approach for Multiclass Classification of Plant Diseases. Plant Soil 2025, 506, 621–638. [Google Scholar] [CrossRef]
- Buakum, B.; Kosacka-Olejnik, M.; Pitakaso, R.; Srichok, T.; Khonjun, S.; Luesak, P.; Nanthasamroeng, N.; Gonwirat, S. Two-Stage Ensemble Deep Learning Model for Precise Leaf Abnormality Detection in Centella asiatica. AgriEngineering 2024, 6, 620–644. [Google Scholar] [CrossRef]
- Kukadiya, H.; Arora, N.; Meva, D.; Srivastava, S. An Ensemble Deep Learning Model for Automatic Classification of Cotton Leaves Diseases. Indones. J. Electr. Eng. Comput. Sci. 2024, 33, 1942–1949. [Google Scholar] [CrossRef]
- Zheng, C. iFormer: Integrating ConvNet and Transformer for Mobile Application. arXiv 2025, arXiv:2501.15369. [Google Scholar]
- Heidari, M.; Azad, R.; Kolahi, S.G.; Arimond, R.; Niggemeier, L.; Sulaiman, A.; Bozorgpour, A.; Aghdam, E.K.; Kazerouni, A.; Hacihaliloglu, I.; et al. Enhancing Efficiency in Vision Transformer Networks: Design Techniques and Insights. arXiv 2024, arXiv:2403.19882. [Google Scholar]
- Li, Y.; Yuan, G.; Wen, Y.; Hu, J.; Evangelidis, G.; Tulyakov, S.; Wang, Y.; Ren, J. EfficientFormer: Vision Transformers at MobileNet Speed. Adv. Neural Inf. Process. Syst. 2022, 35, 12934–12949. [Google Scholar]
- Nottebaum, M.; Dunnhofer, M.; Micheloni, C. LowFormer: Hardware Efficient Design for Convolutional Transformer Backbones. arXiv 2024, arXiv:2409.03460. [Google Scholar]
- Akter, S.; Islam, O. Dataset of Guava Leaf Diseases in Bangladesh. Mendeley Data 2024, V1. Available online: https://data.mendeley.com/datasets/2ksdzxdvbm/1 (accessed on 30 November 2024).
- Solapure, V.; SmartAgroTech DY; Jawale, A. Tomato Leaf Disease Dataset. Mendeley Data 2024, V1. Available online: https://data.mendeley.com/datasets/zfv4jj7855/1 (accessed on 30 November 2024).
- Mandal, R.; Gouda, M.K. Vineyard Vigilance: Harnessing Deep Learning for Grapevine Disease Detection. J. Emerg. Investig. 2024. Available online: https://emerginginvestigators.org/articles/23-251 (accessed on 30 November 2024). [CrossRef] [PubMed]
- Zhu, F. AppleLeaf9-Enhanced Edition (AL9EE). Dataset. 2023. Available online: https://figshare.com/articles/dataset/AppleLeaf9-Enhanced_Edition_AL9EE_/23606010/1?file=41410185 (accessed on 30 November 2024).
- Haque, R.; Miah, M.M.; Sultana, S.; Fardin, H.; Noman, A.A.; Al-Sakib, A.; Hasan, M.K.; Rafy, A.; Rahman, S.; Rahman, S. Advancements in Jute Leaf Disease Detection: A Comprehensive Study Utilizing Machine Learning and Deep Learning Techniques. In Proceedings of the 2024 IEEE International Conference on Power, Electrical, Electronics and Industrial Applications (PEEIACON), Rajshahi, Bangladesh, 12–13 September 2024; pp. 248–253. [Google Scholar]
Disclaimer/Publisher’s Note: The statements, opinions and data contained in all publications are solely those of the individual author(s) and contributor(s) and not of MDPI and/or the editor(s). MDPI and/or the editor(s) disclaim responsibility for any injury to people or property resulting from any ideas, methods, instructions or products referred to in the content. |
© 2025 by the authors. Licensee MDPI, Basel, Switzerland. This article is an open access article distributed under the terms and conditions of the Creative Commons Attribution (CC BY) license (https://creativecommons.org/licenses/by/4.0/).