You are currently viewing a new version of our website. To view the old version click .
Computers
  • Article
  • Open Access

22 March 2024

Architectural and Technological Approaches for Efficient Energy Management in Multicore Processors

,
,
and
Computer Science and Electrical Engineering Department, “Lucian Blaga” University of Sibiu, Emil Cioran 4, 550025 Sibiu, Romania
*
Authors to whom correspondence should be addressed.
This article belongs to the Special Issue Green Networking and Computing 2022

Abstract

Benchmarks play an essential role in the performance evaluation of novel research concepts. Their effectiveness diminishes if they fail to exploit the available hardware of the evaluated microprocessor or, more broadly, if they are not consistent in comparing various systems. An empirical analysis of the consecrated Splash-2 benchmarks suite vs. the latest version Splash-4 was performed. It was shown that on a 64-core configuration, half of the simulated benchmarks reach temperatures well beyond the critical threshold of 105 °C, emphasizing the necessity of a multi-objective evaluation from at least the following perspectives: energy consumption, performance, chip temperature, and integration area. During the analysis, it was observed that the cores spend a large amount of time in the idle state, around 45% on average in some configurations. This can be exploited by implementing a predictive dynamic voltage and frequency scaling (DVFS) technique called the Simple Core State Predictor (SCSP) to enhance the Intel Nehalem architecture and to simulate it using Sniper. The aim was to decrease the overall energy consumption by reducing power consumption at core level while maintaining the same performance. More than that, the SCSP technique, which operates with core-level abstract information, was applied in parallel with a Value Predictor (VP) or a Dynamic Instruction Reuse (DIR) technique, which rely on instruction-level information. Using the SCSP alone, a 9.95% reduction in power consumption and an energy reduction of 10.54% were achieved, maintaining the performance. By combining the SCSP with the VP technique, a performance increase of 8.87% was obtained while reducing power and energy consumption by 3.13% and 8.48%, respectively.

1. Introduction

Measuring the performance of microprocessors and multicore systems is a challenging task. The continuous evolution of programming paradigms and hardware improvements are also ushering in an update for next-generation benchmarking []. Performance metrics are usually quantified using different standard sets of computer programs, named benchmark suites. It can be said that the foundation for evaluating the performance of computer systems is determined by the benchmark suite. If the benchmark suites do not efficiently use the available hardware resources, one can easily misrepresent the performance of the evaluated system, which can cause architects to overrate the impact of the proposed techniques or underrate that of others.
Another important aspect is the multi-objective evaluation approach. Generally, most of the research in the computer architecture field evaluates proposed systems based on one or two objectives, mostly performance indicators and power consumption. One should argue for performing such evaluations from more perspectives, like maximum chip temperatures, power and energy consumption, computing performance, and the integration area of the system. Evaluating how the proposed solution impacts the chip temperature is even more important nowadays since technology has reached nano-scale dimensions. The continuous rise of the power density in chips is resulting in higher temperature generation and the emergence of thermal hotspots [,]. More than that, high temperatures are an important factor for degrading electronic circuits. Therefore, evaluating multicore chips from a thermal perspective should become mandatory.
DVFS techniques operate by decreasing performance over certain time periods and reducing the power dissipation of the processor. Such techniques exploit the intervals in which the processor experiences a low demand for processing tasks, such as when the system is idle or experiencing minimal activity. While DVFS primarily aims to optimize power efficiency by adjusting the voltage and frequency of the processing units centered on workload demands, it can also have a secondary effect of controlling temperatures to protect the chip from overheating. A reduction in power consumption can contribute to maintaining the chip’s temperature within safe operating limits. However, it is important to note that DVFS alone may not always be sufficient for protecting the chip from high temperatures (hotspots), especially in multicore systems where workload distribution and thermal interactions between cores can be complex. Additionally, Dynamic Thermal Management (DTM) techniques such as thermal monitoring, thermal throttling, and cooling solutions like heatsinks or fans may also be necessary to ensure that the chip operates within its temperature specifications [].
In this study, the integration of the latest Splash-4 [] benchmark suite into the Sniper simulator environment was carried out, and an empirical analysis comparing this suite to an older suite, Splash-2 [], was performed. The applicability of the SCSP to the DVFS subsystem of the microprocessor was evaluated. The target was to decrease the overall energy consumption by decreasing the power consumption at core level while keeping the same performance. The main idea was to exploit the intrinsic idle time that was identified during simulations, and for each core, based on the predictor outcome, to dynamically adjust the frequency and voltage. Using the SCSP, it was possible to achieve a reduction of 9.95% in power consumption and an energy saving of 10.54% without affecting the performance significantly. More than that, this technique, which uses core-level information, was applied in tandem with predictive and anticipative techniques, which operate on instruction-level information. When the SCSP was applied in parallel with the value prediction technique, the following results were achieved: a performance increase of 8.87%, a 3.13% decrease in power consumption, and an 8.48% decrease in energy consumption. A comprehensive analysis of those configurations was conducted in the proposed simulation environment.
The remainder of the paper is organized as follows: Section 2 presents related work involving parallel benchmarks, multicore simulators, value prediction and dynamic instruction reuse, and DVFS techniques. Section 3 shows the technical modifications that were made for the implementation of the SCSP and for the evaluation of the area, power consumption, and chip temperature. In Section 4, the simulation environment is presented along with the metrics used for the evaluation. The simulation results are presented in Section 5. First, an evaluation of the Splash-2 and Splash-4 benchmark suites is presented. Second, the simulation results of the enhanced architecture with the SCSP and with the combination of the SCSP with DIR and VP are discussed. The paper presents conclusions in Section 6, along with directions for future research.

3. Methodology and Technical Modifications

In this section, details about the implementation of the SCSP and how it interacts with the Sniper simulator are presented. An overview of the methodology used to estimate the power consumption, integration area, and chip temperatures is also shown. It is illustrated how all the used simulators and frameworks are connected to each other.

3.1. Simple Core State Predictor Implementation

For the implementation of the SCSP, the core functionality of Sniper version 7.2 was expanded. One of the challenges was to make the state of each core available in the plugin space of the simulator. In the current implementation, it is available only in the backend, which is developed in C++, while the plugins are written in Python. Interaction between the Python space and C++ is possible via the integrated SimAPI, which offers numerous interfaces that are accessible for the real-time analysis and manipulation of the simulator’s state. The SimAPI has been extended to include an interface for reading out the core state from the backend of the simulator.
In Figure 1, the generic SCPS scheme is presented. It consists of a prediction table where each line is associated with one core. Each line stores up to H previous states (S) and the confidence counter (CO). A core can have one of the following states: running, initializing, stalled, sleeping, waking up, idle, or broken. For the predictor, the only information that is required is to know whether the core is in an idle state or not; therefore, each state can be stored in a boolean datatype, minimizing the memory footprint. The frequency selection logic takes into consideration the last prediction, the actual state, the confidence, and the confidence threshold. Each time the SCPS is called, it performs a prediction for the next core state based on the previous states, which is checked on the next call, and the confidence is updated. If the predictor acquires enough confidence (CO > COthreshold), the core frequency is changed speculatively based on the predictor outcome. If it predicts the idle state, the fidle frequency is set; otherwise, the configured frequency fconfigured is applied. The maximum time required for the core frequency to change effectively is 2 µs.
Figure 1. An overview of the Simple Core State Predictor (SCPS) scheme.
A simplified pseudocode reflecting the prediction logic is presented in Algorithm 1. The logic is grouped into four parts: initialization, reaction to the last prediction, confidence update, and performing a new prediction. In the initialization part (lines 2–4), the actual core state is read, the core-specific SCSP line is selected, and the previous predicted state is constructed using the “get_prediction” function. The reaction to the last prediction is carried out in lines 7–9. If the previous prediction has enough confidence, then the predicted state is compared against the actual state. If there is a difference, then the Corex frequency is adjusted according to the actual core state. After this step, in lines 12–16, the predictor confidence counter is updated; it is reset to 0 in the case of a wrong prediction or incremented in the case of a correct prediction. The actual core state is inserted into the predictor table in line 18, and considering the new state, a new prediction is performed in line 21. If the predictor acquires enough confidence (line 24), then the Corex frequency is speculatively changed (line 25) until the next call.
Algorithm 1. SCSP Prediction Logic
1for x in [0, num_cores−1]:
2  actual_state = get_core_state(x)
3  scsp = get_scsp(x)
4  predicted_state = scsp.get_prediction()
5
6  # Check and react on last confident prediction
7  if scsp.CO >= COthreshold:
8    if predicted_state != actual_state:
9      adjust_frequency(x, actual_state)
10
11  # Update the confidence counter
12  if predicted_state != actual_state:
13    scsp.CO = 0
14  else:
15    if scsp.CO < COthreshold:
16      scsp.CO += 1
17
18  scsp.add_state(actual_state)
19
20  # Perform a new prediction
21  predicted_state = scsp.get_prediction()
22
23  # If confident enough, adjust core frequency accordingly
24  if scsp.CO >= COthreshold:
25    adjust_frequency(x, predicted_state)
The SCSP is implemented as a Python plugin and can be called during the simulation by appending the following command when executing Sniper:
−s scps:<calling_interval_ns>:<idle_frequency_mhz>:<confidence>:<history>
where:
  • <calling_interval_ns> specifies the periodicity of script execution.
  • <idle_frequency_mhz> the frequency that is set in case the predicted state is idle.
  • <confidence> represents the threshold of the confidence counter.
  • <history> specifies how many previous states are kept in the table.
Figure 2 shows a use case of frequency adaptation using the SCSP on a timeline. In this example, the SCSP uses a COthreshold of 2. In the first phase, the SCSP acquires confidence by making predictions during each calling interval. At this time, the core frequency is not changed, and it remains as it was initially configured. Once the predictor gains enough confidence, the speculation interval is started, an event marked by the black thunder in the figure. In this interval, the core frequency is adapted to the value configured by the “idle_frequency_mhz” parameter, denoted as fidle. Once the SCSP detects that it predicted wrong, the confidence counter is reset (the event marked with the gray thunder in the figure), and the frequency of the corresponding core is set back to the configured value.
Figure 2. Example of frequency adaptation using SCSP.

3.2. Power, Area, and Thermal Estimations

In Figure 3, a simplified overview of the used complex simulation methodology is depicted. This methodology emphasized the use of the multi/many-core simulator Sniper, which was enhanced with the speculative VP unit and the anticipative DIR unit. The DVFS manager within the simulator is also highlighted because the SCSP interacts with it to adapt and read the frequency for each core.
Figure 3. An overview of the simulation methodology.
Sniper has integrated the McPAT [] framework to estimate the power, area, and timing for the components of the microarchitecture. The connection between Sniper and McPAT is accomplished using a plugin (Python script), which dynamically creates the required configuration artifacts, runs the McPAT executable, and stores the outcome in Sniper’s internal database, which can be accessed by other plugins.
For the thermal estimation, the HotSpot [] simulator was used, which is fast and has an accuracy in the 90–98% range. The simulator estimates the chip temperatures based on a power trace file and the spatial configuration of the chip (floorplan). The floorplan describes the position and size of the blocks inside the microprocessor architecture. The power trace file contains the power consumption of each functional unit from the microprocessor sampled at a specific time (e.g., every 500 µs). To integrate HotSpot into the Sniper simulator, a plugin-based solution was developed in [] and further extended for this work. The most notable improvement made is the ability to use dynamic frequency and voltage for power and integration area estimations.

4. Simulation Environment and Metrics

All simulations were performed on a host system comprising an Intel Xenon Gold 6240R CPU (equipped with 48 physical and 96 virtual cores running at 2.4 GHz), 128 GB DRAM (2.933 GHz), and 2 TB SSD storage. The Sniper simulator was executed on a Linux virtual machine, which runs the Ubuntu 18.04 64-bit operating system. The Intel Nehalem microarchitecture in Gainestown configuration was simulated considering a 45 nm integration technology, as summarized in Table 1. One observation is that the Splash-4 benchmarks, when running on more than 32 cores, are more demanding in terms of DRAM requests. The DRAM directory is implemented in Sniper as a set-associative unit, and many times it has been observed that there are too many outstanding requests for which no entry can be associated; this leads to an unrecoverable error and the end of the simulation. To mitigate this, the associativity of DRAM was increased from 16 to 32. According to the Sniper developers, increasing the associativity of this structure mitigates the probability of conflicts but does not impact the performance of the simulation. All benchmarks were compiled using the “O3” optimization option.
Table 1. Baseline configuration of Intel Nehalem (Gainestown).
The number of instructions per cycles (1) is the most common performance metric for processors. Formula (2) was used to measure the performance at the core level, whereas the overall process performance was calculated according to (3). For each metric, the relative difference was calculated using Equation (4). The metrics used included processor performance, core performance, energy consumption, dynamic power consumption, predictor accuracy, idle time, and maximum chip temperature. The energy consumption was computed using (5) []. The calculation for the average CPU frequency was carried out dynamically using a running average for all cores sampled, as specified by the SCSP-calling interval parameter (e.g., each 2 µs).
IPC = I N
Core   Performance = i = 1 N I P C i C
Processor   Performance = i = 1 N I i MAX 1 k N { E k }
where:
  • I = the number of instructions executed.
  • N = the number of cycles necessary to execute the instructions.
  • C = the number of cores.
  • Ek = execution time in cycles for core k.
Relative   Difference = M E M B M B × 100   [ % ]
where:
  • MB = Metric of the baseline configuration.
  • ME = Metric of the enhanced architecture (with SCSP, DIR, or VP unit).
Energy = AVG ( P ) × MAX ( C ) AVG ( f C P U )   [ J ]
where:
  • P = the dynamic power consumption.
  • C = the number of cycles.
  • fCPU = frequency of the simulated processor [Hz].

5. Experimental Results

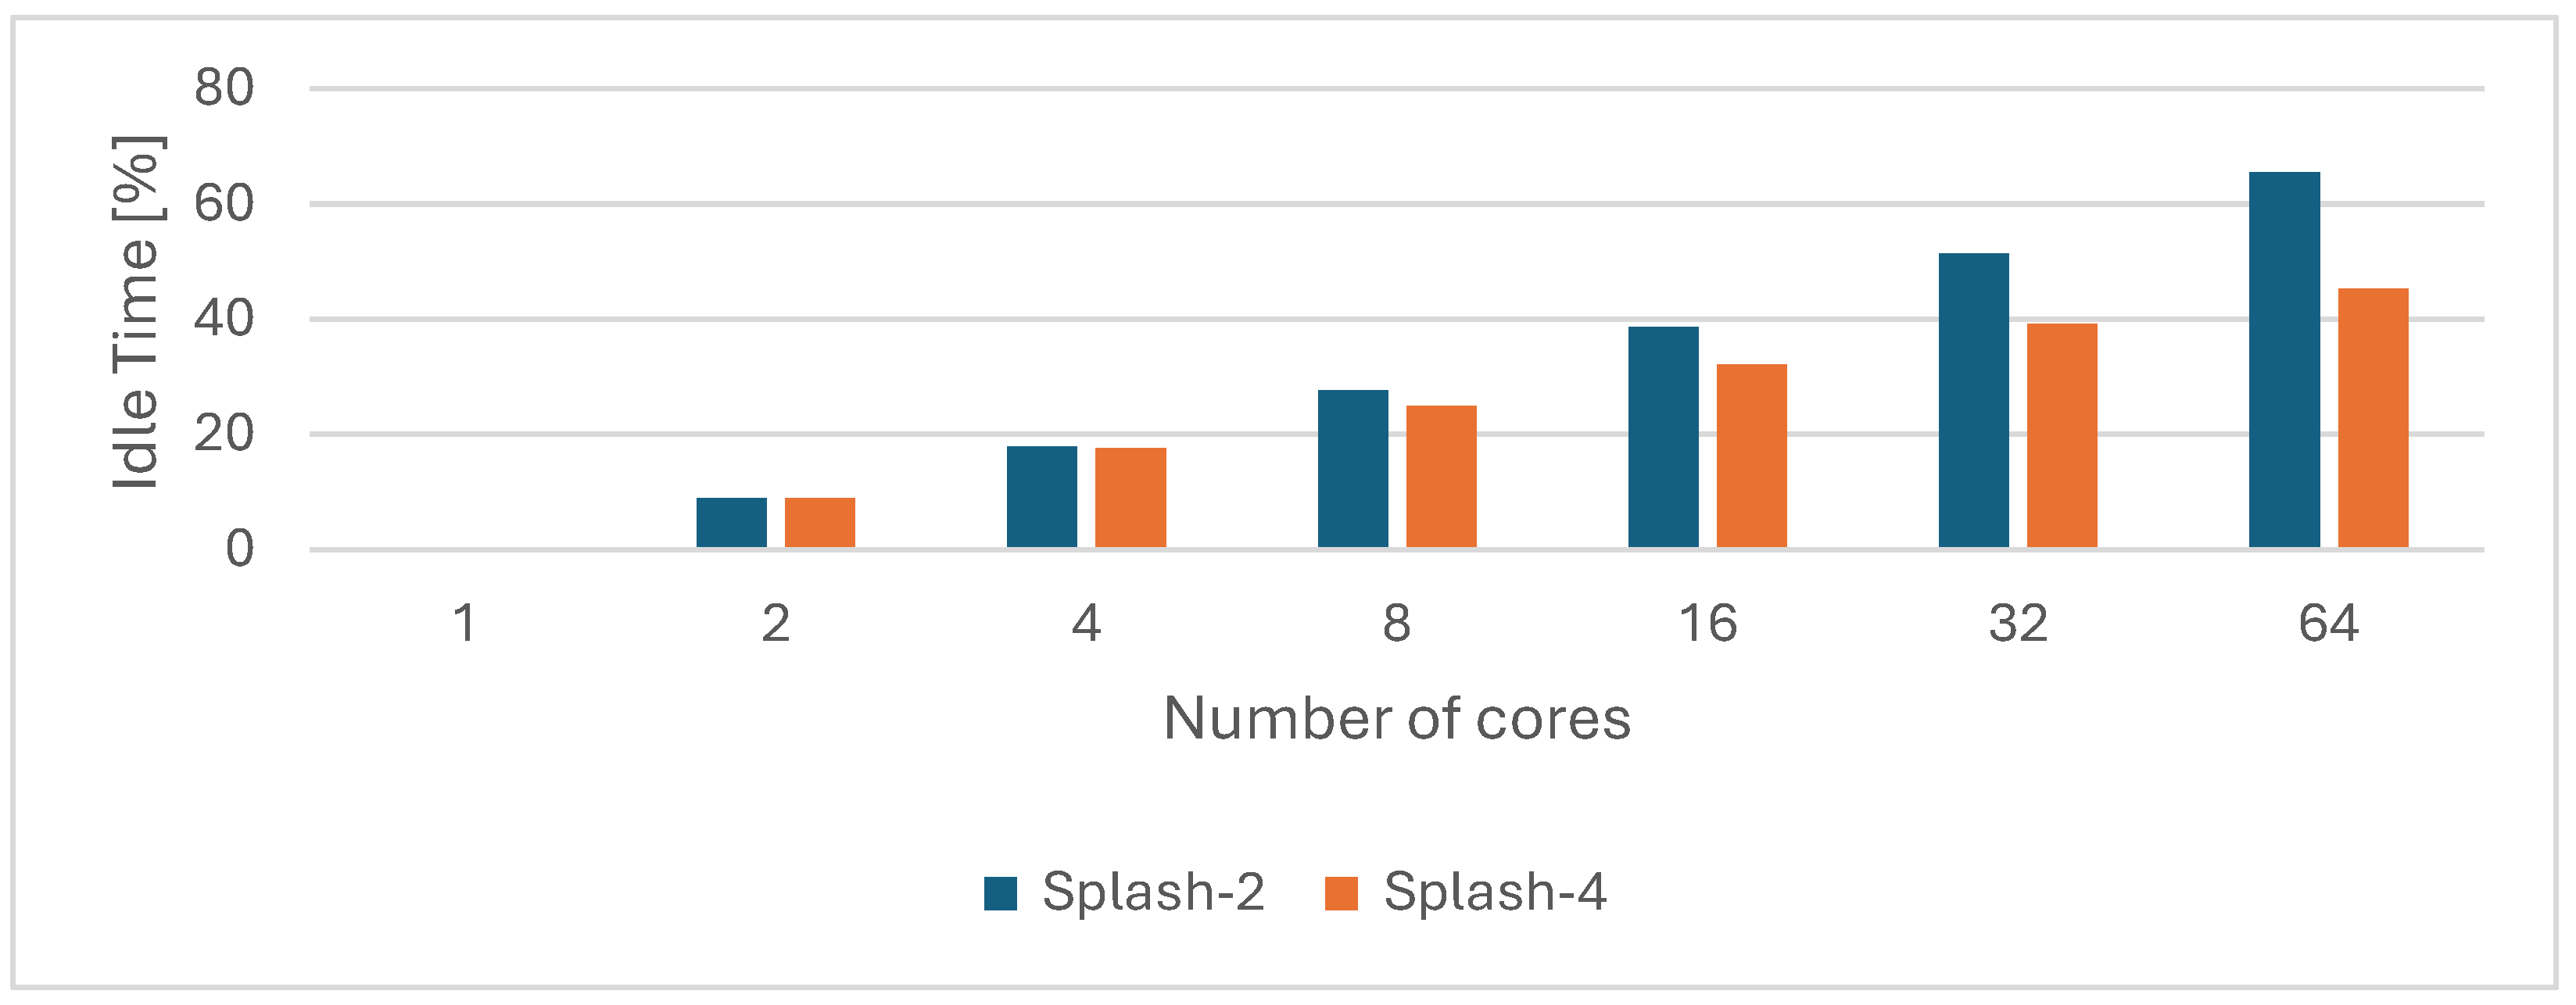
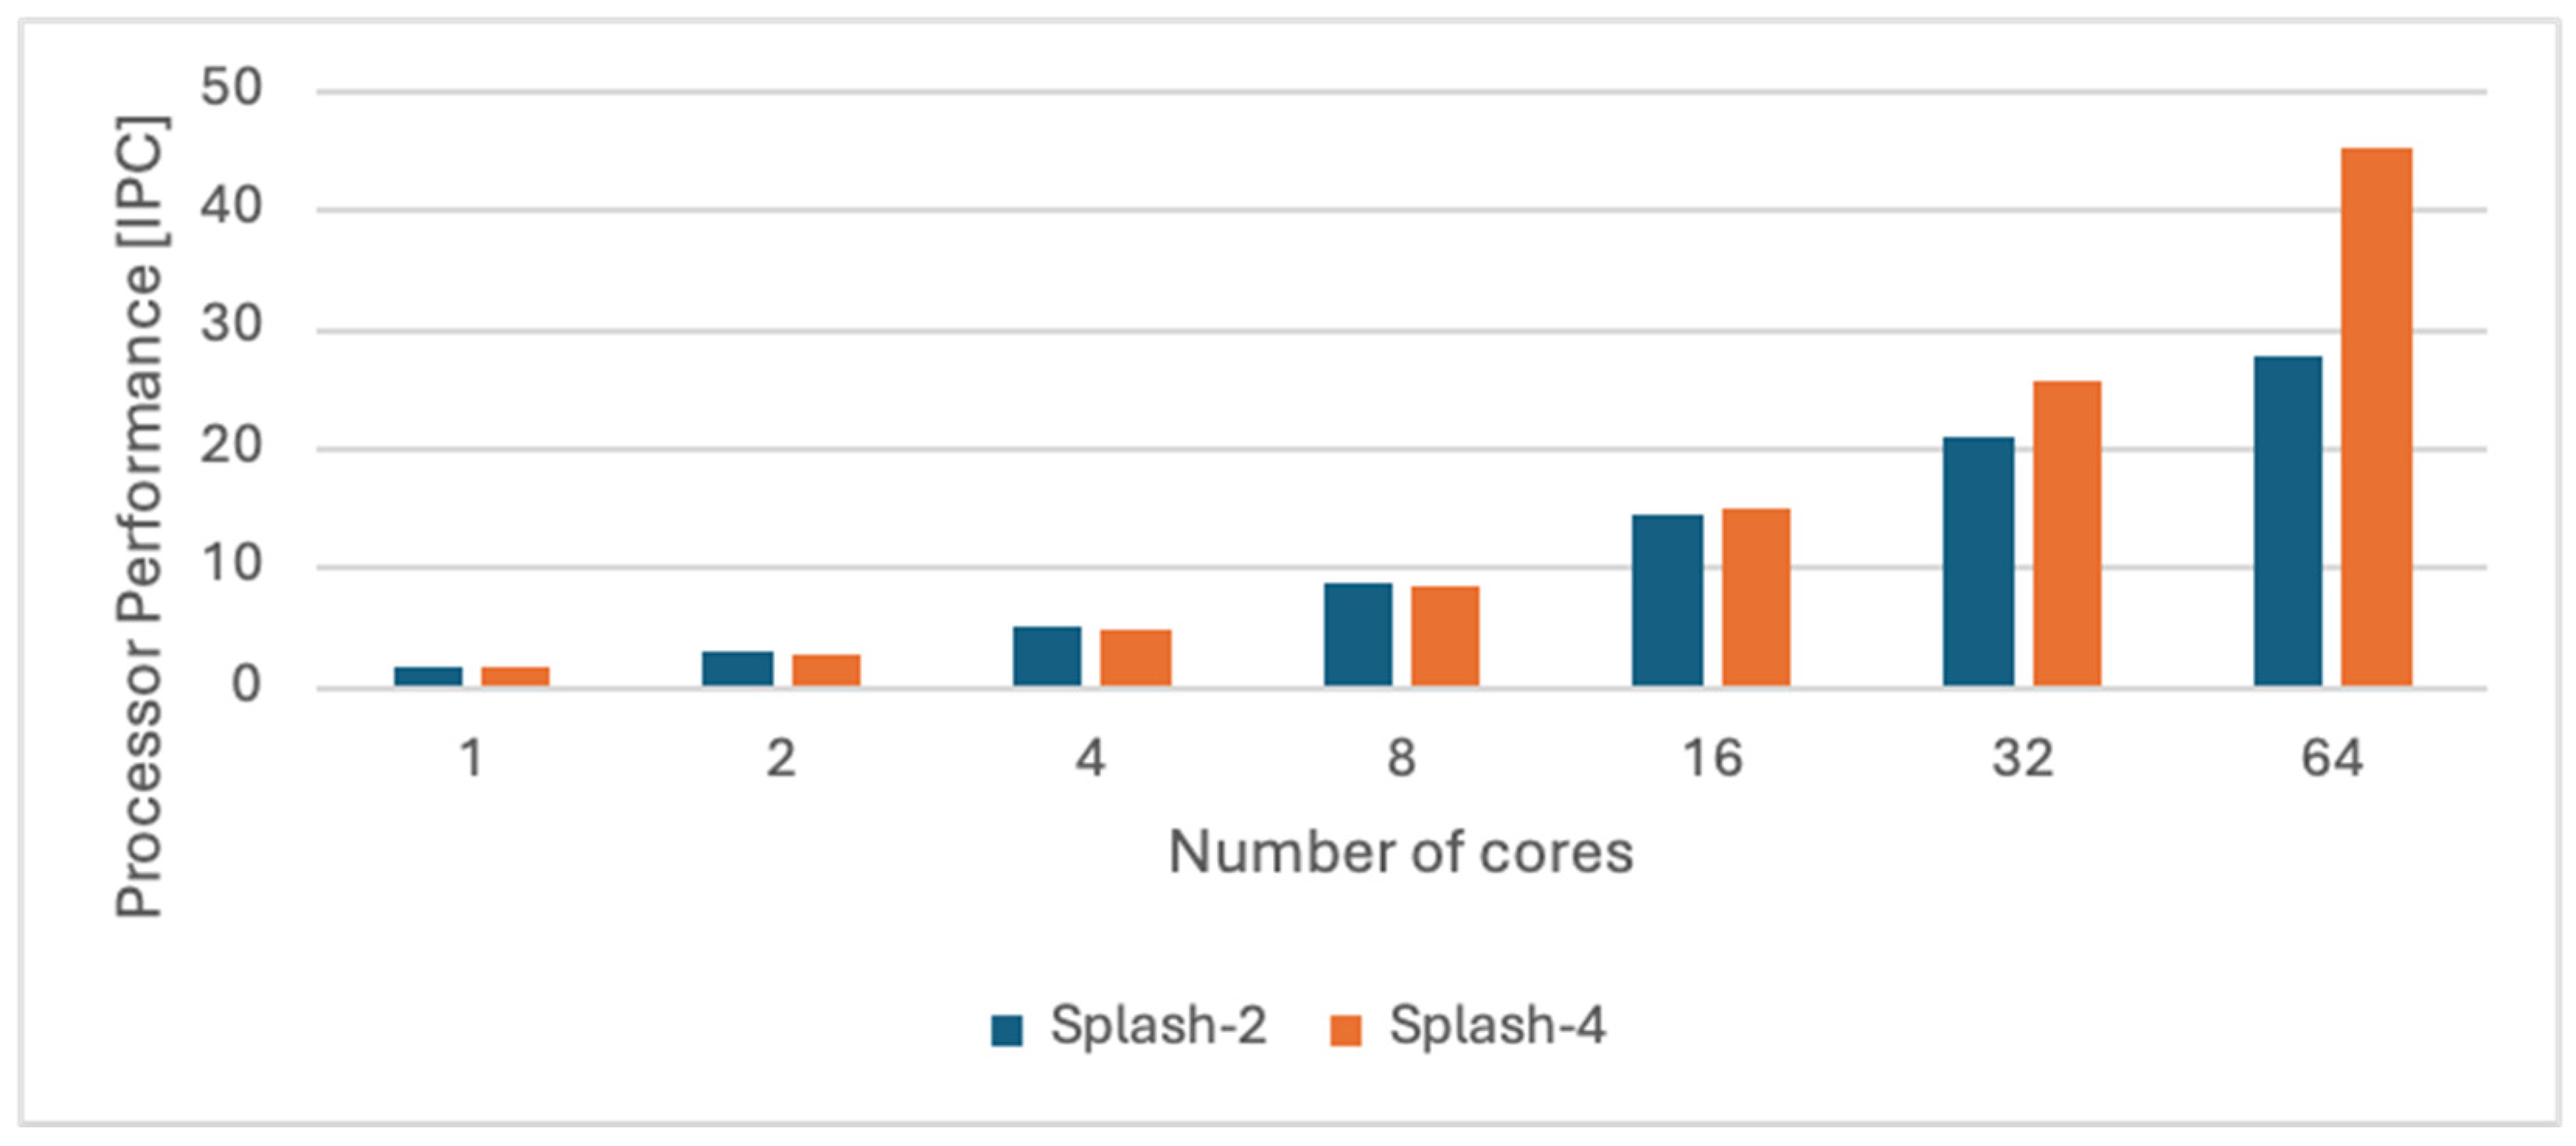
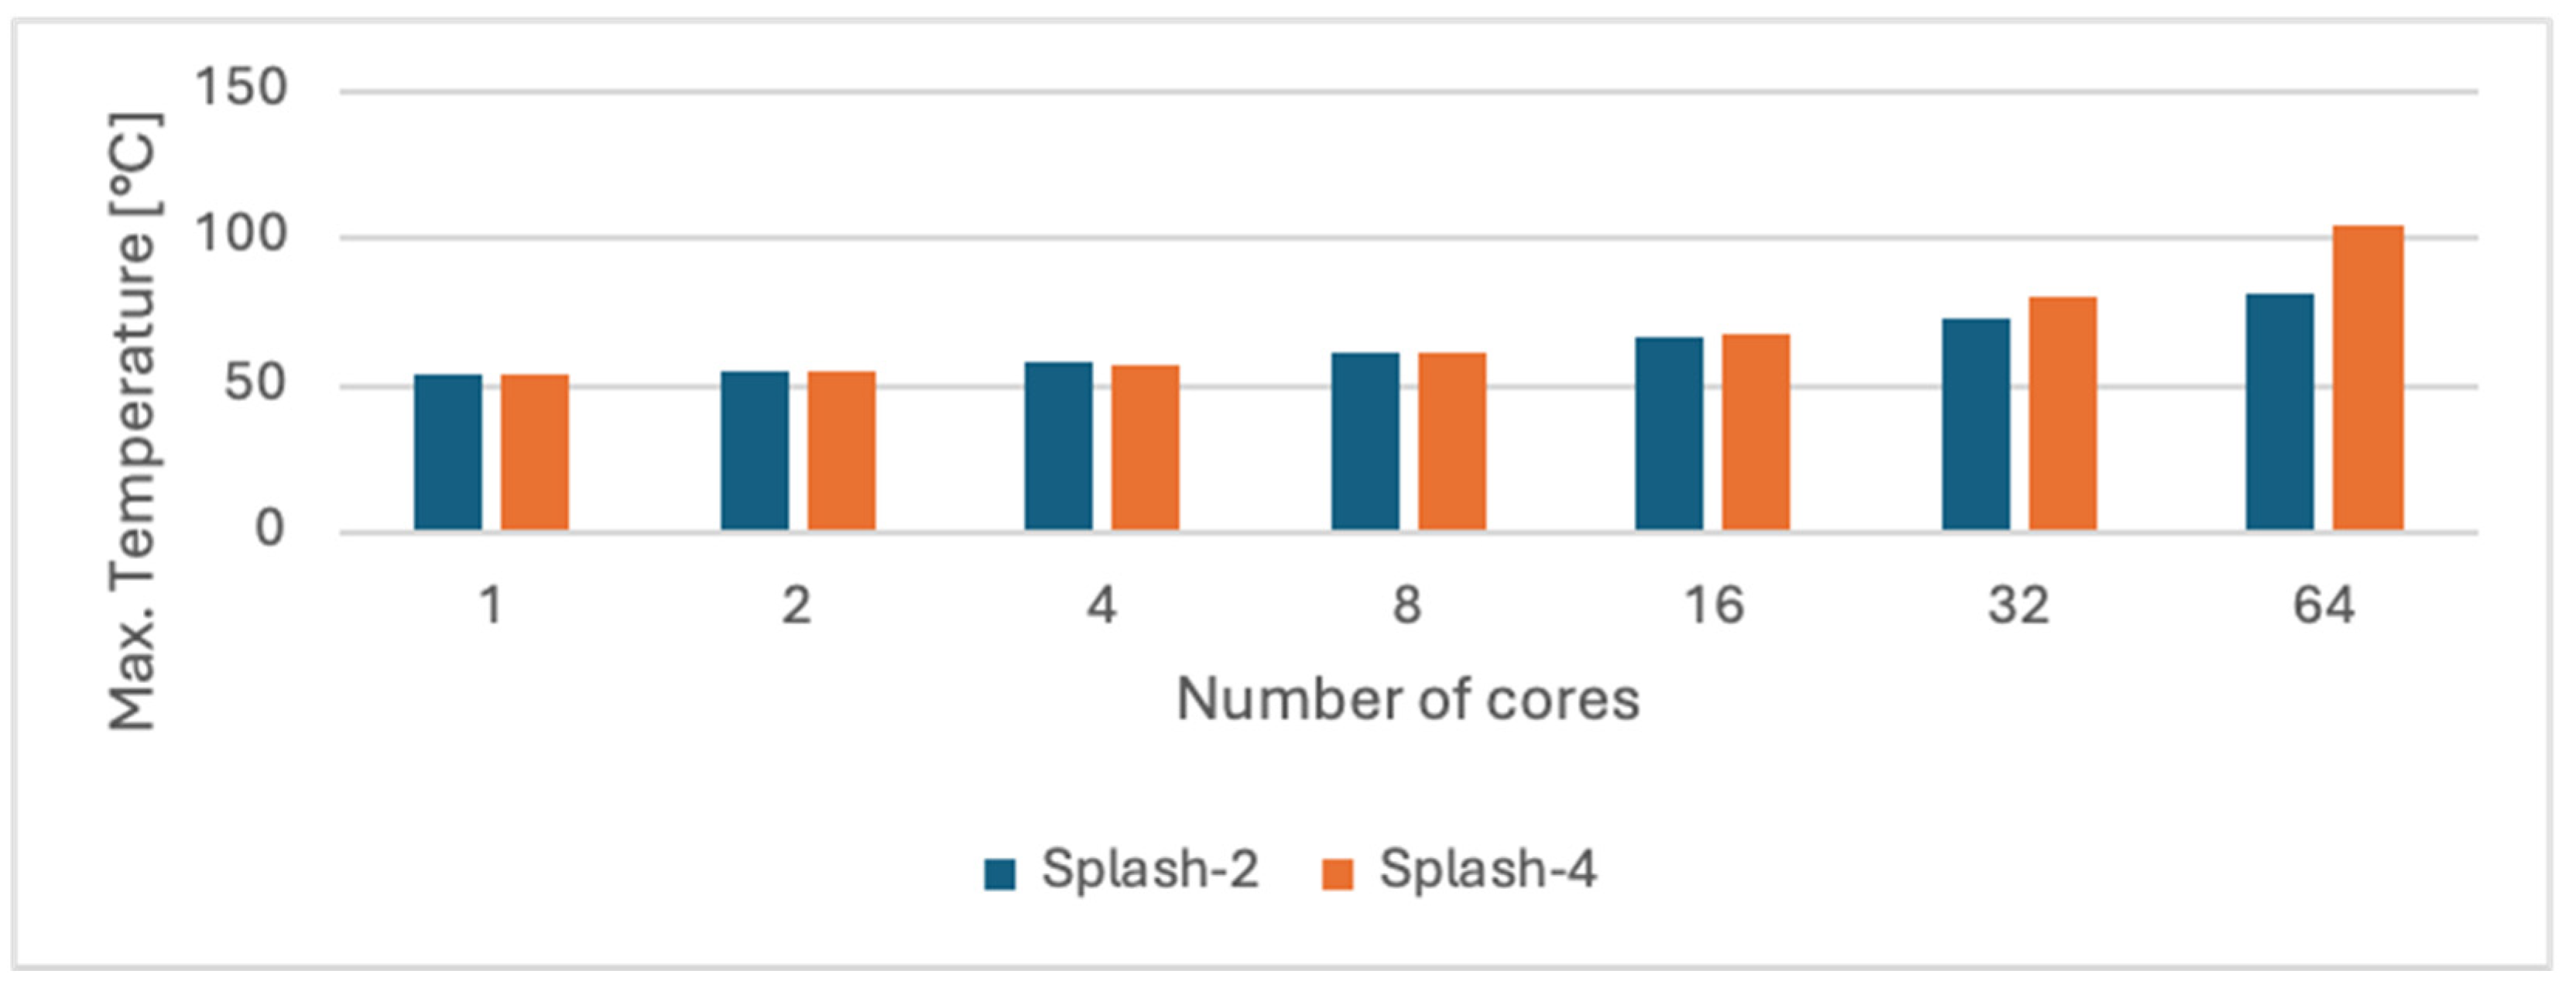
5.1. An Empirical Analysis of Splash-2 and Splash-4

This section presents a comparison between the older Splash-2 suite and the latest enhanced version, Splash-4. The analysis was carried out with variations in the number of cores to reflect the scalability characteristics of the benchmarks. For each metric, the average of all benchmarks is shown. The total simulation time to generate these results was 370 h, ~16 days. The SCSP unit was configured as follows:
  • calling_interval_ns = 2000
  • idle_frequency_mhz = 1000
  • confidence = 0
  • history = 1
The first metric is represented by the time the cores spend in the idle phase; this is shown in Figure 4. Along with the increase in the number of cores, the average idle time linearly increases. From the 8-core configuration up to 64 cores, there is a significant difference between Splash-2 and Splash-4, with the latter achieving up to a 30% reduction in idle time. This reduction comes from the modern programming techniques introduced in the Splash-4 benchmarks to improve their scalability. Also, the idle time seems to remain quite high, especially on the 64-core configuration, where, on Splash-4, a 45% idle time was recorded. This represents the motivating factor for exploiting this idle time by proposing the SCPS with the target of reducing the overall energy consumption by applying DVFS predictively.
Figure 4. Idle time with the variation in the number of cores.
It is commonly known that the overall computing performance can be increased by parallelizing applications and running them on multiple cores. The overall processor performance with the variations number of cores, summarized in Figure 5, was calculated by averaging all benchmarks. The results confirm that the performance increases along with the number of cores, demonstrating the scalability. Starting with the configuration with 16 cores up to the one with 64 cores, Splash-4 performs better than Splash-2. This correlates well with the scalability results achieved in [].
Figure 5. Processor performance with the variation in the number of cores.
In Figure 6, it can be observed that varying the number of cores reduces the average performance at the core level. It may look strange at first, but this happens because of the computer program vs. system scalability and the overhead introduced by communication through shared data (implied by inter/intra-core communication). In other words, it shows the system’s efficiency, meaning that, on average, the programs’ execution is faster when the system offers more computing resources. The way the programs are written to exploit all the available resources as efficiently as possible is also important. The core performance of the 16-, 32-, and 64-core configurations is well correlated with the overall processor performance and idle time.
Figure 6. Averaged core performance with the variation in the number of cores.
A graph showing the dynamic power consumption of the processor in relation to the number of cores is visible in Figure 7. It increases along with the number of cores, and overall, Splash-4 consumes more power than the older suite. This is well correlated with the scalability increase and with the increase in performance and idle time reduction. A higher difference was found on the 64-core configuration, where a difference of ~154 W was measured, making it a good example of the scalability and performance impact on the chip power consumption. Based on the results, it can be stated that the Splash-4 benchmarks consumed more power overall than the Splash-2 benchmarks.
Figure 7. Dynamic power consumption of the processor with the variation in the number of cores.
Figure 8 depicts the averaged energy consumption of the processor in relation to the number of cores. It can be observed that it follows an increasing trend along with the number of cores in terms of performance and power consumption. One important thing to remark is that the increase rate is much smaller compared with the other two metrics, which have an almost exponential increase rate. Hence, since the Splash-2 benchmarks consume less energy in all configurations, it can be stated that they are more energy-efficient than the newer version. For configurations ranging from 1 to 16 cores, the increase can be considered neglectable.
Figure 8. Energy consumption of the processor with the variation in the number of cores.
Following the energy consumption increase trend, the average maximum chip temperature measurements are presented in Figure 9. The chip temperatures might not exceed the critical threshold of 105 °C []. On average, most of the temperatures are well under the commonly critical threshold of 105 °C. The highest recorded value was found on the 64-core configuration of Splash-4 (104.2 °C). A detailed view for this configuration is visible in Figure 10, where it can be seen that the “lu.cont”, “ocean.cont”, “ocean.ncont”, “water.nsq”, and “water.sp” benchmarks have temperatures over the critical threshold, with the highest value of 167.8 °C being measured on “water.sp”.
Figure 9. Maximum chip temperature of the processor with the variation in the number of cores.
Figure 10. Maximum chip temperature of all benchmarks for 64-core configuration.
Figure 11 presents the relative difference of all metrics of interest in relation to the number of cores on Splash-4 compared with Splash-2. It can be observed that the only metric that shows a decreasing trend is idle time, with an up to 30% reduction for the 64-core configuration. The rest of the metrics follow an increasing trend. Compared with Splash-2, on Splash-4, higher performance was achieved while consuming more power and energy and generating higher chip temperatures. On half of the benchmarks, 5 out of 10, the maximum chip temperatures recorded were over the common critical threshold of 105 °C. Beyond this threshold, the DTM techniques usually apply different restrictions to the system, affecting its overall performance and preventing chip degradation. Because of the increased number of cores, bearing in mind the scalability aspects of computer programs, they are executed much faster and generate a much higher power consumption over a shorter period, thus making the chip generate more heat. This is a strong example of the necessity of a multi-objective evaluation.
Figure 11. Relative difference of Splash-4 for each metric in relation to the number of cores.

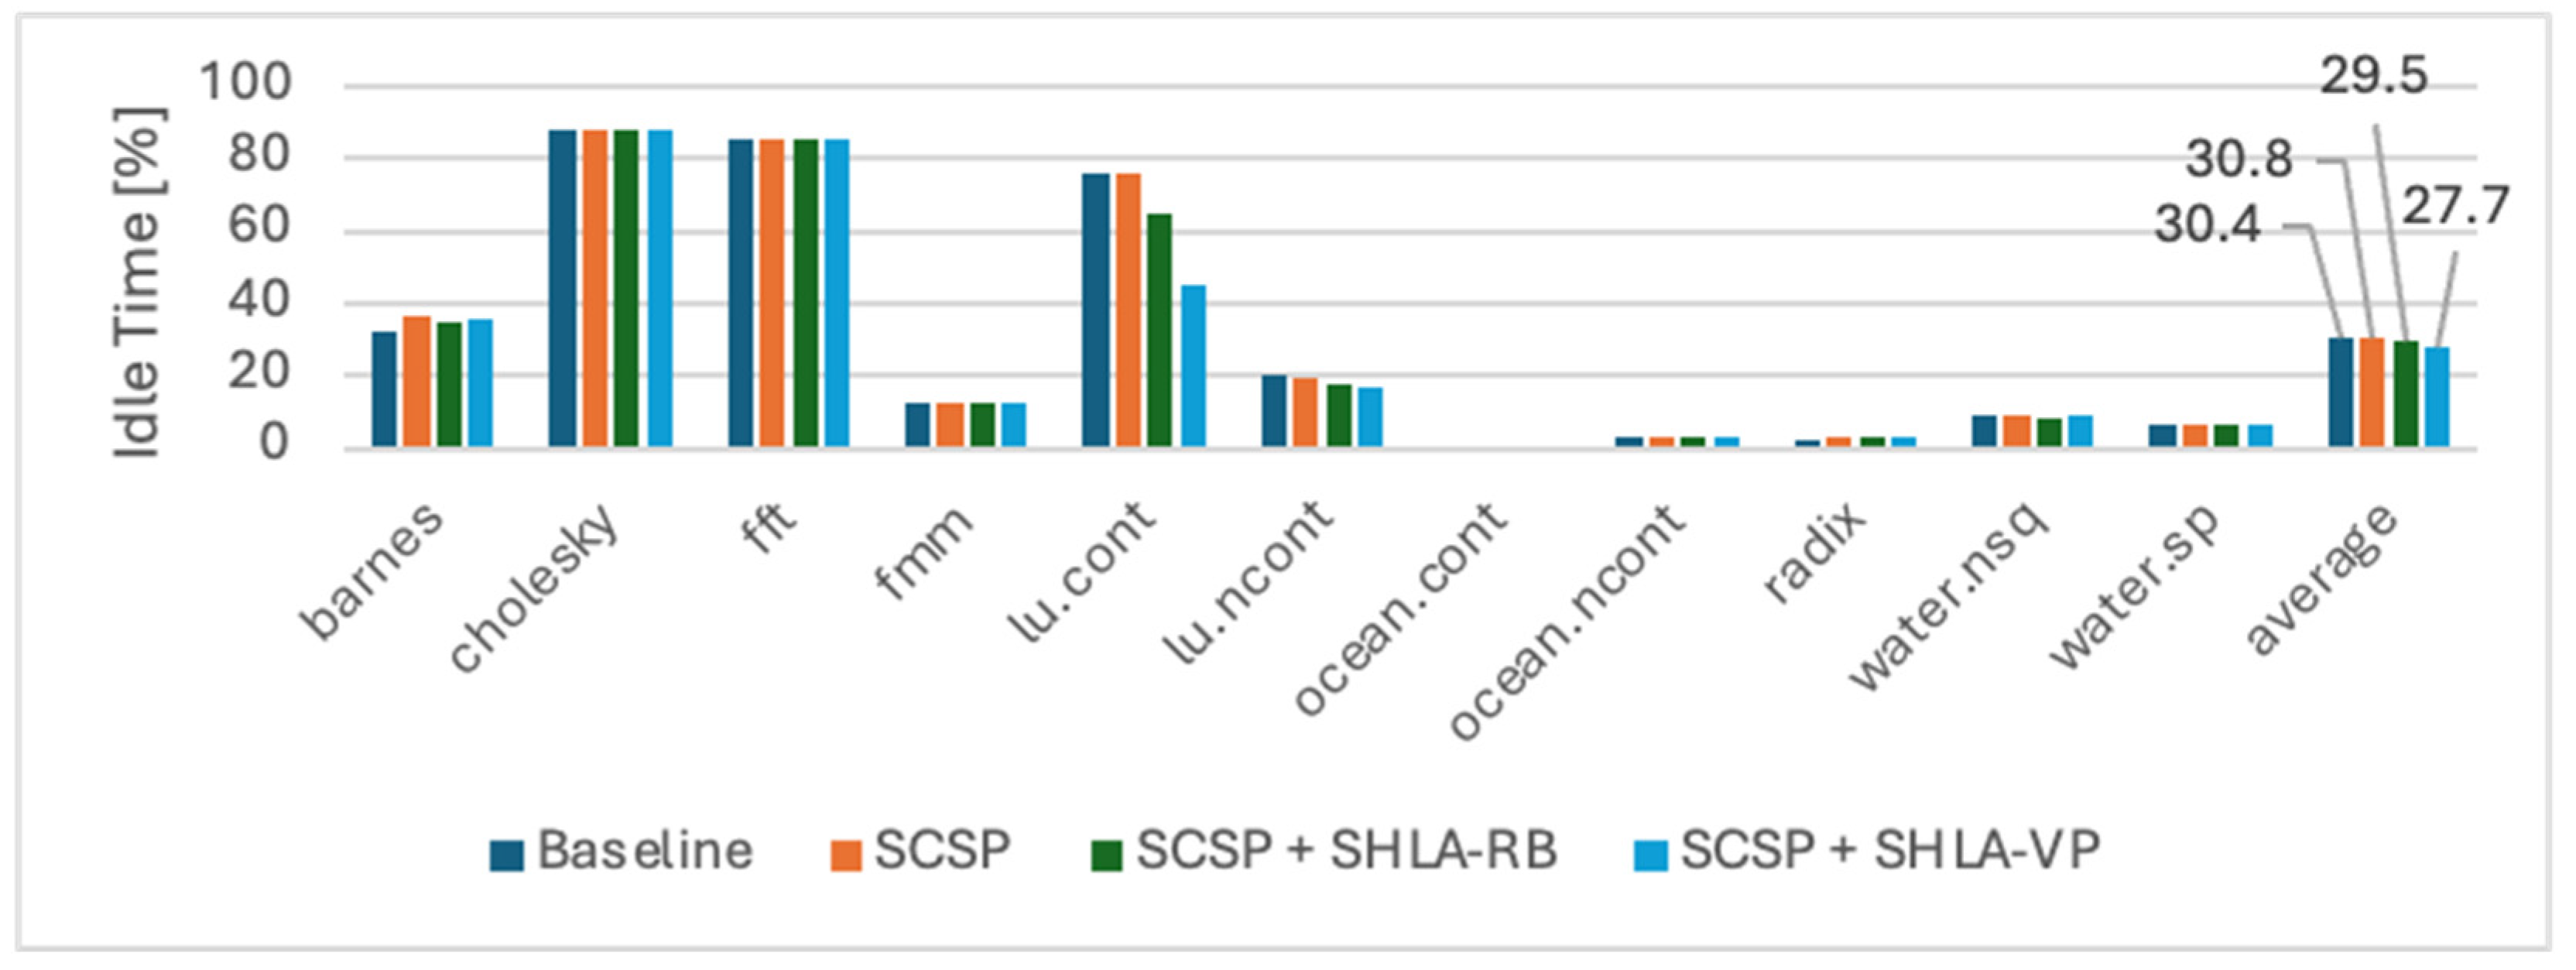
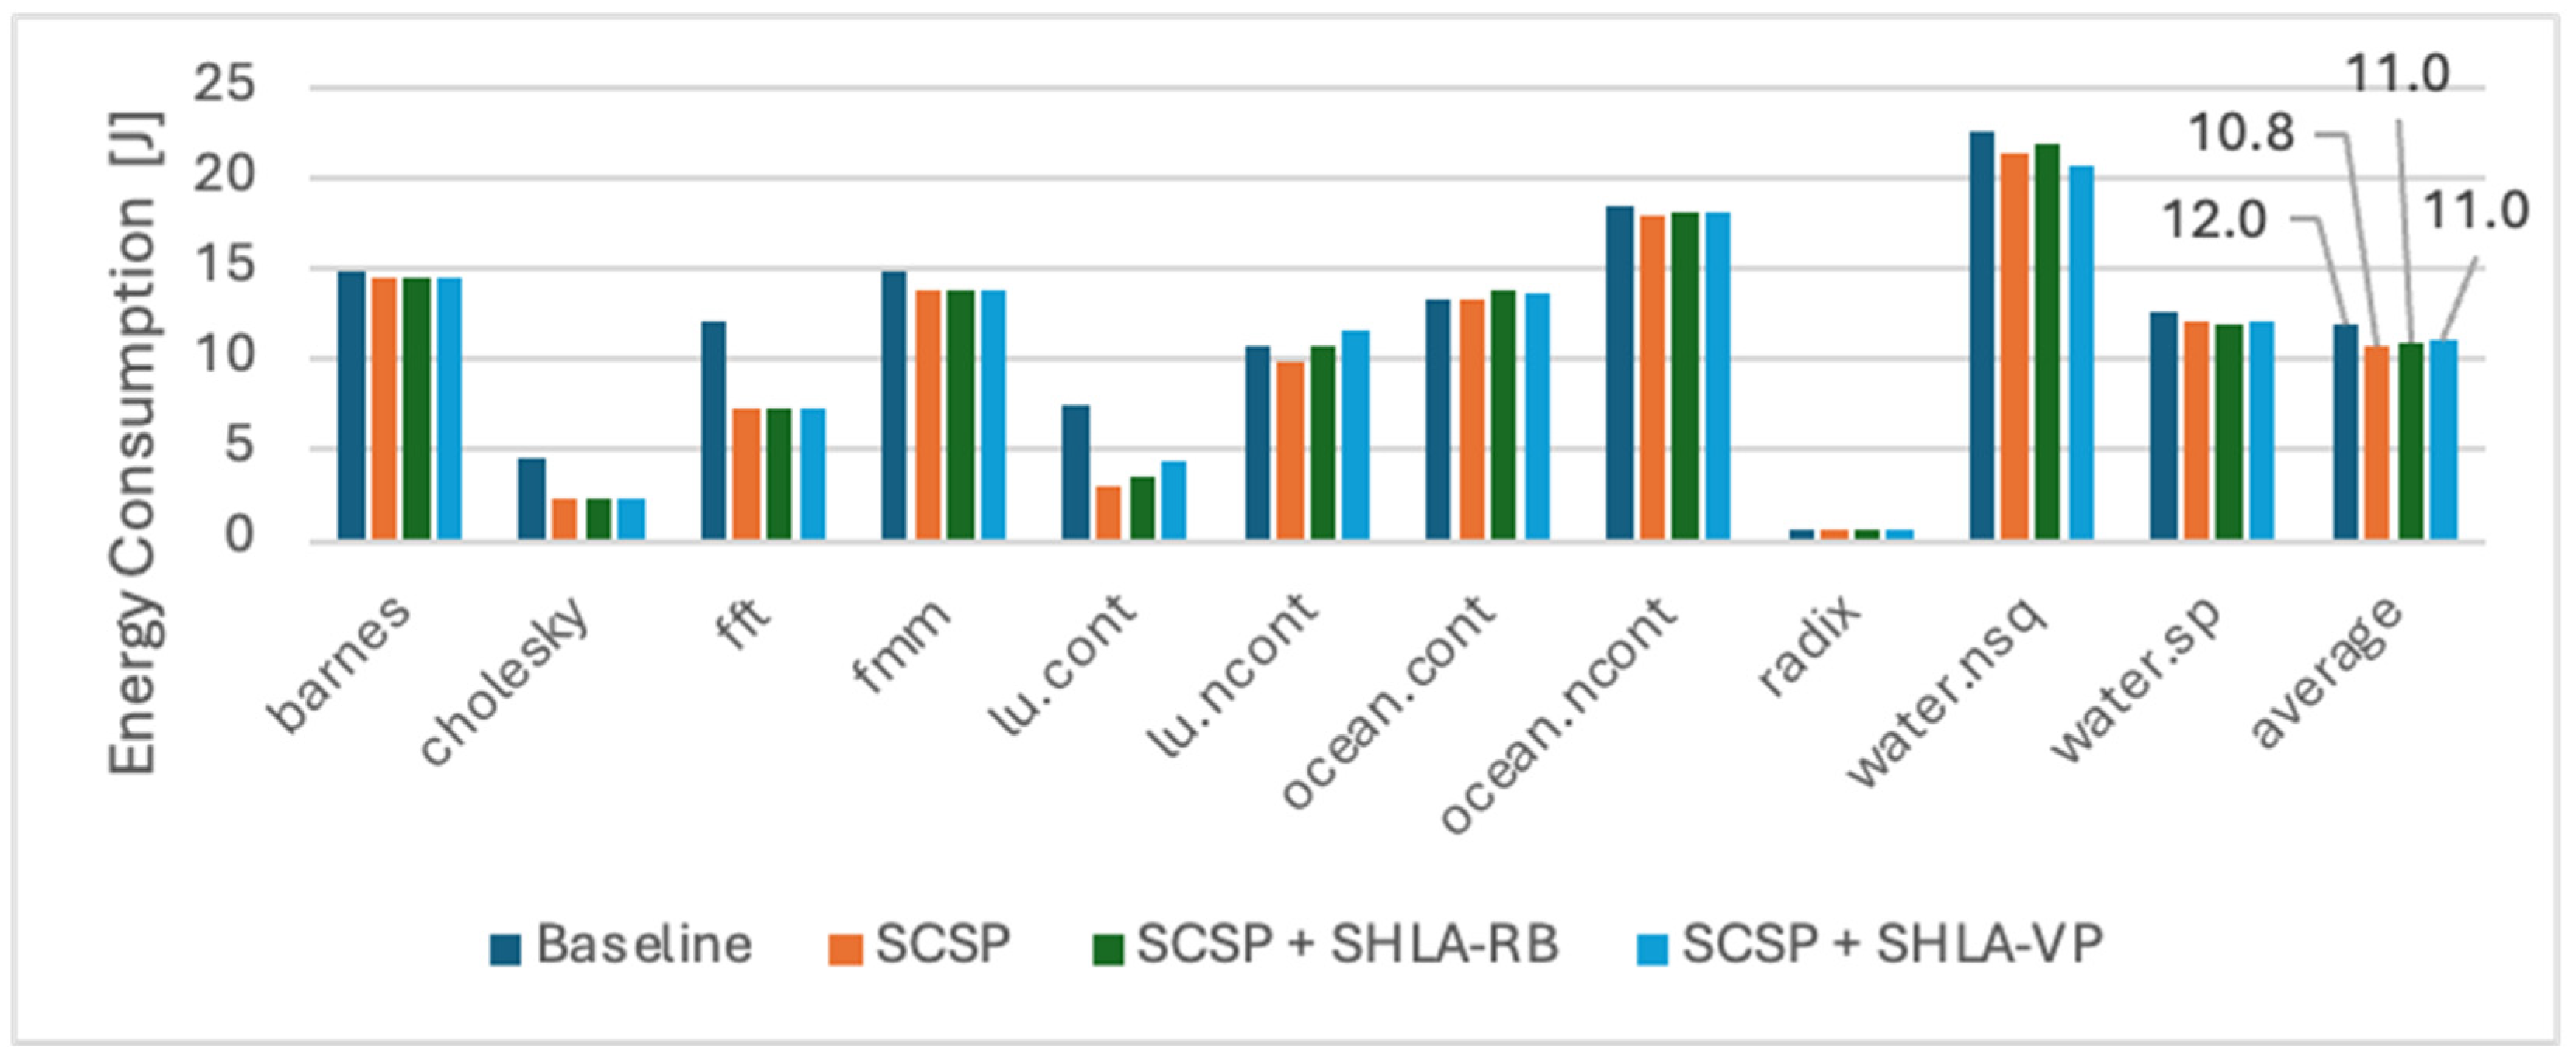
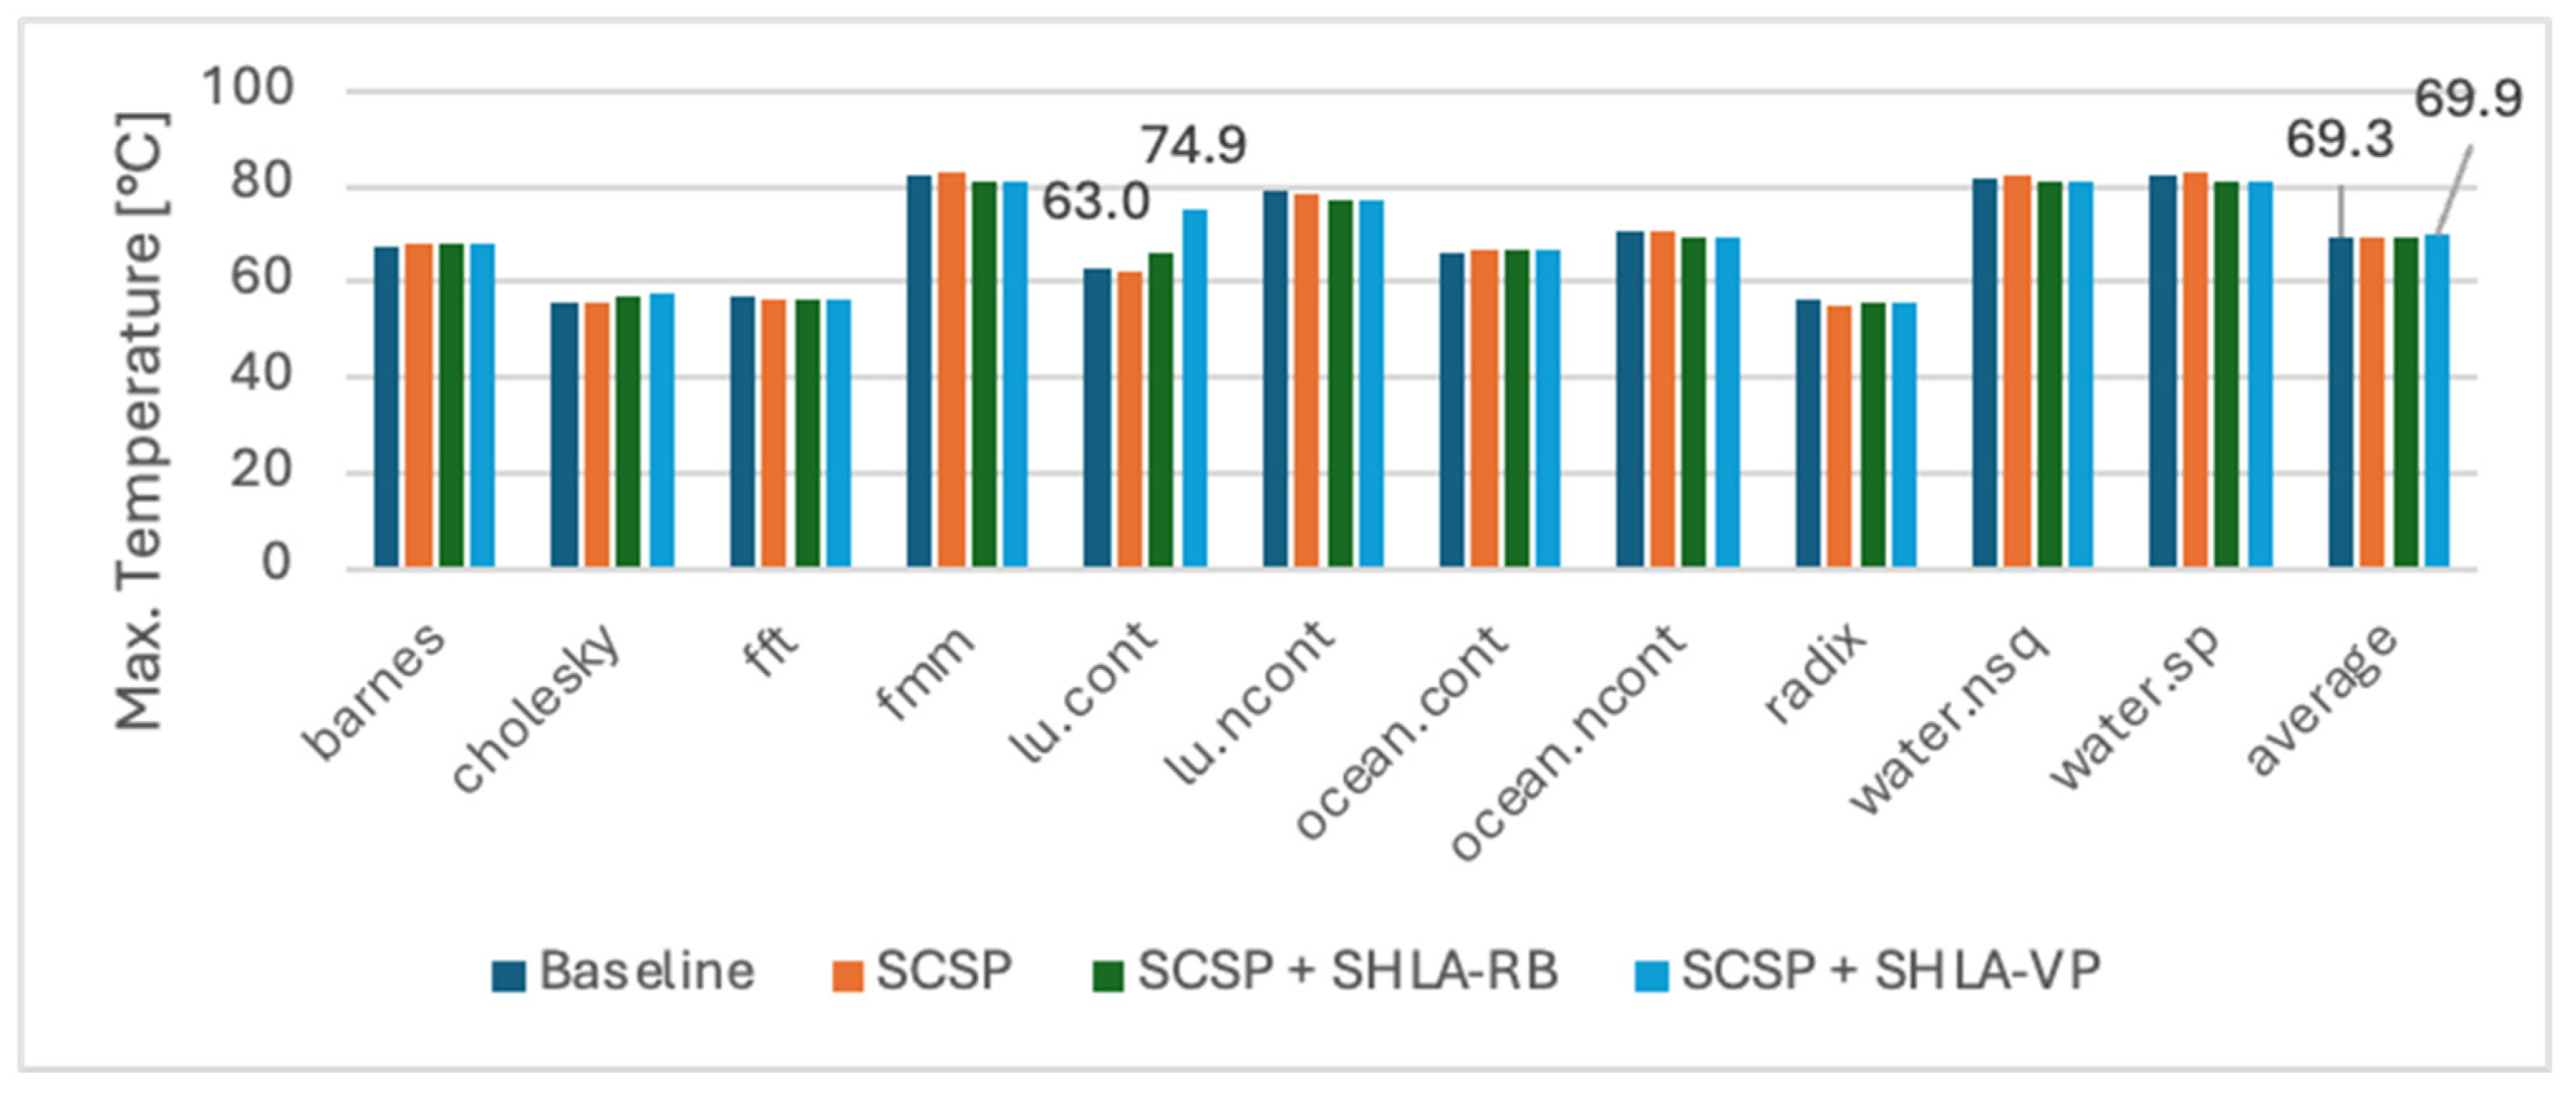
5.2. An Analysis of an Enhanced Architecture with the SCSP

In this section, the simulation results regarding the use of the enhanced architecture, which contained the proposed SCSP, are presented. The analysis was carried out by running the Splash-4 suite on a 16-core system. More than that, the SCSP was applied in tandem with the DIR anticipative technique and with the VP speculative one. The goal of combining these methods was to further reduce energy consumption, keep the maximum chip temperatures stable, and increase performance. The total simulation time for this set of results was 136 h, ~6 days. The configuration of the VP and DIR is shown in Table 2 and Table 3 respectively.
Table 2. Configuration of the VP unit.
Table 3. Configuration of the DIR unit.
The first metric of interest is the SCSP prediction accuracy, which is plotted in Figure 12, calculated as the number of correct predictions divided by the total number of predictions. On average, an accuracy of 98.8% was achieved. The SCSP unit was configured to behave as a last state predictor (keeping only one state in history), with the confidence threshold being set to 0. As can be observed, in this context, the core state can be easily predicted using a minimalistic configuration.
Figure 12. SCSP predictor accuracy for each benchmark (16 cores).
The impact of the considered microarchitectural techniques on the processor idle time is visible in Figure 13. On average, compared to the baseline configuration, when applying only the SCSP, the idle time slightly increased from 30.4% to 30.8%. The highest reduction was achieved by combining the SCSP with the VP, reaching a reduction of 2.7%, from 30.4% to 27.7%.
Figure 13. Idle time for each benchmark using multiple microarchitectural configurations (16 cores).
The processor performance for each benchmark is shown in Figure 14. On average, the configuration that contained the SCSP and VP performed the best, ranging from 16.4 IPC to 17.9 IPC. The highest contributor was the “lu.cont” benchmark, on which an impressive performance increase from 9.3 IPC to 25.46 IPC was measured. It can be seen that, using the VP speculative technique, a higher IPC was achieved compared with the non-speculative RB technique. The main reason for this difference between the two techniques is due to the intrinsic differences between them, meaning that the DIR technique requires the values of the operands to be fetched for checking if the result can be reused (non-speculative). On the other hand, the VP technique can provide a speculated value much earlier, as it does not need to wait until the value of the operands is available. The time required to fetch the operand values is highly valuable in this scenario, especially when reading any of them causes a miss in the cache hierarchy or is simply read from a slower memory. Unlocking the execution of dependent instructions in a speculative way is a major advantage of the VP compared with the DIR. Using only the SCSP technique, on average, the performance slightly decreased, having a difference of 0.1 IPC. The benchmark “barnes” was the biggest contributor to this decrease, which can be easily correlated with the fact that it had the lowest prediction accuracy of 88.4%, negatively affecting the overall performance.
Figure 14. Processor performance for each benchmark using multiple microarchitectural configurations (16 cores).
Regarding the dynamic power consumption, it can be seen in Figure 15 that, on average, all the applied techniques reduced it with respect to the baseline architecture. The highest reduction of 12.3 W was achieved by applying the SCSP technique individually. The configurations combining DIR and VP slightly increased the dynamic power consumption, a fact that is strongly related to the increase in processor performance. Even with the best-performing configuration with the SCSP and VP, a reduction of 3.9 W was still achieved. It can be concluded that all the applied techniques reduce the overall power consumption.
Figure 15. Dynamic power consumption for each benchmark using multiple microarchitectural configurations (16 cores).
The next metric of interest is the energy consumption of the processor in relation to the microarchitectural configurations, as plotted in Figure 16. On all configurations, a modest reduction of ~1 J was recorded. This is an impressive achievement considering the increase in processor performance when DIR and VP were applied in tandem with the SCSP.
Figure 16. Energy consumption for each benchmark using multiple microarchitectural configurations (16 cores).
The maximum chip temperatures that were recorded for all the simulated benchmarks are summarized in Figure 17. On the “lu.cont” benchmark, the highest increase of 11.9 °C was measured when the SCSP and VP techniques were applied simultaneously. In this case, the increase is correlated with the high power consumption and performance increase recorded on this benchmark. It generates more power over a shorter period of time, making the chip generate more heat faster. On average, it can be concluded that no significant temperature change is visible regarding the applied configuration. Also, all temperatures are well below the common critical threshold.
Figure 17. Maximum chip temperature for each benchmark using multiple microarchitectural configurations (16 cores).
Another important metric is the integration area of the chip. The proposed techniques also have an impact on the overall chip area. In Figure 18, the chip area for each microarchitectural configuration is plotted. It can be seen that the SCSP did not cause an increase in the integration area because it was implemented at the application level, requiring no hardware change. Another observation is that the configurations that include DIR have a bigger footprint per core (2.98 mm2) than the ones that include VP (0.42 mm2). This is normal because DIR needs to keep, for each dynamic instruction, the results of the operation and all the operand values inside the buffer. On the other hand, the VP has a much smaller footprint because it requires the keeping of only the results of the instruction.
Figure 18. Chip area for each microarchitectural configuration (16 cores).
Figure 19 provides a good overview of the impact of all the simulated configurations on the metrics of interest. Here, the tradeoffs between each technique can be seen. For example, the highest power (−9.95%) and energy (−10.54%) reductions were achieved using only the SCSP technique, which did not affect the integration area or maximum temperatures but resulted in a minor increase in idle time (1.18%) and a neglectable reduction in performance (−0.77%). On the other hand, using the combined approach consisting of the SCSP and VP offers the highest performance increase (8.87%) and idle time reduction (8.76%) while reducing power (−3.13%) and energy consumption (−8.48%) at the cost of a small increase in temperature (0.83%) and chip area (0.85%). The configuration with the SCSP and DIR is a quasi-optimal solution that lies in between those two.
Figure 19. Relative difference for each microarchitectural configuration in relation to each metric (16 cores).

6. Conclusions and Future Work

In this work, the importance of multi-objective analysis during the development of multicore processors was shown. Through analyzing Splash-2 vs. Splash-4 benchmarks, the impact of modern programming techniques on idle time, processing performance, power consumption, energy consumption, and thermal behavior was shown. It was identified that on the 64-core configuration, the chip temperatures exceed the critical threshold of 105 °C on half of the simulated benchmarks, emphasizing the need for multi-perspective evaluation in today’s processors. Based on the achieved results, it was noticed that the processing cores spend a lot of time in the idle state, waiting for work or synchronization barriers. This was exploited by implementing an SCSP that dynamically adapts the frequency and voltage at the core level by predicting the core state. Using this technique, an average power consumption reduction of 9.95% and an energy saving of −10.54% were achieved without affecting the performance significantly. More than that, the selective DIR and VP techniques were used in parallel with the SCSP to further improve the proposed architecture. Using the SCSP in combination with the VP, a performance improvement of 8.87%, an 8.76% reduction in idle time, a 3.13% decrease in power consumption, and an 8.48% reduction in energy consumption were achieved at a small footprint increase in chip area while maintaining stable temperature. For energy-efficient architectural requirements, the SCSP can be easily implemented at the application level. However, it is also possible to implement it at the hardware level, considering its intrinsic simplicity and minimal memory footprint requirements due to the binary codification of the core state. It has a wide range of applications, from embedded devices and general purpose systems to high-performance computing systems.
Our plans for future work are focused on automatic multi-objective design space exploration. We plan to develop new state-of-the-art tools and methodologies by enhancing the Framework for Automatic Design Space Exploration (FADSE) [] with the newer algorithms [,,] and novel concepts within the Pareto–Fuzzy paradigm, applying the superposition concept []. The target will be to find the quasi-optimal microarchitectural configurations that simultaneously optimize the following parameters: processing performance, integration area, energy consumption, die temperature, and security. A challenge is given by the fact that the mentioned parameters are contradictory, e.g., having more features implies a bigger chip area, and a higher performance comes at the cost of energy consumption and hotspots. More than that, it is also planned to accelerate the automatic search by using Genetic Programming (GP) and Response Surface Models (RSMs). Yet another further work direction consists of extending the application of the SCSP from the actual last state predictor exploited in this study to multiple-state predictors (using more than one previous core state to estimate the next core state).

Author Contributions

Conceptualization, A.G., A.F. and R.B.; methodology, A.G., A.F. and C.B.; software, C.B.; validation, A.G., A.F. and C.B.; formal analysis, C.B.; investigation, C.B.; resources, A.G., A.F. and C.B.; data curation, C.B.; writing—original draft preparation, C.B.; writing—review and editing, C.B., A.G., A.F. and R.B.; visualization, C.B.; supervision, A.G., A.F. and R.B.; project administration, A.G. and A.F.; funding acquisition, A.F. and R.B. All authors have read and agreed to the published version of the manuscript.

Funding

This work was partially developed in the project EoFSSS (Engineers of the Future—Smart, Skilled, Secure), grant number 2022-1-PL01-KA220-VET-000086326, financed by the Erasmus+ and European Solidarity Corps Programme, KA2 PARTNERSHIP IN VET.

Data Availability Statement

The original contributions presented in the study are included in the article. Further inquiries can be directed to the corresponding authors.

Conflicts of Interest

The authors declare no conflicts of interest.

References

  1. Gomez-Hernandez, E.J.; Cebrian, J.M.; Kaxiras, S.; Ros, A. Splash-4: A Modern Benchmark Suite with Lock-Free Constructs. In Proceedings of the 2022 IEEE International Symposium on Workload Characterization (IISWC), Austin, TX, USA, 6–8 November 2022; pp. 51–64. [Google Scholar] [CrossRef]
  2. Sankaranarayanan, K.; Velusamy, S.; Stan, M.; Skadron, K. A Case for Thermal-Aware Floorplanning at the Microarchitectural Level. J. Instr.-Level Parallelism 2005, 7, 8–16. [Google Scholar]
  3. Kim, Y.G.; Kim, M.; Kong, J.; Chung, S.W. An Adaptive Thermal Management Framework for Heterogeneous Multi-Core Processors. IEEE Trans. Comput. 2020, 69, 894–906. [Google Scholar] [CrossRef]
  4. Kong, J.; Chung, S.W.; Skadron, K. Recent Thermal Management Techniques for Microprocessors. ACM Comput. Surv. 2012, 44, 1–42. [Google Scholar] [CrossRef]
  5. Woo, S.C.; Ohara, M.; Torrie, E.; Singh, J.P.; Gupta, A. The SPLASH-2 Programs: Characterization and Methodological Considerations. In Proceedings of the 22nd Annual International Symposium on Computer Architecture, Santa Margherita Ligure, Italy, 22–24 June 1995; pp. 24–36. [Google Scholar] [CrossRef]
  6. Sakalis, C.; Leonardsson, C.; Kaxiras, S.; Ros, A. Splash-3: A Properly Synchronized Benchmark Suite for Contemporary Research. In Proceedings of the 2016 IEEE International Symposium on Performance Analysis of Systems and Software (ISPASS), Uppsala, Sweden, 17–19 April 2016; pp. 101–111. [Google Scholar] [CrossRef]
  7. Henning, J.L. SPEC CPU2006 Benchmark Descriptions. SIGARCH Comput. Archit. News 2006, 34, 1–17. [Google Scholar] [CrossRef]
  8. Bucek, J.; Lange, K.-D.; Kistowski, J.V. SPEC CPU2017: Next-Generation Compute Benchmark. In Proceedings of the Companion of the 2018 ACM/SPEC International Conference on Performance Engineering—ICPE ’18, Berlin, Germany, 9–13 April 2018; pp. 41–42. [Google Scholar] [CrossRef]
  9. Bienia, C. Benchmarking Modern Multiprocessors; Princeton University: Princeton, NJ, USA, 2011. [Google Scholar]
  10. Miller, J.E.; Kasture, H.; Kurian, G.; Gruenwald, C.; Beckmann, N.; Celio, C.; Eastep, J.; Agarwal, A. Graphite: A Distributed Parallel Simulator for Multicores. In Proceedings of the HPCA-16 2010 The Sixteenth International Symposium on High-Performance Computer Architecture, Bangalore, India, 9–14 January 2010; pp. 1–12. [Google Scholar] [CrossRef]
  11. Carlson, T.E.; Heirman, W.; Eeckhout, L. Sniper: Exploring the Level of Abstraction for Scalable and Accurate Parallel Multi-Core Simulation. In Proceedings of the 2011 International Conference for High Performance Computing, Networking, Storage and Analysis, Seattle, WA, USA, 12 November 2011; pp. 1–12. [Google Scholar] [CrossRef]
  12. Genbrugge, D.; Eyerman, S.; Eeckhout, L. Interval Simulation: Raising the Level of Abstraction in Architectural Simulation. In Proceedings of the HPCA-16 2010 The Sixteenth International Symposium on High-Performance Computer Architecture, Bangalore, India, 9–14 January 2010; pp. 1–12. [Google Scholar] [CrossRef]
  13. Li, S.; Ahn, J.H.; Strong, R.D.; Brockman, J.B.; Tullsen, D.M.; Jouppi, N.P. McPAT: An Integrated Power, Area, and Timing Modeling Framework for Multicore and Manycore Architectures. In Proceedings of the 42nd Annual IEEE/ACM International Symposium on Microarchitecture-Micro-42, New York, NY, USA, 12–16 December 2009; p. 469. [Google Scholar] [CrossRef]
  14. Florea, A.; Buduleci, C.; Chis, R.; Gellert, A.; Vintan, L. Enhancing the Sniper Simulator with Thermal Measurement. In Proceedings of the 2014 18th International Conference on System Theory, Control and Computing (ICSTCC), Sinaia, Romania, 17–19 October 2014; pp. 31–36. [Google Scholar] [CrossRef]
  15. Huang, W.; Ghosh, S.; Velusamy, S.; Sankaranarayanan, K.; Skadron, K.; Stan, M.R. HotSpot: A Compact Thermal Modeling Methodology for Early-Stage VLSI Design. IEEE Trans. VLSI Syst. 2006, 14, 501–513. [Google Scholar] [CrossRef]
  16. Binkert, N.; Beckmann, B.; Black, G.; Reinhardt, S.K.; Saidi, A.; Basu, A.; Hestness, J.; Hower, D.R.; Krishna, T.; Sardashti, S.; et al. The Gem5 Simulator. SIGARCH Comput. Archit. News 2011, 39, 1–7. [Google Scholar] [CrossRef]
  17. Sodani, A.; Sohi, G.S. Dynamic Instruction Reuse. In Proceedings of the 24th Annual International Symposium on Computer Architecture, Denver, CO, USA, 1–4 June 1997; pp. 194–205. [Google Scholar] [CrossRef]
  18. Buduleci, C.; Gellert, A.; Florea, A. Selective High-Latency Arithmetic Instruction Reuse in Multicore Processors. In Proceedings of the 2023 27th International Conference on System Theory, Control and Computing (ICSTCC), Timisoara, Romania, 11 October 2023; pp. 410–415. [Google Scholar] [CrossRef]
  19. Widgen, L.; Sowadsky, E. Operand cache addressed by the instruction address for reducing latency of read instruction. U.S. Patent US5919256A, 06 July 1999. [Google Scholar]
  20. Gabbay, F.; Mendelson, A. System and method for concurrent processing. U.S. Patent US5996060A, 30 November 1999. [Google Scholar]
  21. Lipasti, M.H.; Shen, J.P. Exceeding the Dataflow Limit via Value Prediction. In Proceedings of the 29th Annual IEEE/ACM International Symposium on Microarchitecture. MICRO 29, Paris, France, 2–4 December 1996; pp. 226–237. [Google Scholar] [CrossRef]
  22. Lipasti, M.H.; Wilkerson, C.B.; Shen, J.P. Value Locality and Load Value Prediction. SIGPLAN Not. 1996, 31, 138–147. [Google Scholar] [CrossRef]
  23. Sazeides, Y.; Smith, J.E. The Predictability of Data Values. In Proceedings of the 30th Annual International Symposium on Microarchitecture, Research Triangle Park, NC, USA, 3–3 December 1997; pp. 248–258. [Google Scholar] [CrossRef]
  24. Buduleci, C.; Gellert, A.; Florea, A.; Brad, R. Improving Multicore Architectures by Selective Value Prediction of High-Latency Arithmetic Instructions. Adv. Electr. Comput. Eng. 2024; submitted. [Google Scholar]
  25. Bircher, W.L.; John, L.K. Core-Level Activity Prediction for Multicore Power Management. IEEE J. Emerg. Sel. Top. Circuits Syst. 2011, 1, 218–227. [Google Scholar] [CrossRef][Green Version]
  26. Acun, B.; Chandrasekar, K.; Kale, L.V. Fine-Grained Energy Efficiency Using Per-Core DVFS with an Adaptive Runtime System. In Proceedings of the 2019 Tenth International Green and Sustainable Computing Conference (IGSC), Alexandria, VA, USA, 21–24 October 2019; pp. 1–8. [Google Scholar] [CrossRef]
  27. Halimi, J.-P.; Pradelle, B.; Guermouche, A.; Triquenaux, N.; Laurent, A.; Beyler, J.C.; Jalby, W. Reactive DVFS Control for Multicore Processors. In Proceedings of the 2013 IEEE International Conference on Green Computing and Communications and IEEE Internet of Things and IEEE Cyber, Physical and Social Computing, Beijing, China, 20–23 August 2013; pp. 102–109. [Google Scholar] [CrossRef]
  28. Lu, T.; Pande, P.P.; Shirazi, B. A Dynamic, Compiler Guided DVFS Mechanism to Achieve Energy-Efficiency in Multi-Core Processors. Sustain. Comput. Inform. Syst. 2016, 12, 1–9. [Google Scholar] [CrossRef]
  29. Kim, S.; Eom, H.; Yeom, H.Y.; Min, S.L. Energy-Centric DVFS Controlling Method for Multi-Core Platforms. Computing 2014, 96, 1163–1177. [Google Scholar] [CrossRef]
  30. Curtis-Maury, M.; Shah, A.; Blagojevic, F.; Nikolopoulos, D.S.; De Supinski, B.R.; Schulz, M. Prediction Models for Multi-Dimensional Power-Performance Optimization on Many Cores. In Proceedings of the 17th International Conference on Parallel Architectures and Compilation Techniques, Toronto, ON, Canada, 25 October 2008; pp. 250–259. [Google Scholar] [CrossRef]
  31. Cai, Q.; Gonzalez, J.; Magklis, G.; Chaparro, P.; Gonzalez, A. Thread Shuffling: Combining DVFS and Thread Migration to Reduce Energy Consumptions for Multi-Core Systems. In Proceedings of the IEEE/ACM International Symposium on Low Power Electronics and Design, Fukuoka, Japan, 1–3 August 2011; pp. 379–384. [Google Scholar] [CrossRef]
  32. Gupta, M.; Bhargava, L.; Indu, S. Dynamic Workload-Aware DVFS for Multicore Systems Using Machine Learning. Computing 2021, 103, 1747–1769. [Google Scholar] [CrossRef]
  33. Basireddy, K.R.; Singh, A.K.; Al-Hashimi, B.M.; Merrett, G.V. AdaMD: Adaptive Mapping and DVFS for Energy-Efficient Heterogeneous Multicores. IEEE Trans. Comput.-Aided Des. Integr. Circuits Syst. 2020, 39, 2206–2217. [Google Scholar] [CrossRef]
  34. Hanumaiah, V.; Vrudhula, S. Temperature-Aware DVFS for Hard Real-Time Applications on Multicore Processors. IEEE Trans. Comput. 2012, 61, 1484–1494. [Google Scholar] [CrossRef]
  35. Calborean, H. Multi-Objective Optimization of Advanced Computer Architectures Using Domain-Knowledge. Ph.D. Thesis, “Lucian Blaga” University of Sibiu, Sibiu, Romania, 2011. [Google Scholar]
  36. Mkaouer, W.; Kessentini, M.; Shaout, A.; Koligheu, P.; Bechikh, S.; Deb, K.; Ouni, A. Many-Objective Software Remodularization Using NSGA-III. ACM Trans. Softw. Eng. Methodol. 2015, 24, 1–45. [Google Scholar] [CrossRef]
  37. Fathollahi-Fard, A.M.; Hajiaghaei-Keshteli, M.; Tavakkoli-Moghaddam, R. Red Deer Algorithm (RDA): A New Nature-Inspired Meta-Heuristic. Soft Comput. 2020, 24, 14637–14665. [Google Scholar] [CrossRef]
  38. Mirjalili, S.; Mirjalili, S.M.; Lewis, A. Grey Wolf Optimizer. Adv. Eng. Softw. 2014, 69, 46–61. [Google Scholar] [CrossRef]
  39. Florea, A.; Cofaru, I.; Patrausanu, A.; Cofaru, N.; Fiore, U. Superposition of Populations in Multi-Objective Evolutionary Optimization of Car Suspensions. Eng. Appl. Artif. Intell. 2023, 126, 107026. [Google Scholar] [CrossRef]
Disclaimer/Publisher’s Note: The statements, opinions and data contained in all publications are solely those of the individual author(s) and contributor(s) and not of MDPI and/or the editor(s). MDPI and/or the editor(s) disclaim responsibility for any injury to people or property resulting from any ideas, methods, instructions or products referred to in the content.

Article Metrics

Citations

Article Access Statistics

Multiple requests from the same IP address are counted as one view.