1. Introduction and Motivation
In the past, the primary interest of computer architects and software developers was in increasing performance. However, in the last couple of decades, power and energy efficiency have emerged as major requirements in computing. One of the reasons that led to power and energy efficiency interest in computing is the need to reduce the power consumption of HPC to achieve exascale supercomputers [
1]. This goal motivated researchers to investigate some fundamental software building blocks, such as sorting, matrix multiplication, and shortest path algorithms, commonly used in HPC applications to find the factors that affect power consumption. Fundamental hardware components, such as arithmetic units, caches, and dynamic branch predictors (DBPs), should raise similar concerns.
There are several reasons to be interested in the energy behavior of DBP in particular. Firstly, it is an essential component in all modern CPUs used in HPC. Secondly, conditional jump instructions represent a significant percentage of most typical application instructions. Modern CPUs use DBP to guess the direction and the target address of jump instructions which means a heavy utilization of DBP during any application run. Consequently, any power savings related to this component may yield substantial benefits in the total energy consumption. Thirdly, according to some statistics, DBPs account for 10 to 40 percent of CPU dynamic power consumption [
2]. Fourthly, the recent DBP security issues appeared, and the solutions proposed to mitigate them need investigation from a power and energy perspective [
3,
4,
5]. Lastly, the lack of research papers studying DBP and its security issues from a power and energy perspective provided an extra justification for this investigation.
As many research papers pointed out, software style impacted program performance and power and energy consumption of computing devices in significant ways [
6]. The impact demanded that developers find easy ways to measure power consumption. Intel’s RAPL (Running Average Power Limit Energy Reporting), introduced in modern processors, is one of the most prominent software tools that can report the power in different CPU domains [
7]. However, using RAPL for credibly measuring power consumption needs some precautions to avoid noise in measurement [
8].
This report presents the researchers’ experiences in empirically assessing the power consumption on the Intel Haswell platform and the precautions recommended to raise the credibility of measurements obtained from the RAPL tool. The main contribution of the research described here is the development of a methodology suitable for an empirical study of the power characteristics of DBP, a hardware building block. Previous work focused on the empirical study of software building blocks or studying DBP using simulation or mathematical models [
9]. Power and energy consumption are directly related to the hardware. The DBP is a complex piece of hardware that can be difficult to simulate in detail or model adequately to get reasonable consumption assessments. Haswell incorporated separate sensors within the processor to measure power consumption at different levels, such as the package, individual cores, and DRAM providing real-time feedback on power usage and allowing for reliable higher-resolution readings of power consumption [
8] without needing additional external devices like power meters or infrared imaging of relevant regions in the silicon. Therefore, RAPL on Haswell CPUs offered improved granularity in power measurement compared to previous generations. Empirical power estimation, using fine-grained instrumentation, such as in Haswell-class and later CPUs, should provide realistic insights into the power consumption of such complex units as DBP without getting into the complexity of mathematical modeling or detailed simulation that requires a deep understanding of the internal workings and interactions with other components. RAPL provides an attractive alternative.
The paper’s organization is as follows.
Section 2 is a literature review of pertinent previous work.
Section 3 provides the background of the DBP and RAPL.
Section 4 explores various factors that affect RAPL readings and act as sources of noise.
Section 5 examines the different ways to acquire credible results from RAPL tools available in Linux.
Section 6 presents the results of extensive experimentation to develop a methodology for relevant empirical investigations.
Section 7 highlights the main findings, precautions, and experiences.
Section 8 offers concluding remarks and suggestions for future work.
2. Literature Review
Researchers have recognized the impact of software on computing power and energy consumption since the 1990s. Mehtal et al. [
10] proposed software techniques to reduce the energy consumption of a processor using compiler optimization, such as loop unrolling and recursion elimination. They also studied how various algorithms and data structures affect power and energy usage.
Capra and Francalanci [
11] considered the design factors that influence the energy consumption of applications that perform the same functionality but have different designs. They experimentally assessed the energy efficiency of management information systems. In their study, they found that the application design has a significant impact on energy consumption.
Sushko et al. [
12] studied the effect of loop optimization on the power consumption of portable computing devices. They applied their study to ARMv8 architectures. Their study showed the power efficiency gained by fitting data in the cache and using parallelization for loop optimization.
Al-Hashimi et al. [
13] studied the effects of three iteration statements on the system power consumption: For loop, While loop, and Do-While. For each case, they measured the average time, power, and temperature; the value of the maximum temperature; and the number and percentage of times reached. They found that the For loop was the most power-efficient and that the While loop had the worst power efficiency.
Abulnaja et al. [
14] analyzed bitonic mergesort compared to an advanced quicksort on the NVIDIA K40 GPU for power and energy efficiency. They introduced the factors that affected power consumption and studied those that led to higher energy and power consumption, such as data movement and access rate. They concluded that bitonic mergesort is inherently more suitable for the parallel architecture of the GPU. This study triggered the investigation of more software building blocks, such as spanning tree algorithms and binary search algorithms.
Aljabri et al. [
15] conducted a comprehensive empirical investigation into the power efficiency of mergesort compared to a high-performance quicksort on the Intel Xeon CPU E5-2680 (Haswell), which is more commonly used in HPC and has more accurate sensor readings than the previous-generation Intel Xeon E5-2640 CPU (Sandy Bridge) utilized in an earlier work [
16]. The research was motivated by the fact that divisions by powers of two, the most frequent operation in mergesort, may be performed by a power-efficient barrel shifter. Mergesort’s procedure applies a divide-and-conquer strategy in which the original list (or array) is divided, recursively, into two equal lists. The study concluded that mergesort had an advantage over quicksort in terms of power efficiency, with comparable time efficiency between the two algorithms. This study encouraged more investigation into other algorithms that perform similar tasks but have different time efficiencies from a power perspective.
NZ Oo et al. [
17] studied Strassen’s matrix multiplication algorithm from a performance vs. power perspective. In their study, they found a way to enhance performance and reduce energy consumption by using loop unrolling on the recursive level of the algorithm to minimize cache misses and increase the data locality. They claimed that their method increased performance by 93 percent and reduced energy consumption by 95 percent.
Jammal et al. [
18] studied the power efficiency of three matrix multiplication algorithms, i.e., definition-based, Strassen’s divide-and-conquer, and improved divide-and-conquer, on the Intel Xeon CPU E5-2680. The main finding of this work is that the fastest divide-and-conquer algorithm is power-efficient only for small matrix sizes. For larger sizes, the definition-based algorithm turned out to be more power-efficient. They also studied the effect of every cache level miss on power consumption.
Some of the previous works hypothesized that some algorithms are superior to others that are equivalent in performing tasks in terms of power efficiency, but others have an advantage in terms of time efficiency. Those studies involved factors that play significant roles in power saving to open the door for further investigation that could lead to a balance between power and time efficiency.
In this work, the researchers were motivated by previous work to investigate fundamental hardware building blocks inside the CPU, rather than software building blocks, from a power and energy perspective. A recent study by Lastovetsky et al. [
19] introduced methods usable as building blocks to scale HPC computing systems to achieve energy and performance optimization on the application level. They required the energy profiling of computational components. They introduced some precautions to reduce the noise in the measurements. While their study considered the whole system, this study was concerned with individual CPU components, specifically the dynamic branch predictor.
Table 1 is a summary that captures the essence of the literature review and highlights the contribution of our study.
3. Background
This section introduces the background of dynamic branch prediction and the RAPL interface.
3.1. Dynamic Branch Predictor
One of the most efficient features used inside modern CPUs to attain high performance by increasing Instruction-Level Parallelism (ILP) is speculative execution. This feature overcomes stalling in some of the CPU’s processing stages caused by structure, control, or data hazards. Branch instructions are a major source of such dependencies. For instance, in conditional branch instructions, the CPU needs to decode and execute a branch instruction before it decides whether to take the branch by jumping to the branch instruction target address or continuing to the next instruction in the program sequence [
20], which causes a control hazard. According to most program statistics, branch instructions represent 10 to 20 percent of all program instructions in most workloads. This percentage warrants careful treatment by a CPU. Otherwise, it would dramatically degrade the performance. Modern CPUs use speculative execution to predict the outcome of branch instructions before decoding them.
In general, branch prediction techniques fall into the static or dynamic category. Static branch prediction mechanisms append a bit to every branch instruction operation code (OPCODE) during program compilation, which indicates whether the branch is taken or not taken by assigning a zero or one to indicate taken or not taken, respectively. The criterion that the static decision depends on is the nature of the branch instruction. For instance, unconditional branch and backward conditional instructions are always guessed as “taken”, while forward conditional instructions are guessed as “not taken” [
1].
In contrast, in dynamic branch prediction (DBP) techniques, the predictor collects information about a branch instruction while running a program. This information is a sort of history that describes the behavior of the branch instruction during its last number of executions (taken or not taken and its target address). This information is used the next time the branch instruction is executed to guess its direction (taken or not taken). Dynamic prediction is much more accurate than static prediction [
21].
The DBP is a principal component of speculative execution resources [
22]. It is a digital circuit called the Dynamic Branch Unit (DPU), used in pipelined CPUs to guess the direction and the target address of the branch instructions to improve the flow in the pipeline. The DBP has a significant positive impact on CPU performance. The DBP is accessed almost every cycle on average: i.e., it consumes more power and dissipates more heat. So, any improvement in its power consumption leads to significant CPU power and energy efficiency [
21,
22].
Various DBP techniques have emerged in the last three decades. Examples are two-level predictions, interference-reducing predictors, neural predictors, and hybrid branch predictors. In the earlier era of DBP design, the primary goal of these techniques was to improve the CPU’s performance, which requires a balance between the accuracy of DBP prediction and the access time to it. However, power and energy awareness became a crucial goal for all modern CPU components, including the DBP. So, modern CPUs require trade-offs in design between cost, performance, and power consumption [
21].
Even though the exact organization of a CPU’s DBP is not usually made public, industrial implementations of DBPs generally consist of five major parts that distinctly influence power consumption [
23].
The Branch Target Buffer (BTB) is a set-associative cache that stores the target addresses of conditional and unconditional branch instructions.
The Indirect Branch Target Buffer (IBTB) is a direct-mapped cache that stores the target addresses of indirect branch instructions.
A loop predictor is a set-associative cache to predict the outcome of conditional branch instructions with loop behavior.
A global predictor is a set-associative cache to predict the outcome of the general conditional branch instructions.
A bimodal predictor is a two-bit saturating counter.
In this research, the authors hypothesized that just as there are factors that affect power consumption in some algorithms, there are factors that affect power consumption in the DBP. The research interest of this work was in investigating these factors and trying to stress different DBP components to identify components that may contribute more to power consumption than others.
3.2. Intel RAPL
RAPL (Running Average Power Limit), a feature of Intel CPUs since the advent of Sandy Bridge architecture, performs two tasks. The first and foremost task is limiting the energy consumption of different components in CPUs to protect them from the thermal effect. The second task is to provide a software tool to measure the power and energy consumed by these different components during the program run in fine granularity [
24,
25].
RAPL is a valuable feature that was first introduced by Intel in the Sandy Bridge architecture in 2011 to help researchers and system designers obtain estimates of the power and energy of different domains inside and outside the CPU, namely, a whole package, core, un-core, and DRAM [
26]. Several free tools can benefit from the RAPL interface. Some of these tools can run under Windows and Mac operating systems, and others run under the Linux operating system.
In modern Intel CPUs, RAPL can limit and measure the power and energy of different levels (or domains) in the CPU. The biggest domain is called the package domain. This is where RAPL can control and measure the power and energy consumed by the whole CPU socket. The second domain, Power Plane 0 (PP0), deals with the total power/energy consumed by all cores in the CPU. The third one, called the DRAM domain, can measure the power and energy consumed by the dynamic RAM. The fourth domain, Power Plane 1 (PP1), can measure the power and energy consumed by the GPU. Another one, called PSys, was introduced in some Intel CPUs to control and monitor the power and thermal impacts of previous domains in addition to eDRAM (the embedded DRAM integrated into the same CPU between cache level 3 and DRAM) and some other features in recent Intel CPUs, such as CPU System Agent, responsible for handling I/O between the components and the CPU. However, not all Intel CPUs support all of the mentioned domains. One needs to review documents to check the power domains that a CPU supports [
26].
Several researchers who investigated CPU power and energy consumption confirmed the effectiveness of the RAPL tool. Giardino et al. used RAPL registers to calculate the average power for SPEC CPU2006 benchmarks through the
perf_events command in Linux [
27]. Khan et al. demonstrated the accuracy of RAPL in power and energy estimation. They also showed some weaknesses and limitations of RAPL [
8]. Desrochers et al. found that power and energy estimation for DRAM using RAPL matches the power and energy estimated by WattsUpPro, a power measurement device, with a constant offset between RAPL and WattsUpPro [
24]. Zhang and Hoffmann evaluated RAPL as a power limit control. They concluded that RAPL achieves good power stability in stable applications running for a long time [
28].
Khan et al. compared the power consumed by the CPU package, as measured by an external power measurement device connected to the wall socket, to the power consumption measured by RAPL. Their results demonstrated a strong correlation between the measurement obtained from the wall socket and that obtained from RAPL. Khan and Nizam introduced a comprehensive study about the accuracy of RAPL measurement. They concluded that RAPL was effective and a suitable alternative to external hardware devices [
7].
This work focuses on RAPL to measure the power and energy consumption of different CPU domains in servers, workstations, desktops, and laptops, as well as how to obtain more accurate and, hence, reliable readings.
Before RAPL, CPUs predicted and estimated power based on a group of performance counters that could model predictive estimations of power and energy. RAPL, on the other hand, is an onboard digital meter (a set of counters) that gives better estimates of the power and energy compared to the old way that depended only on modeling since it also relies on embedded voltage regulators. RAPL exposes readings to the software layer through a group of registers classified as Machine-Specific Registers (MSRs). Reading from or writing to these registers can be performed through two privileged machine instructions: RDMSR and WRMSR. The RAPL MSRs are updated approximately every millisecond in Intel CPUs. So, if any MSR multiple reading operations happen during one millisecond, the read values will be the same and considered old values [
28].
4. Noise Sources in RAPL Power Estimations
The term noise, in the context of this work, is used in a specific way. It refers to any one of the many factors that can affect the accuracy of the intended measurements. It stems chiefly from the experimental environment but can also come from the methods and the tools behind the readings. Understanding the sources of noise can help obtain accurate readings for the intended measurement. This section elaborates on these factors.
4.1. CPU Temperature
The most important environmental factor is the CPU temperature. It is well known that there is a strong correlation between the CPU temperature and RAPL readings [
8]. This makes the surrounding temperature one of the most important causes of noise. The rise in CPU temperature could happen because of the lab temperature, the heavy utilization of the CPU, poor ventilation inside the computer case, or a faulty CPU heat dissipation system [
15].
Therefore, the experiment must be conducted in an appropriately air-conditioned environment to maintain a reasonable and consistent ambient temperature. Otherwise, RAPL readings will be affected by the ambient CPU temperature [
15]. Reducing the effect of CPU-heavy utilization will be discussed in a later sub-section.
4.2. Cross-Core Thermal Exchange Effect
The rise in temperature in a core can significantly influence its neighbor cores. This effect arises from the thermal exchange between adjacent physical cores in the same die. The heat seeps from one core to a neighboring one and may become a source of RAPL reading noise [
15].
4.3. Using Multiple Cores for One Application
Some applications utilize multiple cores by design to leverage their performance in parallel. However, the power estimation of applications that run on many cores leads to inaccurate results when using RAPL hardware counters. With such applications, we can set the affinity to restrict them to running on one core [
15].
4.4. Context Switching between Applications and Operating System
Most applications need services from the operating system, such as file management and input/output device control. These services are not a part of the program whose energy we intend to estimate. So, we need to deal with these services carefully to ensure that measurements of the power consumption are purely due to the application. However, some researchers may consider these services a part of the application and find it necessary to include them in a proper estimate of an overall power consumption [
15].
4.5. Hyper-Threading Technology
Unlike multithreaded applications, where an application can run on different cores, the hyper-threading feature in some modern CPUs allows threads from many programs to run on the same processor core. Hence, one physical core can function as two logical cores. The hyper-threading feature can be enabled or disabled (enabled by default) by the user from the BIOS. For accurate power estimation, hyper-threading should be turned off to ensure that no other applications than the one we intend to measure share the same physical core [
26].
4.6. Operating System Issues
When we use the RAPL interface to measure the power consumed by software, the operating system plays a significant role in the accuracy of results. The effect of the operating system on the readings comes in several manifestations.
Many functions managed by the operating system run in the background and contribute to the inaccuracy of power estimation. These functions should be isolated from the application one way or another [
15].
When an application deals with a lot of data from the secondary storage, the loading operation consumes a large amount of power that is not due to the actual application logic. For accurate results, in this case, the data could be embedded in the application file to be stored in the main memory when the application loads [
15].
Another feature controlled by the operating system is the power management feature in all operating systems today. The technology tries to implement the most efficient power mode for as long as possible. For an accurate comparison of power and energy between two codes, this feature needs to be disabled [
29].
4.7. Compiler Optimization Issues
Compilers come with many optimization options. These options may affect RAPL readings. For instance, loop unwinding increases program speed by reducing the number of loop windings. If we estimate the power for an application compiled with loop unwinding optimization, the measured power will be for a modified code that may not match the original logic [
30].
Compiler power consumption optimization is another feature supported by popular compilers. When we try to estimate the power consumption of a code apart from the architecture or platform, it is more accurate to avoid such optimization to measure the native attributes of the code [
31]. However, when the optimization exploits features specific to the architecture or platform and the code targets that environment, then it is reasonable to apply that optimization. In general, for accurate power measurement, power optimization options should be turned on or off depending on the purpose of measurement, whether it targets the code itself or the platform, or both.
5. Accurate RAPL Power and Energy Estimation in Linux
In this section, the authors introduce RAPL interface tools available in Linux to read MSR registers. They also discuss policies and procedures to obtain more accurate results.
5.1. Linux RAPL Tools
Several tools are available for Linux that can deal with the RAPL interface. The following only lists the most common ones.
The TurboStat tool is a part of the Linux kernel (needs root privilege) that can read RAPL information from MSR registers and gives information about the power consumption. It comes with many options that control the display of the information and the period time of information collection [
32].
PowerTOP is another Linux tool that can estimate the power consumption in a CPU, GPU, or DRAM. It has several options that define the domain of measurement and the way the information is displayed [
33].
The
perf tool is one of the easiest Linux power profilers. By using it, one can collect power from various CPU domains (package, core, GPU, Psys).
Perf can be used as a primary interface to the kernel to report a set of RAPL counters [
34].
5.2. Containerization Technology
Containers were originally Linux features. So, the majority of them are Linux-based. Containerization is a way to isolate the application by creating a run environment around it called a container. All application dependencies, such as libraries, configuration files, and binaries, are encapsulated with the application in a standardized lightweight environment called a container. This operation helps the applications behave consistently when run on different hosts or multiple times on the same host. To assess an application on different hosts, it is better to containerize it to compare the effect of different architectures or platforms on power consumption. This measure is perhaps also useful when comparing the power consumption or performance of algorithms or applications on the same machine. In this research, we tested, experimentally, the effect of containerization on RAPL measurements.
Many engines, such as Docker, CoreOS RKT, and runC, are available to containerize any application [
35]. The popular Docker container was used for experimentation.
5.3. CPU Affinity Setting
In multicore CPUs, the applications running can use, by default, any set of available cores. To restrict an application to specific cores, one should set the processor affinity to the intended cores. For a more accurate power estimate for an application, it should be set to run on one core. The measurement accuracy is due to the fact that restricting the application to one core minimizes context switching and CPU migration, eliminates hyper-threading, and reduces cache misses. Rises in these factors represent major sources of noise in RAPL readings. The
taskset command is used to set the processor affinity in Linux [
36].
5.4. Dedicating One Core to an Application
Setting affinity for a CPU core ensures that the application runs on a single core, but it is not enough to ensure that no other programs share the application on the core. To assign a processor core exclusively to an application, the operating system must reserve the core from the beginning (during boot operation) to prevent the system scheduler from using it for any process. After that, the reserved core can be assigned to the application whose power consumption is under measurement. To reserve a core in Linux, the
isolcpus = 〈CPU_ID〉 kernel parameter is added to the GRUB boot loader configuration file [
37]. For instance, to reserve core number 5 in the CPU, one must add
isolcpus = 5 to the GRUB file and reboot the system to activate the configuration. More than one core can be reserved by separating their numbers by commas [
38].
5.5. Minimizing CPU-Heavy Utilization Effect
To average a large number of RAPL readings, researchers run the application many times to take the average of the results. Although this operation can give more reliable results by minimizing the noise effect, it could become a source of thermal noise because of the heavy utilization of the CPU. To make the most of averaging and avoid the heavy utilization effect, the CPU can take a short rest time between runs. One can automate this operation in Linux by using loop commands in a script file and inserting a Linux sleep command at the end of every run loop to pause the next iteration for a while and give the CPU a chance to cool down [
15].
5.6. CPU Power Management Feature
The power management feature in modern CPUs can affect the RAPL reading results. So, the authors strongly recommend disabling this feature to obtain a more accurate power estimate for the targeted application. This feature can be disabled or enabled from the BIOS [
15].
5.7. Minimizing Script Command Effect
In the case of running the application repeatedly to take the average power, the commands in the script file used to automate this operation are not a part of the application code to be measured. One may ignore the effect of script commands if the application execution time is too long compared to the script code. However, this effect may become significant and a source of inaccurate results for applications with small code footprints. Repeating the application to form a long enough code can mitigate scripting effects [
25].
5.8. DBP Power Estimation Methodology
In contrast to the previously mentioned research papers in the literature, in which the goal was to investigate the fundamental software building blocks, the aim of this research was to examine the dynamic branch predictor (DBP) as a fundamental hardware component.
Since RAPL can directly measure the power consumed by all CPU cores (PP0 domain), a way to estimate the power consumed by the DBP alone is needed. The DBP is accessed almost every cycle [
21], so interest is focused on the dynamic power of the DBP. As a simplification, the authors assume that the DBP’s dynamic power is caused only by the branch instructions, and any other DBP access contributes to the DBP’s static power. As the aim is not the estimation of all power consumed by the DBP (static and dynamic power), we assume that the equation for PP0 domain power can be formulated as follows:
where
Total Cores Power represents the total power measured by RAPL for the PP0 domain,
Dynamic DBP Power is the dynamic power consumed by the DBP, and
Rest Cores Component Power is the static and dynamic power consumption of the rest component in the PP0 domain, including the DBP’s static power.
To do so, a set of microbenchmarks that enable the isolation of the DBP’s dynamic power consumption from the rest of the PP0 domain need to be applied. Furthermore, the microbenchmarks must stress the main components of the DBP to amplify the dynamic power consumed by each one. Then, linear regression modeling can be applied to the collected data to calculate the dynamic power consumed by the DBP and its major component. The appropriate branch-related events should be selected with matching microbenchmarks to build a suitable linear regression equation.
6. Experiments and Results
This section reports on the experiments that examined the points discussed in
Section 4 and
Section 5 on the factors that influence the accuracy of RAPL. In the experiments described in this section, four benchmarks of the PARSEC suite, described in
Table 2, were used to test different aspects of the CPU’s power. The PARSEC benchmark is an open-source suite comprising a collection of parallel and multithreaded benchmark programs designed to simulate real-world computing scenarios. It includes applications such as fluid dynamics solvers, image processing algorithms, and data mining applications [
39]. The suite is widely used to compare and evaluate different shared-memory architectures, programming models, and optimization techniques, including power modeling [
40].
Table 3 describes the machine used for the experiments. The researchers opted for a lightweight version of Ubuntu to help further reduce OS-related environmental noise. Lubuntu uses the LXQt environment, designed to be resource-efficient. It utilizes fewer system resources, such as CPU and RAM, which leads to lower power consumption. It also reduces system energy usage while applications run, making it a good choice for experimentation. The Linux
perf tool collected data and CPU events for the four benchmarks. The numbers are detailed in
Table A1,
Table A2,
Table A3 and
Table A4 in the
Appendix A.
Each workload ran three hundred (300) times. The experimental results revealed that more runs did not contribute to the convergence of the average. The workloads ran with one thread (1T), two threads (2T), and four threads (4T). In each case, the benchmarks were executed inside (IC) and outside (OC) Docker containers. The collected data included execution time (ET), energy (E), task clock (TC), executed instructions (#inst) and branches (#Br), branch misses (BrM), last-level cache store (LLCS) and load (LLCL), last-level cache misses (LLCM), context switches (CS), CPU migrations (CPUM), and page faults (PF). The researchers chose these events because of their direct impact on energy [
40]. The data were also collected (outside containers) in two general cases: when the Power Management Unit was enabled (PMUen) and when the Power Management Unit was disabled (PMUdis).
To measure the effect of compiler optimization on RAPL measurements, two benchmarks, Ferret and FFT, were compiled with the four main GCC compiler optimization level options, namely, O0, O1, O2, and O3, which range from minimal optimization (O0) to aggressive optimization (O3). The experiments also tested the sensitivity of RAPL to the CPU’s ambient temperature by covering the upper side of the computer case with a mask with small holes. The rest of this section discusses, in detail, the results and the different scenarios used to obtain them.
6.1. Discussion of Experimental Results
6.1.1. External Thermal Effect
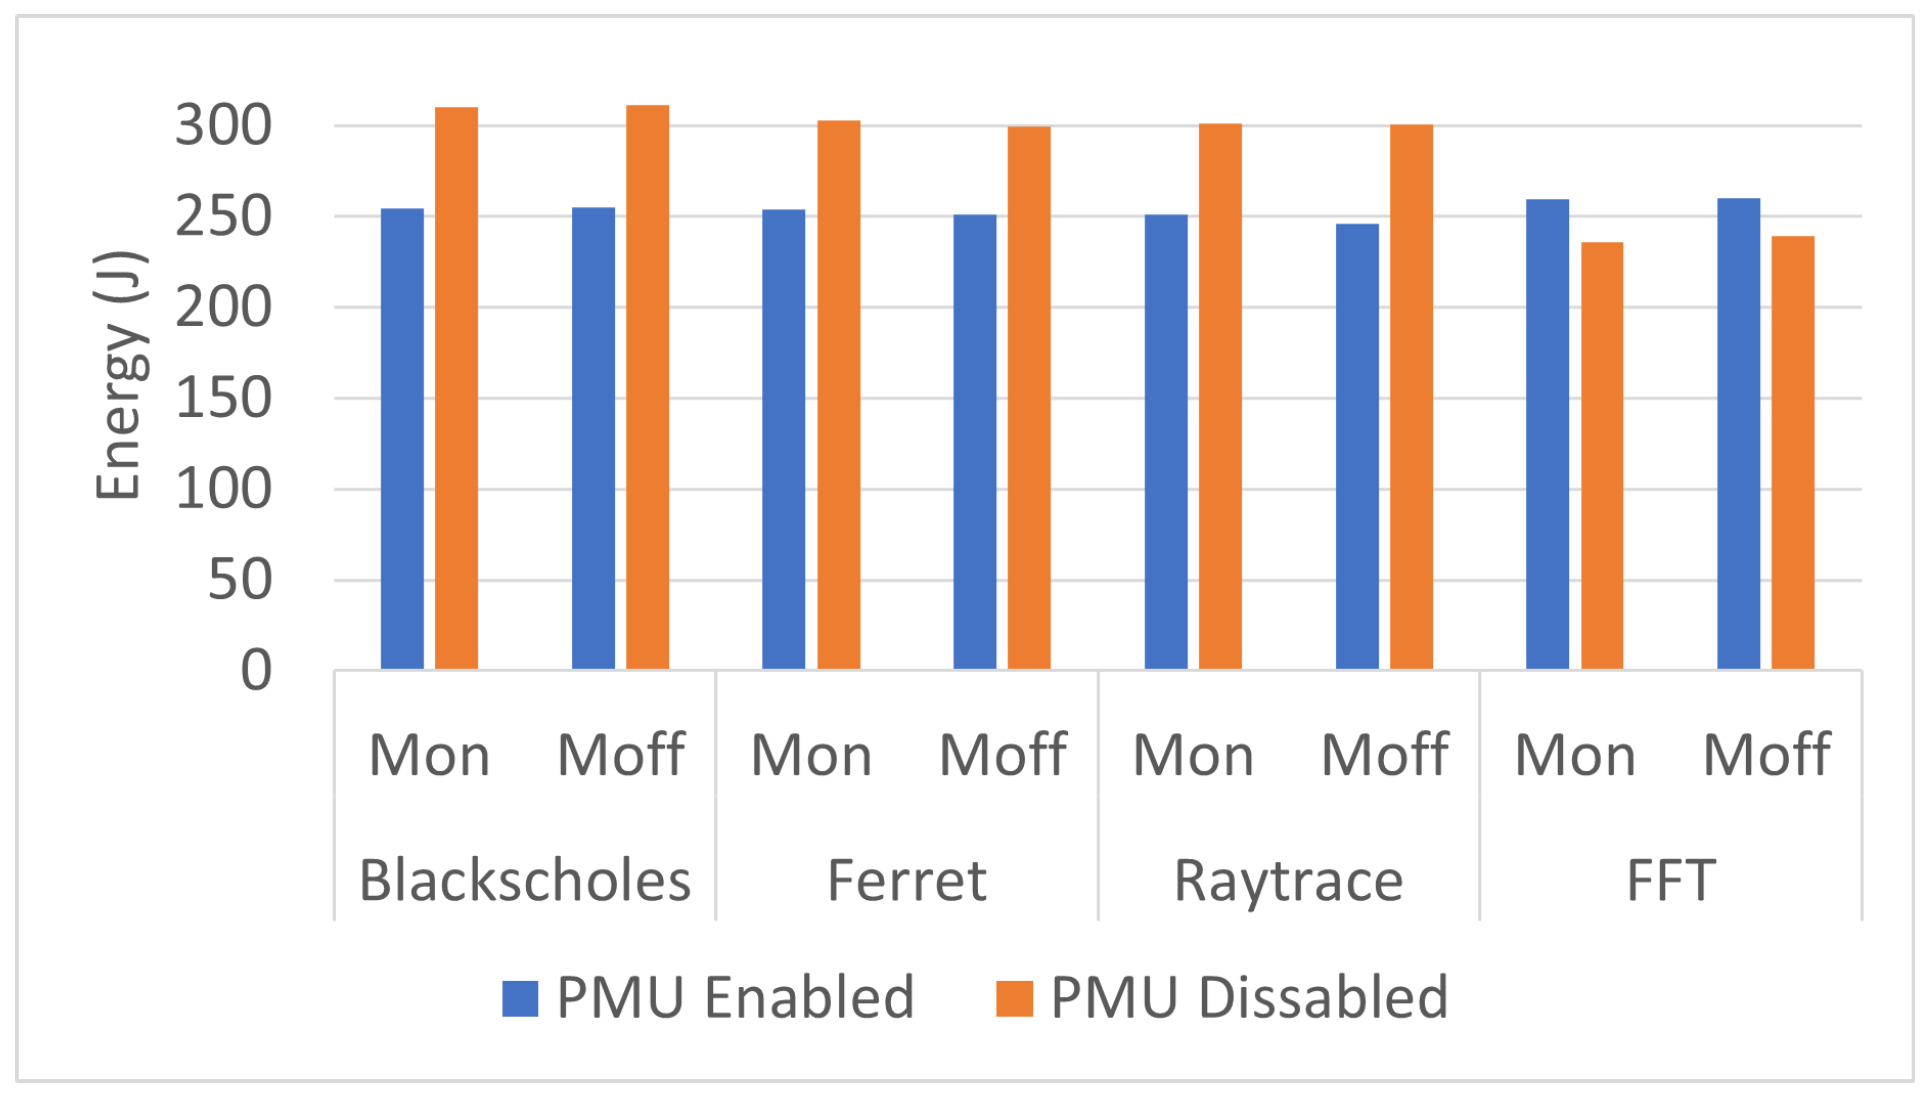
The authors attempted to measure the effect of the CPU’s ambient temperature to assess the sensitivity of RAPL power measurements to external thermals. The test-bed computer case had ventilation holes on the rear and top sides. The execution time and the total energy of the four benchmarks were measured when the rear and top vents were open. They were measured again when the vents were masked. The two case conditions are labeled Mask-on (Mon) and Mask-off (Moff) in
Table A2. Unexpectedly, the measurements were not very sensitive to ambient temperature in either the disabled or enabled state of the PMU (see
Figure 1). However, substantial changes in ambient temperature can have terrible effects on the RAPL readings.
6.1.2. Multithread Effect
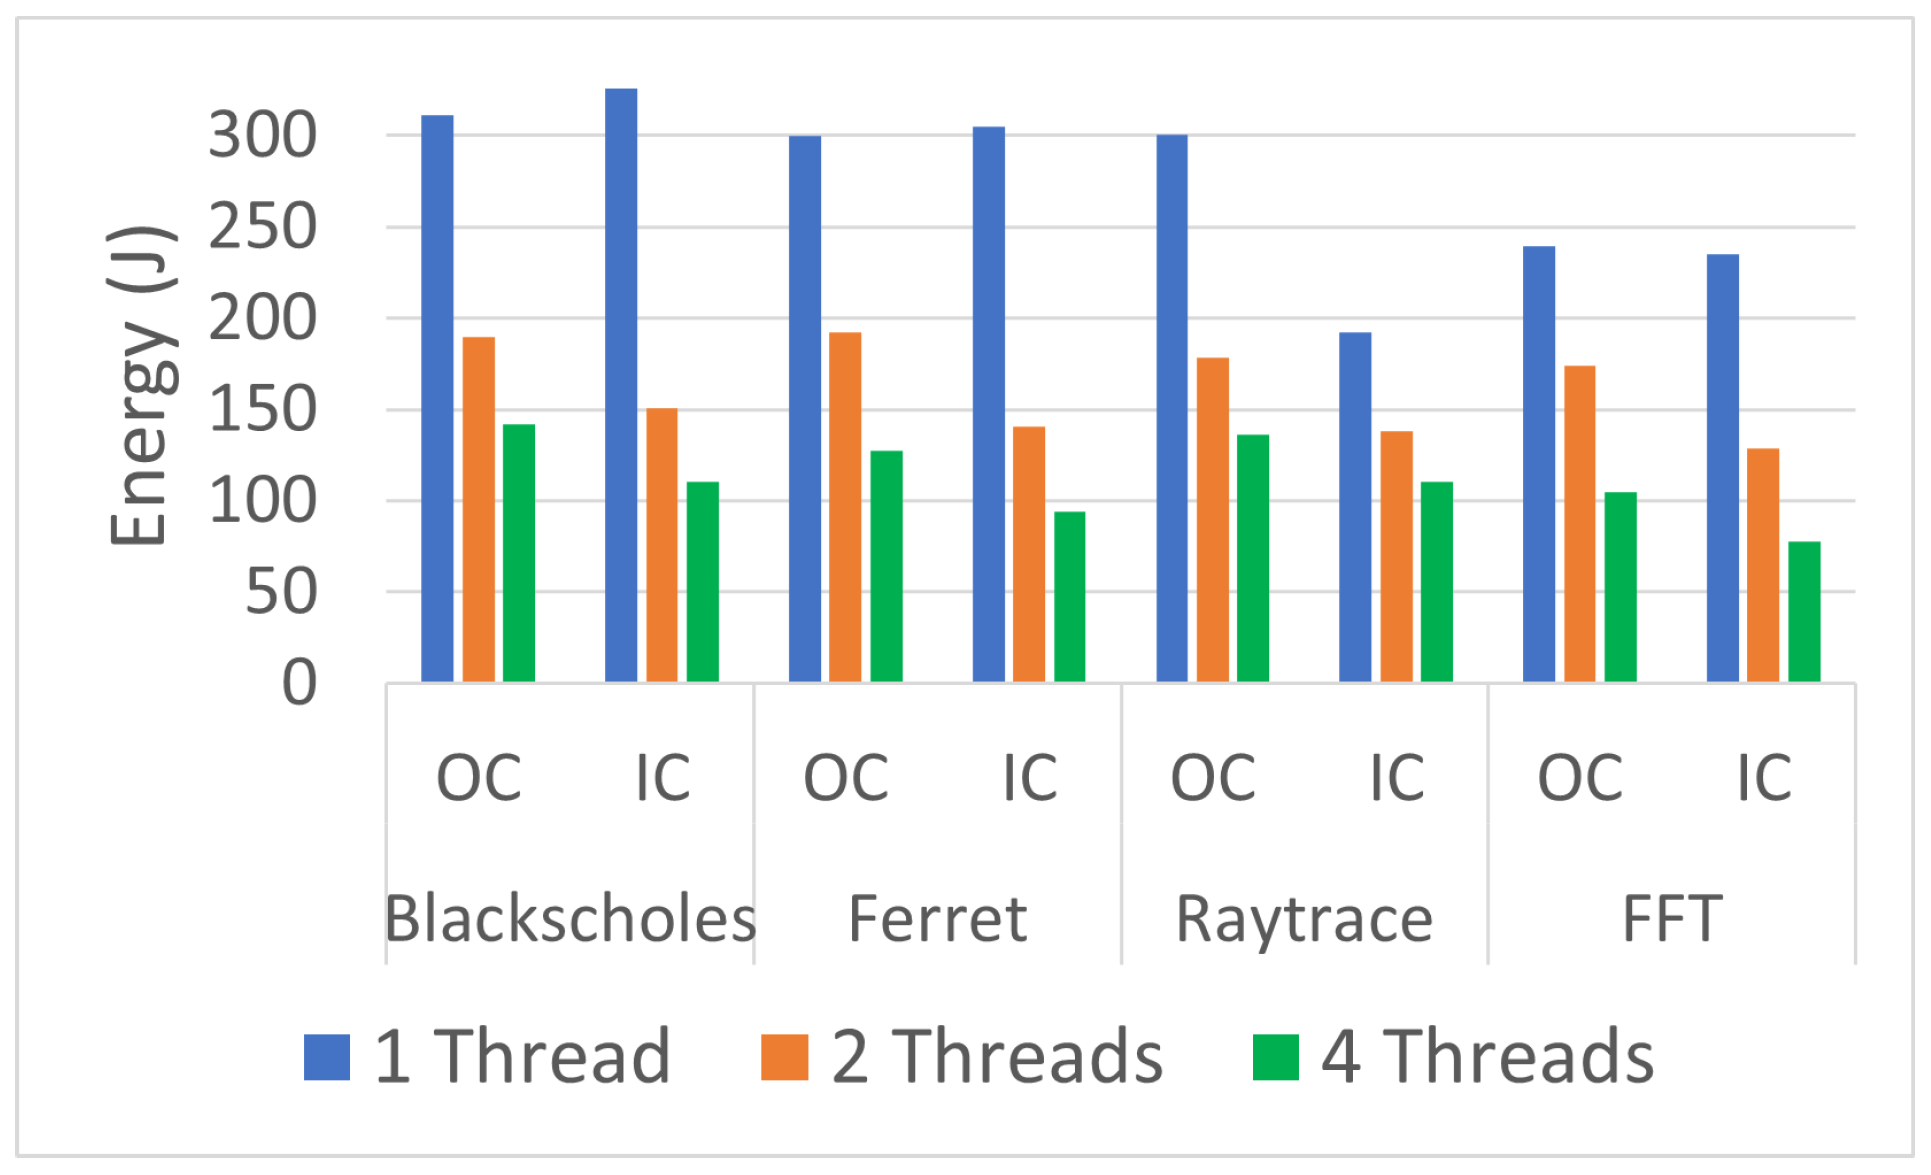
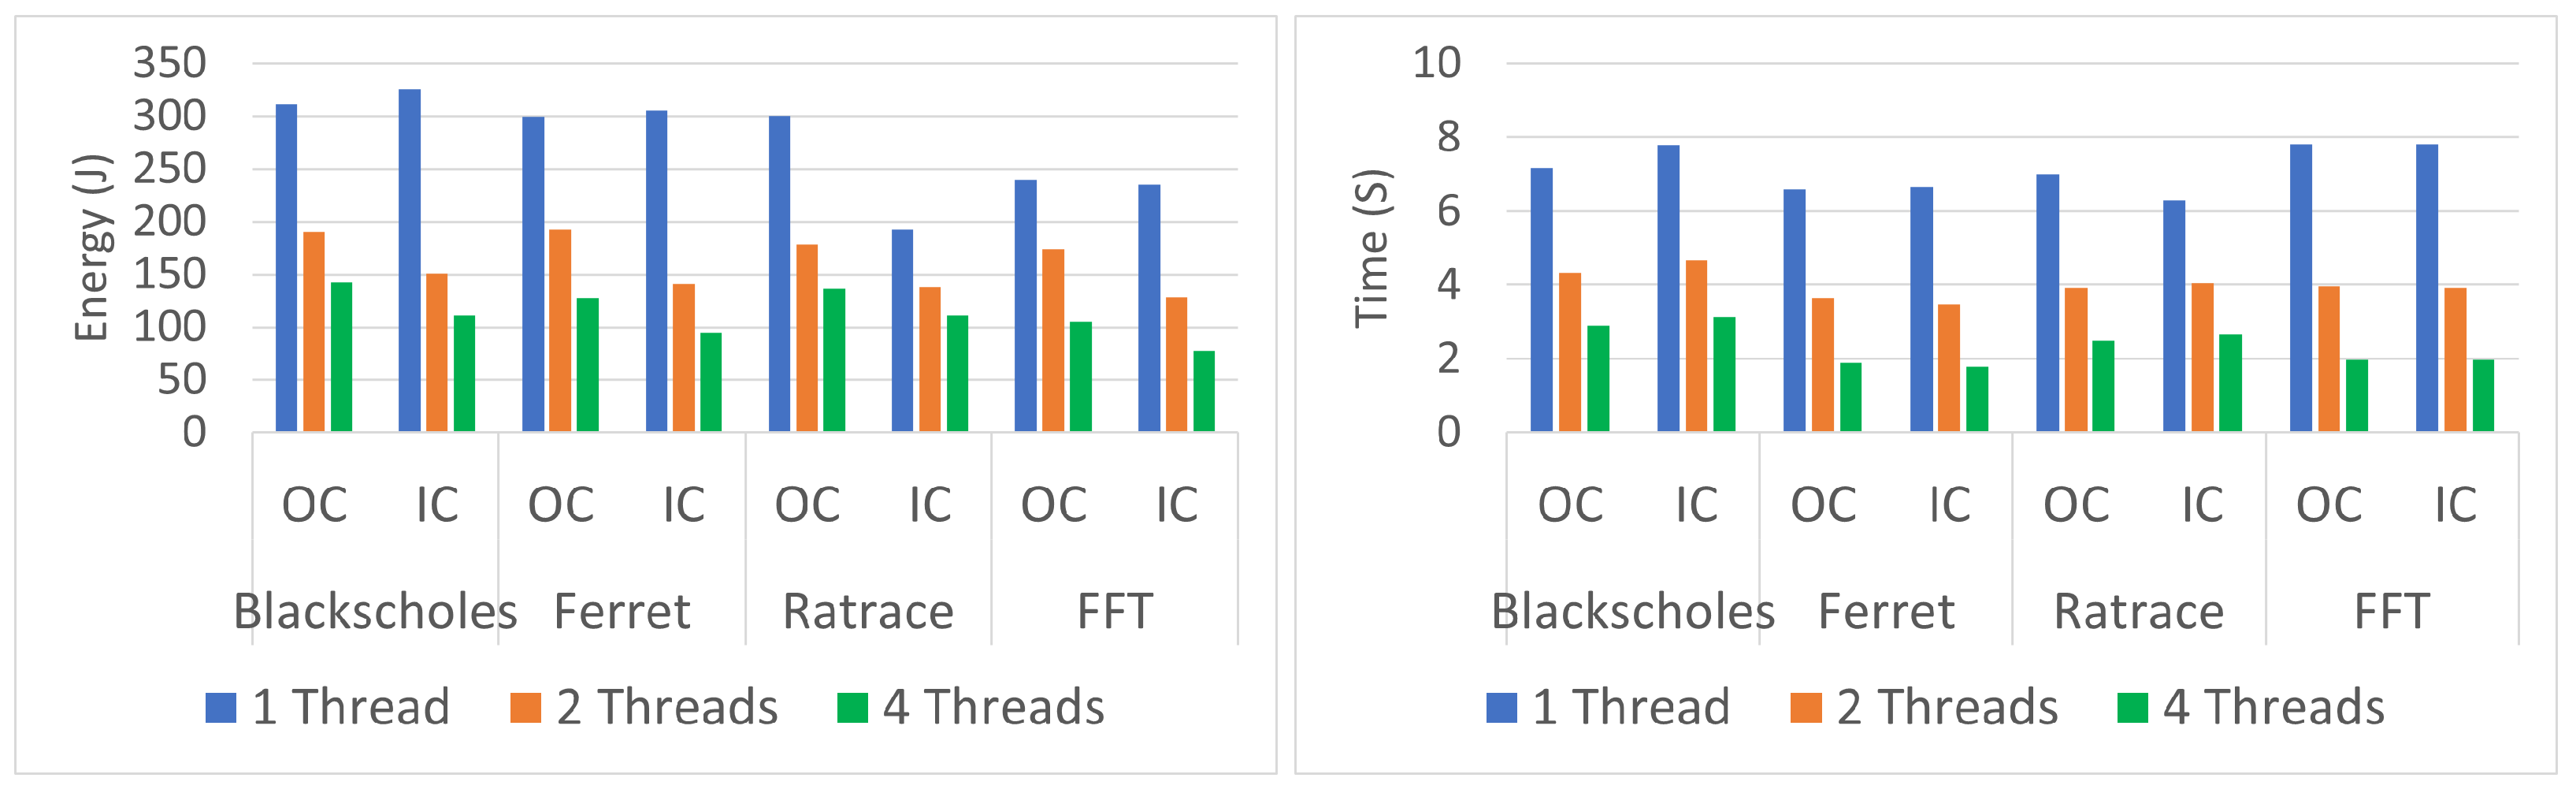
When multiple threads are running on a processor, the processor has to work harder to execute the instructions of each thread, which can increase the instantaneous power consumption because more power is required to run the additional processing cores and to move data between them. However, running multiple threads may dramatically reduce energy consumption by allowing the processor to complete the task more quickly and enter a low-power state sooner.
To measure the effect of the number of threads on the total energy, average power, and the RAPL measurement accuracy, we ran the benchmarks with one, two, and four threads outside containers (OC) and inside containers (IC). The results are summarized in
Table 2 and shown in
Figure 2.
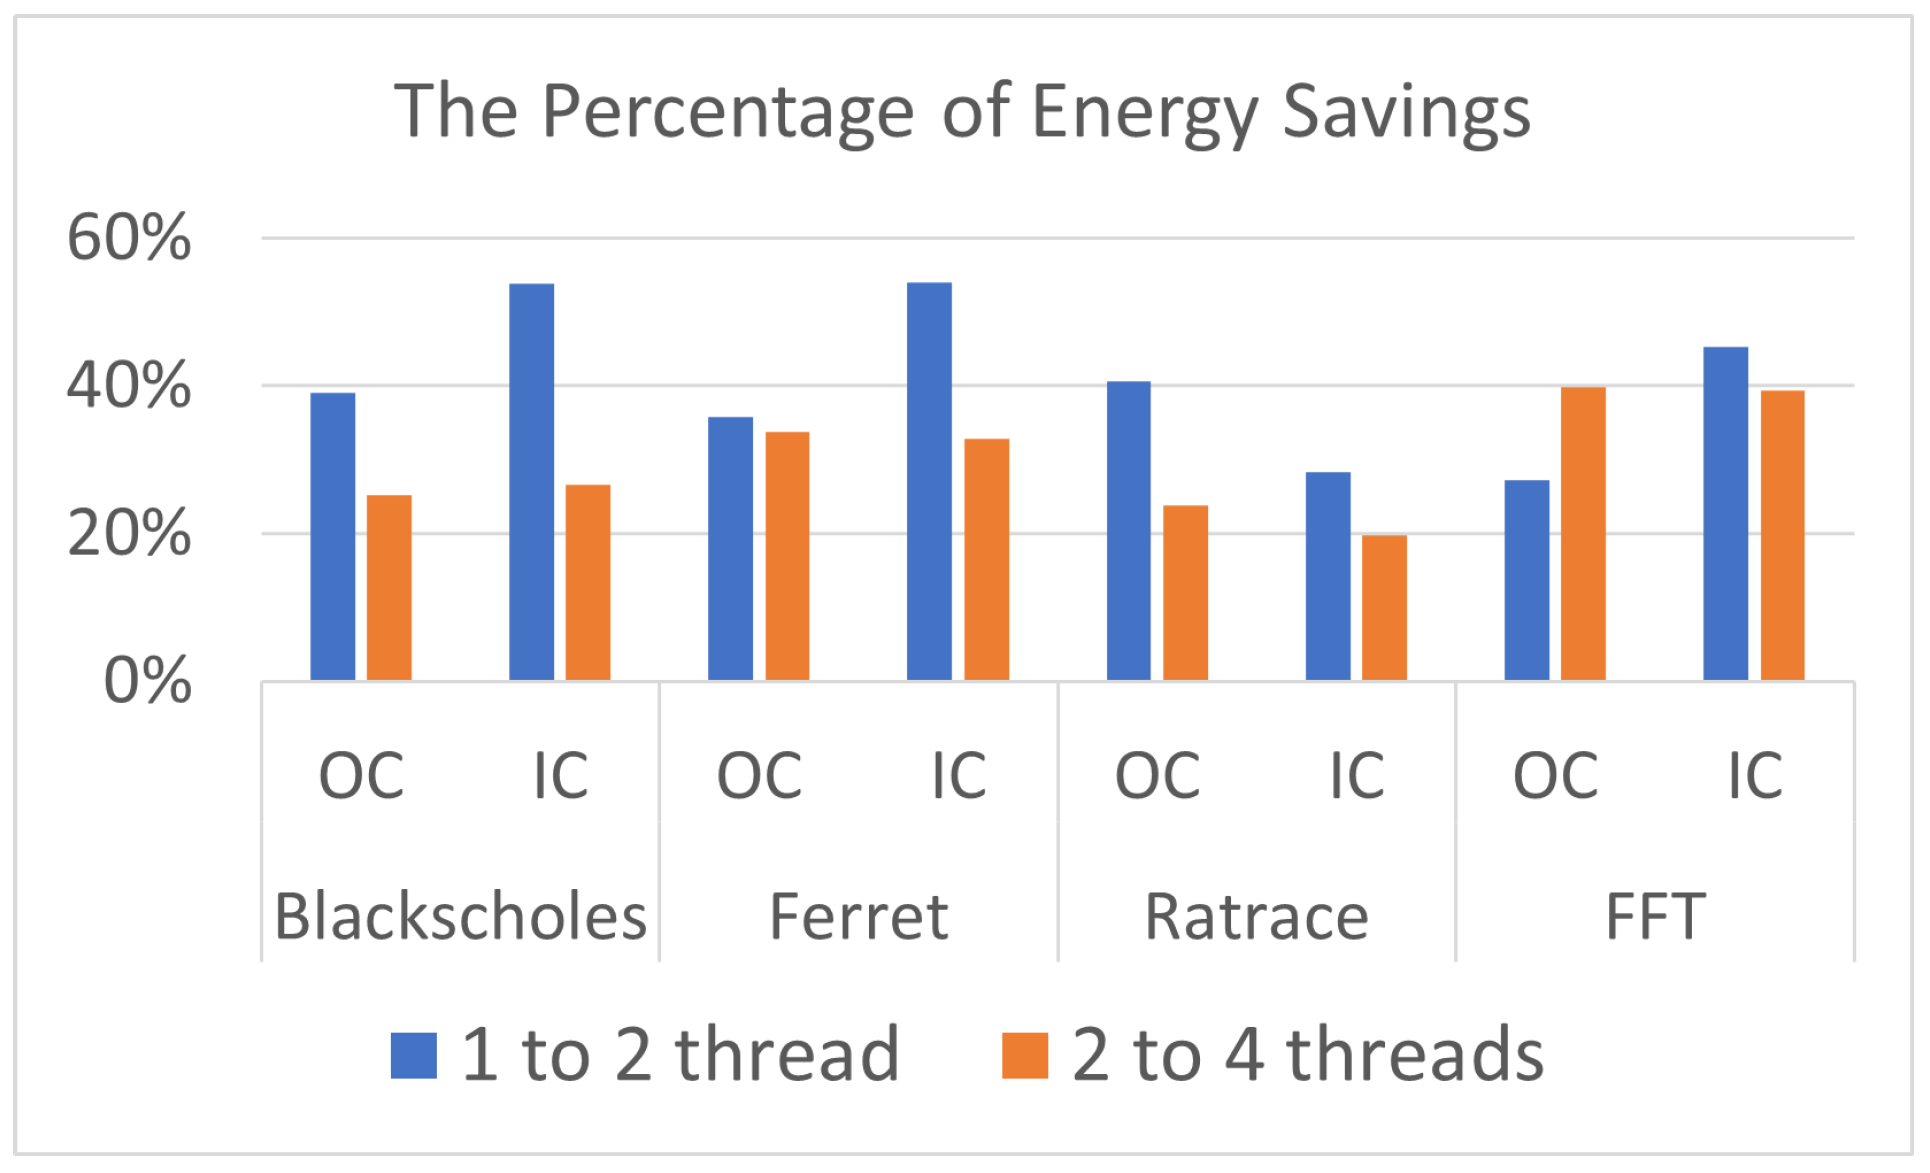
There were dramatic savings in total energy between one and two threads, ranging from 27.25% to 40.59%, when running the benchmarks outside containers, while the savings in total energy when they ran inside containers ranged from 28.35% to 54.00%, with a slight increase in average power with two threads for both cases (OC and IC). The savings in total energy ranged from 23.74% to 39.78% between two and four threads outside containers, while the range of savings inside containers was from 19.72% to 39.35%. See
Figure 3.
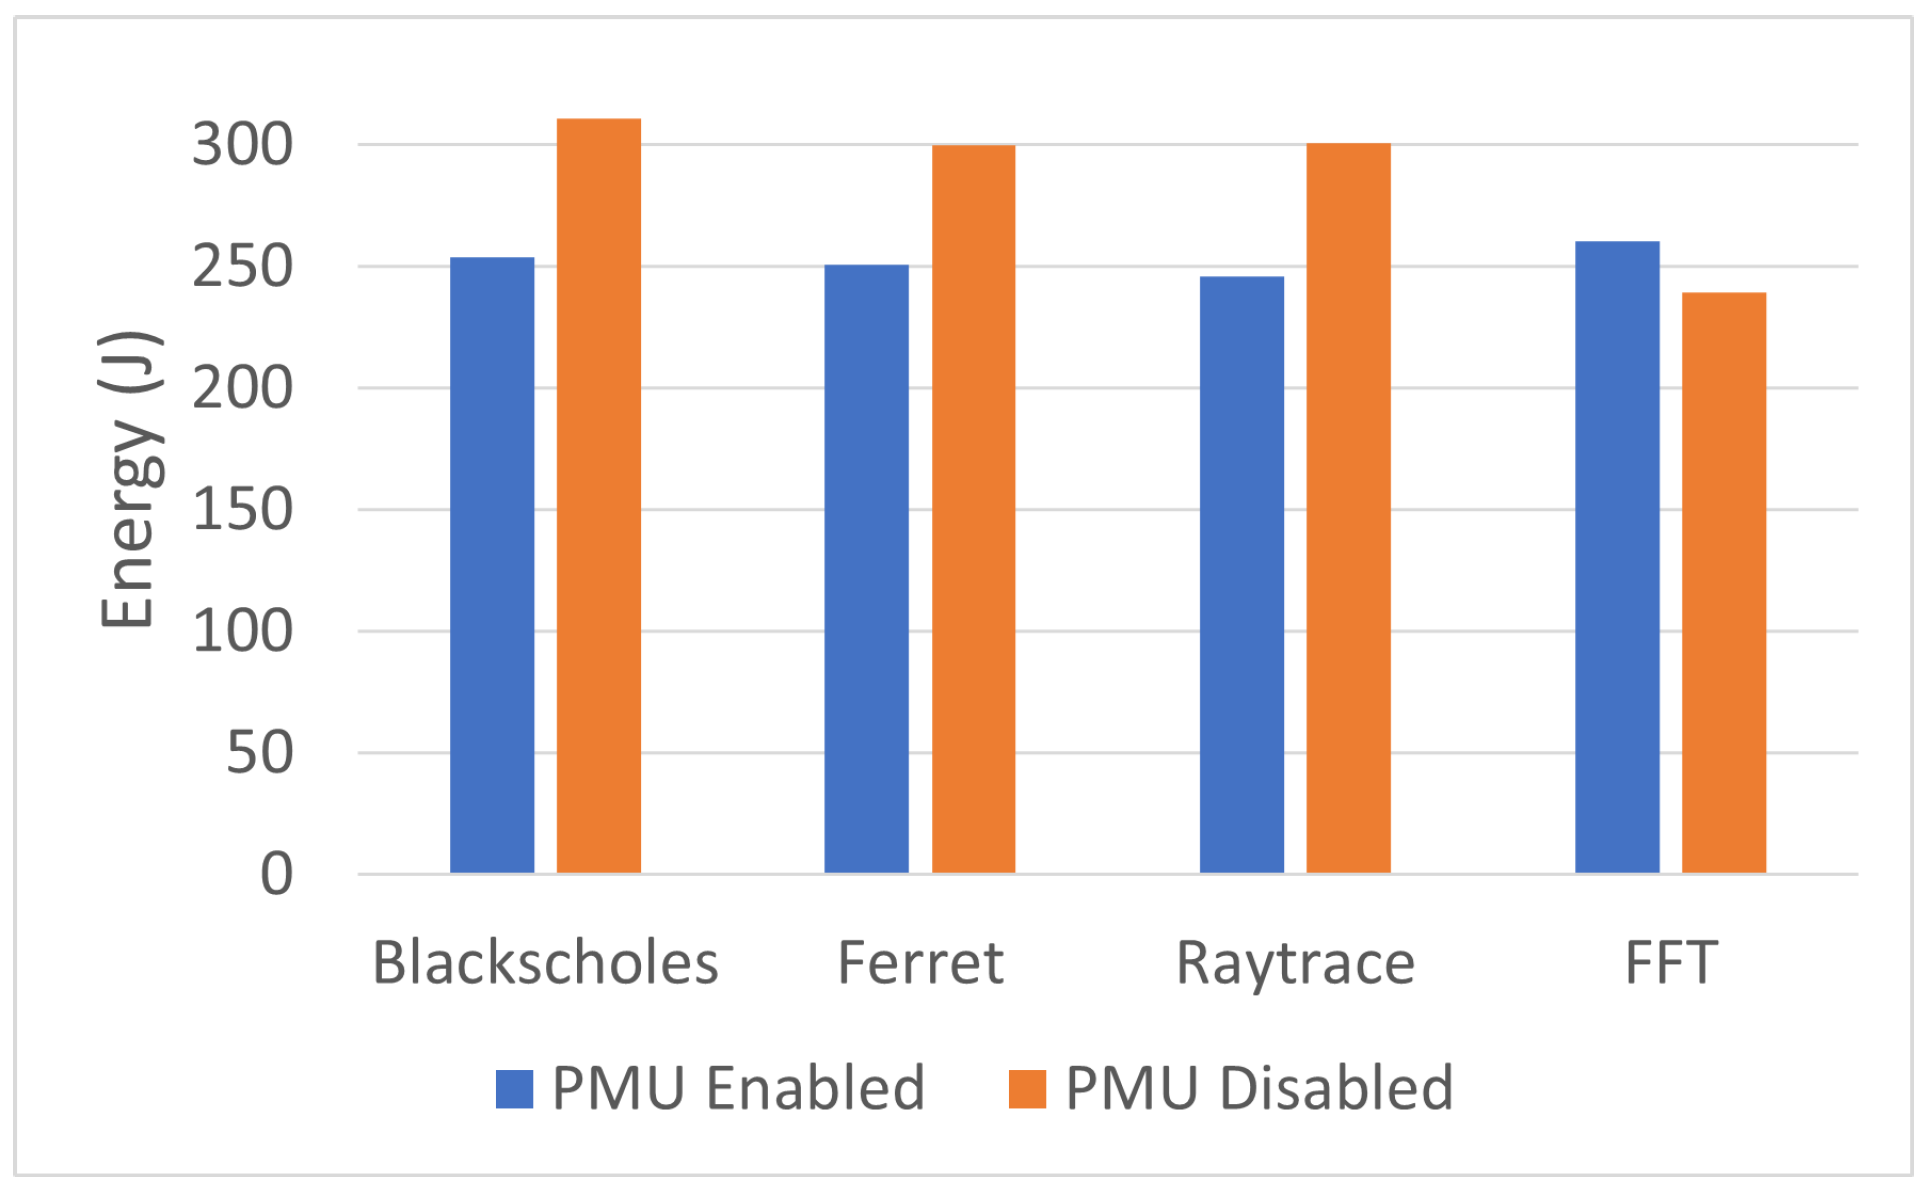
6.1.3. Power Management Unit Effect
The Power Management Unit (PMU) is responsible for managing and controlling the power consumption of a computer system. It regulates various power-related aspects, such as voltage levels, clock frequencies, and power states of different components. To measure the effect of the Power Management Unit (PMU) on RAPL readings, we took the RAPL readings in two cases, Power Management Unit enabled (PMUen) and Power Management Unit disabled (PMUdis), as indicated in
Table A1 and
Table A2.
Figure 4 shows increases in execution time and energy and a decrease in average power in the case of PMUdis compared to the PMUen case in three of the benchmarks. However, in the case of the FFT benchmark, the energy consumed by the CPU in the case of PMUdis is less than the energy consumed in the case of PMUen.
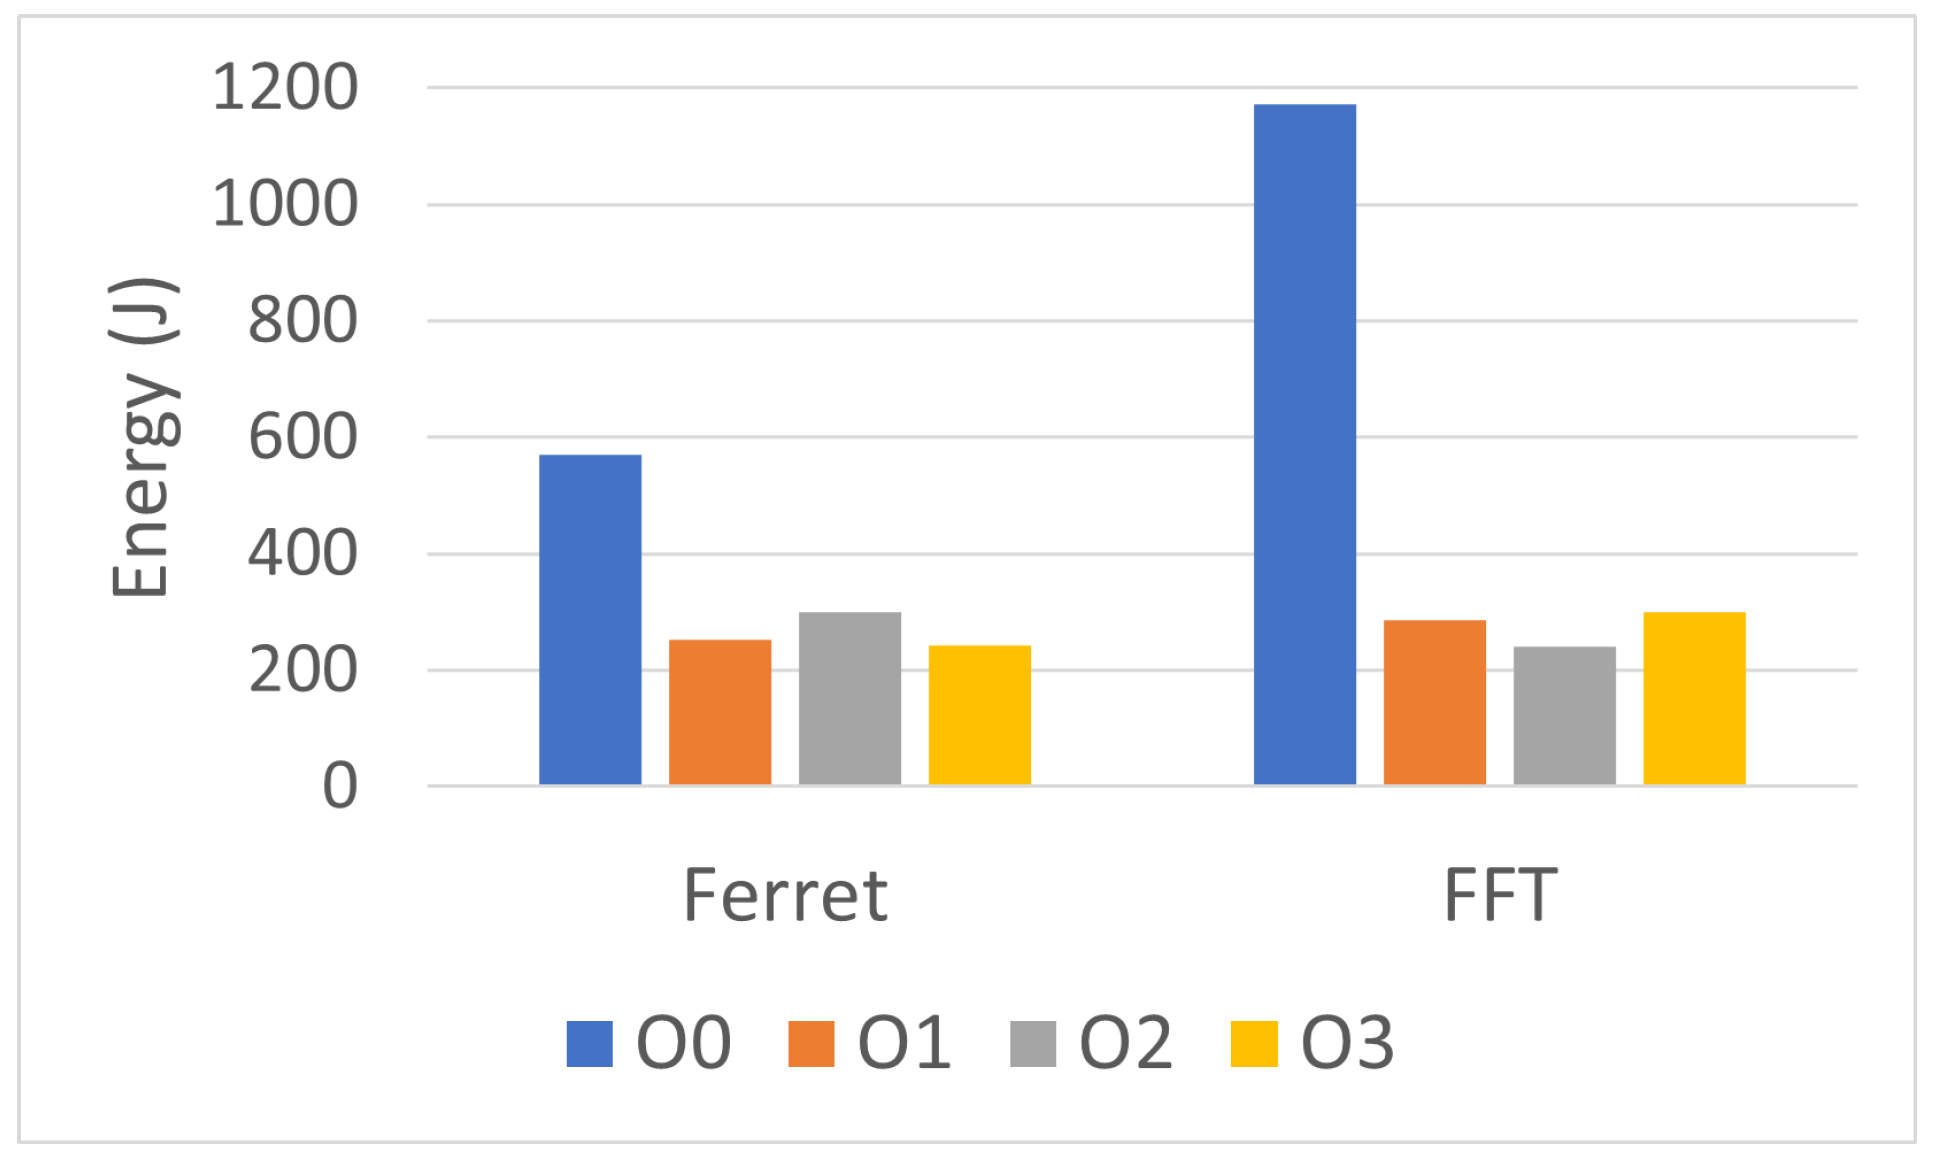
6.1.4. Compiler Optimization Effect
Table A3 shows that compiler optimization dramatically affected the total energy and other program events. It was not always the case that, as one might expect, the more optimization, the better the time and energy savings. In the Ferret benchmark, O1 optimization saved more power and energy than O2, while in FFT, O2 gave the best savings among the optimization levels. O0 optimization (minimal optimization) always yielded the highest energy readings (see
Figure 5). However, it is safer to avoid compiler optimization when comparing two software codes from a power and energy perspective.
6.1.5. Containerization Effect
The benchmarks ran directly on the host and also ran again inside docker containers. These two cases are denoted by OC (outside container) and IC (inside container) in
Table A1. In most cases, running workloads inside containers led to savings in total energy compared to running them outside containers, even though the execution time was longer inside containers in most of the cases, as expected. However, the case of one thread in Blackscholes and Ferret benchmarks led to more energy consumption inside containers. See
Figure 6.
Running the benchmarks inside containers showed a slight increase in events compared to running them outside containers.
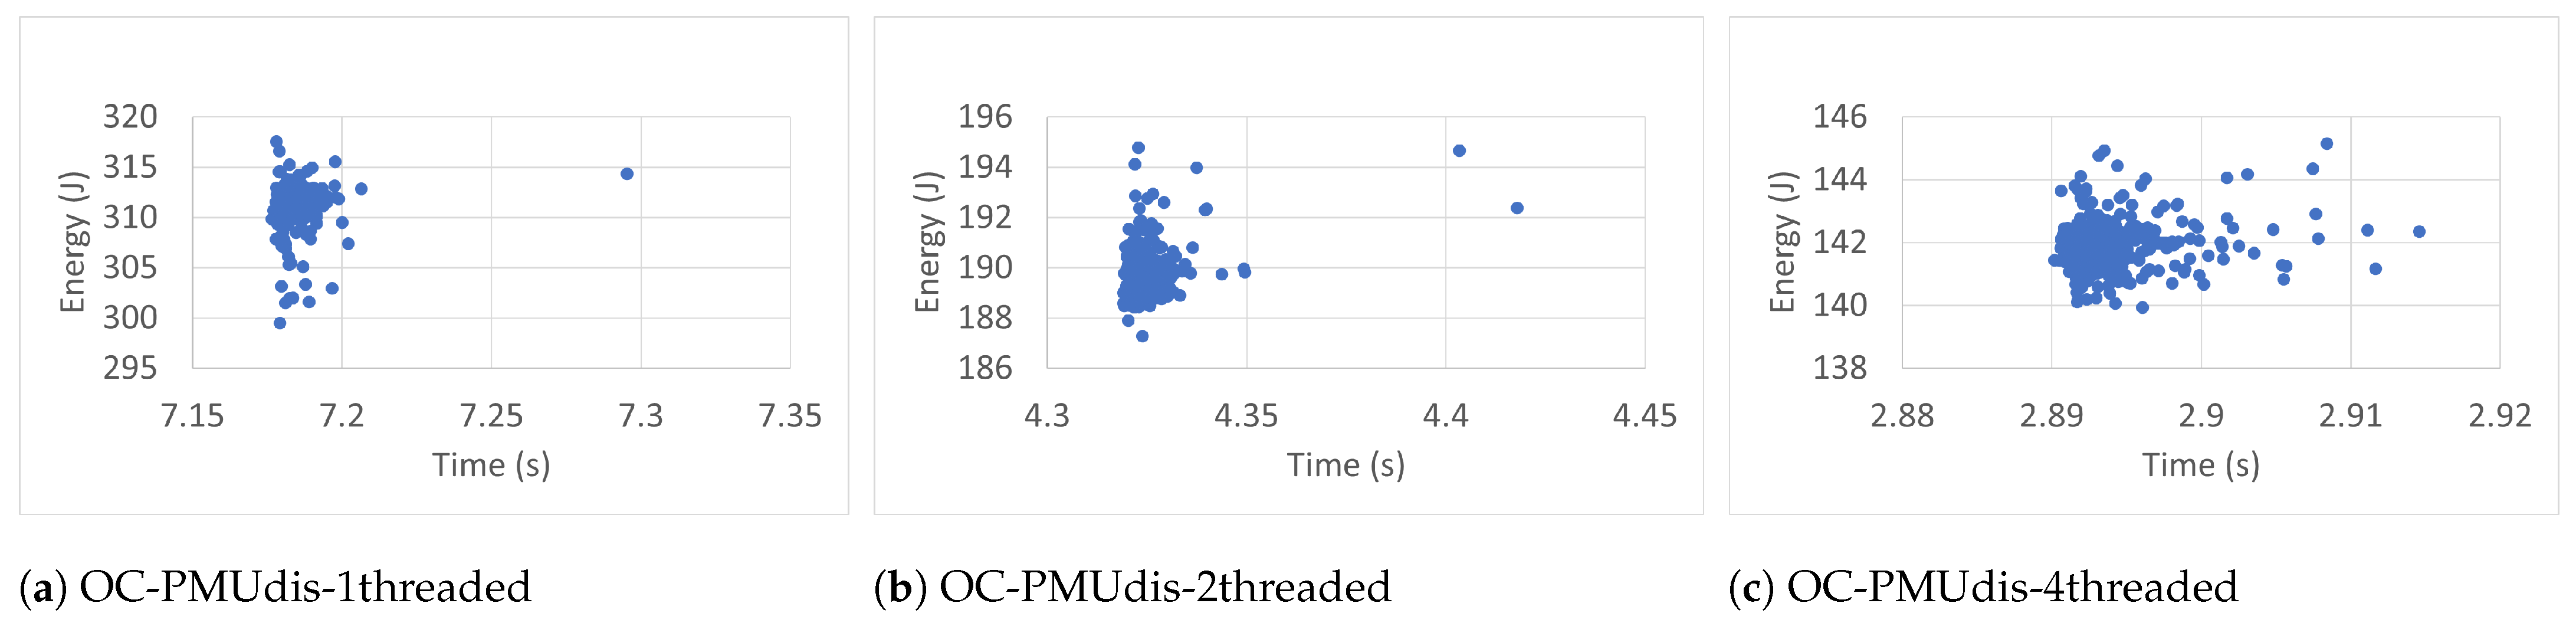
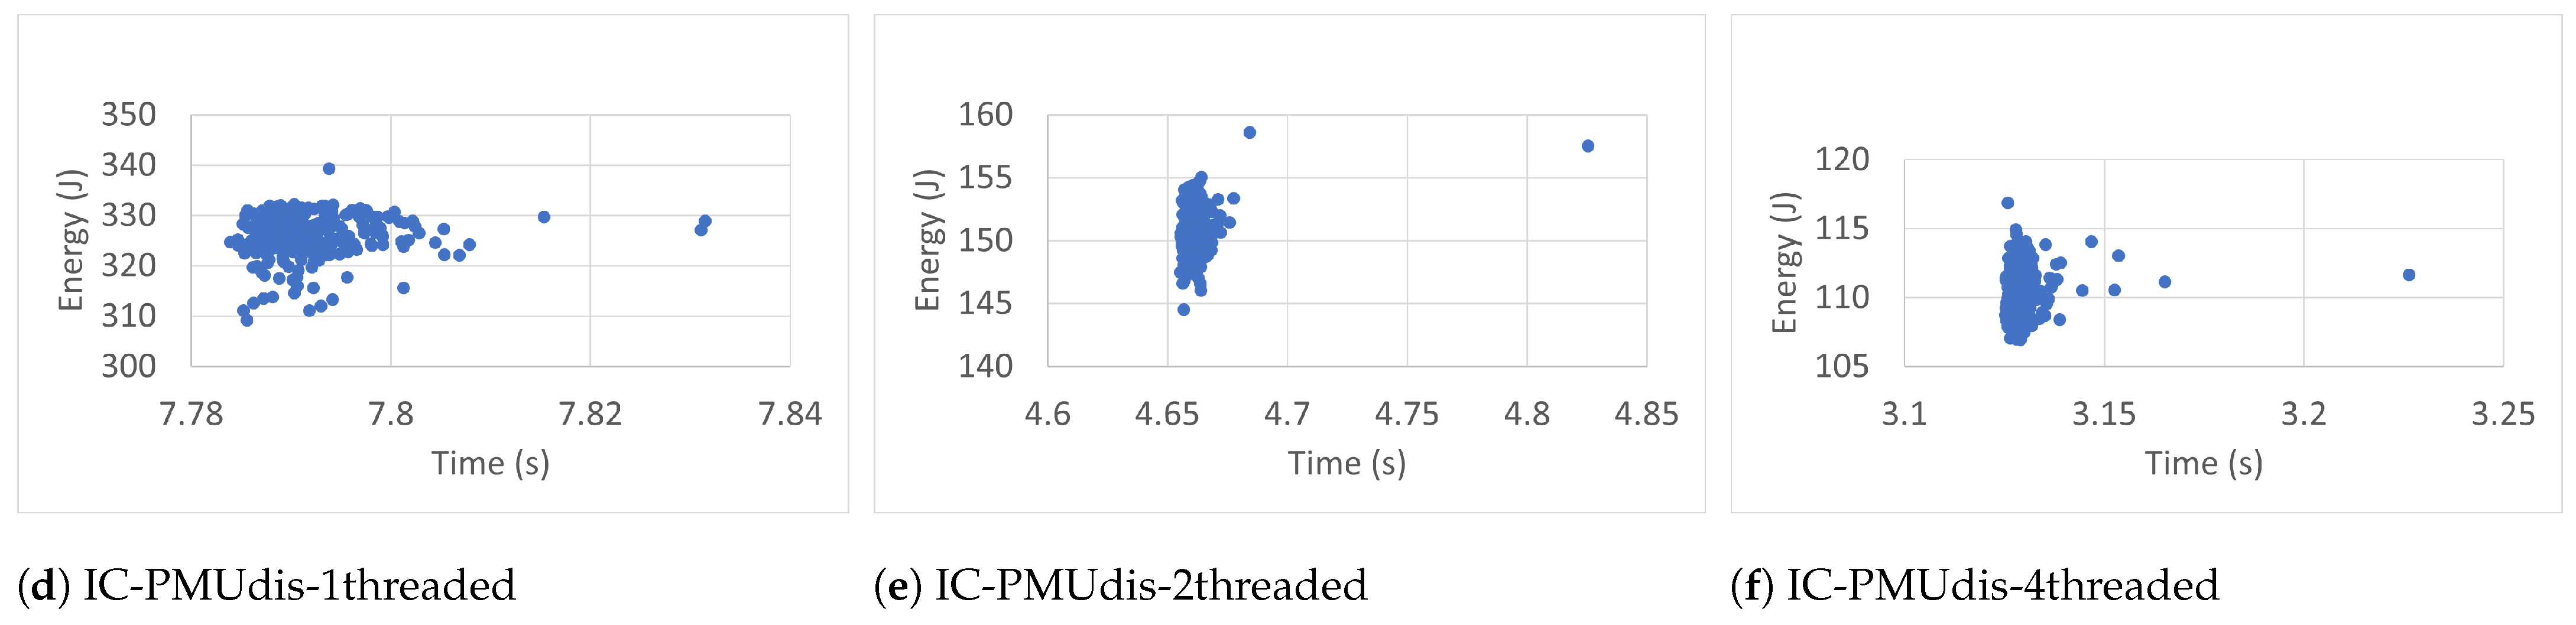
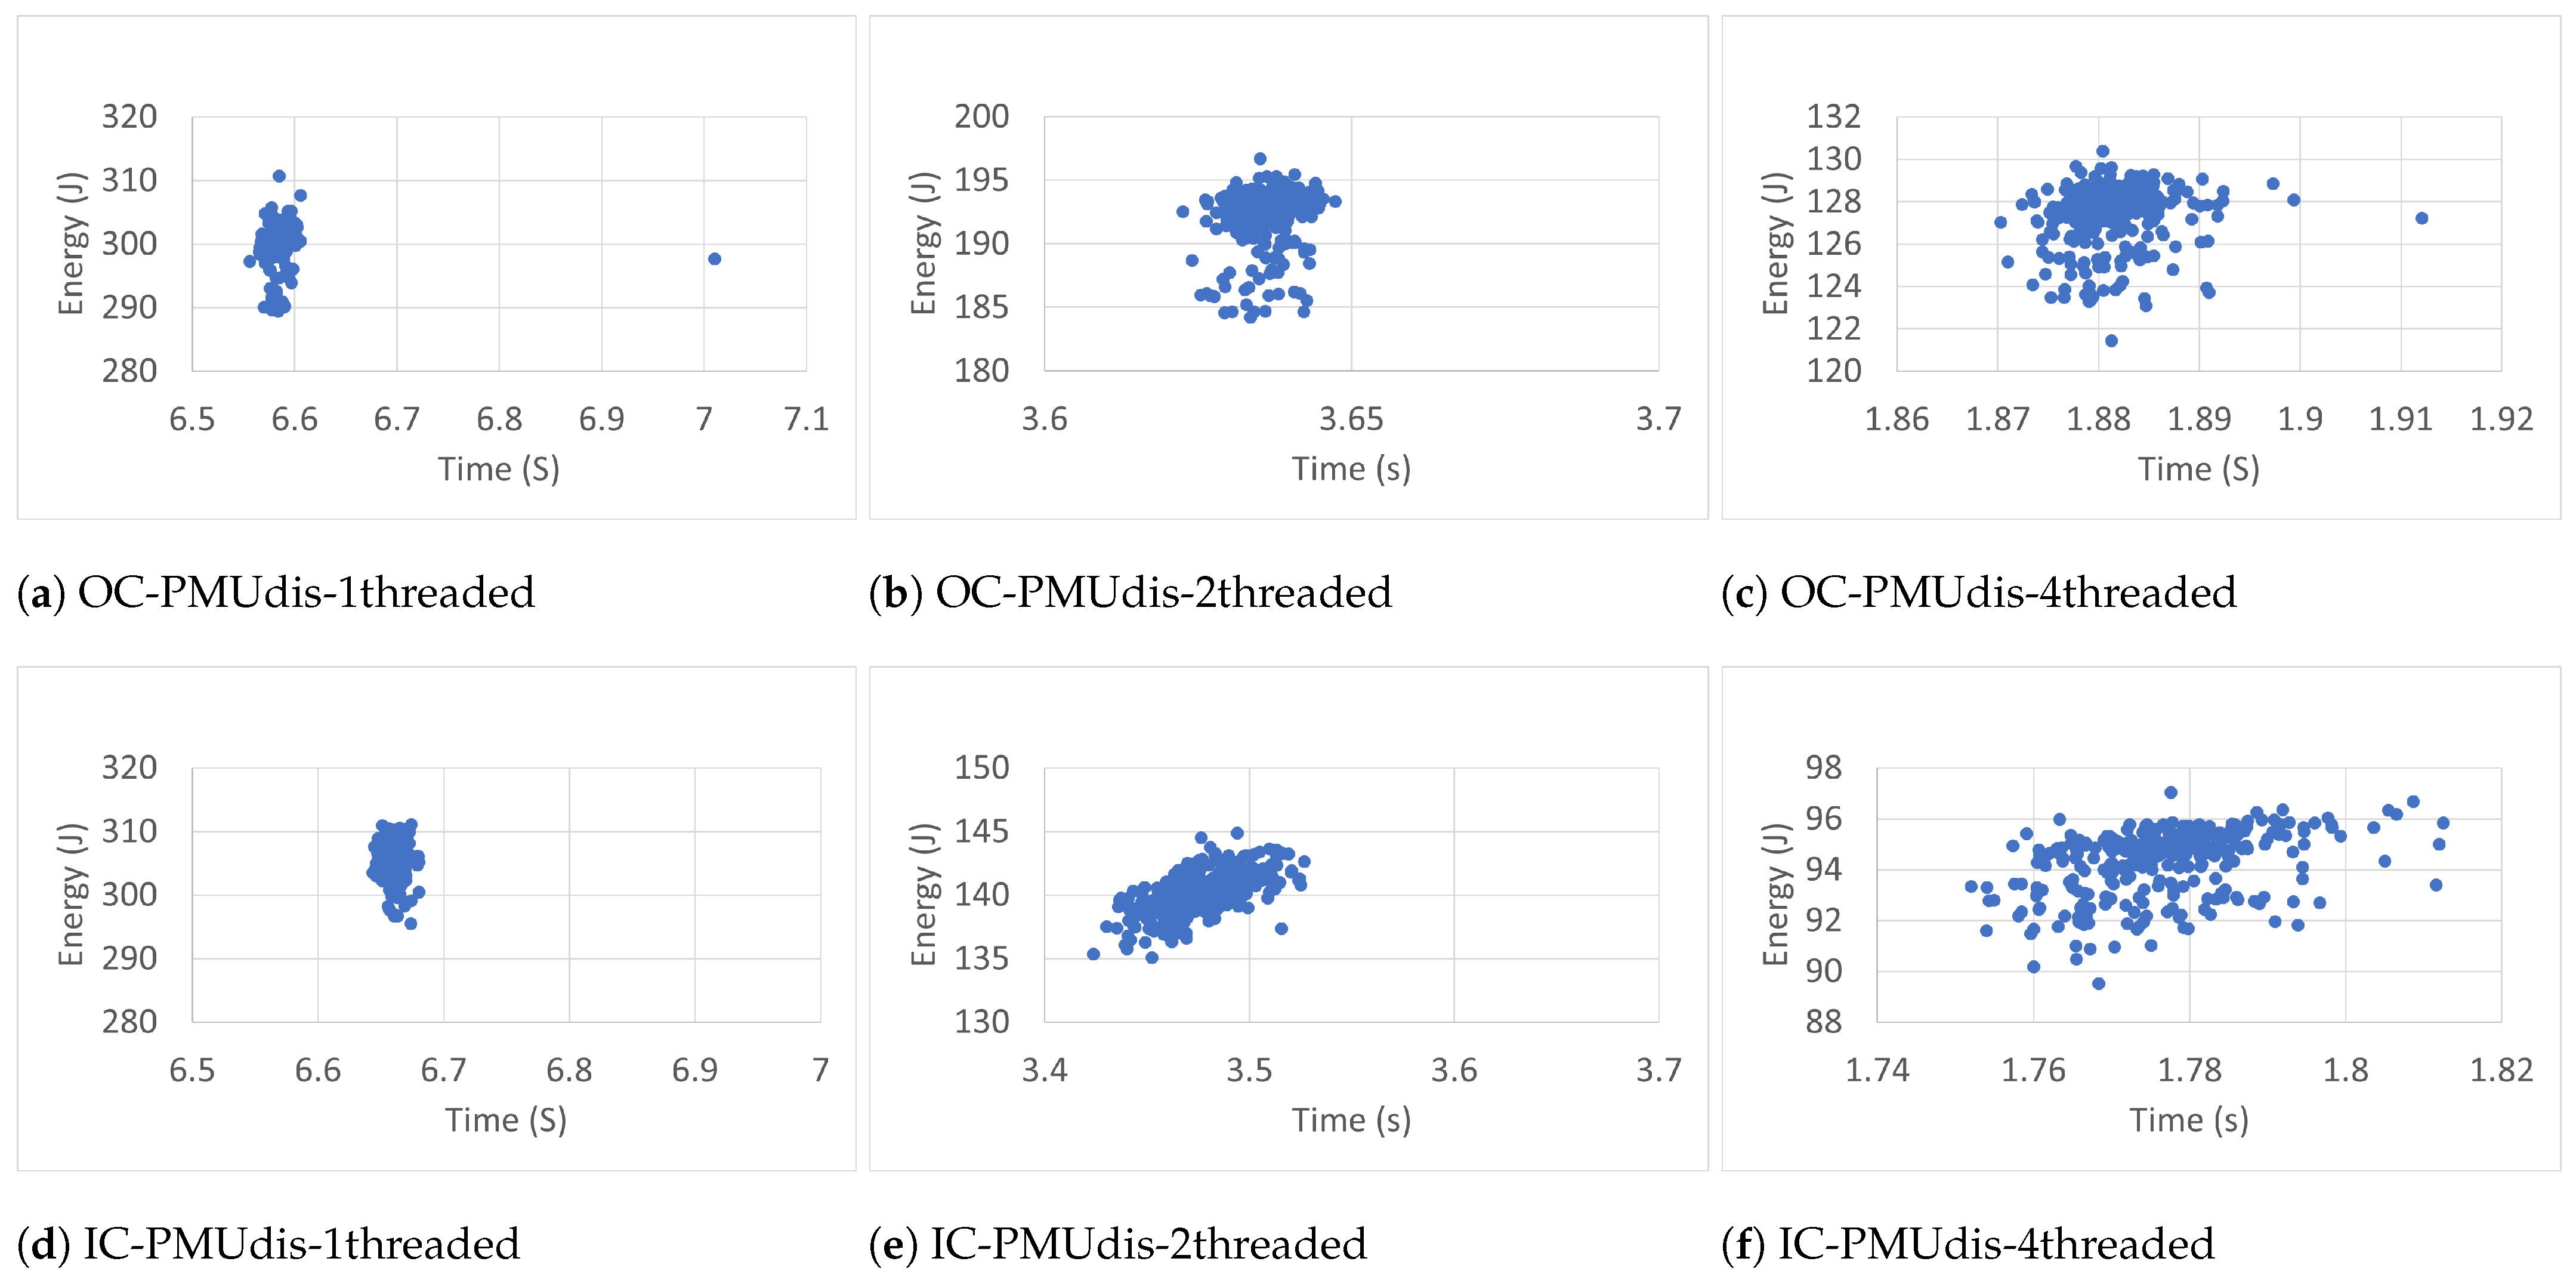
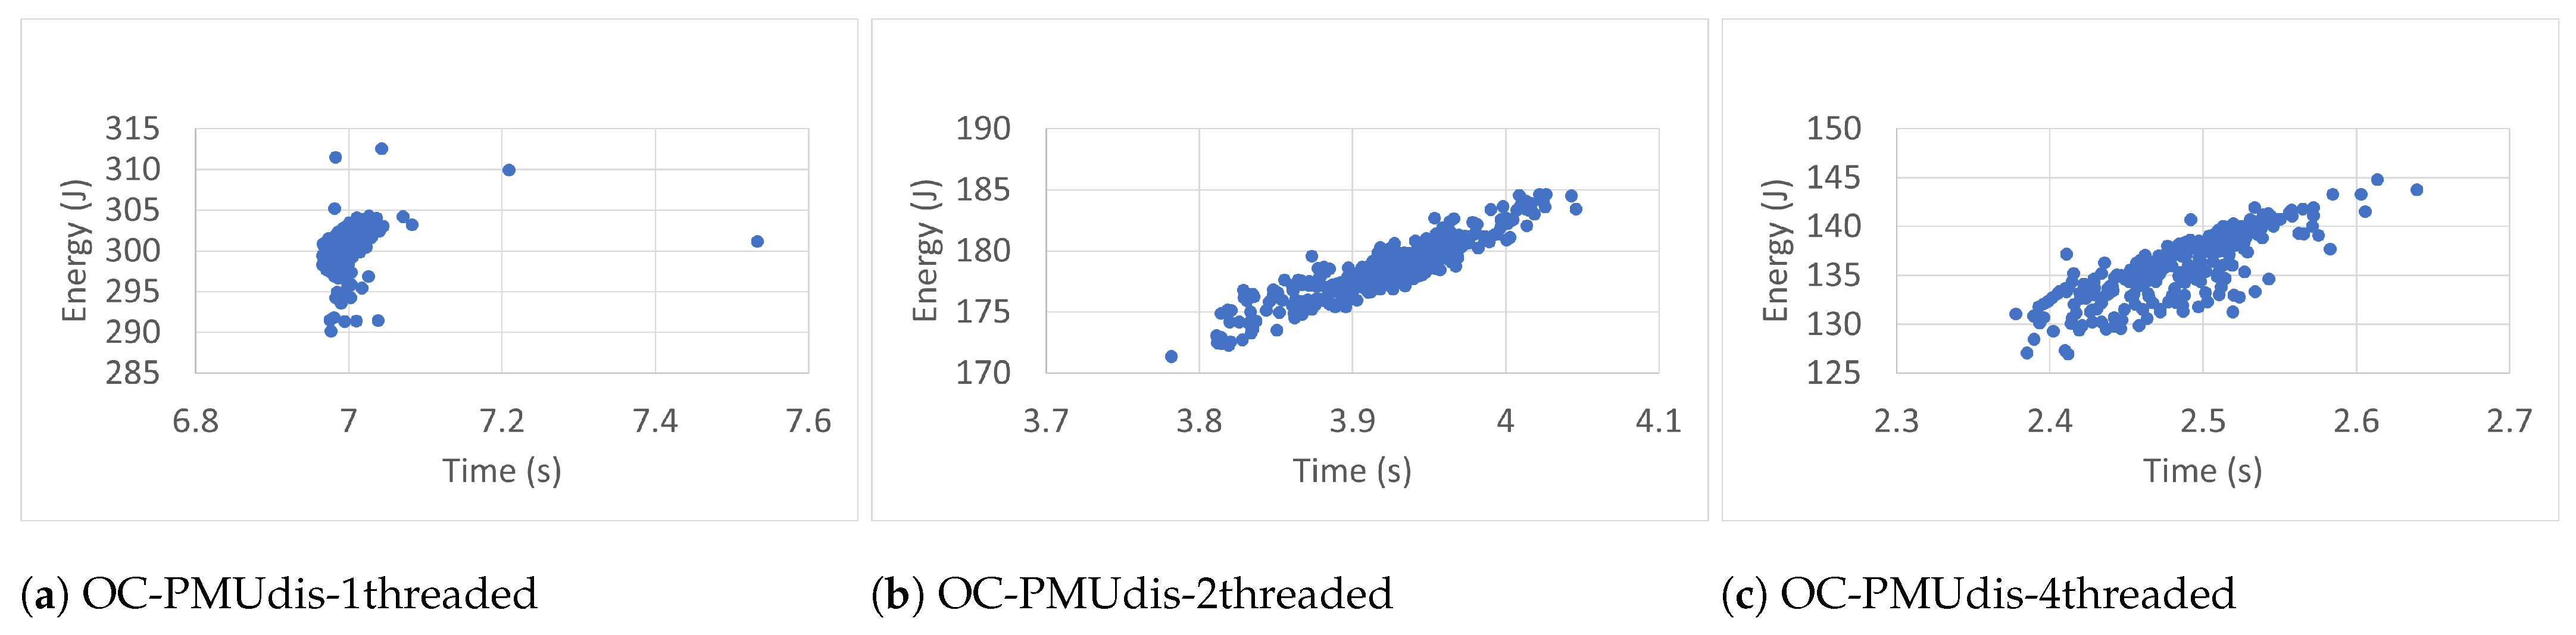
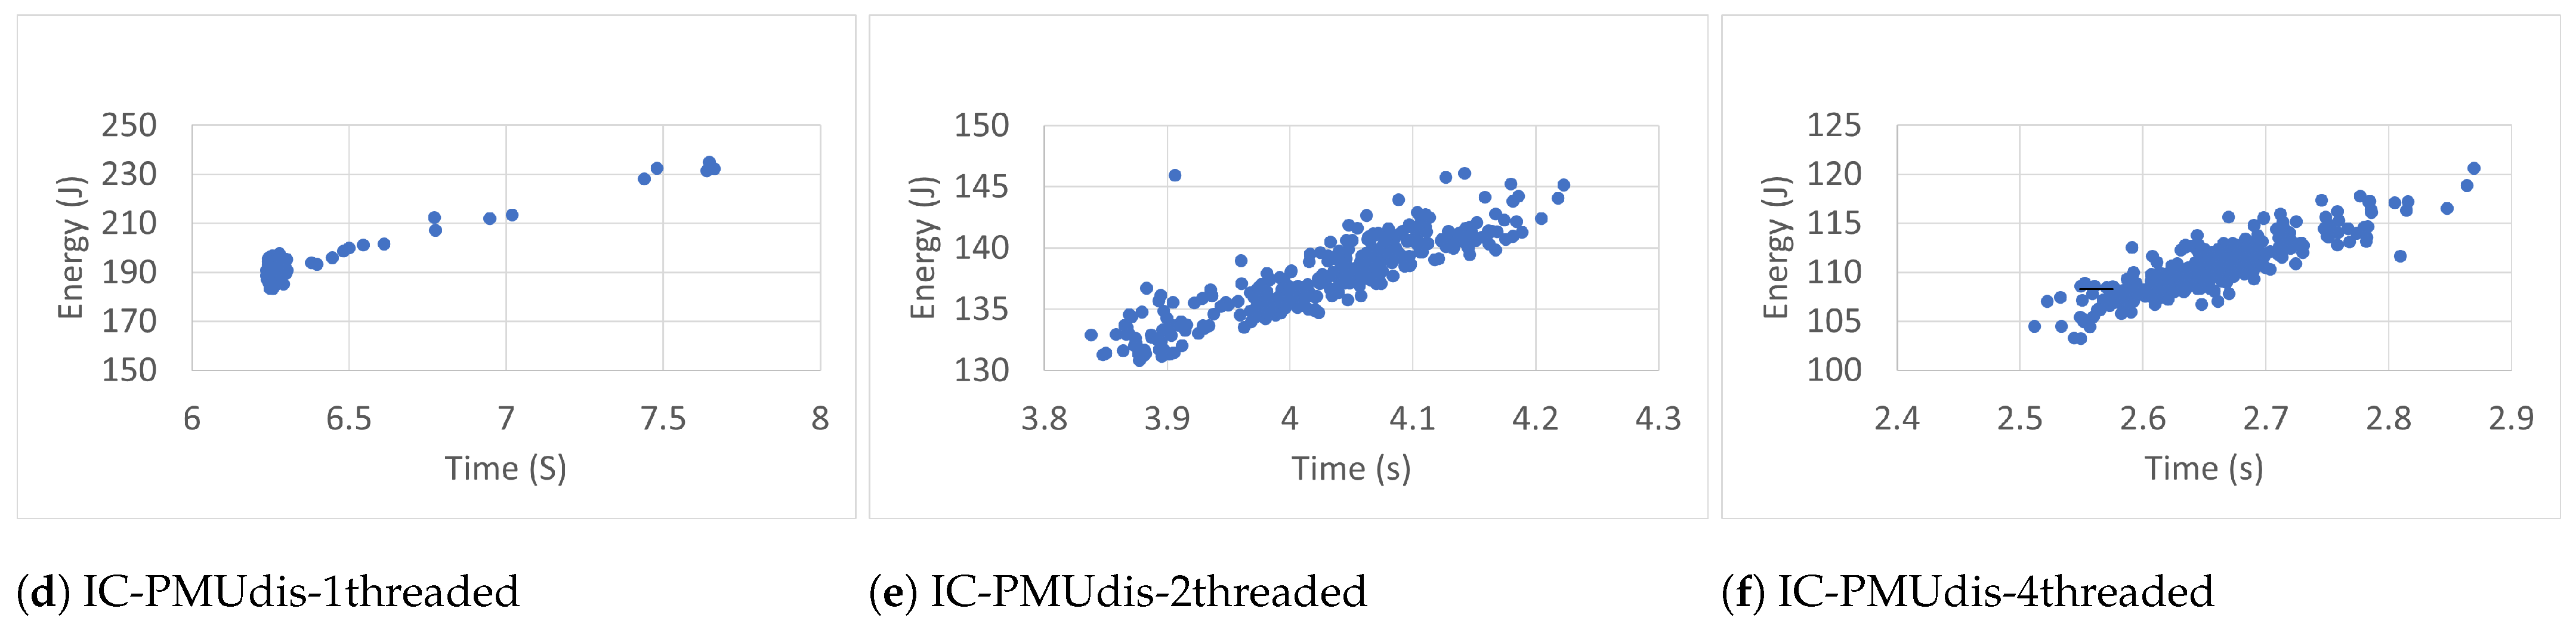
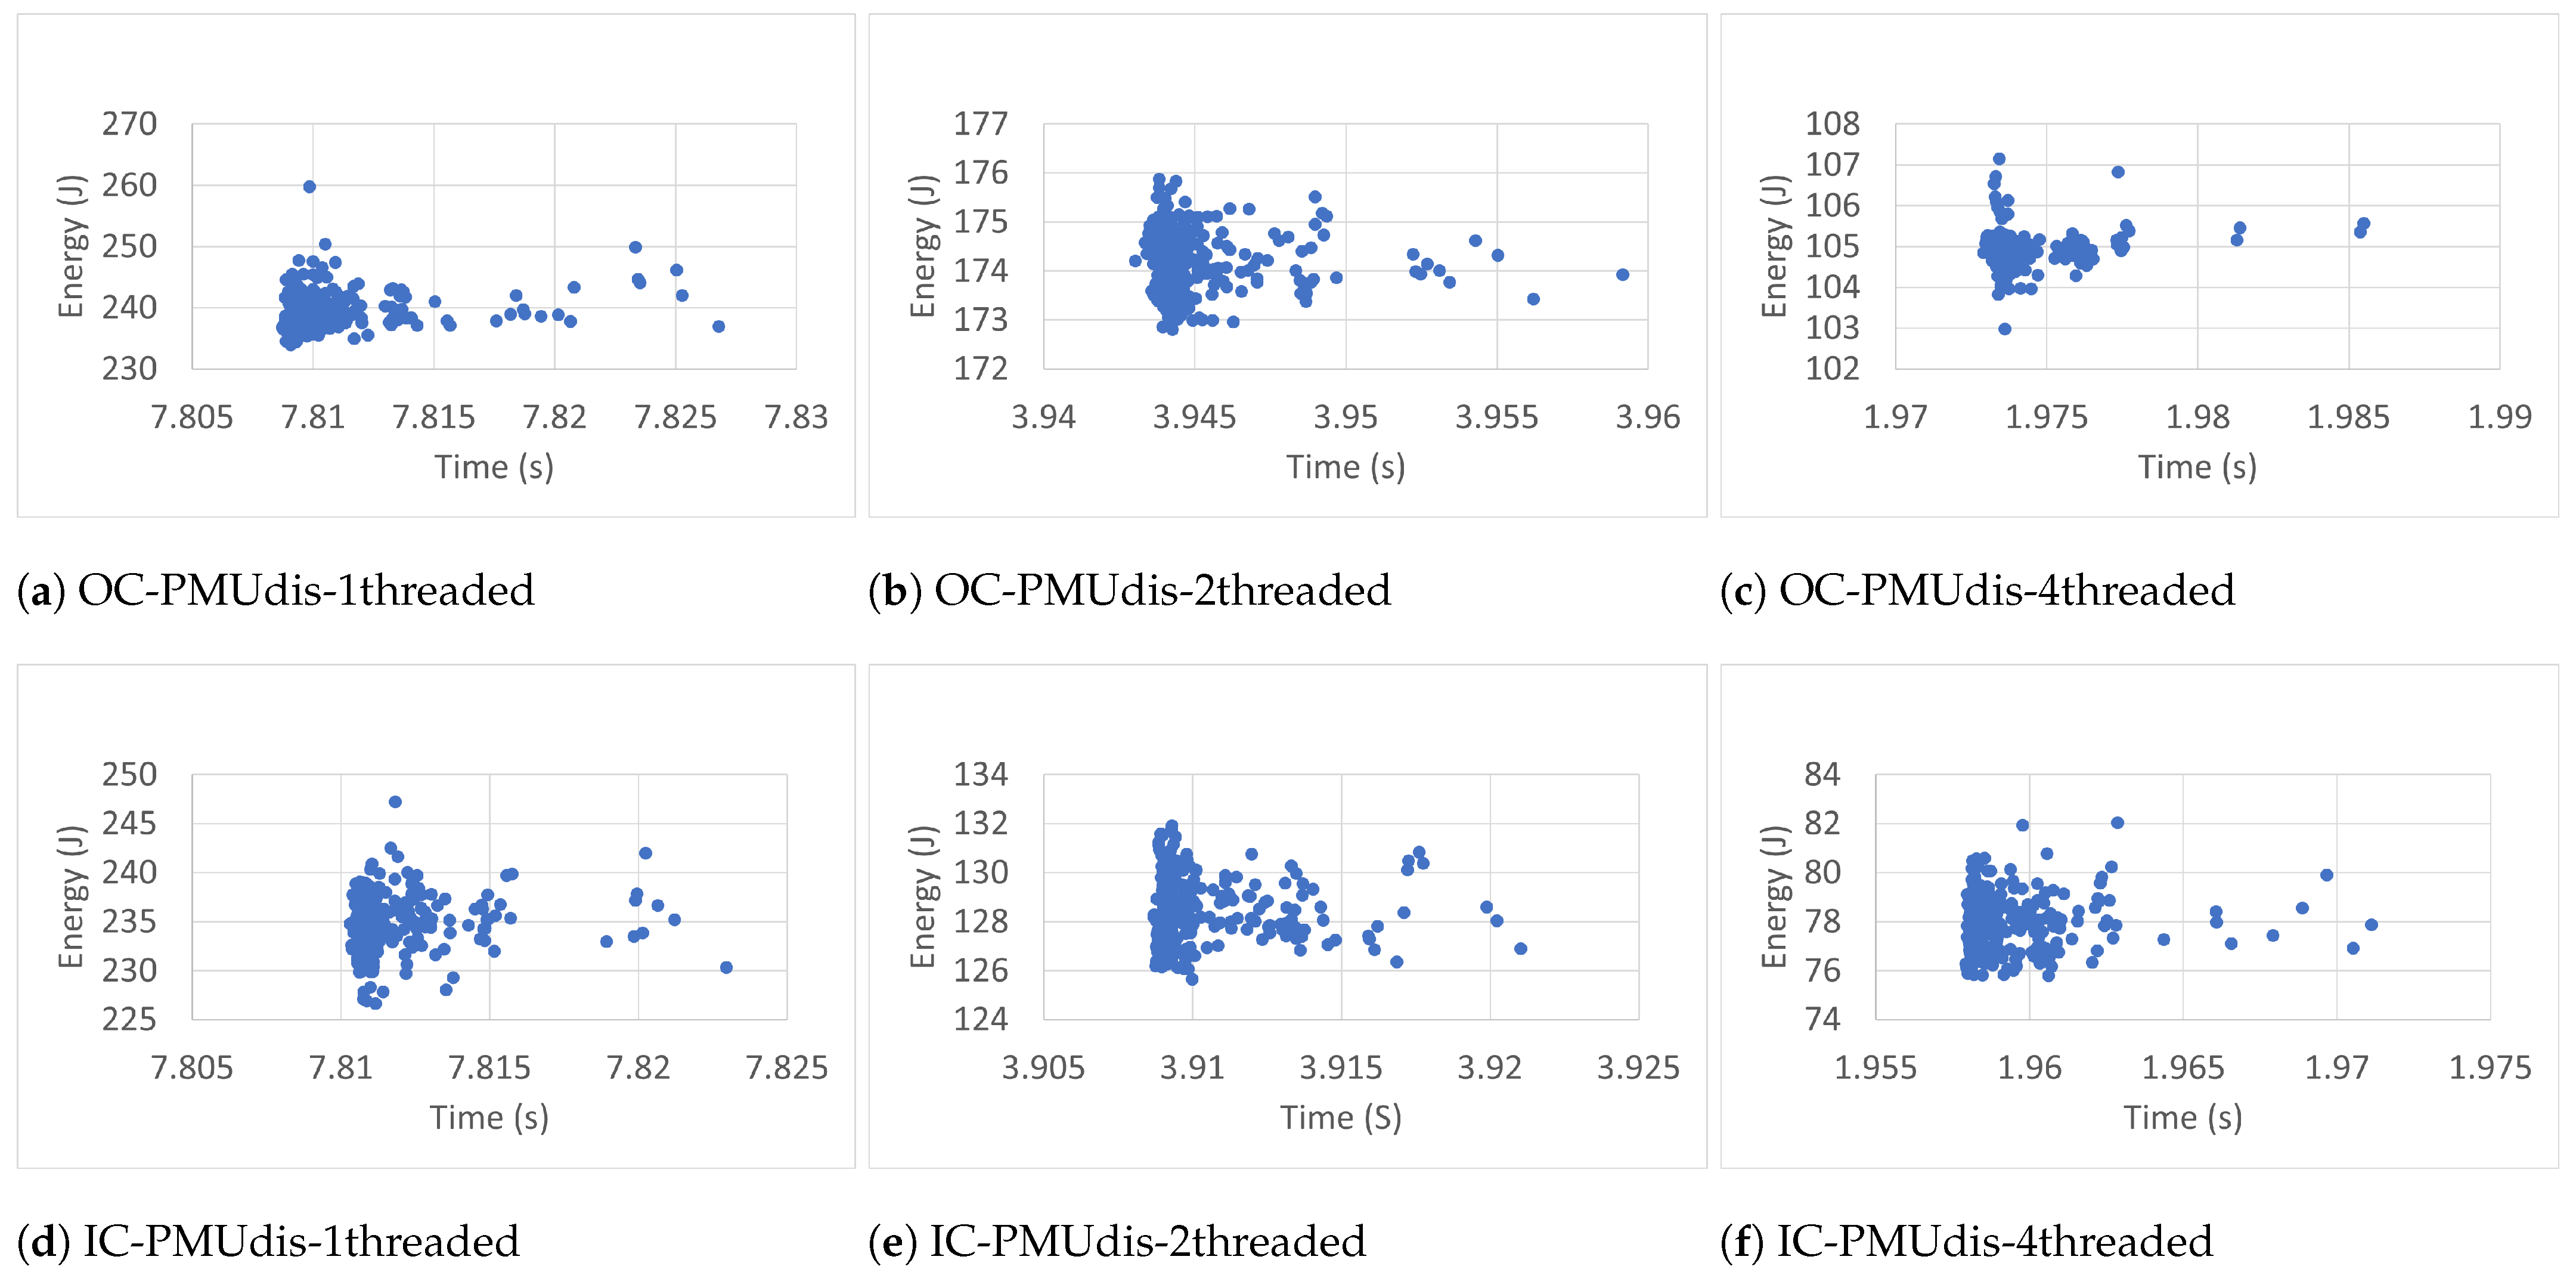
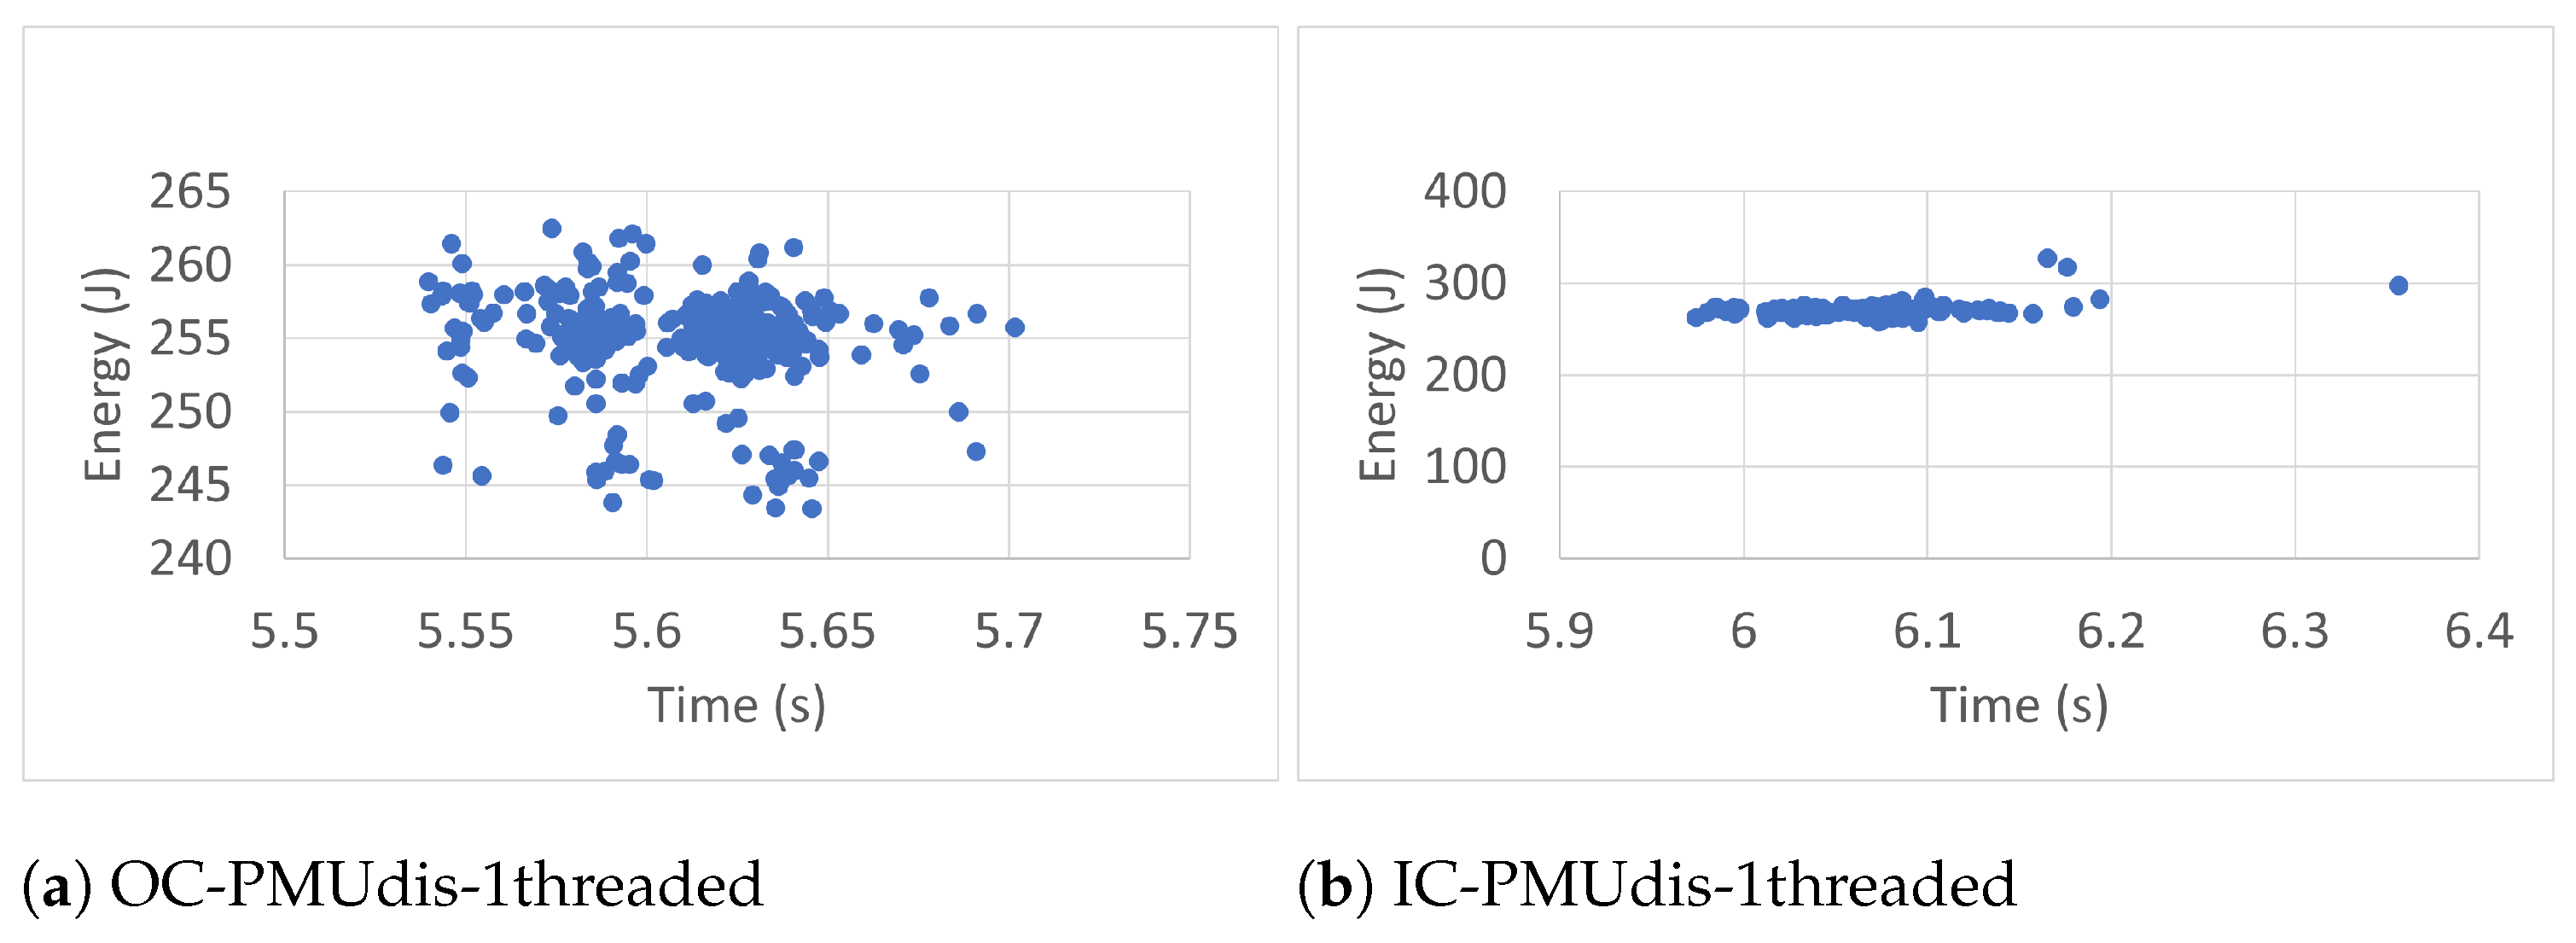
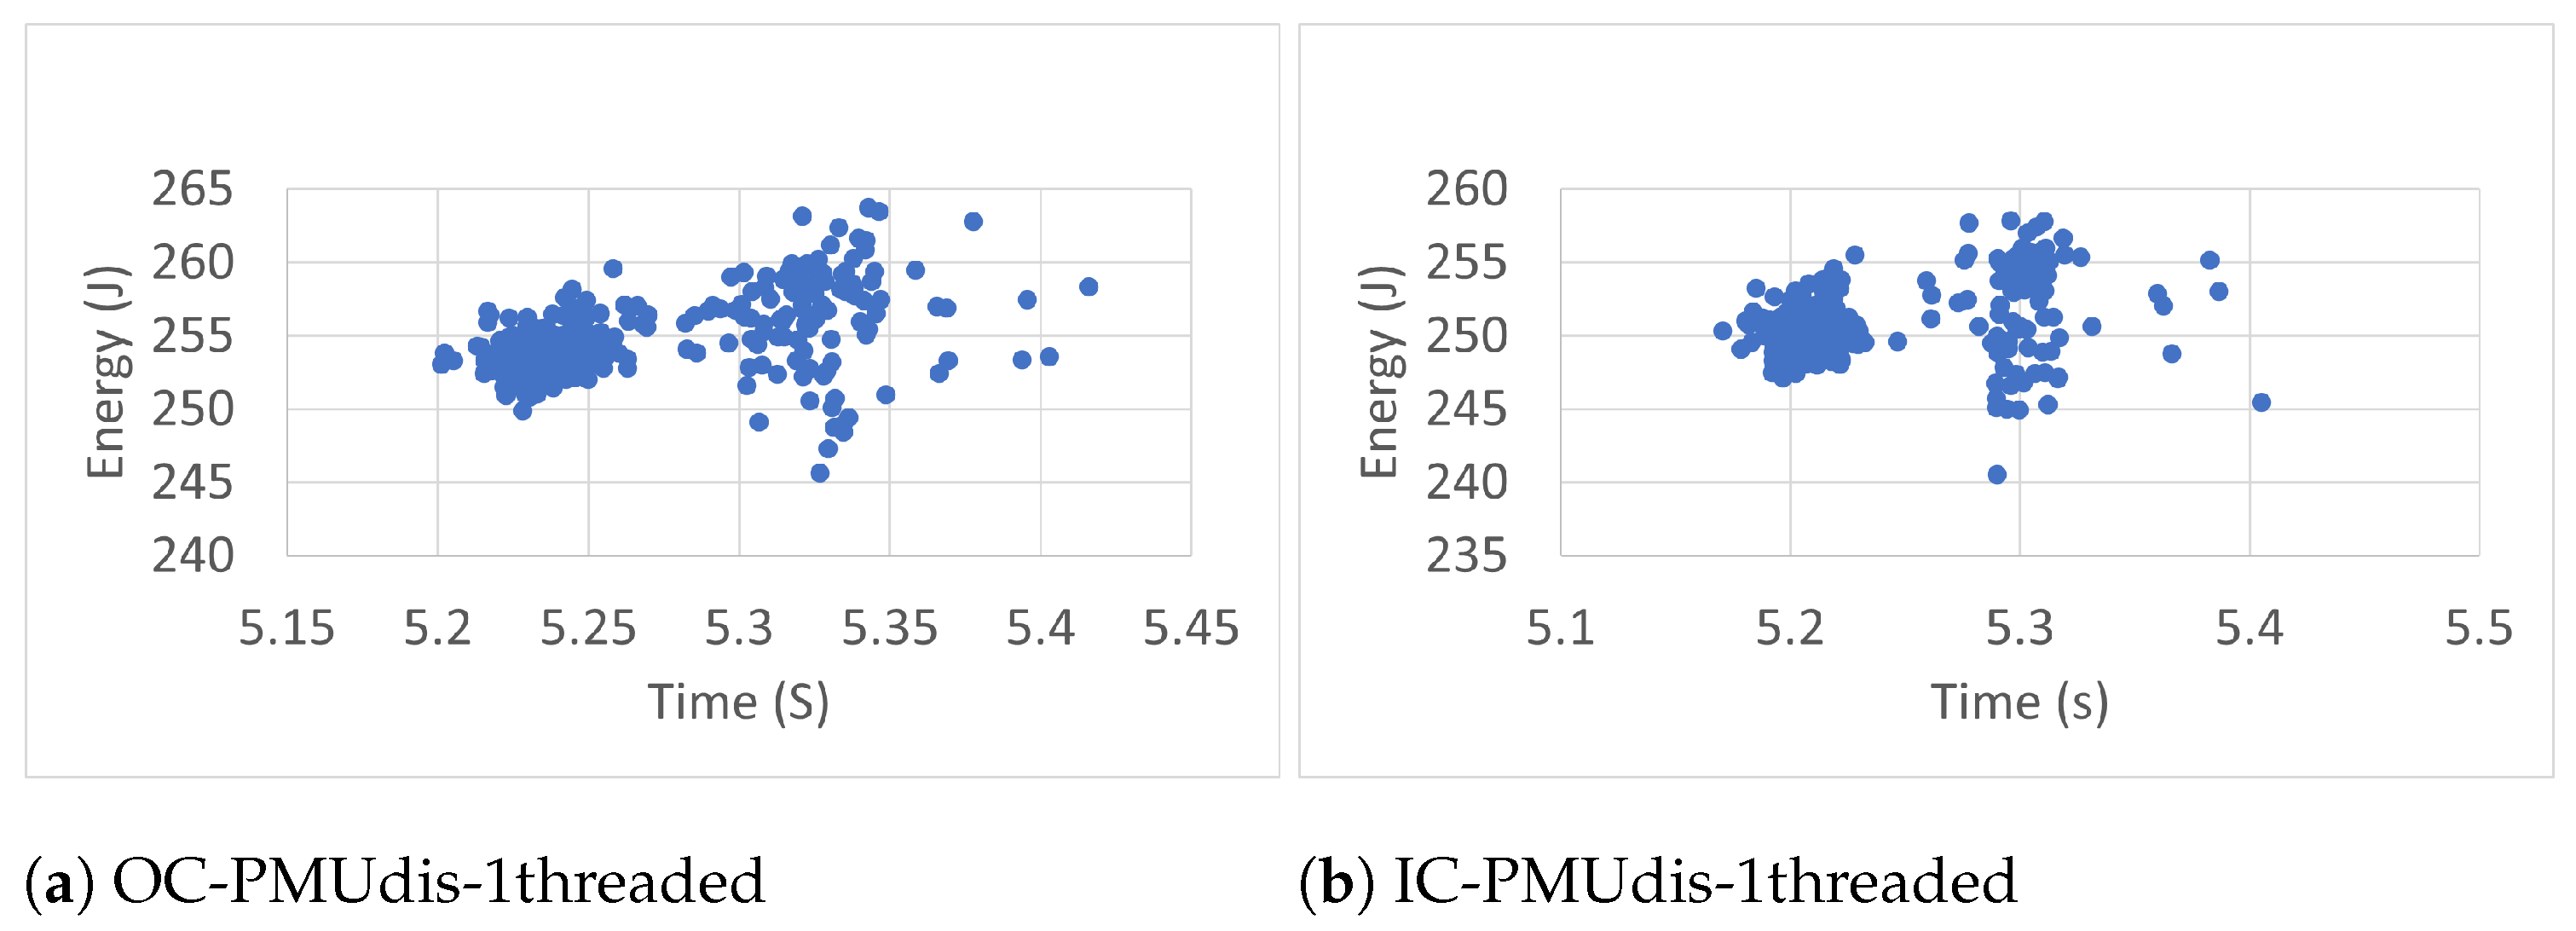
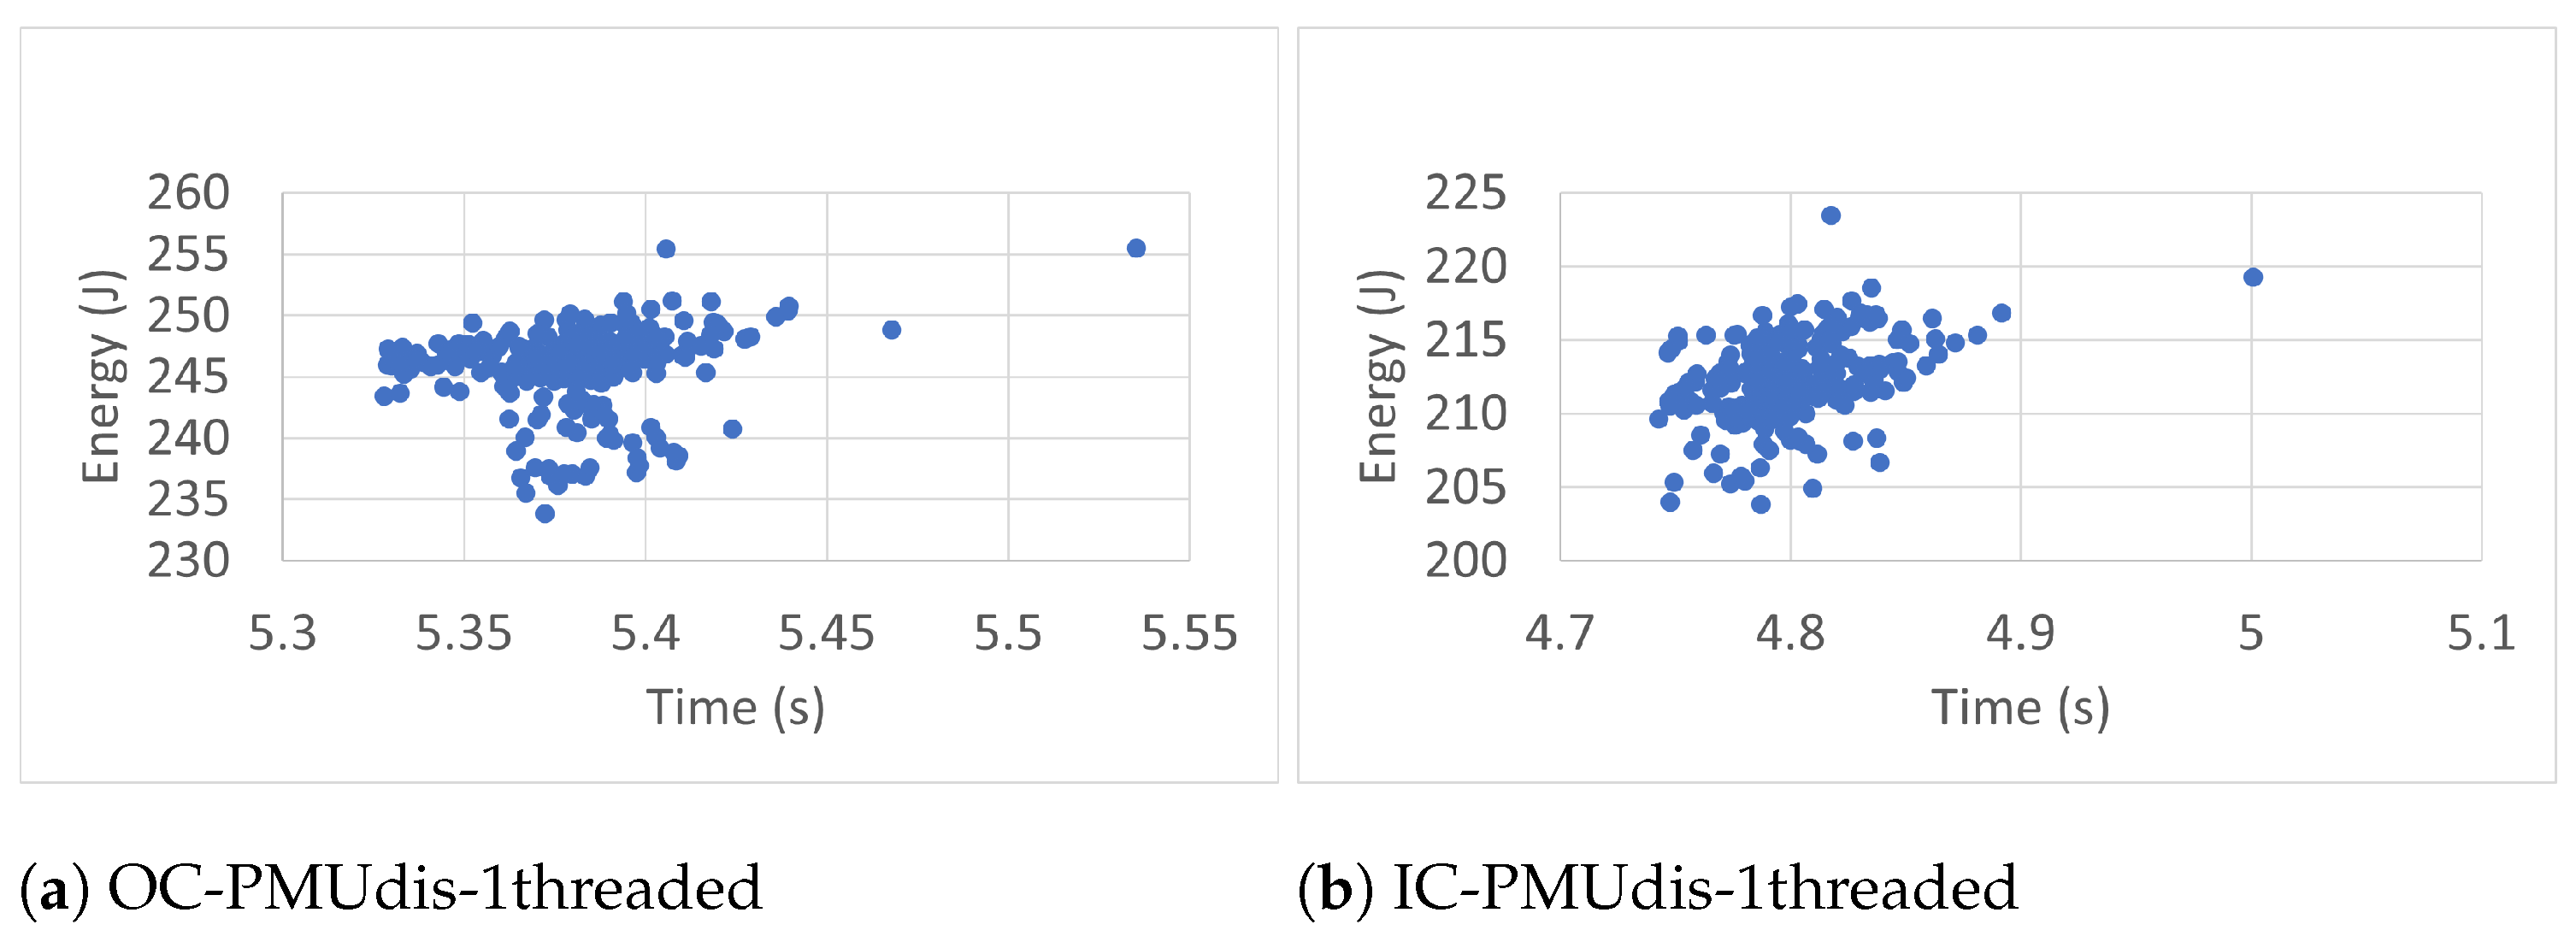
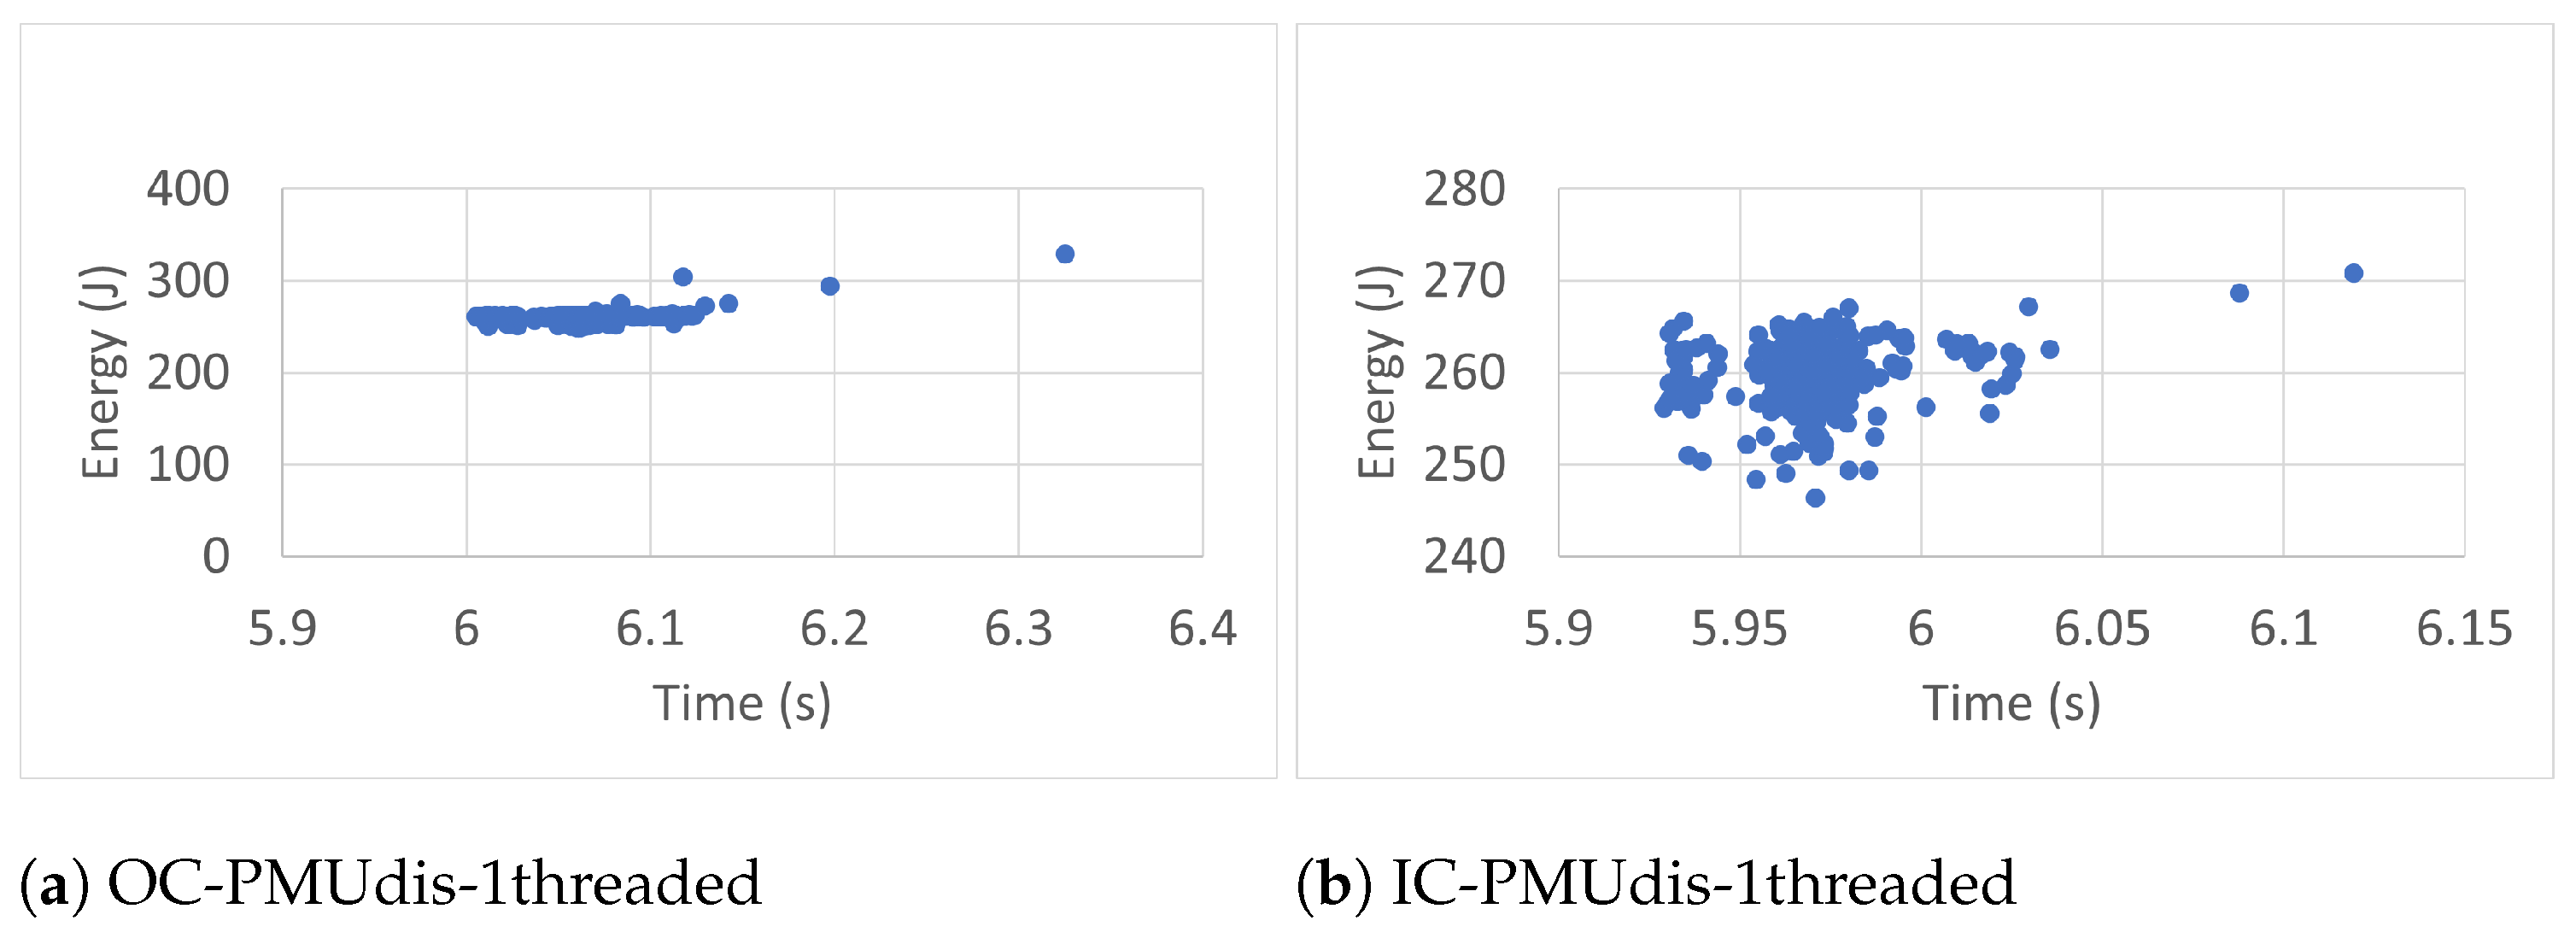
6.2. Measurement Accuracy
To estimate the accuracy of the measurements of the RAPL energy readings (300 readings), we studied time–energy scatter plots of all readings taken in the different conditions. The scatter plots, shown in
Figure 7,
Figure 8,
Figure 9,
Figure 10,
Figure 11,
Figure 12,
Figure 13 and
Figure 14, were used to visualize the relationship between the energy and time variables and the resulting patterns. They display every RAPL reading pair (time, energy) as an individual dot on the graph, with the time variable plotted on the horizontal axis and the energy variable plotted on the vertical axis.
Every plot caption describes the case in which the RAPL readings were collected. For instance, the caption Blackscholes-IC-PMUdis-2Threads refers to the scatter plot of the 300 readings taken for the Blackscholes benchmark inside a docker container (IC) when the Power Management Unit was disabled (PMUdis) and the number of threads was two.
To facilitate the comparison of the different cases,
Figure 7,
Figure 8,
Figure 9 and
Figure 10 represent the scatter plots of the four benchmarks’ RAPL readings taken when the PMU was disabled. Every figure, in turn, is subdivided into six scatter plots arranged horizontally according to the number of threads and vertically according to whether the benchmark was run outside or inside the container. When we look at every figure horizontally, we can see the effect of the number of threads on the accuracy of the readings. In most cases, the four-thread plots are more scattered than one- and two-thread cases.
To study the effect of containerization on the scatter plots, one can look at every figure vertically. In some cases, there were similarities between scatter plots of the same number of threads and run outside containers (OC) or inside containers (IC). However in most cases, the scatter plots of IC cases are more condensed than those of OC cases, which represents more accurate RAPL readings inside containers.
Figure 11,
Figure 12,
Figure 13 and
Figure 14 represent the time–energy scatter plots of the four sets of RAPL readings taken in the case of one thread when the PMU was enabled, where every figure has two subfigures according to whether the readings were taken when the workload was run outside or inside the container.
In general, when the PMU is enabled, the scatter plots are more chaotic because of the dynamic control that the PMU applies to the CPU power, which may differ from one run to another, affecting, in turn, the accuracy of the measurements. As the figures show, the scatter plots tend to have more than one cluster. This tendency makes taking the average of the measurements inaccurate. So, it is good practice to turn off the PMU when we want to take the average of the energy measurements to compare two or more codes from an energy perspective.
The characteristics of the workload may have a significant impact on the RAPL readings’ accuracy. It is essential to consider the specific software characteristics and their effects on power consumption to obtain accurate and meaningful power consumption measurements using RAPL. One of these characteristics is the type of instructions executed within a workload, which impacts repeated RAPL readings. For instance, complex instructions involving intensive calculations or data manipulations tend to consume more power when compared to simple instructions. Consequently, the repeated execution of workloads with computationally complex instructions may result in higher average power consumption, which can be reflected in the RAPL readings. Another example of the impact of workload characteristics is the number of branch instructions in the workload. The outcome of a branch instruction determines which code path is executed next, potentially leading to different computational demands. Workloads with more branch instructions may exhibit more diverse execution patterns, resulting in varying power consumption levels and potentially impacting the accuracy of RAPL readings. Additionally, branch instructions can disrupt the instruction pipeline, impacting the efficiency of instruction fetching and execution. Mispredicted branches can lead to pipeline stalls and cache flushes, affecting the overall power consumption. Branch-heavy workloads may experience more frequent pipeline stalls and cache invalidations, potentially influencing the RAPL readings.
7. Experiences and Recommendations
Extensive experimentation provided valuable insights into both the environment and the measurement process. This section outlines the most important observations and recommendations based on lessons learned during the investigation.
The readings seem sensitive to the benchmark programs used for measurement. Researchers should be mindful of this point when devising ways to use RAPL to quantify branch prediction behaviors. In particular, previous work established that branch prediction schemes showed program sensitivity [
41]. Therefore, researchers should choose their test workload carefully to be able to discern behaviors due to branching from artifacts due to measurement.
Running software inside a container (e.g., the Docker container) may show savings in RAPL energy readings despite the slight increase in the other event counts. The apparent savings may be a result of including the libraries within the lighter-weight environment. Containers are lighter versions of full virtualization. They are also perhaps lighter than running directly under the OS. Containerization seems to reduce environmental noise levels, which is conducive to the purposes of experimental studies. However, the effect of software containerization on energy consumption needs further investigation with more containers to confirm it.
Taking the average of many measurements of RAPL tends to be more accurate. However, increasing the number of readings beyond some point does not contribute to the accuracy. Instead, an enormous number may worsen matters due to the accumulative thermal effect.
RAPL measurements are not very sensitive to the computer’s ambient temperature. However, a good practice is to keep it consistent at a moderate level during RAPL reading collection.
Running software with multithreading has a positive impact on energy consumption and performance. However, measuring the average of RAPL readings with one thread seems to be more accurate when comparing two or more pieces of code from an energy perspective.
Compiler optimization has a measurable impact on RAPL readings. The experimental results show that compiling software with O0 optimization (no optimization beyond a conservative default set) always leads to the highest energy consumption. With the other levels, the results show that more optimization is not always better for time and energy savings. However, to compare the energy consumption of two or more pieces of code without the unpredictable effects of the modifications typical of optimizing compilers, skipping them may be good practice. This should help better understand the root causes of efficiency.
Internal power management had a positive impact on power savings. However, our experimental results show that enabling the PMU harmed the accuracy of RAPL readings. This impact was probably due to the effects of the dynamic control of the PMU on CPU power, which changed from one run to another. So, it is perhaps good practice to disable the PMU from the BIOS before taking RAPL readings.
8. Conclusions
In computing systems, power/energy efficiency has become a crucial concern in the last few decades because of the various issues that require meeting a number of requirements, such as lowering the environmental footprint, relieving the constraints on computing devices’ scalability, prolonging the life of computing energy storage devices, reducing the cost of the electricity bill, and many other factors, including those related to security. Jointly enhancing the quality of hardware and software together can help achieve efficiency targets in these areas.
Some researchers were motivated by the need to reach exascale within reasonable power budgets. They investigated fundamental software building blocks, such as sorting and matrix multiplication, commonly used in HPC. In this study, the authors investigated a similar approach to the DBP as a major hardware component in modern CPUs in an attempt to quantify its impact on power and energy efficiency. This paper focuses on the long and tedious work undertaken to understand the issues involved and to develop the methodology to reliably estimate the power consumed by the DBP and its various aspects. It could also serve as a blueprint for similar investigations targeting other hardware building-block components.
RAPL is a helpful power measurement tool that can credibly replace external hardware power measurement devices that are difficult to manage and lack granularity. This paper introduces the methodology used in our investigation and the various factors that can affect the accuracy of RAPL measurements that inherently add noise to RAPL readings. To make RAPL more accurate and reliable, several measures that diminish or eliminate measurement noise sources are discussed in detail and supported by extensive experimentation. This included practical RAPL experiments with four benchmarks that showed the effects of various hardware and software controls, such as processor power management, threading, containerization, and compiler optimization, on the RAPL readings. The techniques and experiences described may also extend to other processor platforms that offer similar internal instrumentation and interfaces, such as those offered by AMD.
A limitation of this study is its focus on Intel CPUs, which somewhat restricts the applicability of some of the findings to other CPU platforms, such as AMD, or architectures, such as ARM. Different CPUs may have distinct power characteristics and management mechanisms. Modern ones may have better measurement capabilities based on higher-resolution instrumentation. All of these factors could influence the reliability of RAPL-like readings in those systems for purposes of empirical study. Future studies should consider expanding the investigation to encompass a broader range of CPUs to provide a more comprehensive understanding of the effectiveness and limitations of RAPL-like tools for reliable empirical power assessment. Finally, to confirm the finding about the effect of containerization on the quality of measurements, future studies may be needed on more containerization technologies other than Docker, such as Kubernetes.


