Abstract
The United States has had more mass shooting incidents than any other country. It is reported that more than 1800 incidents occurred in the US during the past three years. Mass shooters often display warning signs before committing crimes, such as childhood traumas, domestic violence, firearms access, and aggressive social media posts. With the advancement of machine learning (ML), it is more possible than ever to predict mass shootings before they occur by studying the behavior of prospective mass shooters. This paper presents an ML-based system that uses various unsupervised ML models to warn about a balanced progressive tendency of a person to commit a mass shooting. Our system used two models, namely local outlier factor and K-means clustering, to learn both the psychological factors and social media activities of previous shooters to provide a probabilistic similarity of a new observation to an existing shooter. The developed system can show the similarity between a new record for a prospective shooter and one or more records from our dataset via a GUI-friendly interface. It enables users to select some social and criminal observations about the prospective shooter. Then, the webpage creates a new record, classifies it, and displays the similarity results. Furthermore, we developed a feed-in module, which allows new observations to be added to our dataset and retrains the ML models. Finally, we evaluated our system using various performance metrics.
1. Introduction
The non-profit Gun Violence Archive [1] reported that every day, there are 100 people who are victims of gun violence, and around 250 more people are shot and wounded in the US. For instance, there were more than 600 mass shootings in the US in 2022. The consequences of mass shootings persist far beyond these losses. It changes the lives of many people who witness it and live in fear of the following shooting [2]. Therefore, there is an increasing social need for creating efficient technological techniques to mitigate mass shootings [3].
One way to mitigate mass shootings is to identify prospective mass shooters by studying their current psychological, criminological and sociological behavior before committing a crime. Mass shooters usually have criminal and violent records, trauma, harmful childhood experiences, aggressive school performance, and threat levels on social media. Unlike other types of gun violence, mass shootings require planning, acquiring an automatic gun, and identifying the target victims based on location, race, religion, etc. [4]. Furthermore, it was found that 44.3% of mass shooters had leaked their plans before committing the act with friends or relatives or posting it via social media [5].
With the advancements of machine learning (ML) [6,7,8], it is feasible to perform a risk assessment of potential shooters using their psychology and criminology factors to predict the likelihood of different types of violent offenses they may commit in the future [9,10]. Law enforcement and preventive social services can use such predictive risk assessment tools to identify prospective shooters and consequently prevent a mass shooting from happening in the near future.
This paper presents an ML-based risk assessment system that can predict a person’s tendency to become a mass shooter. Two ML models are trained, local outlier factor (LOF) [11] and K-means clustering [12], with a dataset of previous shooters that includes information about their demographical, psychological, criminological and sociological records. System users can calculate the risk of a new individual’s record of being a mass shooter via a GUI-friendly interface by computing the probabilistic cosine similarity between the new record and previous shooters in the dataset. In addition, a feed-in module is developed to allow systems users to add new records into the dataset and retrain the ML models with the new data.
We collected a database of nearly 180 mass shooters containing 106 features about these attackers. First, we reduced the number of features from 106 to 28 by applying the random forest algorithm, feature correlation, and feature dependency models to filter redundant and highly correlated features. Then, we used the resulting 28 dominating features to train our ML models. We classified the 28 features into 4 clusters representing previous mass shooters’ psychological, criminological, sociological, and social media behavior.
The remainder of the article is arranged as follows: Related work is presented in Section 2. The system design and implementation are presented in Section 3 and Section 4, respectively. Section 5 presents the experimental evaluation of the risk assessment system using various performance metrics. The conclusions and future work is presented in Section 6.
2. Related Work
In the US, mass shootings have received much attention in the last decade due to their increasing death toll and comprehensive media coverage [1,3,13,14,15]. To the best of our knowledge, the existing studies in psychology and criminology on risk assessment of mass shootings focused on a particular incident [2], identifying future shooting victimization [16], studying the social media contagious effect on gun violence [5,17], or modeling stress that leads to gun violence [18].
VOID (Violent Offender Identification Directive) [4] is a tool for assessing gun violence risks created by a police department to specify criminals likely to be implicated with gun violence in the future. VOID uses a historical dataset of 200,000 previous criminals who committed gun violence by December 2012 and predicts 103 persons engaged in gun violence during 2013. The tool assigns different weights to each case selected ad hoc by crime experts in the police department. Compared to the optimized logistic regression and generalized boosted models, VOID performed good prediction accuracy in identifying individuals involved with gun violence.
Heller et al. [16] used an ML model to predict the risk of a victim being shot in the near future. A victimization dataset of 644,000 records from the Chicago Police Department was used to train and test the ML model. Out of 500 people at the highest predicted risk, the model achieved a 13% success rate in predicting victims who were actually shot during the following 18 months.
Social media’s contagious impact on mass shootings using ML was studied in [5]. This study aims to predict the change in users’ attitudes on Twitter toward mass shootings over time. Three ML models have been used to predict and classify mass shooting tweets: logistic regression, support vector machine, and optimized deep neural networks based on an improved particle swarm optimization algorithm. The experimental analysis demonstrated that the ML models could forecast future mass gun violence using the sentiment analysis results of the tweets dataset.
Stress can be considered one of the most commonly recognized reasons for deteriorated academic performance and student retention, and it can even lead to violence among college students. Saha et al. [18] tried to leverage social media as a passive stress detector in universities and colleges after a gun violence event. The authors collected a dataset consisting of social media posts on Reddit from 12 US colleges and universities which were affected by gun violence between 2016 and 2016. This dataset was used to train an ML classifier to predict the stress level among college students after committing gun violence.
The mass shooting tragedy in Sandy Hook elementary school (Connecticut, US) in 2012 received unprecedented coverage from both public and social media. Varghese et al. collected over 700,000 tweets from people in the US about this incident [2]. The tweets’ dataset was used to train various ML models, including random forest, bagged tree, boosted tree, and support vector machine, to analyze the anti-gun and pro-gun sentiment in different states in the US. It was found that both the anti-gun and pro-gun opinion rates were high on the incident day; however, anti-gun sentiment fell behind after a few days, while the pro-gun sentiment remained elevated for longer.
3. System Design
Figure 1 illustrates the runtime environment for the risk assessment system for predicting future mass shootings. The system is distributed with components running on the user side and cloud servers on the server side. At the front end, the user can interact with the system conveniently via a web-based GUI implemented using the Flask framework [19]. Users can feed in the system with new mass shooting incidents through a customized API, which updates the dataset and retrains the ML models. At the back end, when a new user request arrives, the system uses the ML models to predict the similarity between the new and previous cases stored in a MySQL database.
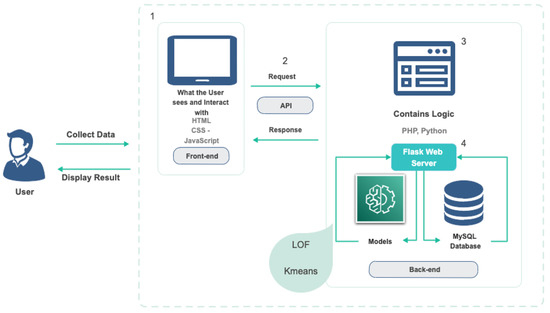
Figure 1.
System architecture.
3.1. Dataset
We created a dataset that consists of 180 cases of previous mass shooting cases with dates from 1966 to 2022. We collected the dataset from various sources, including the Gun Violence Archive [1], Kaggle [20], and Google Web Scraper [21]. Each record contains 106 features about the shooter, incident information, victims, etc. The police investigations and incident witnesses obtained these extensive features.
Table 1 shows the dataset attributes grouped into eight categories, which describe the crime location, the shooter’s background information, and criminal and violent history. The dataset also includes information about any adverse childhood experiences of the shooter, such as bullying at school, parental separation or divorce, the suicide of a parent, childhood trauma, physical or sexual abuse, and childhood socioeconomic status. In addition, the shooter’s physical and mental health issues were considered, including hospitalization for psychiatric reasons, autism spectrum disorder, and substance use and abuse.

Table 1.
Dataset Attributes. The attributes annotated with * are selected for training the ML models.
The grievance and motivation for the crime are essential factors for committing a mass shooting. We included information about known prejudices, such as racism, misogyny, homophobia, and religious hatred. Regarding crime motivations, we considered any employment, economic and legal issues, relationship problems, interpersonal conflict, and fame-seeking motives.
Feature Selection
We used several mechanisms to select the dominant features and eliminate redundant and irrelevant ones to classify results better. First, we eliminated some attributes with zero dispersion and those with the same value across all records. Then, we applied a coefficient correlation between all the remaining attributes to find the strong positive correlations between the feature pairs to eliminate them. Figure 2 illustrates the correlation matrix between all feature pairs with heatmap, which is a symmetrical matrix with all diagonal elements equal to +1.
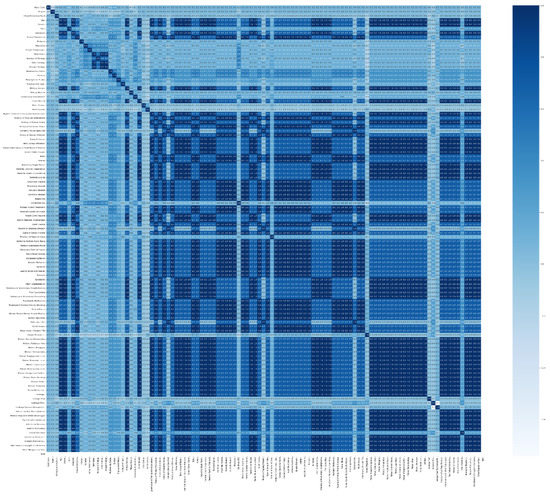
Figure 2.
The correlation matrix of all attributes before feature selection.
A correlation matrix is a powerful tool to summarize a large dataset and to identify and visualize patterns in the given dataset. The correlation values are between −1.0 and +1.0. The +1.0 means that a strong positive correlation exists between a given feature pair colored dark blue, while −1.0 indicates that the features have a strong negative correlation colored light blue. The dark blue indicates that a feature pair is highly correlated and should be eliminated from the dataset. We filtered out features with a threshold of 0.85 and upward.
Next, we used the random forest model to validate the output of the correlation matrix. We applied the Boolean RandomForestClassifier from the SelectfromModelclass on each attribute. The true output means that the feature is significant for training the ML models, while the false output means we can discard it. Table 1 shows the final selected 28 prominent attributes annotated with * for training the ML models. Figure 3 shows the correlation matrix between the selected 28 feature pairs with a heatmap. As shown in the figure, all attribute pairs are less correlated.
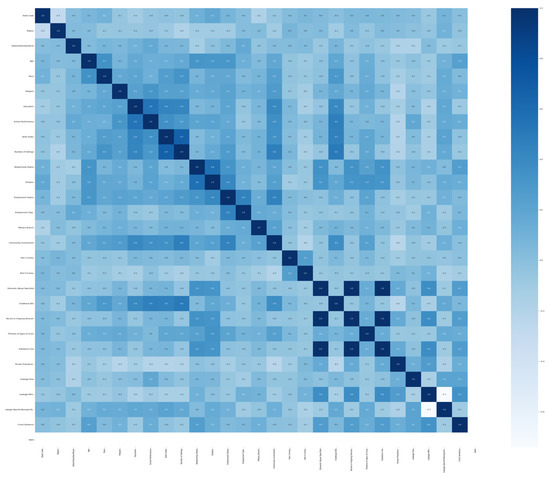
Figure 3.
The correlation matrix of the selected attributes.
The dataset has seven multidimensional compound attributes listed in Table 2. These features have different possible values for each record in the dataset. To normalize the effect of these features when training the ML models, we applied the weight for each potential value as indicated in Table 2. If the case has multiple values applicable, we incremented the weight scores accordingly.
Table 2.
Compound Attributes Weights.
3.2. ML Models
Given that our risk assessment system is considered a one-class classification problem, we trained the ML models with the previous mass shooting records only, which are called normal data samples. The goal of each ML model is to classify the new data as outliers or normal points. A one-class ML model targets to capture the training samples’ characteristics to differentiate between them and any possible outliers to emerge.
3.2.1. Local Outlier Factor (LOF)
LOF is an unsupervised ML model that calculates the deviation of the local density of a data sample regarding its neighbors [11]. LOF is usually used for anomaly identification, where samples with significantly lower densities than their neighbors are regarded as outliers.
The number of neighbors that the LOF considers in its calculation is denoted by parameter k. LOF looks at the k neighbors of the test sample to calculate its density and compares it to the other samples. Selecting the correct number k is problem specific, determined by a trial-and-error manner. While a small value of k has a more local emphasis, selecting an immense value of k can miss local outliers.
K-distance, , is the distance between the test point, and its K-th nearest neighbor. includes a set of data points that lie inside or on the circle of radius K-distance. The reachability distance (RD) is calculated as the max of K-distance of and the distance between and , as follows:
where the D measure can be the Euclidean, Manhattan, or cosine similarity depending on the problem characteristics.
The local reachability density (LRD) calculates how far A is from the nearest cluster of K-th points. LRD is defined as the inverse of the average RD of the test point X from its K-th neighbors, as follows:
LOF is the ratio of the average LRD of the K-th nearest neighbor of X to the LRD of X, which is formally defined as
The LOF model produces a score that tells how likely a specific data point is an outlier/anomaly, as follows:
3.2.2. K-Means
K-means clustering is an unsupervised ML model that can make inferences from an unlabeled dataset [12]. K-means groups similar data points together in clusters to discover underlying patterns for classification and regression. Like LOF, K-means needs a fixed number k of clusters in the dataset before training the model. The model calculates a centroid for each cluster representing its center. In other words, there are k centroids in the dataset, where each data point is associated with a single centroid.
Once we initialize the clusters’ centroids, each data point is assigned to the closest centroid . Then, we calculate the distance between and centroid using the Euclidean distance metric, as follows:
The efficacy of the K-means clustering model depends on selecting the optimal value of k. A small number of k may lead to underfitting the model, while choosing a significant number of k may lead to overfitting the model. A set of controlled experiments was conducted to estimate the value of k to enhance the performance in terms of both classification accuracy and processing time. We tried random k numbers progressively until we reached acceptable results. We used cross-validation and Gaussian mixture optimizers to calculate the model’s best hyperparameters.
4. Implementation
This section presents the implementation details of the ML models and the web-based GUI.
4.1. ML Models
We split the dataset into two subsets: training and testing. We used 126 records for training and 55 records for validation and testing both LOF and K-means clustering models. The number of records in each phase was determined based on the fine-tuned hyperparameters and the structure of the ML models.
The LOF and K-means models are implemented using the Google Colab development environment [22]. Colab is a web-based open-source neural network (NN) library implemented in Python. TensorFlow [23] is the backend NN engine of Colab. Colab libraries executing on TensorFlow make it reasonably straightforward for developers and researchers to create and train ML models using Python. The training phase for each model ran on a cloud server computer equipped with TPU and CUDA GPU capabilities, allowing us to train our multi-dimensional dataset quickly.
The training phase involved running 30 epochs on both models in around three hours. We captured the current state of the trained weights every five epochs to monitor the training progress. The following equation was used to calculate the training loss and error:
where E is the mean square error of the model, a is the classification output calculated by the model, and b is the actual value. E represents the classification error.
We carried out some experiments to figure out the optional hyperparameters to be used in the LOF model. We found that the optimal number of neighbors k is 20, the novelty parameter is set to true, and the weight parameter is set to distance. Figure 4 illustrates the neighbor density of the LOF clusters.
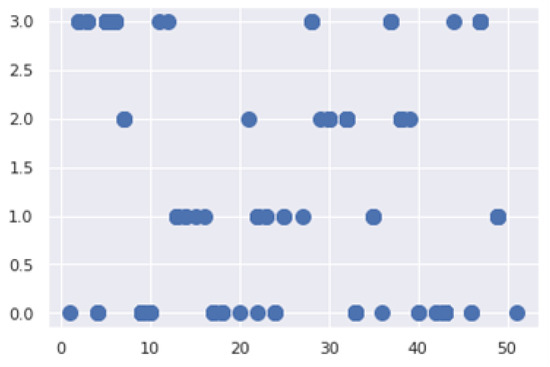
Figure 4.
The LOF clusters’ density.
We used the Gaussian mixture model [24] to determine the number of clusters k. We found that the optimal number of centroids k is 4 and the distance method is Euclidean/cosine similarity. During the training phase, the E value decreased consistently in the thirty epochs, while the classification accuracy increased. Both models converged behind the 25th epoch. This means that the selected fine-tuned parameters and the transformed dataset fit the models well.
4.2. Web-Based GUI Implementation
The GUI was implemented as a mobile-enabled and reactive web app to enhance the system’s user experience. The web application was developed using HTML5, CSS3, JavaScript, Python Flask Framework, and JSON. The website was built to be device-agnostic, which can enable visitors using mobile phones, PCs, or smart TVs to visit the website.
To execute the web-based GUI on top of the LOF and K-means models, we wrapped the models, created using Colab, as a REST (representational state transfer) API utilizing the Flask framework. REST is a software pipeline that facilitates communication and interoperability between heterogeneous software systems communicated through the internet. The REST API coordinates the communication between Colab and Flask. For instance, when the system user enters a new mass shooting record, Flask utilizes the POST procedure to send the data point from the user side to Colab via an HTTP header. The web application can be accessed by the web server’s IP address and port number without an extension: http://127.0.0.1:5000.
Figure 5 shows the homepage of the web application, which includes three steps for users to enter a mass shooting record. In step 1, the user is asked whether the new record has already committed a mass shooting. If the answer is yes, the new case will be fed into the system and added to our dataset. Both ML models will be retained with the new record in the background.
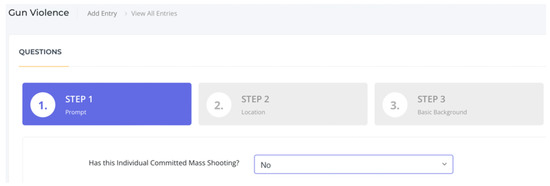
Figure 5.
A screenshot of the user interface: step 1.
As shown in Figure 6, step 2 collects background information about the prospective shooter, including age, race, employment stats, religion, the highest level of education, military training, etc. These data are required for the inference process of the ML models.
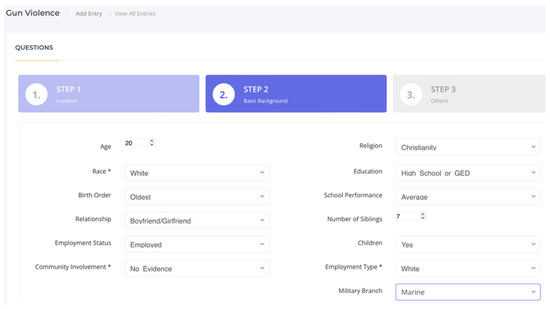
Figure 6.
A screenshot of the user interface: step 2.
Figure 7 illustrates the step 3 screen that allows users to select the values of the compound attributes, including part 1 crimes, part 2 crimes, substance use and abuse, childhood socioeconomic status, leakage who, etc. The system assigns weights to any compound attribute selected, as discussed in Section 3.
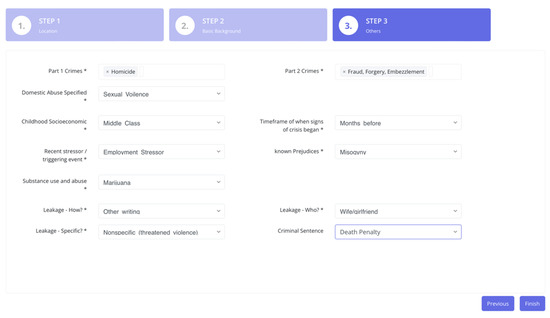
Figure 7.
A screenshot of the user interface: step 3.
5. Experimental Evaluation
This section presents the experimental evaluation of the risk assessment system regarding performance and classification accuracy.
Figure 8 illustrates an example of the inference result of the LOF model. The figure shows that the GUI compares the closest three cases to the prospective shooter’s case. The attributes highlighted in the green background are identical for the two records. The model achieved an accuracy range between 66.78% and 78.24% similarity levels between the test case and the dataset.
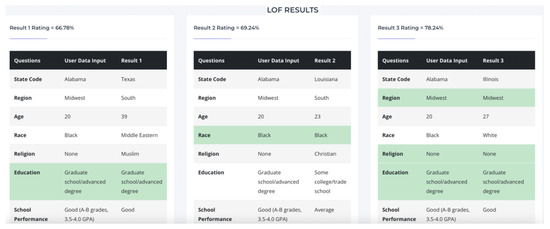
Figure 8.
A screenshot of the classification outputs of the LOF model.
Figure 9 shows another example of the classification outputs of the K-means model. Similar to LOF, the user interface makes a comparison between the user test case and the relative three records in the dataset, usually located in the same K-means cluster. As shown in the figure, the K-means model achieved a slightly better classification accuracy than the LOF model, with an inference accuracy between 77% and 84%.
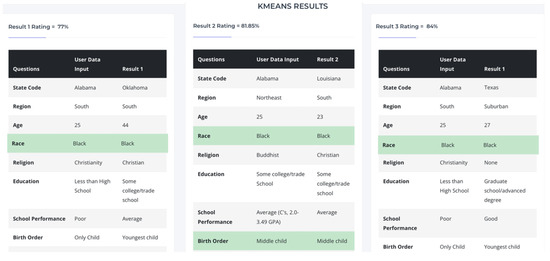
Figure 9.
A screenshot of the classification outputs of the K-means model.
Figure 10 depicts a scatter plot of the LOF performance on an outlier test point. It is clear from the figure that the density of the red point is much smaller than the density of its nearest neighbors, so it is considered an outlier, i.e., . Note that the LOF score of the outlier data point depends on the density of the 20 clusters relative to the distance of the outlier point to the neighbor clusters.
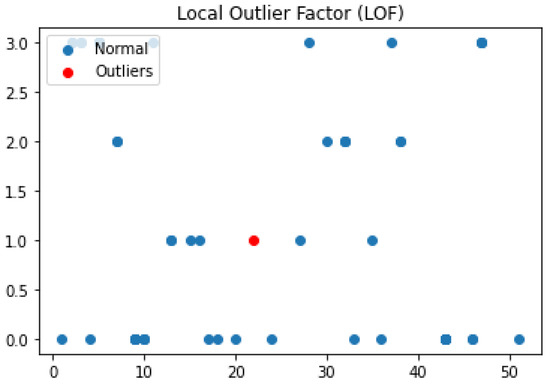
Figure 10.
A scatter plot of the LOF performance on a test sample.
The precision ratio, P, expresses the ML model’s performance for classifying the correct class. It is computed by dividing the true positives (TPs) by the sum of false positives (FPs) and TPs:
In this context, FPs are those individuals who have not been involved in gun violence, but their risk assessment scores are high, predicting that they will most likely become mass shooters in the future. False negatives (FNs) are mass shooters who have already committed gun violence even though their risk scores are lower than those with no gun violence history. TPs are the correct predictions of people involved in mass shootings with high-risk assessment scores. Our models aim to increase the rate of TPs and decrease the rate of FPs.
The recall ratio, R, is computed by dividing the TPs divided by the sum of FNs and TPs:
The precision vs. recall shows the trade-off between the correct predictions of the ML models and the TP rate using various probabilistic thresholds. The recall value represents how many TPs are classified correctly, while the precision value measures the ML models’ positive predictive value.
The general prediction accuracy, A, of the ML models is calculated by dividing the correctly classified records (i.e., the sum of true negatives (TNs) and TPs) by the total number of records (i.e., the sum of FNs, TNs and TPs and FPs) using the following equation:
Table 3 contrasts the LOF and K-means models regarding the prediction accuracy of the 55 testing records. The average prediction accuracy of the LOF model was 89.38%, and the K-means model was narrowly better at 91.24%. The LOF and K-means models’ average prediction time was 43.8 ms (milliseconds) and 411 ms (milliseconds), respectively. The K-means model outperformed the LOF in most cases in terms of classification accuracy, while LOF outperformed the K-means in terms of the prediction time. This is justified by the processing time consumed by the cosine similarity operation in the K-means model.
Table 3.
The average classification accuracy of the LOF and K-means models.
We found that the classification accuracy of several cases (e.g., case # 4, 7 and 10) was 100% using both models. We found that most of these cases share many common attributes, including part 1 and 2 crimes, substance use and abuse, recent stressors and triggering events, and access to assault weapons. This shows that the developed risk assessment system can help mitigate mass shootings if employed by police stations and social council offices across the United States.
6. Conclusions
In this paper, we presented an ML-enabled risk assessment instrument for predicting prospective mass shooters. We created a dataset of 180 mass shooting cases in the US between 1966 and 2022. Each record has 106 attributes about the shooter’s background information, crime and violence history, adverse childhood experiences, and social media use. Interestingly, we found that the traditional hunting states (e.g., Texas, New York, and California) with the highest number of gun owners have the most mass shooting cases in the dataset. We pre-processed the dataset to reduce the number of features from 106 to 28 before training the LOF and K-means models.
The developed prototype showed that police departments and juvenile correctional offices could use the risk assessment tool to predict which individuals may commit gun violence in the near future, which could preclude possible gun violence. A web-based GUI was developed that linked with both ML models to enable system users to use the system conveniently. Several experiments were conducted to evaluate the system’s prediction accuracy and performance. We found that K-means outperformed LOF in classification accuracy, while LOF performed better in classification processing time.
We anticipate that this work will increase the open-source knowledge base in machine learning and gun violence risk assessment by publishing the dataset and source code to the public domain: https://github.com/ahmed-pvamu/Mass-Shooting-Risk-Assessment, accessed on 10 January 2023.
For future work, we are working on generalizing our approach by developing an online API that can be integrated with law enforcement systems to automatically collect and update data about mass shootings. Additionally, we are working on building a web-based dashboard that tracks mass shooting events in the US in real time. Finally, we need to conduct experiments with more massive datasets to study the robustness of our system at an extensive scale and improve classification accuracy.
Author Contributions
Conceptualization, A.A.A.; methodology, A.A.A.; software, N.O.; validation, N.O.; formal analysis, A.A.A.; investigation, N.O.; resources, A.A.A.; data curation, N.O.; writing—original draft preparation, A.A.A.; writing—review and editing, A.A.A.; visualization, N.O.; supervision, A.A.A.; project administration, A.A.A.; funding acquisition, A.A.A. All authors have read and agreed to the published version of the manuscript.
Funding
This research work is supported in part by the National Science Foundation (NSF) under grants # 2011330 and 2200377. Any opinions, findings, and conclusions expressed in this paper are those of the authors and do not necessarily reflect NSF’s views.
Data Availability Statement
The data and source code that support the findings of this study are openly available at https://github.com/ahmed-pvamu/Mass-Shooting-Risk-Assessment (accessed on 10 January 2022).
Conflicts of Interest
The authors declare no conflict of interest.
References
- Gun Violence Archive. Available online: https://www.gunviolencearchive.org/ (accessed on 14 December 2022).
- Wang, N.; Varghese, B.; Donnelly, P.D. A machine learning analysis of Twitter sentiment to the Sandy Hook shootings. In Proceedings of the 2016 IEEE 12th International Conference on e-Science (e-Science), Baltimore, MD, USA, 23–27 October 2016; pp. 303–312. [Google Scholar] [CrossRef]
- Bauchner, H.; Rivara, F.P.; Bonow, R.O. Death by Gun Violence—A Public Health Crisis. JAMA 2017, 318, 1763–1764. [Google Scholar] [CrossRef] [PubMed]
- Wheeler, A.; Worden, R.; Worden, R.; Silver, J. The Accuracy of the Violent Offender Identification Directive (VOID) Tool to Predict Future Gun Violence. SSRN 2018. [Google Scholar] [CrossRef]
- Liu, D.; Sasha Dong, Z.; Qiu, G. Exploring the contagion effect of social media on mass shootings. Comput. Ind. Eng. 2022, 172, 108565. [Google Scholar] [CrossRef]
- Ahmed, A.A.; Reddy, G.H. A Mobile-Based System for Detecting Plant Leaf Diseases Using Deep Learning. AgriEngineering 2021, 3, 478–493. [Google Scholar] [CrossRef]
- Ahmed, A.A. An Actor-Based Formal Model and Runtime Environment for Resource-Bounded IoT Services. Algorithms 2022, 15, 390. [Google Scholar] [CrossRef]
- Ahmed, A.A. A privacy-preserving mobile location-based advertising system for small businesses. Eng. Rep. 2021, 3, e12416. [Google Scholar] [CrossRef]
- Ahmed, A.A.; Echi, M. Hawk-Eye: An AI-Powered Threat Detector for Intelligent Surveillance Cameras. IEEE Access 2021, 9, 63283–63293. [Google Scholar] [CrossRef]
- Ahmed, A.A.; Agunsoye, G. A Real-Time Network Traffic Classifier for Online Applications Using Machine Learning. Algorithms 2021, 14, 250. [Google Scholar] [CrossRef]
- Cheng, Z.; Zou, C.; Dong, J. Outlier Detection Using Isolation Forest and Local Outlier Factor. In Proceedings of the Conference on Research in Adaptive and Convergent Systems, Chongqing, China, 24–27 September 2019; pp. 161–168. [Google Scholar] [CrossRef]
- Likas, A.; Vlassis, N.; Verbeek, J. The global k-means clustering algorithm. Pattern Recognit. 2003, 36, 451–461. [Google Scholar] [CrossRef]
- Guo, L.; Mays, K.; Zhang, Y.; Wijaya, D.; Betke, M. What Makes Gun Violence a (Less) Prominent Issue? A Computational Analysis of Compelling Arguments and Selective Agenda Setting. Mass Commun. Soc. 2021, 24, 651–675. [Google Scholar] [CrossRef]
- Pavlick, E.; Callison-Burch, C. The Gun Violence Database. arXiv 2016, arXiv:1610.01670. [Google Scholar]
- Xue, J.; Chen, J.; Chen, C.; Hu, R.; Zhu, T. The Hidden Pandemic of Family Violence During COVID-19: Unsupervised Learning of Tweets. J. Med. Internet Res. 2020, 22, e24361. [Google Scholar] [CrossRef]
- Heller, S.B.; Jakubowski, B.; Jelveh, Z.; Kapustin, M. Machine Learning Can Predict Shooting Victimization Well Enough to Help Prevent It; Working Paper 30170; National Bureau of Economic Research: Cambridge, MA, USA, 2022. [Google Scholar] [CrossRef]
- Roy, A.; Nikolitch, K.; McGinn, R.; Jinah, S.; Klement, W.; Kaminsky, Z. A machine learning approach predicts future risk to suicidal ideation from social media data. NPJ Digit. Med. 2020, 3, 78. [Google Scholar] [CrossRef] [PubMed]
- Saha, K.; De Choudhury, M. Modeling Stress with Social Media Around Incidents of Gun Violence on College Campuses. Proc. ACM Hum.-Comput. Interact. 2017, 1, 92. [Google Scholar] [CrossRef]
- Flask Framework: A Web-Based Framework Written in Python. Available online: https://flask.palletsprojects.com/en/1.1.x/ (accessed on 9 January 2023).
- Kaggle: Machine Learning and Data Science Community. Available online: https://www.kaggle.com/ (accessed on 9 January 2023).
- Google Web Scraper. Available online: https://chrome.google.com/webstore/detail/web-scraper/jnhgnonknehpejjnehehllkliplmbmhn?hl=en (accessed on 9 January 2023).
- Google Colab Development Environment. Available online: https://colab.research.google.com/ (accessed on 9 January 2023).
- TensorFlow: A Machine Learning Platform. Available online: https://www.tensorflow.org/ (accessed on 9 January 2023).
- McLachlan, G.J.; Rathnayake, S. On the number of components in a Gaussian mixture model. WIREs Data Min. Knowl. Discov. 2014, 4, 341–355. [Google Scholar] [CrossRef]


Disclaimer/Publisher’s Note: The statements, opinions and data contained in all publications are solely those of the individual author(s) and contributor(s) and not of MDPI and/or the editor(s). MDPI and/or the editor(s) disclaim responsibility for any injury to people or property resulting from any ideas, methods, instructions or products referred to in the content. |
© 2023 by the authors. Licensee MDPI, Basel, Switzerland. This article is an open access article distributed under the terms and conditions of the Creative Commons Attribution (CC BY) license (https://creativecommons.org/licenses/by/4.0/).