1. Introduction
Individuals with disabilities constitute one of the populations that are most affected in terms of accessing services such as education, employment, and healthcare [
1]. Governments and organizations around the world are promoting policies and strategies to improve the quality of life for this population. In 2014, the World Health Organization (WHO) established action plans to support people with disabilities by strengthening rehabilitation, assistive technology, assistance and support services, and community-based rehabilitation [
2]. In the matter of motor disabilities, research and development regarding assistive technology, such as active prostheses, can play an important role in reaching these aims. Surface EMG signal processing is crucial in building active prostheses that give users a more realistic experience [
3].
EMG research is being used in different applications, such as in sports medicine for fatigue monitoring [
4,
5,
6], education [
7,
8], human-machine interfaces (HMI) [
9], and clinical applications like diagnosis of neuromuscular disorders, among others [
10,
11]. In the field of prosthetics, pioneering investigations, such as those implemented in references [
12,
13,
14], explored the use of EMG signals and served as a support for many later works, among which the most notable are the Myo Armband [
15], an EMG band of eight channels [
16], prostheses with electro-mechanical designs based on EMG signals, and the EMG band designed by Microsoft with a wireless system based on Zigbee with six EMG channels [
17].
For the classification of EMG signals, a process of the capture and subsequent extraction of features is performed, which can be represented in the domains of time, frequency, time-frequency or space [
9]. Much of the recent research focuses on the development of EMG prostheses based on multi-channel acquisition or high-density measurements [
9,
18,
19,
20]. However, these approaches came with specific challenges: having more channels will result in larger datasets [
21]. Additionally, they will generate more complex configurations, incur higher manufacturing costs, lead to increased energy consumption, reduced efficiency, and pose greater difficulties for users to adapt [
22,
23]. Due to this, the process of signal feature extraction can potentially generate numerous representations. Consequently, this could lead to a decline in the performance of the recognition system [
24]. To cater to these requirements, employing analytical tools for evaluating the extracted information is the appropriate approach. Such tools assist researchers in selecting various features and channels, while also assessing the performance of the algorithms [
25].
Therefore, it is necessary to know a methodological approach that allows a better understanding of features’ behavior. For this, the analysis of the features can be performed using several approaches [
26]. One of these is the filter approach, which allows the creation of information quality coefficients according to their separation, correlation or consistency. In the field of EMG signals, some of these have been the Mahalanobis distance [
27,
28], Bhattacharyya distance [
27,
29], Davies–Bouldin index [
28], Fisher–Markov Selector, and Minimum Redundancy Maximum Relevance [
25].
The second approach is known as Wrapper, and it involves applying an evaluation criterion, a search strategy (exponential, sequential or random), and a stop criterion to discover an optimal subset of features. In the study of biomedical signals, this approach has been utilized alongside techniques like Particle Swarm Optimization [
24,
30], Sequential Forward Searching [
28,
29], and Bacterial Memetic Algorithm [
31], among other methods.
In line with the previously mentioned requirements and methods, this paper combines the simplicity approach with information analysis strategies to develop a real-time intelligent classifier for single-channel EMG signals, employing open-source hardware. In the context of EMG pattern recognition, time-domain signals were employed alongside a feed-forward neural network. Testing was conducted using forearm muscle signals corresponding to the movements of extension, pronation, supination, and flexion.
Machine Learning (ML) techniques have several advantages in various applications, making them ideal for automating complex processes and large-scale data processing. These methods improve accuracy and efficiency in decision-making and are ideal for classification and prediction tasks [
32], as they learn from data and adapt over time. Among the ML methods widely used in the literature are supervised learning, unsupervised learning, reinforcement learning, decision trees, and artificial neural networks (ANN) [
33].
Therefore, in this research we implement ANN because of their usefulness for modeling linear and nonlinear systems, as confirmed by the results obtained in the consulted literature [
11,
13,
20,
34,
35,
36]. Additionally, neural networks have also demonstrated their utility in processing time series for health-related applications. The authors of reference [
37] implemented an ANN for the early prediction of COVID-19 outcomes. The preliminary findings revealed that the ANN accurately predicts intensive care unit hospitalization using only five laboratory indices. Similarly, the researchers in reference [
38] utilized deep learning and ANNs to predict the health of football players, obtaining simulation results that serve as the foundation for data-driven monitoring and training.
Finally, signals were used in time-domain due to the low computational cost that facilitates implementation in low-performance platforms [
10,
13,
19,
39]. In this research, the implementation of the classifier on the Arduino Uno board using neural networks stands out as a significant contribution, with real-time processing supported by execution time calculations. Additionally, the developed user interface is highlighted, enabling the easy training of the ANN.
This paper is structured as follows:
Section 2 outlines the design of the EMG signal acquisition and conditioning device, the database creation process, the proposed analysis strategies, the design of the pattern detection system, and the hardware restrictions for real-time response. The results are detailed in
Section 3.
Section 4 focuses on the discussion of the experiment.
Section 5 describes the conclusions of the investigation.
2. Materials and Methods
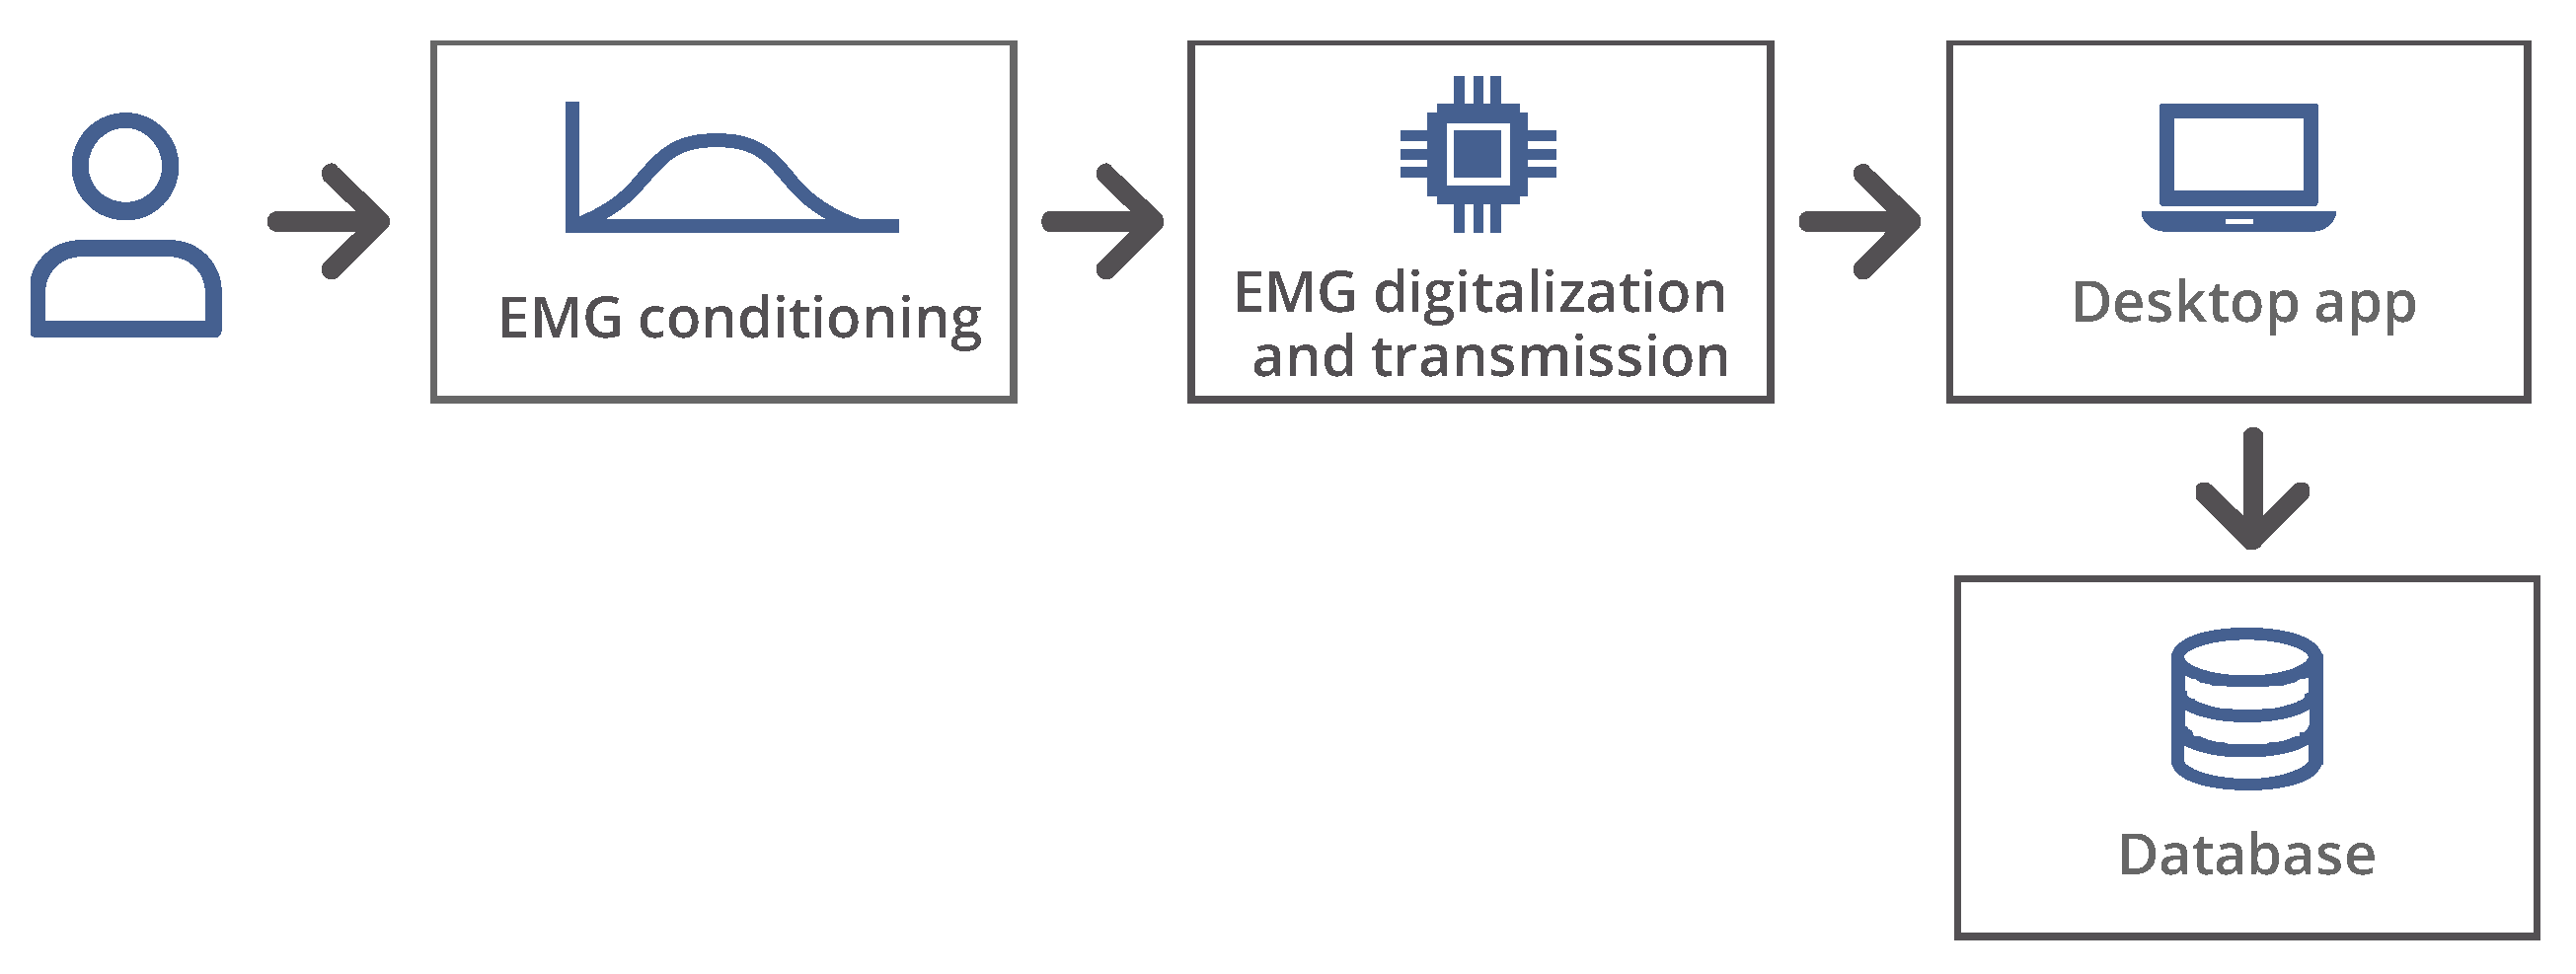
Figure 1 shows the block diagram of the prototype implemented for the EMG signal classifier, which is composed of the general blocks responsible for the acquisition, digitization, and transmission of variables.
2.1. Signal Acquisition
A prototype for the acquisition of EMG signals was designed, which is composed of the pre-amplification, filtering, amplification, and DC offset summing stages (
Figure 2). The input is a differential signal that is connected to terminals 1 and 2. The electrodes have been placed across two different muscle groups. Although SENIAM (Surface ElectroMyoGraphy for the Non-Invasive Assessment of Muscles) recommendations are not strictly followed [
40], some investigations indicate that electrode placement is possible using more than one innervation zone per channel [
9]. Thus, a single channel can contain the group muscle information sufficient for pattern recognition without the need to model a particular muscle [
9,
41,
42]. The filters were designed considering that the frequency spectrum of EMG signal has the most power in the range of 20 to 500 Hz [
4,
43,
44,
45].
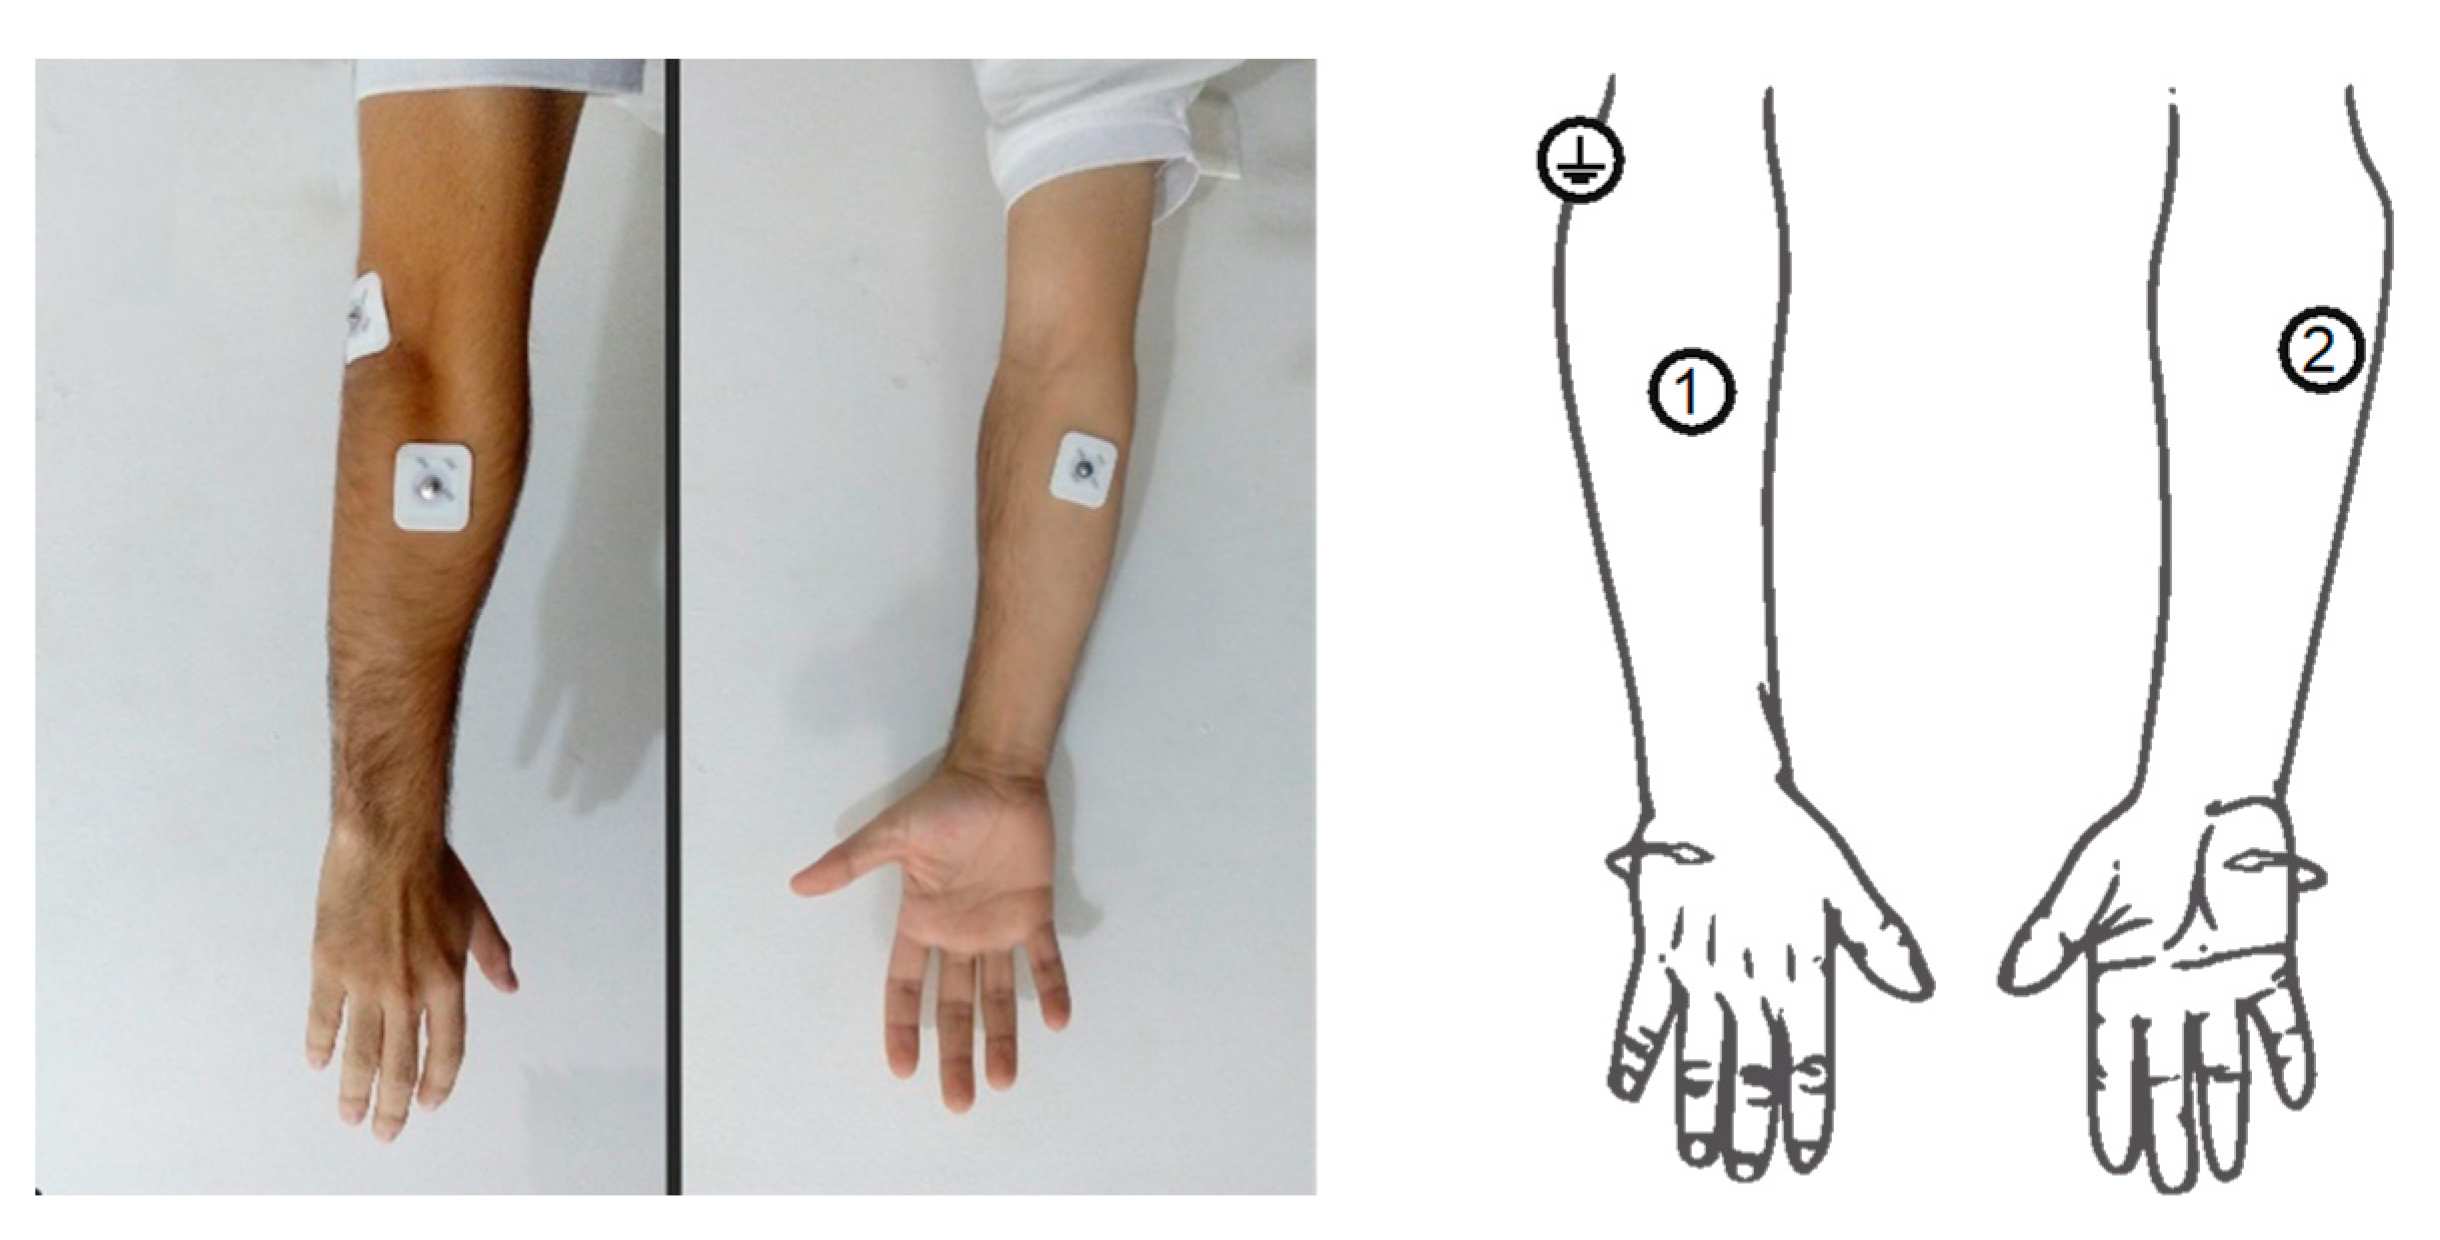
Samples were taken from the right forearm of two test subjects, using a non-invasive technique from 2 electrodes in a differential configuration (1 and 2) and a reference electrode (
Figure 3) [
5,
9,
46]. Electrode positions were strategically chosen based on the muscles relevant to the study and within areas feasible for an individual with transradial amputation [
47]. The 3 M foam monitoring electrodes 2228 were used.
Once the signal was acquired, the samples were digitized using an Arduino Uno board (Single.board microcontroller, Arduino LL, Torino, PIE, Italy) with a sampling rate of 2 kHz and quantization of 10-bit. Serial communication was used between the Arduino and the computer. Based on the literature, it is observed that the signal length can have values between 50 and 400 ms and the sampling frequency can be between 500 and 2000 Hz [
9,
28,
45,
48].
2.1.1. Pre-Amplification
The EMG signal has a maximum level of 10 mV and high levels of noise from different sources. To reduce this noise and increase the amplitude of the signal, the INA128P (Instrumentation amplifier, Texas Instruments, Dallas, TX, USA, EE.UU.) was used, which has a Common Mode Rejection Ratio (CMRR) of 120 dB. Equation (1) was used to set a gain of 10.8 (Rg = 5.1 kΩ).
2.1.2. Filters
To keep only the spectrum components with more information, several studies highlight the need to remove noise from the electrical network using a band-rejection filter, and that most of the power of an EMG signal lies between the range of 20–500 Hz [
4,
39,
40,
41]. Therefore, it was decided to suppress signals below 20 Hz, above 450 Hz, and noise from the power grid (60 Hz). The designs were performed with the UAF42 integrated circuit and Filter42 software [
49].
For the first stage, a 60 Hz notch filter was implemented using a UAF42 configured with the PP4 sub-circuit [
49], using the components described in
Table 1.
For the second stage, a 20 Hz high pass filter with a Butterworth response was implemented, which makes it possible to attenuate motion artifacts [
4]. The filter was implemented from a UAF42 configured with the PP3 sub-circuit [
49].
Table 2 shows the values of the components used.
In the third stage, a 450 Hz low pass filter with a Butterworth response was implemented [
9,
22,
42]. The components used for the PP3 sub-circuit of the UAF42 can be seen in
Table 3.
2.1.3. Amplification
In this stage, the LF353 integrated circuit configured as an inverting amplifier was used. A linear potentiometer was implemented to have a variable gain between 0 and 200. A gain of 50 was used for the experiments (
Figure 4).
2.1.4. DC Offset Summing
For the digitization of the signal, the Arduino board uses an analog–digital converter from 0 to 5 V, therefore, it is necessary to add 2.5 V to the signal.
Figure 5 shows the circuit implemented with the LF353N. In addition, a Zener diode was implemented for stabilization of the reference voltage.
2.2. Experimental Procedure
The experiments were performed with the participation of 2 non-amputated subjects, who previously signed an informed consent. The movements of extension, pronation, supination, and flexion were recorded (
Figure 6).
The session begins with a skin preparation procedure, involving cleansing with alcohol to remove moisture from the skin. A desktop application that communicates with the acquisition system was developed with MATLAB R2023a. The application is responsible for managing data collection during a measurement session with a subject. The session was performed by taking 160 trials of steady-state signals evenly distributed among the 4 study classes (40 trials per movement class). Each movement is requested randomly and stored in the database, resulting in an information structure that is represented in
Figure 7.
The data acquisition was performed according to the session presented in
Figure 8, in which a rest period of ~1.5 s is interleaved with a run of ~6 s. Each run follows the steps shown in
Figure 9.
Speech Cue: a random instruction is presented to the test subject with the 4 possible movements (pronation, supination, flexion, and extension) through an audible signal of ~1.2 s.
Subject Feedback: after the audible signal has been reproduced, the subject performs the movement, maintains it, and instructs the operator to begin the process of recording the trial. This process takes approximately ~2.8 s.
Recording: the signal is recorded with a total duration of 128 milliseconds.
After the acquisition of all the trials, a randomization process was performed in order to eliminate the effects of the capture order in the session.
2.3. Feature Extraction and Analysis
The feature extraction of EMG signals was performed with a time-domain analysis. Features with low computational complexity, and widely used in the state of the art, were preferred [
9]. Eleven features were selected: Integrated EMG (IEMG), Mean absolute value (MAV), Modified Mean Absolute Value 1 (MMAV1), Modified Mean Absolute Value 2 (MMAV2), Simple Square Integral (SSI), Variance of EMG (VAR), Root Mean Square (RMS), Waveform Length (WL) [
13], Zero Crossing (ZC), Slope Signal Change (SSC), and Willison Amplitude (WAMP). The equations of each algorithm are described in reference [
35]. These algorithms assume that the signal is centered at 0 and varies between positive and negative values.
To evaluate the features, two methods are proposed, one graphic and one numerical, which are specified in the following sections.
2.3.1. Numerical Analysis of Discriminative Capacity
An approach is presented to establish the quality of the representation provided by each feature, based on the minimum distance classification method [
50], for which a class separability coefficient was proposed.
Let {
xi(h,k), (
i = 1, …,
nk)} be a set of
nk elements of one dimension, generated by the
h feature from the
xi signal, which belongs to the
k class, where
k = 1, …,
K for each of the
K classes and where
h = 1, …,
H for each of the
H features. Based on this data, the class separability coefficient S
(h) for an
h feature is:
where
mk(h) is the mean of the
k class for an
h feature to evaluate and
m0(h) is the mean of the classes for an
h feature to evaluate:
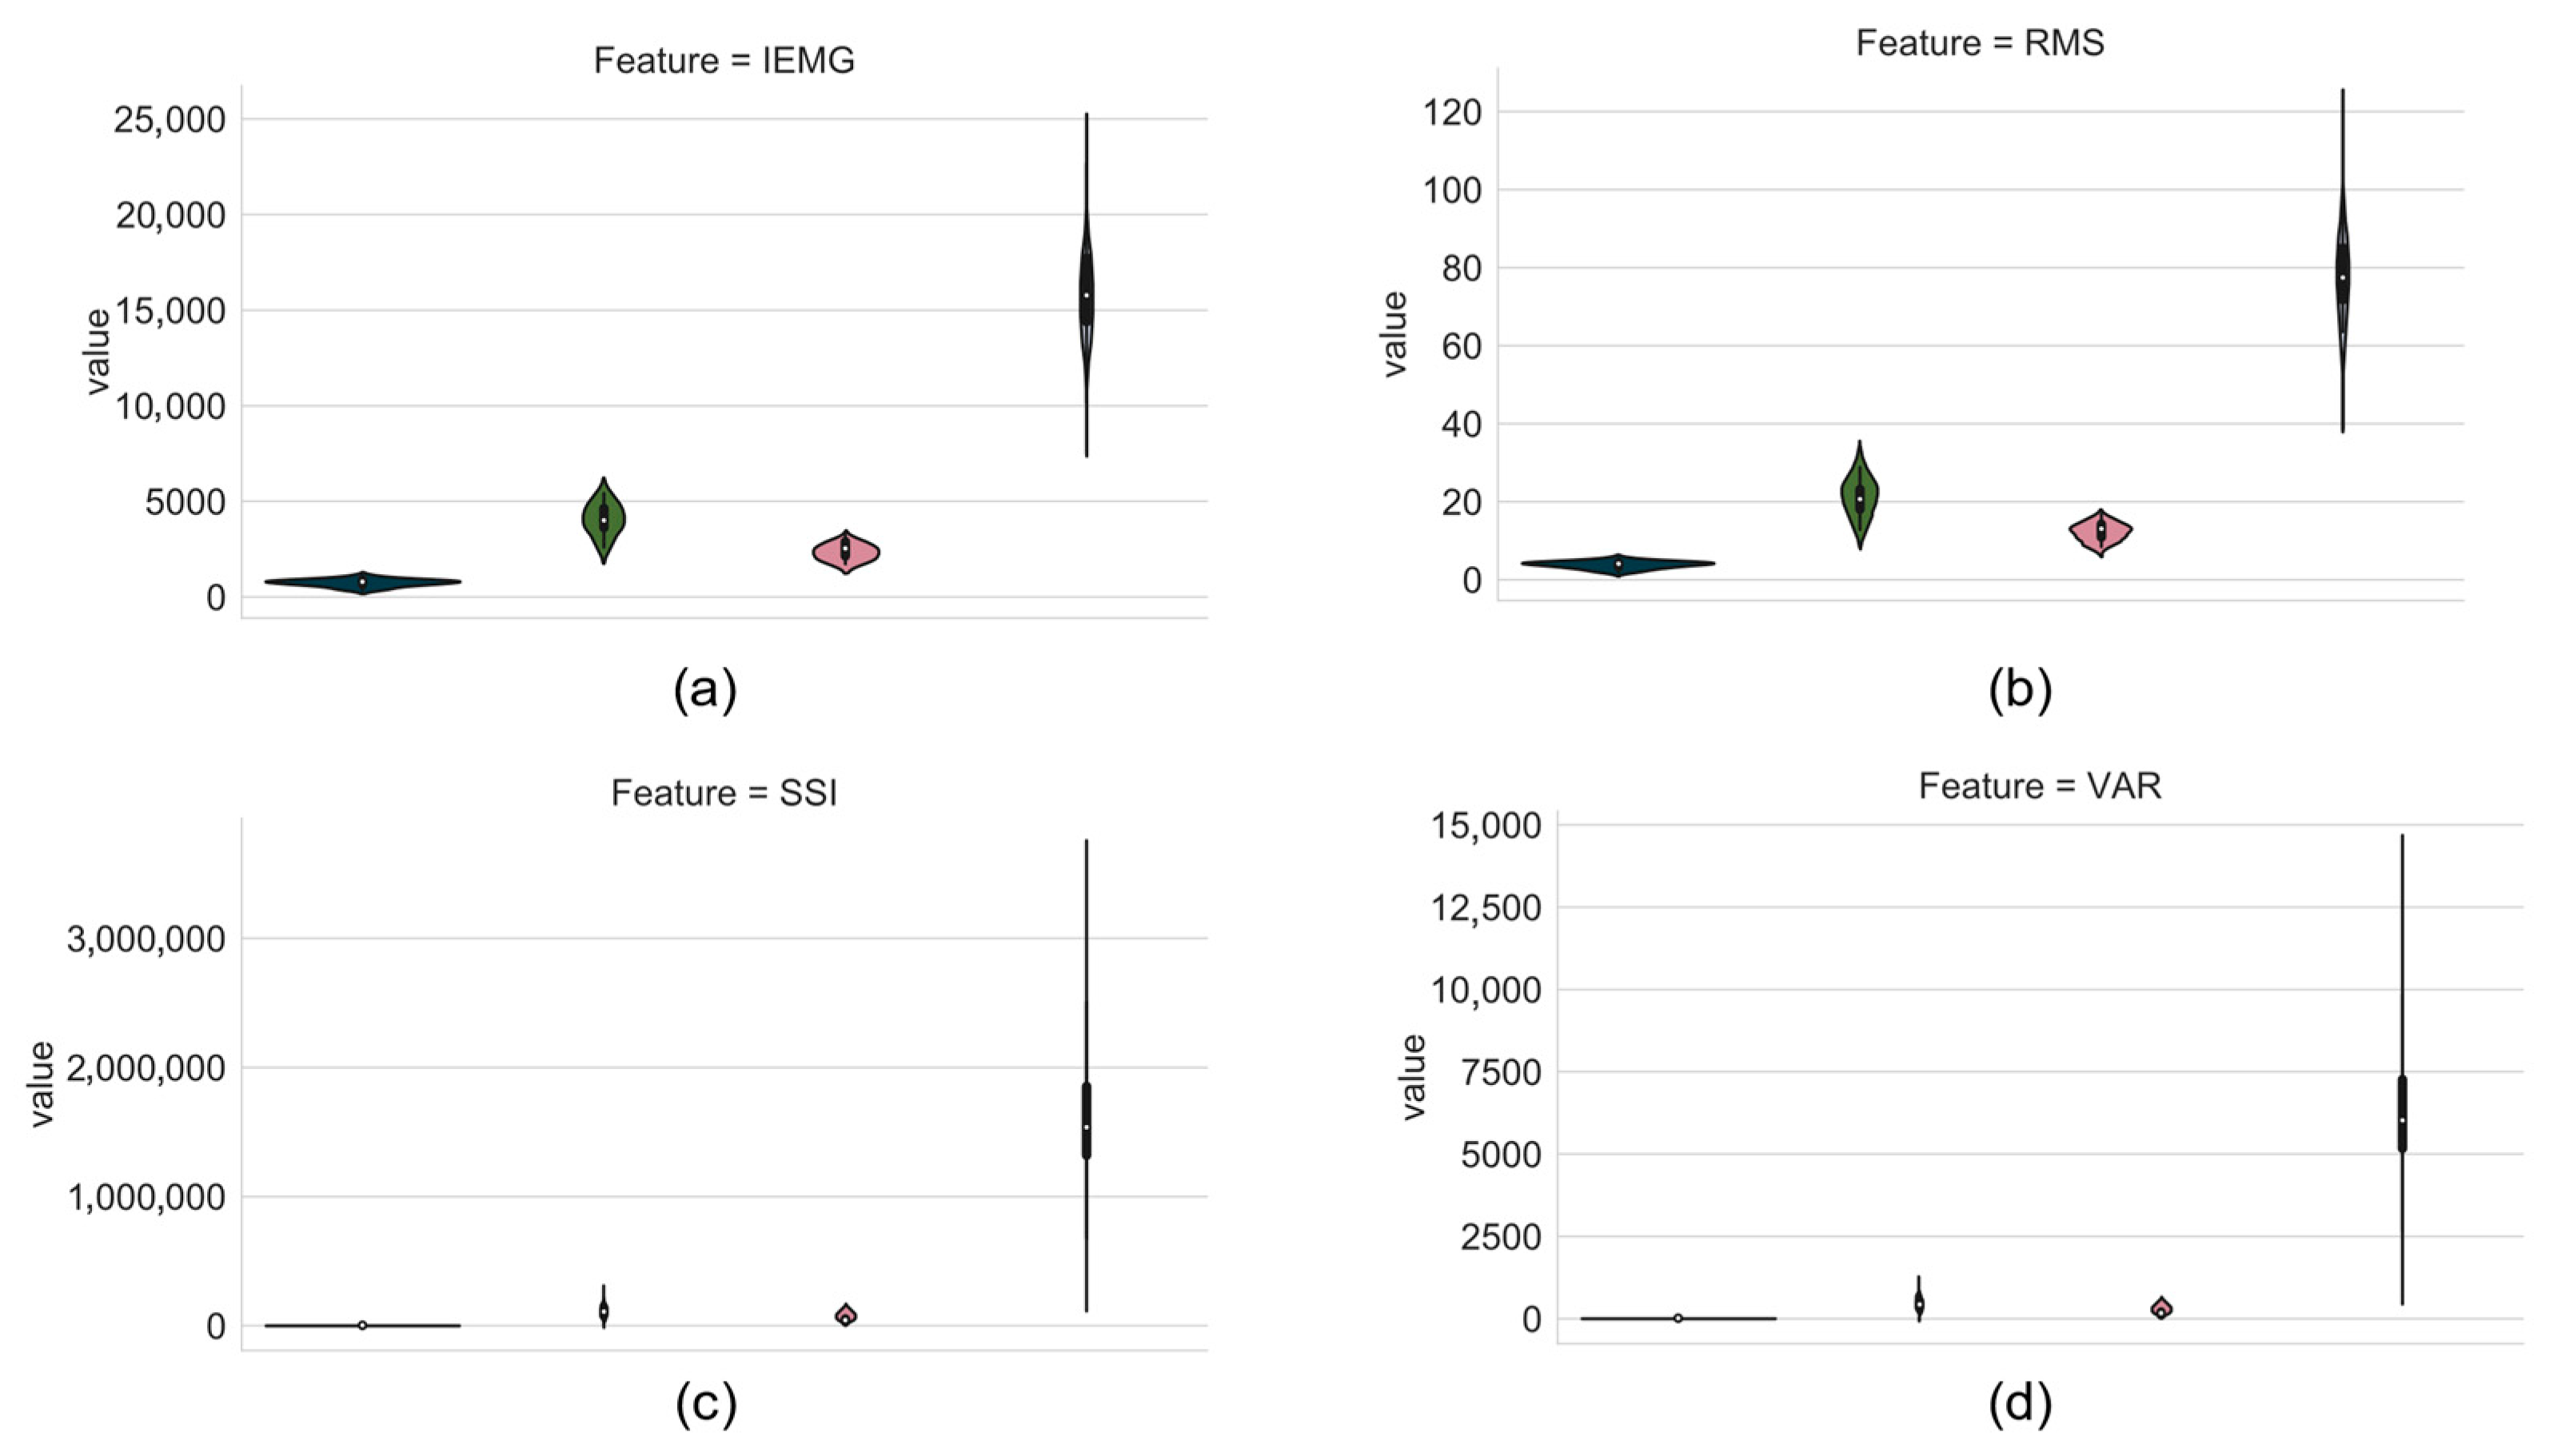
2.3.2. Graphic Analysis of Discriminative Capacity
Anscombe’s Quartet [
51] and Datasaurus [
52], among other data sets, have shown that graphs are a fundamental element in understanding a problem. In order to have an intuitive understanding of the differentiation capacity of each feature extraction algorithm, the data resulting from the algorithms were plotted. For each feature, a chart is made, where the
x-axis represents the movement, and the
y-axis represents the value obtained from the feature extracted. The movements and their associated colors are presented in
Figure 10.
The violin plot method was used to represent the statistical performance of the features. If there is no overlap, with these charts it is possible to intuit the algorithm effectiveness to provide useful representation on the pattern recognition of one or more classes.
2.4. EMG Pattern Recognition System Configuration
This stage is responsible for the configuration of the Electromyographic Pattern Recognition System. From the analysis of the features, four sets were proposed to make the classification.
Full set = IEMG, MAV, MMAV1, MMAV2, SSI, VAR, RMS, WL, ZC, SSC and WAMP.
2.4.1. Offline Training
A three-layer feed-forward ANN, with a sigmoid activation function for their hidden and output layers, was employed for machine learning classification, as depicted in
Figure 11 [
34]. The input layer’s size is the number of features on which the model is being trained (11 input neurons for the Full set, 4 for the Hudgins set, 6 for Subset1, and 3 for Subset2. The hidden layer consists of 6 neurons, and the output layer has 4 neurons, 1 corresponding to each movement to be classified. The model’s predicted class was determined by identifying the corresponding neuron with the highest activation. The system is augmented by the Majority Voting (MV) decision technique to avoid errors in the transient state of the signal [
10,
18,
20]. The ANN was trained offline using MATLAB R2023a and subsequently implemented on the Arduino Uno board (Single board microcontroller, Arduino LL, Torino, PIE, Italy) [
53].
For training the classifier, the information in the database was organized in three segments: Training (60%), Validation (20%), and Test sets (20%) [
54] (
Table 4). Data were normalized to have a variance equal to 1 and a mean equal to 0. The averages of the features and standard deviations were estimated using only the training data.
In the selection of an appropriate structure for a network, an iterative trial and error process is often required. The possible suitable networks are described by parameters such as number of layers, number of neurons per layer, regularization value, number of iterations, input data, activation function, and more. Given this complexity, and the fact that the same structure can produce high error rates, this led us to propose a selection strategy based on programmed batch training. In this method, the training can be performed several times for the same structure and the performance outcomes can then be graphically represented for subsequent selection. The optimal number of neurons in the hidden layer was chosen based on the best results obtained on the validation set while also aiming to minimize hardware resource utilization. The fmincg training algorithm included an automatic adjustment of the learning rate and stopping criteria. Moreover, we fine-tuned the regularization parameter, lambda, to enhance the model’s generalization capabilities.
This structure is validated through the computation of accuracy performance and F-Value [
55]. These metrics are widely adopted in the evaluation of classification systems [
11,
36].
2.4.2. Implementation for Real-Time Processing
An adjacent windowing technique was used. It is emphasized that the identification and generation of a response by the classification system must be less than the time required for the acquisition of a new signal. The following statements are defined as a necessary and sufficient condition for the proposed solution to be executed in real time [
56]:
The system must perform the acquisition of a signal while discriminating another immediately preceding it.
Considering that the digitalization of 256 samples takes 29.18 ms (empirical value measured by means of an oscilloscope) and that the classification window is 128 ms, the system must classify a signal in a time less than 99.6 ms.
To validate the operation, 8 random signals (2 for each class) were analyzed with the Arduino board. A comparison between the average execution time for all stages with the maximum time available was performed. It should be noted that the evaluations performed verify the execution time with EMG signals from the dataset obtained in this work (See
Supplementary Material).
2.5. Desktop App and Prototype
The desktop app was designed to perform the deployment of a complete experiment for each user, from the creation of the database to the hardware implementation. The application is divided into 4 functions that can be accessed from the main interface (
Figure 12).
Create Database: configures the EMG signal capture experiment for a user. Generates the database file in mat format.
Information Analysis: this section allows the application of the Numerical and Graphic Analysis of Discriminative Capacity proposed in
Section 2.3.1 and
Section 2.3.2. It will represent the scores in descending order to inform the researcher about the quality of each characteristic.
ANN training: contains options to configure the artificial neural network to be trained offline (
Section 2.4.1). A project file is obtained with the trained neural networks and their performance.
Real-time Implementation: starting from the ANN project file, this stage writes a code for Arduino that can then be copied and pasted into the sketch ino file to load the project with all the information that the network needs to process the signals online.
In
Figure 12, some of the interfaces implemented for the application are shown.
Figure 12a shows the main interface of the desktop application.
Figure 12b shows the stage responsible for the analysis of features. In
Figure 12c, the interface for creating the database is observed.
Figure 12d shows the interface developed for ANN training.
Finally,
Figure 13 shows the prototype implemented for the EMG signal classifier.


