1. Introduction
Statistics show that most population will be concentrated in cities by 2050 [
1], increasing the waste generation in both quantity and complexity [
2]. The uncontrolled population growth in cities will require smarter solutions to meet the higher demand for services, which will probably find solutions through technological development. In this regard, Information and Communication Technologies (ICT) will play an important role in achieving sustainable living spaces [
3]. Some sectors are already being renewed thanks to investments in development, such as urban transportation [
4] and smart buildings [
5]. However, despite the advances in services offered for citizens in cities, fundamental sectors still need more investment to reach sustainability. Among sectors that could use more technological solutions to improve their services is the MSWMS [
6], in which operations are still carried out traditionally in most countries.
The management of Municipal Solid Waste (MSW) is a matter of public concern since affects everyone. For instance, the world generates about 2.01 billion tons of MSW annually, which is expected to reach 3.4 billion tons in 2050 [
7]. MSWMS manages all this waste content, and decisions regarding operations directly affect the health, cleanliness, and productivity of communities [
8,
9]. Poorly managed debris can seriously harm societies, threatening human health by spreading diseases and hurting the economy due to diminished tourism [
10,
11]. The lack of proper waste management in the last decades of economic development across the globe needs urgent actions at all levels of society. The problem is that MSWMS is expensive, and most countries have other utilities competing for funding, such as clean water, education, and health care. Municipalities and companies (hired by the municipality) dealing with waste management face the same problem of low budgets, which makes it difficult to achieve a stage of sustainable waste management [
12]. In most systems, the task consuming higher shares in the total operational cost is the waste collection, taking around 60–80% of total expenses [
13].
Waste collection practices may vary from one country to another, but the operation can be divided into fixed station or house-to-house collection. The fixed station model is the most popular, with residents responsible for disposing their waste in dumpsters positioned at specific sites [
14]. After that, the company or municipality in charge of MSWMS will collect the waste and transport it to facilities to deal with the final disposition or recycling of that waste. The waste collection task is often performed traditionally, with trucks following predetermined routes or drivers responsible for decision-making regarding the pathway [
15]. This typical scenario can lead to inefficient use of resources since the truck may travel to dumpsters that are empty or even take too long to collect the waste from another dumpster that is already full. Beyond the waste of time and fuel in the first scenario, the second situation can lead to environmental problems inside the cities, with solid waste accumulated outside dumpsters and possible issues with wildlife trying to get fed from it. Moreover, if more trucks are needed on the road, unwanted congestion can result from the delayed waste management system [
16].
In this context, the study of new strategies to optimize waste collection routes has been explored in the last few years to reduce waste transportation costs [
17,
18]. Among the studied paths for waste collection optimization, the most popular ones are the utilization of prediction models to schedule the collection of wastes and the utilization of real-time data to optimize routes [
19,
20]. The first strategy is less effective due to the stochastic nature of waste generation, which makes it difficult to build prediction models with high accuracy. On the other hand, the utilization of physical networks of sensors, such as wireless sensors network, is the most explored solution to optimize waste collection. In a few words, the strategy includes collecting information regarding the waste level inside dumpsters, uploading this information into the cloud, and decision making regarding the routes based on the waste level. This strategy is time-consuming since it requires developing a physical system to acquire data and studying suitable route optimization algorithms. Nonetheless, the strategy usually returns satisfactory saving results, as shown in other works [
21,
22,
23].
In this work, the main goal was to explore the three metaheuristics available in the open-source Google OR-Tools, up to this date, to optimize waste collection routes in the city of Bragança, Portugal. As starting approach, the model region considered 50 paper waste dumpsters located in the city, chosen randomly amongst the 186 dumpsters. The waste level inside dumpsters was simulated following the dynamic waste oscillation approach, which considers the stochastic behavior of waste generation as well as the location of the dumpster. The efficiency of each algorithm in waste collection optimization was measured based on the distances traveled and compared to the real expenses using real data provided by the company in charge of waste collection in the city, Resíduos do Nordeste.
The rest of the paper is organized as follows:
Section 2 brings information regarding MSW generation worldwide, in Europe, and Portugal, along with the related literature on waste collection route optimization.
Section 3 brings the methodology used in this study.
Section 4 shows the results and discussion. Finally,
Section 5 brings the conclusions and future work.
2. Related Literature and Waste Generation Data
The most relevant and updated literature, along with real data regarding MSW, will be presented in this section. Documents used to show the reader the current state of the art in this topic were gathered upon searching in Web of Science and Scopus databases for keywords “optimization” and “waste collection” in the fields “Abstract, keywords, and titles”. This search found 995 (WoS) and 1333 (Scopus) documents. Both databases were used as input and processed to remove duplicate entries using an open-source Pythonbased scientometric analysis ScientoPy tool [
24]. Once duplicates were removed, the records in databases were reduced to 631 and 780, respectively, representing a reduction of 63.4% and 58.5% from initial databases obtained in Scopus and WoS.
Figure 1 illustrates the 10 most relevant keywords and how their appearance in scientific documents evolved from nearly 2000 to 2020.
Figure 1 shows that all keywords presented a sharp growth among documents analyzed, mainly starting in 2012, demonstrating the relevance of their issues for future studies dealing with waste collection optimization. In this regard, “vehicle routing problem”, “smart cities”, followed by specific algorithms, reveal their priority and need for literature review. Therefore, the next sections will explore documents found in both databases to show the reader updated information on this subject. Furthermore, global, European, and Portuguese data on MSW generation will be presented to highlight the need for smarter solutions to manage waste properly.
2.1. Municipal Solid Waste Generation: Global, European, and Portuguese Picture
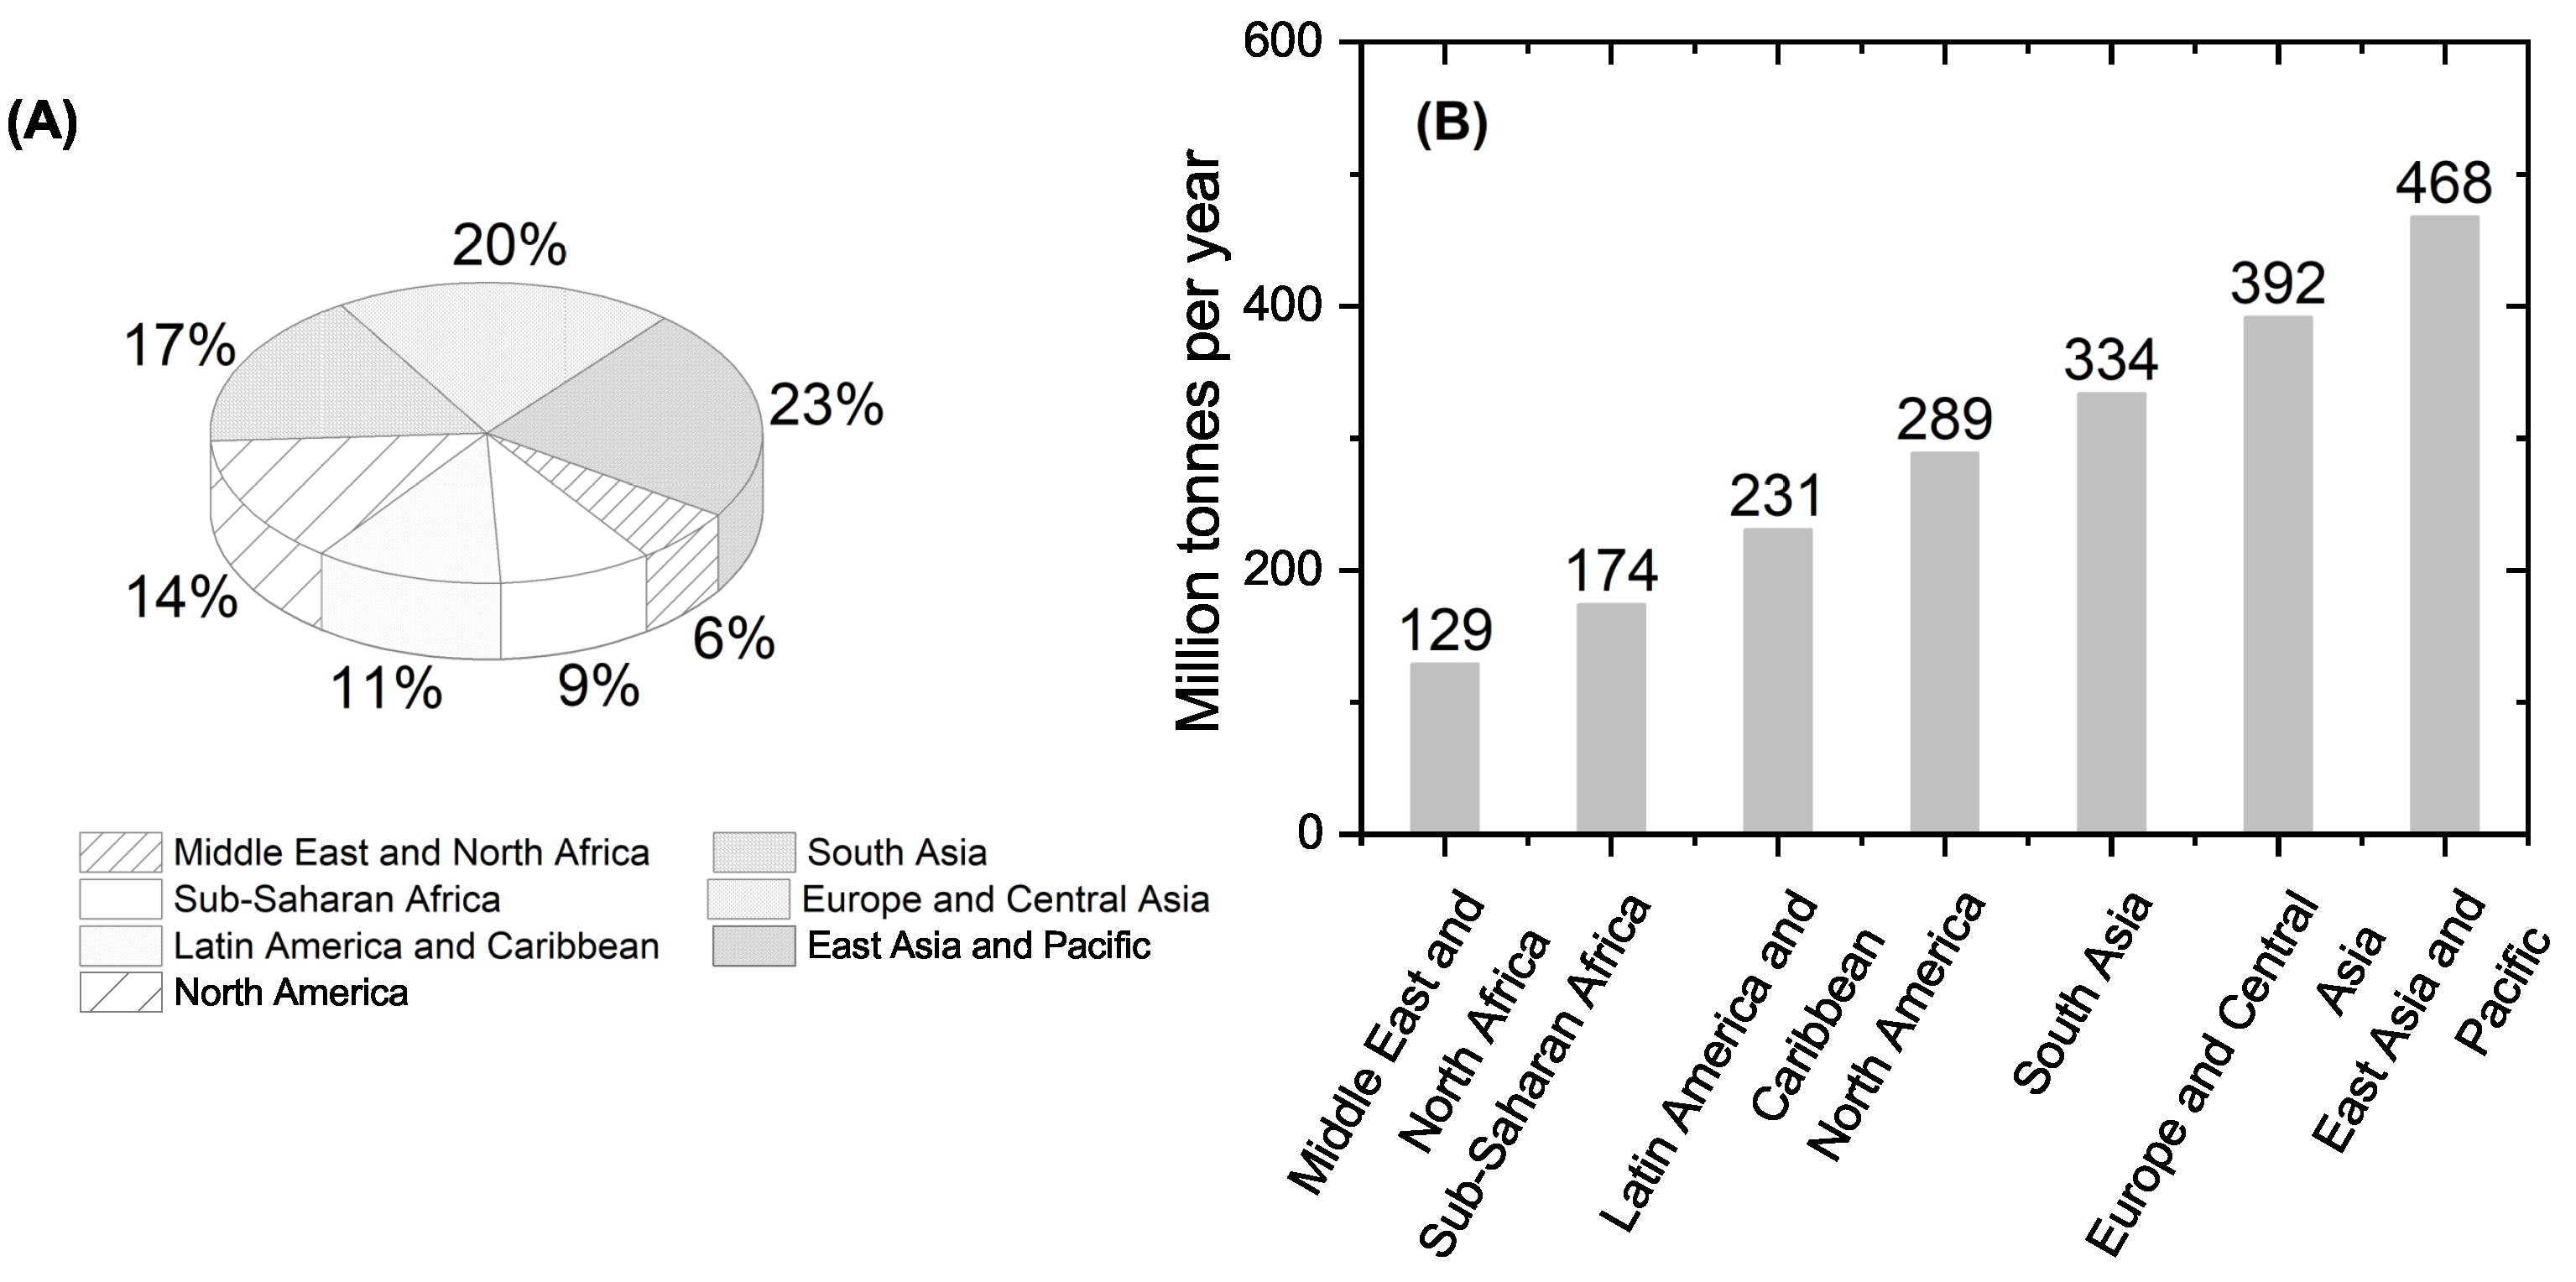
The global picture of MSW generation is concerning, with the amount of waste generated per person varying from 0.11 to 4.54 kg daily in 2016. It is important to highlight that high-income countries account for about 34% of the total amount of waste generated, representing only 16% of the total population. Projections show that by 2050, the waste generation in high-income countries is expected to increase by 19% compared to low and middle-income countries, which are expected to increase waste generation by 40%. Waste generation directly correlates with economic development, with countries in East Asia, the Pacific, Europe, and Central Asia generating 43% of the world’s waste. In contrast, Sub-Saharan, Middle Eastern, and North African countries generate about 15% of the total waste generated globally.
Figure 2 brings the waste generation in a million tons and the percentage for each region in 2016 [
7].
The World Bank group projection for waste generation shows an expected increase of 28.85% and 69.51% in waste generation for 2030 and 2050, respectively, compared to 2016. The model used to predict waste generation considers gross domestic product and population growth as key parameters. The reader more interested in details regarding the projections can read Chapter 2 of the World Bank Group report regarding global waste management [
7]. The highest increase in total waste generation from 2016 to 2050 is expected for lower-middle-income countries, whereas the lowest increase is expected for high-income countries. Regional analysis of the increase in waste generation demonstrates that Sub-Saharan Africa will be the region with the highest increase and Europe and Central Asia with the lowest. According to projections for waste generation, high-income countries are expected to experience the lowest increase in waste generation due to reaching a point of economic development in which the gross domestic product growth is less connected to materials consumption. The expected population and economic growth for low-income countries is the main factor driving the outstanding 204.3% predicted increase in waste generation for 2050 compared to 2016. Due to the expected growth in waste due to population and economic growth in low-income countries, regions composed of a high proportion of these countries are expected to be among the highest levels in waste generation. In this regard, Sub-Saharan Africa and South Asia have the highest expected generation of waste by 2050.
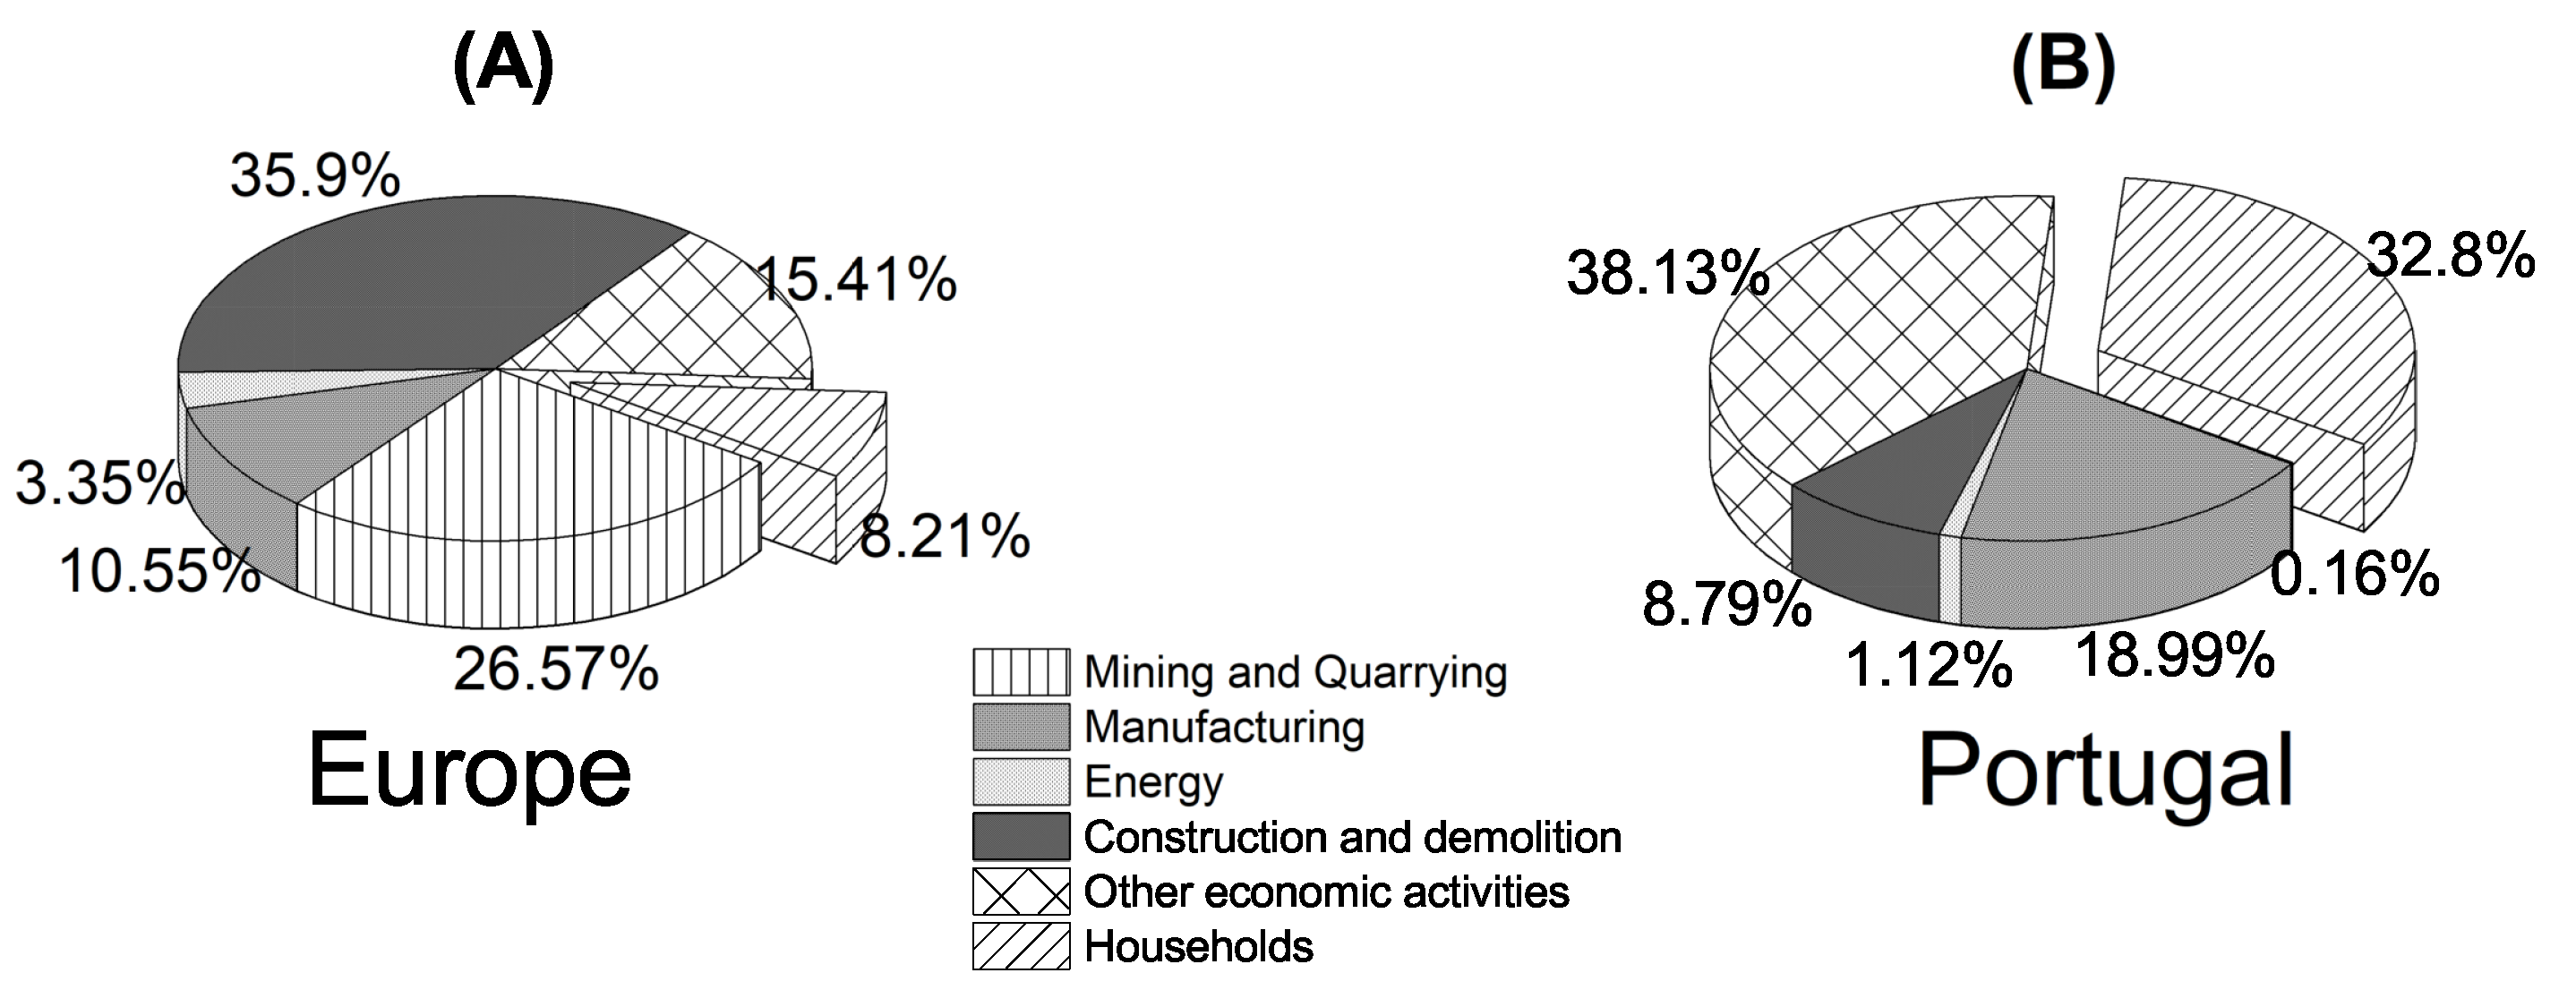
For European countries, the total MSW generation was around 2377 million tons in 2018, representing an average of 5.2 tonnes per EU inhabitant. Waste generation in 2018 according to the different economic activities and households is shown in
Figure 3 for EU countries (average) and Portugal. In the EU, the most significant share of generated wastes is related to construction, mining, quarrying, and manufacturing. In Portugal, the order is different, with other economic activities (agriculture, forestry, and fishing; services; energy) presenting the highest share, followed by households and manufacturing [
25].
MSW represents an average of 7–10% of the total waste generation in EU countries, being one of the most complex to manage. On the other hand, this type of waste in Portugal has a high share of the total waste generated. How a determined European country deals with this stream is an indicator of the overall waste management systems quality in this country. Portugal is the EU country with the highest share of MSW (32.8%), followed by Latvia (32.6%) and Croatia (23.3%). The waste generated in cities presents a complex composition and has a very high public visibility and direct impact on human health. Data for MSW are more recent, showing that each European citizen was responsible for an average of 505 kg of municipal waste generation in 2020. According to Eurostat, the MSW generated per capita in Europe and Portugal is shown in
Figure 4 for the years 1995, 2005, 2010, 2015, and 2020.
The results demonstrate an increase of 8.2% compared to the first record in 1995 for the total waste generated in Europe. In this scenario, Portugal is one of the countries with the highest increase in waste generation, with 45.7% more urban waste generated compared to the first record. For instance, in 2020, Portugal generated 5279 thousand tonnes of MSW, which shows that the COVID-19 pandemic had no impact on waste generation compared to 2019. The current Portuguese situation regarding MSW is concerning since most indicators established were not reached in 2020, as shown in the annual report [
26].
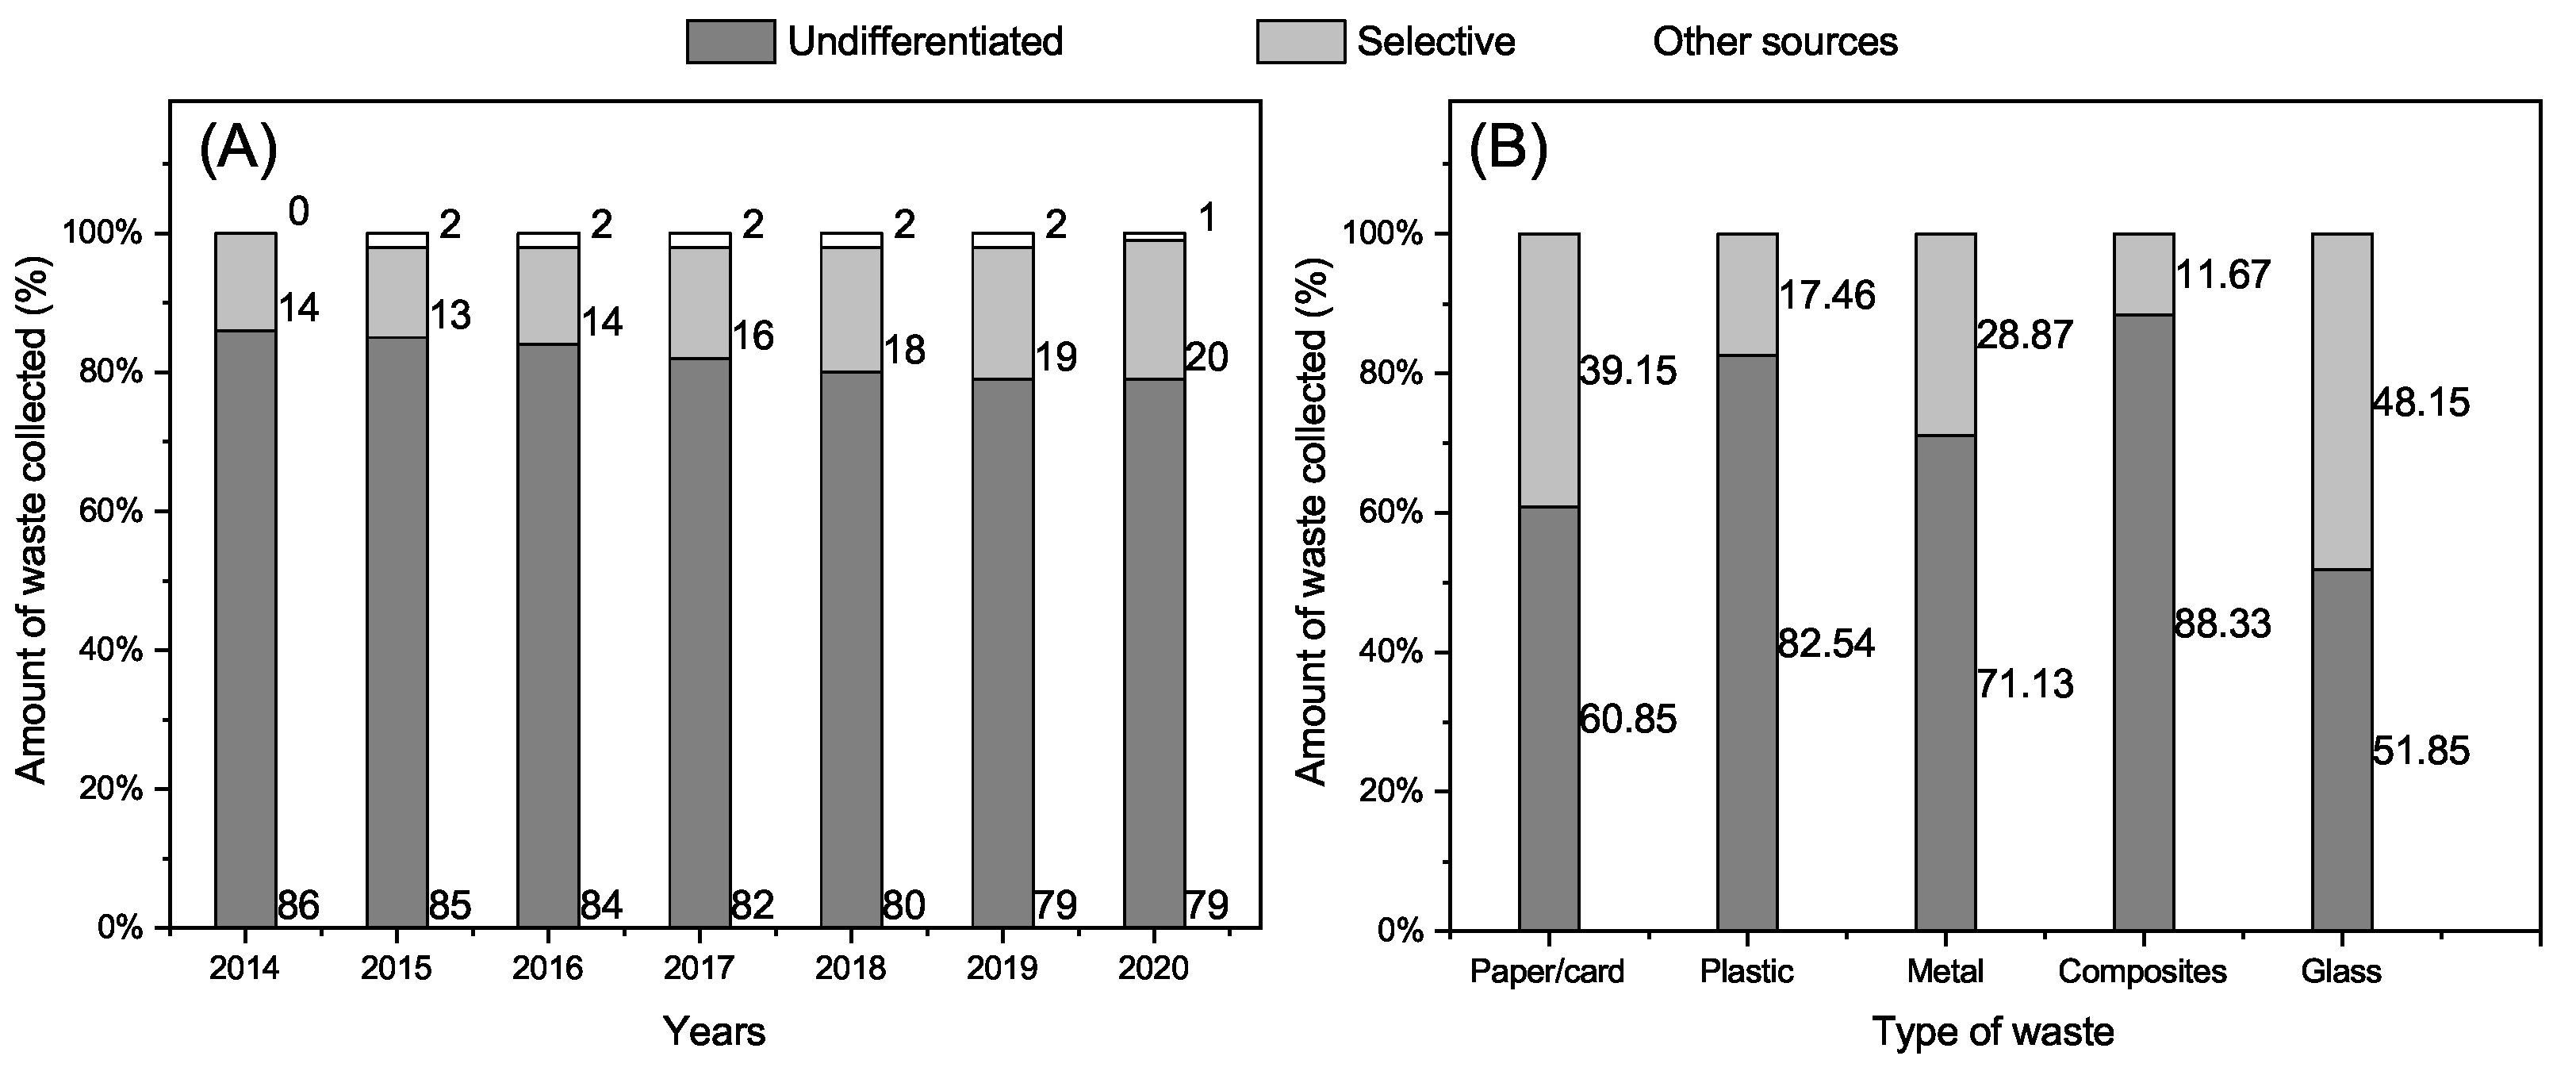
Figure 5 brings information regarding the distribution of waste collected in Portugal and the percentage of waste per type collected in selective and undifferentiated operations.
Numbers show an increase of around 6% in waste collected by selective collection from 2014 to 2020, representing an annual increase of about 1%. A reduction of waste collected in undifferentiated dumpsters can also be observed. However, 20% of waste collected in selective collection for 2020 is far below the established goal, demonstrating the need to find more solutions to improve sustainability in MSWMS. Results of waste percentages collected by undifferentiated and selective collection according to the type show that undifferentiated collection rules for all types of waste. This type of collection should be avoided by the systems to achieve sustainability since the recycling operation is hard using waste from this means. Another valorization method that could bring an acceptable solution to the end-of-life waste problem is energetic valorization [
27]. However, both alternatives (recycling and energetic valorization) are expensive, and even for energetic valorization, there are environmental issues. The current scenario is illustrated by the urgent need to invest in more solutions to properly introduce waste into the economy in a system that suffers to keep operations due to the low budget availability. In the northeast region of Portugal, a region of low population density (19.4 hab/km
2), the company in charge of MSWMS is Resíduos do Nordeste (see
www.residuosdonordeste.pt, accessed on 20 August 2022). The company is responsible for the MSWMS of 13 municipalities, totaling 129,445 citizens. The highest amount of waste collected in the selective collection comes from Bragança, which possesses the highest population amongst cities served by the company, responsible for 27.4% of the total waste collected. For instance, in 2020, the company managed 52,973 tons of waste (4719 tons from selective collection). Despite the low amount of waste collected in the selective collection, data show that selective waste collection increased by around 83.8% from 2015 to 2020. The increase in selective collection is directly associated with the number of recycling points allocated in cities, jumping from 616 in 2015 to 930 in 2020 (50.97% more). Each recycling point is comprised of 3 dumpsters, one for the deposition of paper and cards (blue), the other for the deposition of plastic and metals (yellow), and the last one for the deposition of glass materials (green).
Figure 6 depicts the amount of waste collected in selective collection per type of waste from 2014 to 2020. The trend of waste collected for different types of waste shows that paper waste is the most generated, with the highest increase in collection among the other types [
28].
2.2. Vehicle Routing Problem in Waste Collection
Studies with “vehicle routing problem” or similar keywords were filtered from the database used to generate
Figure 6, which resulted in a smaller database comprised of 88 documents. Through a more detailed analysis, 35 papers amongst those 88 were found suitable to contribute to this brief literature review on the topic of vehicle routing problems in the context of MSW collection. It is important to highlight that only studies published after 2015 were considered for this revision. Mathematical formulation is an important step in solving a determined problem that involves the need to find routes under specified demands and constraints. Each problem formulated in this strand has its constraints and objectives, generating many different formulations mimicking real-case scenarios. Essentially, most problem formulations, including the waste collection problem, are Vehicle Routing Problems (VRP). The VRP is a variation of the known Traveling Salesman Problem (TSP), for which the difference resides in the number of vehicles used to collect items. For instance, if one considers one truck to collect items in a VRP, the problem will become the TSP [
29].
The approaches used on papers dealing with waste collection problems can be divided into Node Routing Problems and Arc Routing Problems. Node Routing Problems possess demand on the nodes (vertices) of the graph generated by the problem. On the other hand, Arc Routing Problems have demand on the arcs (edges) of the graph [
30]. One example of a Node Routing Problem could be a salesman who must visit every city in a country, whereas the Arc Routing Problem could be illustrated by a postman that needs to visit each house along the streets in a town. The most usual approach considering waste collection problems is the Node Routing Problem, for which several variations of the VRP were already reported in the literature.
These variations arise from the need to consider different restrictions to the initial formulation. For instance, the formulations most used in waste collection are the capacity and the time window constraints. The class Capacitated Vehicle Routing Problem (CVRP) emerged from the first one. The CVRP is illustrated by the need to deliver (or pick up) goods to a set of customers with a certain demand, following the shortest path. One particularity in this approach is that routes begin and end at the central depot, and vehicles’ capacity has to be considered to determine if a truck will continue collecting items or should return to the central depot and empty the load. The other formulation commonly considered for waste collection operations is the Vehicle Routing Problem with Time Windows (VRPTW), which ascribes a time interval in which a certain customer must be visited. To bring more similarity to the real case scenario with the problem, some authors consider both constraints, which gives place to the Capacitated Vehicle Routing Problem with Time Windows (CVRPTW).
Figure 7 illustrates scenarios of the utilization of CVRP (
Figure 7A) and VRPTW/CVRPTW (
Figure 7B), for which both constraints are present [
31]. It is important to highlight that, in real scenarios, the route would be different considering or not capacity constraints in a time-window modeled approach.
Grakova et al. [
32], for example, focused on finding a solution to commercial solid waste collection as one alternative to reduce operational costs and spare funds to invest in more separation rates of different types of waste. In this paper, the authors discuss their strategy to use the infrastructure mentioned in several details, but no results regarding route optimization are shown. Henke et al. [
33] showed in their paper one solution to the collection of glass waste by a multicompartment capacitated vehicle routing problem (MCVRP) with flexible compartment sizes. In their work, the problem was modeled as an MCVRP, in which trucks are equipped with more than one compartment to avoid mixing glasses of different colors. The numerical results showed that collecting these items could reduce expenses by 34.8% adopting multicompartment trucks to perform the task. Tirkolaee et al. [
34] explored route optimization in the waste collection by modeling the problem as a multitrip vehicle routing problem with time windows, with the objective of total cost reduction. Their study showed a practical application in a city located in Iran, demonstrating a potential reduction of 13.3% in waste transportation cost.
In most recent studies, another formulation more directed toward waste collection was presented in the literature, the Waste Collection Problem (WCP). The first time this problem formulation was introduced was in 1974 when Beltrami and Bodin tried to optimize collection routes using a heuristic algorithm in New York City [
35]. The objectives and constraints in this strand of problems are similar to the one observed for VRP problems, with a design more specific to solving solid waste collection. Usually, the objective in these problems includes, but is not limited to, distance optimization, time optimization, environmental impact reduction, and cost optimization. In a few words, no matter restrictions and objectives imposed in a determined approach, three instances will remain: the central depot, trucks, and dumpsters to be served. Due to the specificity of each SWMS to deal with their collection, as a consequence of local laws to which these systems are submitted, it is necessary to investigate how the operation is carried out in the region of interest. In this regard, before modeling a solution to waste collection, the authors are recommended to look at their region of interest and raise possible constraints and objectives in line with their scenario. WCP already has several formulations available in the literature, similar to VRP. Most constraints assumed for WCP problems are the same as those used in VRP, which generates problems such as Capacitated Waste Collection Problem (CWCP), and Capacitated Waste Collection Problem with time windows (CWCPTW). An extensive literature review on the objectives, constraints, and other aspects of the WCP is available and can be found here for the reader interested to learn more about this subject [
36].
2.3. Optimization Algorithms
The waste collection problem is often comprised of several dumpsters to be served and numerous constraints, which makes it hard to find exact solutions. Vehicle routing problems, in general, have been proved to belong to the NP-hard class of problems. In other words, the computational time required to solve the problem increase much faster as the problem size increases. However, there are options to find near-optimal solutions using nonexact methods (e.g., heuristic and metaheuristic). For instance, metaheuristic methods have been recognized as a powerful tool for finding the optimal solution with a feasible execution time [
37]. These methods are known to find a near-optimal solution to a given problem using limited computational processing or even problems with incomplete information. The word “metaheuristics” was used by Fred Glover for the first time to illustrate a heuristic method with not-problem-specific characteristics. In brief, these algorithms can be applied to a diverse range of optimization problems, requiring small modifications when applied to a specific problem [
38].
Despite the increased computational demand required to find exact solutions for VRP, some studies are devoted to this task. To increase the feasibility of the solution, the authors working in this strand proved the possibility of linearizing the problem to find the optimal solution and evaluate if the solution found is global or local optimum. Computational methods to solve the modeled problems include mixed-integer linear programming [
39] and fuzzy programming [
40]. The models are complex and approach several aspects of real systems to improve the overall logistics of the process. There are works exploring the solution to waste collection problems via exact methods. For instance, Babaee et al. studied the minimization of total travel and tour distances for single trucks (makespan) [
41]. The authors proved that
-constraint and multi-invasive weed optimization methods could efficiently solve small and large problems, respectively. In another study, Rizvanoglu et al. compared the performance of a linear programming model and geographical information system (GIS) to minimize waste transportation costs and optimum scheduling for waste collection. The result obtained by the authors in real-case scenario showed a reduction of 33% and 28% using linear programming and GIS, respectively [
8].
Metaheuristic methods are known for their robust searching mechanism based on two search schemes: exploration and exploitation. Both mechanisms work together, searching for the best solution in the surrounding areas (exploration), while the other tends to invade new searching areas. The operation of these algorithms begins with generating a random solution that will be modified upon operations of exploit and explore until the stop criterion is satisfied. Exploration and exploitation are the main functions of these algorithms, and the way a determined algorithm will balance its operation was often used in the literature to establish classifications. Among the classifications more respected in the literature is the one made by Grendeau and Potvin, who divided the algorithms into trajectory-based and population-based. The most recent classification of metaheuristics was presented in [
42], which divided the algorithms into metaphor-based and nonmetaphor-based metaheuristics. The difference is that metaphor-based ones are built by simulating natural phenomena, mathematics, or human behavior in modern societies. In opposition, nonmetaphor-based metaheuristics did not consider any model to determine their search strategy.
The new metaheuristic classification proposed by Basset et al. [
42] separates algorithms based on the operation mechanism, which can be intuitive to understand if one algorithm is rather a metaphor or nonmetaphor-based. For instance, examples of metaphor-based algorithms include Genetic Algorithms (GA), Particle Swarm Optimization (PSO), Harmony Search (HS), Simulated Annealing (SA), Ant Colony Optimization, and Gravitational Search Algorithm (GSA). On the other hand, examples of nonmetaphor-based algorithms are Tabu Search (TS) and Variable Neighborhood Search (VNS). Regarding route optimization in solid waste collection, several metaheuristics were already developed targetting specific problem formulations. GA, ACO, PSO, and search algorithms (SA and TS) are the most considered routines used in the literature to optimize waste collection operations.
The first ant colony optimization algorithm was developed inspired by the behavior of ant colonies by Dorigo et al. [
43]. Ants interact in a particular way in their colony compared to most animals in the wild. Their survival instinct is focused on the survival of the colony rather than the survival of individuals. In this way, ACO simulates the ants’ forage operation to find the optimum solutions to computational problems. The pathway followed by the ants is possible due to their ability to release and sense pheromones, so they can build trails to seek food or return to their colony. Consequently, ACO employs artificial ants to build their solutions to the problem considering using information from the problem and its performance to replace the way other ants see the problem. ACO algorithms are advantageous compared to other metaheuristics in terms of convergence speed. In the solid waste collection optimization context, Karadimas et al. developed an algorithm based on the principles of ACO to optimize municipal solid waste collection in Athens. In their study, a Geographic Information System (GIS) was used as a tool to build a georeferenced spatial database MSWMS, taking parameters required for solid waste collection into account. Their result showed the possibility of saving about 9500 € every week, considering the time saved during collection operation, which was the objective of their study [
13]. Elgarej et al. used a multiagent ant colony system to minimize travel distance in waste collection operation, comparing its performance with a GA executed under the same considerations and computational specifications. The result showed that their ACO algorithm outperformed GA by 5.23% without a significant difference in execution times [
44].
PSO algorithms were introduced by Kennedy and Eberhart in 1996 [
45] and are a class of population-based algorithms inspired by the motion of schooling fish and bird flocks. The mechanisms of operation begin with generating a random solution, with update generations as a strategy to find the optimized solution. The operation shares many similarities with evolutionary computational techniques, such as GA. The difference between PSO and GA is that the first has no evolution operators such as mutation and crossover. Instead, the search mechanism in PSO involves particles moving in the problem space by following the current optimum particles. Hannan et al. [
46] proposed a modified PSO algorithm to solve the capacitated vehicle routing problem by evaluating the best threshold waste level to increase the efficiency in collection operation. Their results showed that considering 70–75% as the threshold for waste collection returns the best efficiency in the modified PSO algorithm. The dataset used by the authors was already used in previous studies by other authors, and their results could overcome previous algorithms available in the literature.
GA is one of the most explored algorithms to find optimal solutions for waste collection in the literature [
47,
48]. The starting point in these algorithms is Darwin’s principle “Survival of the fittest”. In this regard, GA has instances that can emulate the behavior of chromosomes in the biological evolution process through three operators: selection, crossover, and mutation. Chromosomes are the agents carrying the solutions, and their fitness as the best solution is evaluated in each generation. The parents’ selection mechanism in a given generation is one important mechanism for generating new solutions. Some examples of selection schemes are Tournament Selection (TOS), Linear Rank Selection (LRS), and the Roulette Wheel Selection (RWS). Assaf and Saleh [
49] evaluated the performance of a GA to find the optimal waste collection route in Nablus city. Authors were able to achieve 66% of the traveled distance for waste collection, with a reduction in operational time from 7 to 2.3 h per truck trip.
A popular optimization technique inspired by metallurgy annealing is “Simulated Annealing” (SA). Babaee et al. [
34] solved the issue with vehicle routing through SA to reduce overall operational costs while taking time windows into account. A metaheuristic known as Tabu Search (TS) limits the research of a candidate solution by using memory structures (tabu list) to store ineligible candidate solutions and generate additional candidates. To maximize profitability, Shao et al., designed a waste collection synchronization mechanism [
50]. A metaheuristic search technique known as "Guided Local Search" (GLS) compares the cost and penalty of each solution using features from both the TS and SA algorithms. In the study by Barbucha et al. [
51], an agent-based GLS algorithm was developed to solve the CVRP using GLS and an asynchronous team idea.
2.4. SWOT Analysis
The current literature presented here shows successful cases of study of works dealing with the optimization of routes. As shown in previous sections, several problem formulations describe in detail how the formulation is approaching a real problem, which is useful for authors interested in developing studies with a particular system. For instance, time windows and capacity are the most relevant constraints in waste collection tasks. Furthermore, cost and gas emissions are the main objectives in the problem formulation. Regarding optimization algorithms, both exact and metaheuristics have the well-proved performance to save resources by reducing distances traveled, the number of trucks, and other aspects that directly or indirectly overcome the same result: resource savings. In addition, several studies show alternatives to improve the system’s overall performance, with complex models approaching route optimization, stock control and pickup and delivery points location optimization. Regardless, the most relevant constraint present in most works dealing with waste collection task is the capacity constraint, which is considered in this work.
In spite of the large number of works presenting possible solutions to route optimization problems, formulations and algorithms are developed in a static scenario. In other words, the information required to run the optimization algorithm is already known before the execution, and the results, once obtained, will not change during the execution of the proposed optimal routes. Considering the dynamic nature of the real world, there is a clear need to study alternatives to bring the current solutions to a dynamic scenario. For instance, in a real waste collection scenario, planning the route before the truck leaves the central depot might be less efficient than dynamic planning the next stops during the collection task. In other words, the time spent during a truck stop to transfer the waste from the dumpster to the truck could be used to plan the next stop. This solution requires other mechanisms not to be discussed here to have access to real-time information regarding level. Nevertheless, the execution time of the route optimization algorithm is the most important parameter to be considered in a dynamic scenario since the algorithm will have a few minutes to determine the shortest path to the next stop. In this regard, most works do not show what the execution time of their solutions is or even omit the information regarding the machine used to evaluate an algorithm’s performance. Here, we show how fast OR-Tools is to provide the optimized route in a static scenario, which could be observed in real dynamic scenarios since the mechanism to find the shortest path is the same.
Most works performed in the literature consider the study of route optimization algorithms, with the main goal of developing the best algorithm to reduce costs. Some works even show their performance in real-case scenarios, with significant cost reduction already observed for most cases. However, there is a clear opportunity to develop more sophisticated systems for dynamic routing, for which customers’ location, demand, and other parameters relevant to route planning are unknown. The dynamic scenario is closer to the real scenario, as discussed above, and current strategies, solutions, and knowledge need to be considered in this paradigm shift toward dynamic routing. For this reason, several opportunities exist to use the current formulations in static scenarios and evaluate how the solutions would behave in dynamic scenarios. For instance, it is already reported that algorithms’ performance will be maintained by shifting the scenario from static to dynamic. However, other aspects rather than performance must be considered to achieve a successful and efficient solution. Here, we explored one aspect of route planning that is more interesting for dynamic scenarios, which is the execution time.
The threats related to the topic studied here could be considered for studies planning real applications of their solution. Before proceeding to this step, the algorithm needs to be developed considering a simulated system approaching as much as possible the real-world scenario studied. Another problem that can be faced is the lack of applicability of the proposed solution, which could harm the transference of the solution from the platform in which it was developed to another accessible one for those who will work with it. Beyond the challenges related to algorithms testing and development, it is also important to consider the possible physical interventions required to implement the solution. For example, considering a system that will be used to plan routes for collection, there is the need to study how decision-making regarding dumpsters suitable for collection will be done.
3. Materials and Methods
Aligned with the mission of this work, the methodology was developed to study the optimization of waste collection routes using the optimization algorithms available, at this moment, in the open-source tool (Google OR-Tools). The model region was chosen based on the partnership of the research group with the company Resíduos do Nordeste, in charge of MSWMS in the Northeast region of Portugal. The algorithms available in the tool up to this date are Guided Local Search (GLS), Simulated Annealing (SA), and Tabu Search (TS). To run the simulations, the study was carried out considering a period of days and k paper waste dumpsters, from which real locations were considered (information provided by the company). The type of waste was chosen based on the past generations that showed the highest collection of paper waste in the studied system. For instance, around 33.5% of the waste collected in the selective collection was paper waste in 2020.
The model considers three modules operating simultaneously to determine the daily distances trucks travel to collect the waste. These modules are (i) waste level through days, (ii) dumpster selection and distance matrix generation, and (iii) route optimization.
Figure 8 illustrates how the complete system operates, with arrows pointing to directions in which modules are communicating.
The first module is responsible for initializing waste levels on dumpsters and will send information on daily levels to the selection model. Once dumpsters are selected for the collection, based on specific criteria, Module 2 will communicate to the first one that the level of a determined dumpster needs to be set to 0. This is why modules 1 and 2 exchange information, as illustrated by the arrows in
Figure 8. The last module is the most important in this work since it will be responsible to return information used to assess which is the best algorithm available in OR-Tools to optimize waste collection routes. The complete representation of the outcome from the three modules working is illustrated in
Figure 9.
3.1. Capacitated Waste Collection Problem
Paper waste dumpsters were chosen as the study’s primary object because paper waste is a waste kind that is collected in selective collection with higher generation. This issue is described as a capacitated waste collection vehicle routing problem (CWCP). In this kind of VRP, items must be picked up or delivered at multiple locations using trucks having a restricted carrying capacity. The trucks have a maximum carrying capacity, while the items have a quantity, such as weight or volume. The challenge is to pick up or transport the items at the lowest possible cost without ever overloading the trucks to capacity.
These routes can be represented as a graph, where the roads are the arcs and the dumpsters the vertices. Each arc has a cost attached to it. This cost may be related to the distance (cost of this approach), the travel time, or the amount of fuel required. The goal is to reduce the overall distance for the waste collection route, which reduces fuel costs and carbon emissions. The CWCP strategy, can be designed as a weighted directed graph where denotes the set of vertices and reflects the set of arcs. In this formulation, the vertex 0 stands in for the depot, while the other vertices represent all of the locations where waste is collected, with N standing in for the index set of V. Each arc has a non-negative number associated with it that represents the cost-based distance between the vertices l and j. Linked with each location l a demand is defined () such that , considering that the fleet of trucks, K, has the same load capacity, Q. Therefore, the CWCP solution must consider the following assumptions:
Truck capacity Q is limited.
The number of trucks must be restricted (K) and uniform.
There is exactly one truck that stops at each location exactly once.
Only one type of waste is collected by trucks. (i.e. paper).
The central depot is where each route starts and ends.
Dumpsters need to be filled once every two days.
When the truck is loaded to its maximum capacity, waste must be delivered to the central depot.
Depending on the algorithm used, the truck routes and their sequence are determined during the solution development.
The mathematical formulation of the problem will be presented based on a general formulation found in the literature to address the CWCP mentioned above [
52]. The following definitions of the decision variables are used to determine the sequence order of visits to dumpster locations:
The CWCP mathematical formulation is provided by:
As a result, the objective function shown in (1) allows the minimization of the overall distance while keeping the constraints in mind. The constraints (2) guarantee the same truck only visits each location once and only departs from it, while the set of constraints (3) ensures that each truck only departs the depot once. In turn, constraints (4) ensure continuity of the route by ensuring that the number of trucks departing from and arriving at each location is equal. According to the constraints (5), the capacity of the truck providing the service must be less than or equal to the total demands of the locations visited along a route. Constraints (6), which guarantee that the solution has no cycles separated from the depot, express the subtour elimination restrictions. Additional decision variables, , represent the truck load k after visiting the location l (7) and are used in the subtour elimination restrictions. Finally, (8) and (9) describe the definition domain of the decision variables and , respectively.
3.2. Module 1-Waste Level through Days
Data provided by the company regarding waste generation are condensed, consisting of the annual generation of a determined type of waste only. In this way, it is hard to build sophisticated algorithms to simulate waste generation throughout days. Luckily, in our case, the goal is to compare algorithms to determine the best one to be used in future work, which will deal with another source of real information regarding waste levels not to be discussed here. In other words, our model’s criteria and working principle need to agree with the literature, but accuracy is not the focus here. In this regard, a model was used over the period studied to determine waste levels through the days analyzed. The model is based on the dynamic generation of waste and the analysis of individual dumpsters to determine a coefficient that expresses the populated area around the point of interest (demographic factor). This parameter was chosen because a previous study reported in the literature shows that demographic factor greatly influences paper waste generation. To proceed with the analysis of the area around the dumpsters, the software Google Earth was used. In practice, the demographic factor was calculated by dividing the populated area by the total area in a region delimited by 150 m around the point of interest.
Initial levels inside dumpsters were determined using a uniform probability distribution as the initial approach. The parameter responsible for the stochastic update of daily levels was named filling velocity (
), calculated based on demographic factors. This parameter is responsible for the waste level increase during the period studied since it represents the oscillation percentage in waste volume for a given dumpster. Equation (
10) illustrates the mathematical equations used to determine filling velocities (
), daily waste level (
), and the amount of waste (
) in m
3 for dumpster
j in day
i.
stands for the filled area with a population patch around dumpster
j and
is the total area defined to calculate this parameter, which is a circle with a 150 m radius. The parameter introducing dynamic oscillation in the waste generation to the daily waste level is
. Parameters
L and
were already introduced, and
represents the total volume of dumpsters for selective collection in Bragança, provided by the company Resíduos do Nordeste.
Figure 10 shows all collection points considered for this study and how the filled area was determined using Google Earth software.
This module will generate the load matrix (), carrying information regarding the amount of waste that needs collection on a specific day. Each line in this matrix represents a collection day, and each column is ascribed to a specific dumpster.
3.3. Module 2-Dumpster Selection and Distance Matrix
In another study developed in this research, the authors evaluated the power of the criteria to perform the selection of dumpsters to be collected. In that case, the goal was focused on the evaluation of which is the best upper threshold for waste collection (i.e., 70, 80, or 90%). For comparison purposes, this other work also considered a collection model in which trucks are ascribed to collect all dumpsters once every two days. Considering more specific criteria for selection, such as the waste level inside dumpsters, results in higher efficiencies in waste collection, according to the previous study. However, the number of collection spots on collection days is lower. With fewer dumpsters for collection, the algorithms available for route optimization would not be operating under stress. On the other hand, collecting all dumpsters once every two days will put the optimization algorithm under higher stress. For this reason, dumpster selection in this module was performed considering collecting all waste once every 2 days.
Once a dumpster is selected for collection on the day
i, this information is returned to the first module so the level can be set to zero. Module 2 will be mainly responsible for the generation of the collection matrix (
), in which lines represent collection days and columns are ascribed to locations. A dumpster
j needs collection in day
i if, and only if,
. Each line of this matrix will be further used as input for the distance matrix generation. The algorithm also uses information provided in another file containing the coordinates of the real locations of the dumpsters. The distance matrix represents a square matrix that stores distances between elements on a set of locations. For instance, if we need to choose the path to visit
N locations, our distance matrix will have
dimension. In practice, in this work, Google Maps API was used to obtain real distances between each pair of locations, a piece of information further used to assemble the distance matrix for each collection day. To clarify the distance matrix concept, consider the distance matrix represented below, carrying information regarding three locations
k,
l, and
m.
|
The elements of this matrix that have same index for column and line (, , and ) will assume null since they represent distances between same location. It is also important to highlight that, for real applications, the distance between location k and m is not the same as the distance between location m and k.
3.4. Module 3-Route Optimization
The module specified in this section is the most important in this work since this study’s main goal was to define the best algorithm available in OR-Tools for waste collection route optimization. The three metaheuristics assessed in this work for waste collection optimization in the city of Bragança were Guided Local Search (GLS), Tabu Search (TS), and Simulated Annealing (SA). This module will interact with both previously discussed ones, receiving crucial information from both to be executed. All 3 metaheuristics use the same data set as input to find the shortest path for the waste collection, considering the problem as a capacitated waste collection problem, described in more detail in
Section 3. The data set includes the number of trucks ascribed to the task, the capacity of each truck, the distance matrix, and the loads in each location that should be visited.
For this reason, module 3 will receive the load matrix (
) and the distance matrix (
) when executed. Other information needed for the execution was rather calculated based on the real operation by the company (number of trucks) or provided by the company (real capacity of trucks). The three metaheuristics are executed simultaneously to return daily distances traveled, the detailed path followed by the trucks, the loads being carried, and the execution time. The most important information is the execution time, and distance traveled since the load will be the same regardless of the algorithm. The load will be the same because the total demand will not change accordingly to the algorithm, only the path found in the decision-making in each metaheuristic. Algorithm 1 represents the whole operation performed by the 3 modules in this study.
| Algorithm 1 Waste collection route optimization |
- 1:
- 2:
for to do - 3:
for to do - 4:
- 5:
- 6:
if then - 7:
- 8:
- 9:
- 10:
end if - 11:
end for - 12:
end for - 13:
fori in do - 14:
- 15:
- 16:
end for
|
3.5. Google OR-Tools-Open Source Solver
Creating algorithms to handle well-known VRP problems is challenging, whether open-source or closed-source software. These challenges provide particular learning requirements, use cases, application barriers, and many benefits to real-world scenarios and data (as shown in
Figure 11).
The Google OR-Tools [
53], an open-source tool, has recently been launched (2019) and offers many libraries and different solvers for different versions of issues and/or forms of VRP. This tool was designed in 2019 by researchers and programmers from Google. It features a cloud system with several learning libraries, statistical data, vehicle routing problems, a programming environment, flexibility, and functionality that is simple to use across various programming languages (such as Python, Java, C#, etc.). This tool also comes with certain predefined algorithms, including (meta)heuristics and a number of procedures, mechanisms and methods for specifying goals, variables, constraints, and/or parameters. Additionally, the integration of skills with external systems or online services is allowed, including visualization systems and the Google Maps API, distance matrix API, and others.
In order to solve challenging combinatorial optimization problems, Google OR-Tools is a quick and portable package that allows for tests and/or applications to real-world issues. Numerous types of VRP, such as issues with pickups and deliveries, multiple capacity dimensions, initial loads, skill problems, scheduling problems, etc., can be solved with Google OR-Tools. Finally, substantial online documentation about OR-Tools, which is packed with examples and libraries, demonstrates the platform’s tremendous potential in the area of operational research systems.
4. Results and Discussion
In this section, the results obtained for route optimization using Guided Local Search (GLS), Simulated Annealing (SA), and Tabu Search (TS) metaheuristic algorithms available in Google OR-Tools will be discussed. Other parameters rather than mechanisms to find optimized collection paths were kept as default. The scenario used as input to evaluate the decision-making efficiency of the algorithms was chosen to put the tools under stress. In this regard, the algorithms need to find the shortest path to collect the waste from all dumpsters once every 2 days, respecting the truck’s capacity as a constraint.
The study period in this assessment was 30 days (
). The fleet of trucks is comprised of 3 trucks (
), each with a maximum capacity of 16 m
3 (
Q). The number of dumpsters was chosen to have a similar rate dumpster/truck from the real waste collection system (about 16 dumpsters per truck in 2020). In this regard, 50 paper dumpsters were chosen in the city of Bragança to model the demands in waste collection. Each dumpster has a maximum capacity
m
3, and was randomly chosen amongst the 185 real locations provided by the company in charge of SWMS in the model region. The location of each dumpster and the central depot are shown in
Table S1.
4.1. Waste Level throughout Days
A dynamic approach to paper waste generation determined the waste level oscillation through the period studied. Paper waste was chosen as the model approach due to the high generation of this type of waste in the real system studied here. The two essential parameters for this model are the initial level inside dumpsters (
) and the filling velocities. The initial level is determined once with the aid of a uniform distribution and will assume values between 0 and
. Filling velocities also have random characters as one attempt to simulate stochasticity in real waste generation. As can be seen in Algorithm 1, the dynamic determination of this parameter is performed on a daily basis, using a uniform distribution probability function that returns values between
and
.
Figure 12 brings examples of waste oscillation for the locations with the lowest
vs. highest demographic factors, along with their filling velocity.
The result shows that despite the stochastic behavior in waste generation, it is possible to observe a strict correlation between the demographic factor and waste generation. Additionally, dumpster overfilling was observed in 46.7% of collection days for location 32, which is expected to be observed for regions with higher demographic factors. For instance, the relative average amount of waste (excluding collection days when levels are reset) is 2.82 m
3 for location 32 and 0.43 m
3 for location 40. This shows that waste generation is strongly influenced by the region where the dumpster is located, as intended. On the other hand, the dynamic characteristic of waste generation can also be observed since standard deviations are high for both locations illustrated. For location 32, the standard deviation is 0.75 (26.6% from the average generation), and 0.11 for location 40 (25.58% from the average generation). The correlation between waste generation and demographic factors is shown in
Figure 13.
The analysis comparing demographic factors with the amount of waste generated in one dumpster during the studied period proves a strong relationship between the parameters. Nonetheless, the correlation coefficient would be higher if the approach used in this work for MSW generation followed the static approach of waste generation. However, using the static approach would not consider the stochastic behavior in waste generation, which is one important aspect of the phenomena. In
Tables S2–S4 and S5–S7, the values obtained for the amount of waste inside dumpsters and the filling velocities are shown. It is important to highlight that this study used the waste generation model as a tool to obtain data and evaluate route optimization. Far more studies have been exclusively developed towards modeling waste generation using more sophisticated tools [
54,
55].
4.2. Route Optimization
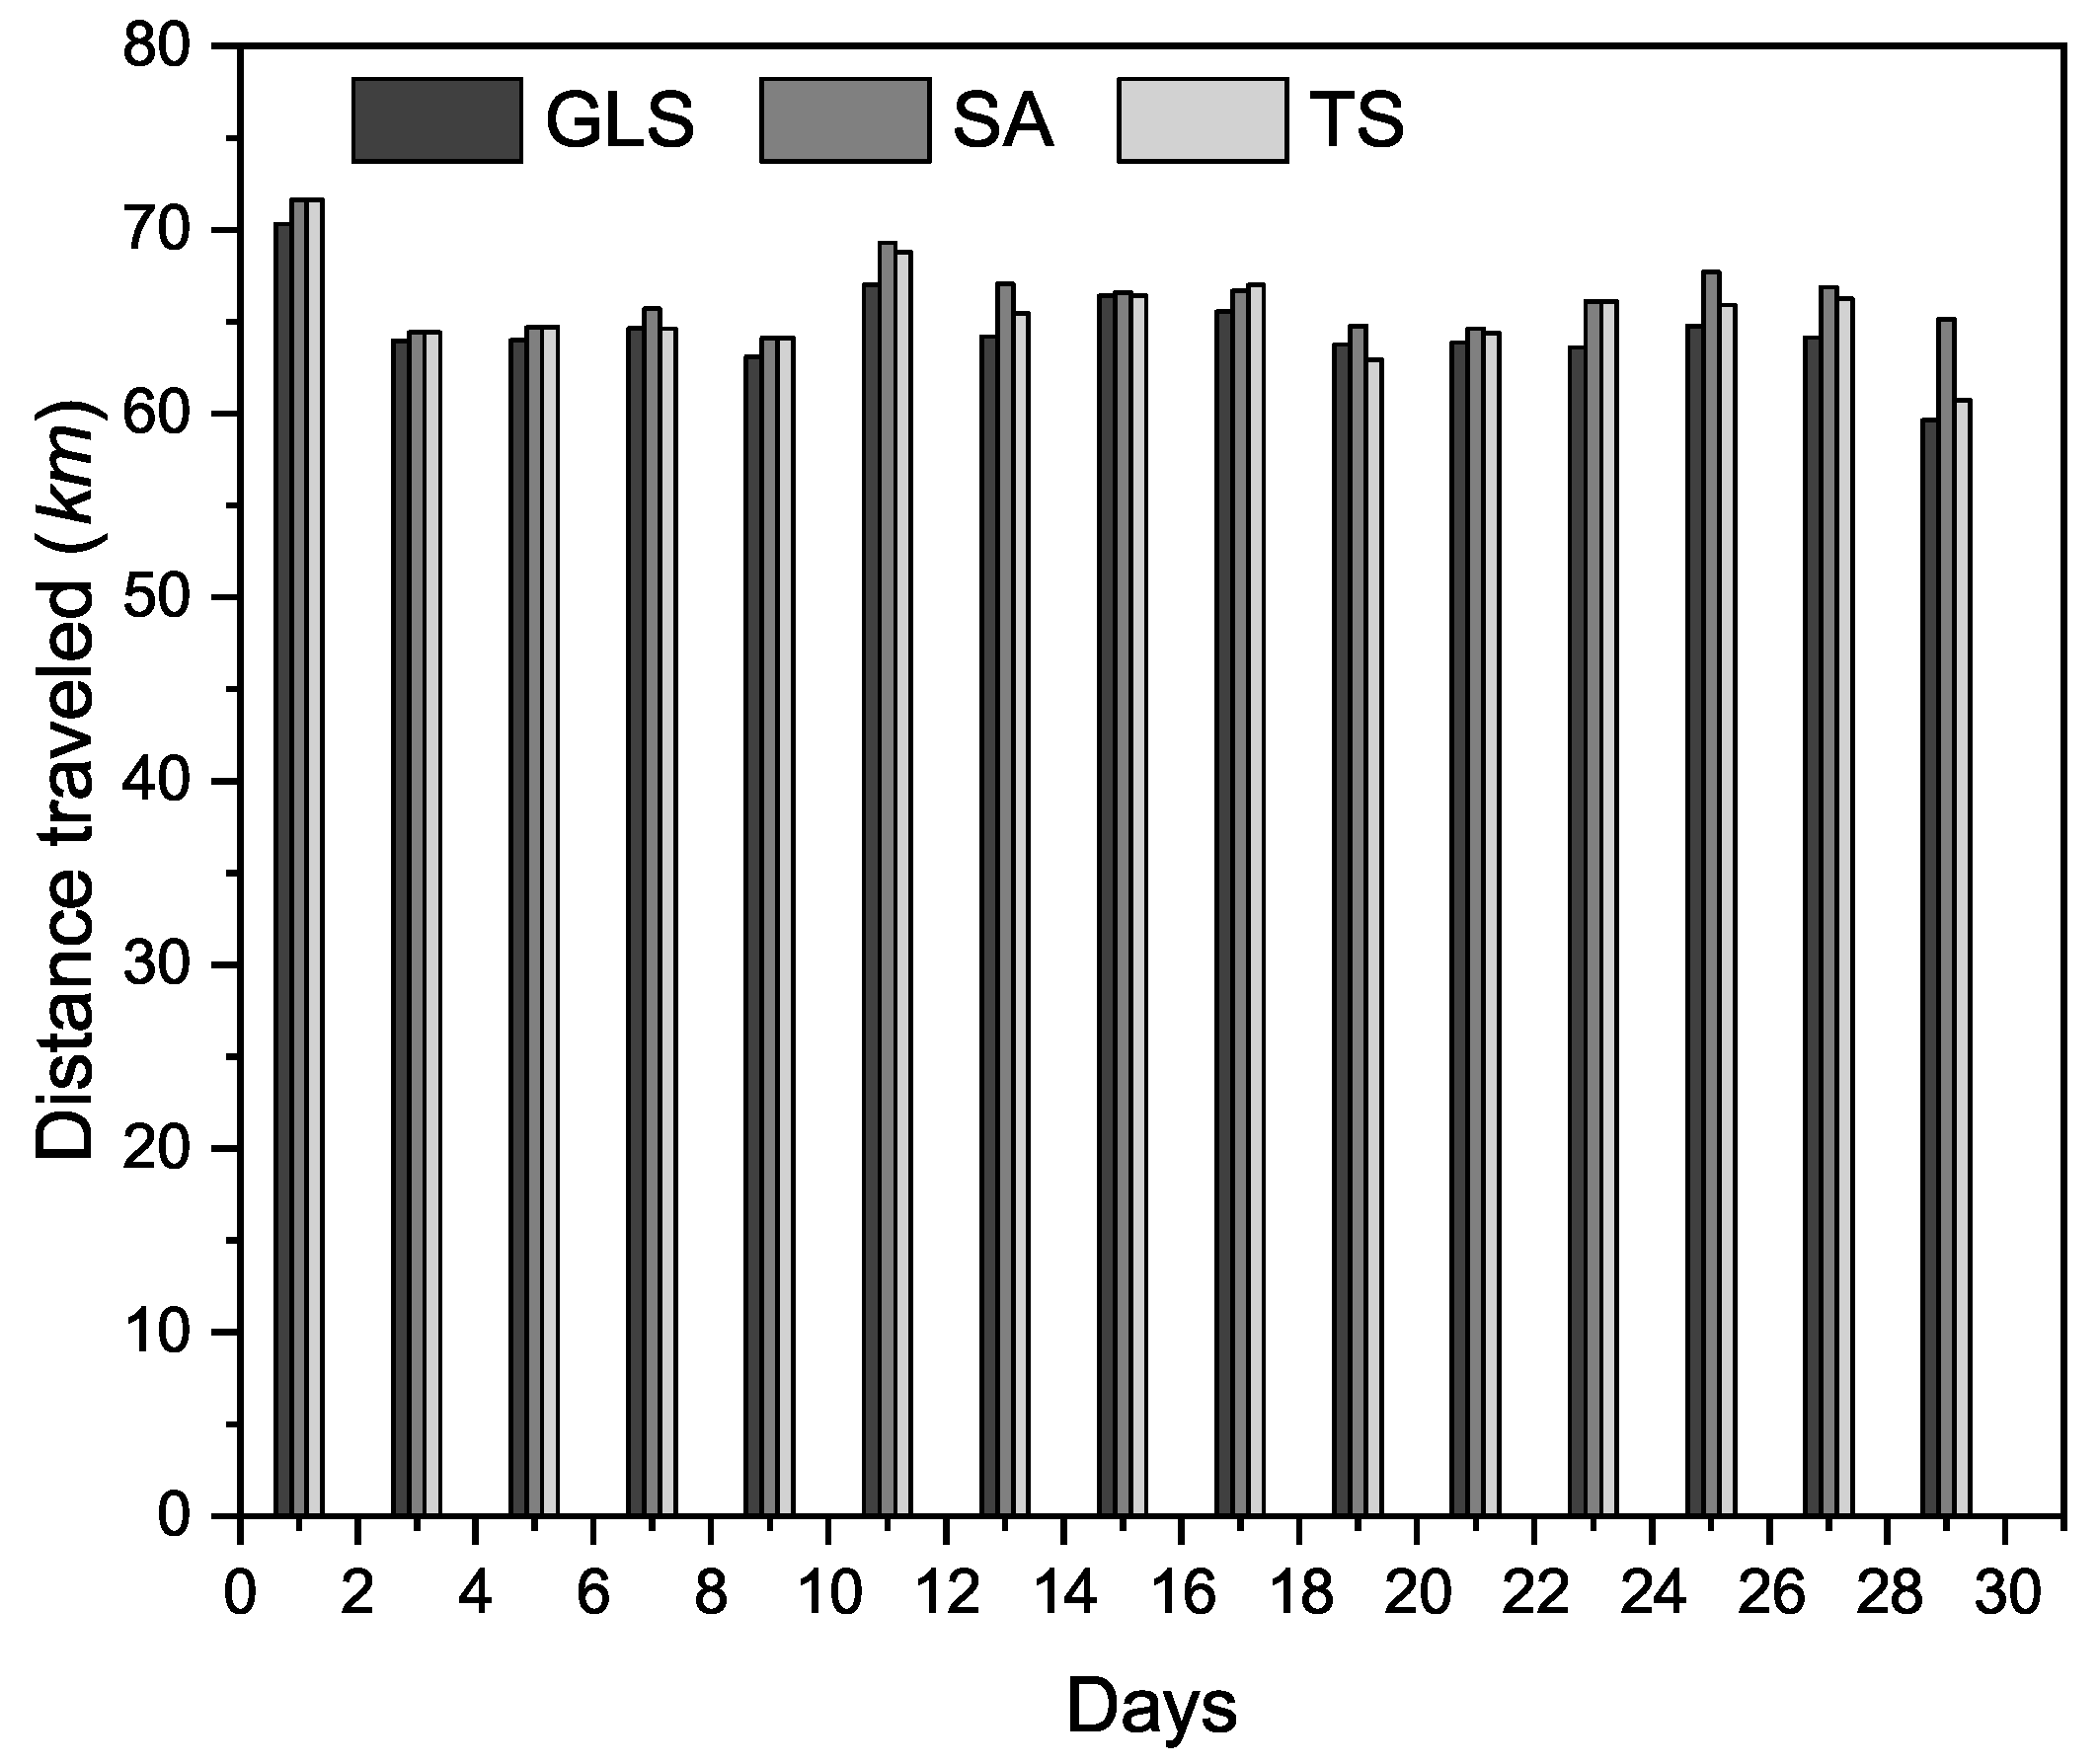
According to the proposed mechanism for waste collection, that is, collect all dumpsters once every 2 days, the amount of waste collected in each algorithm will be the same passed the studied period. The levels inside each dumpster are important because they are part of the decision making in each metaheuristic to find the best route. On the other hand, each algorithm returns one route option to proceed with the collection in collection days, which results in different distances traveled. The distance traveled by all trucks for collecting the waste is shown in
Figure 14 for each metaheuristic.
The results obtained for each algorithm shows few differences. For instance, the average distance traveled using GLS, SA, and TS were 64,591.4, 66,359.1, and 65,563.1 km, respectively. Considering each collection day, GLS had an advantage over others on 12 days. Meanwhile, SA and TS performed better route optimization for collection on 1 and 3 days. The execution time needed to find the solutions was also studied to properly evaluate the efficiency of the metaheuristics.
Figure 15 summarizes the distance traveled in each algorithm during the studied period, along with the execution time. All algorithms were run in a 16 GB RAM computer with an 11th Gen Intel Core i7 processor.
The total distances traveled and execution time result confirms that GLS is the best algorithm in OR-Tools for route optimization in waste collection operations. Particularly, the total distance traveled using GLS is 1.48% and 2.66% lower than the result obtained considering TS and SA, respectively. The execution time should be considered because the utilization of computational processing represents an expenditure of money, which is important to consider in real systems comprised of more locations with dumpsters to be served. The tool available in Google OR-Tools also allows the user to visualize the path followed by each truck and the fulfilling profile for the truck. Aligned with this possibility, a graphical representation of the routes for each truck was made for the day with the highest differences between total distances traveled (day 29). This day was found by calculating the standard deviation among the 3 distance values for each collection day.
Figure 16 illustrates the paths, along with the fulfilling profile for each truck.
As shown in
Figure 16, each algorithm has a specific path for the trucks to perform the collection operation. Furthermore, two trucks could remain at the central depot on this specific day since the collection operation scheme involved using three trucks. The fulfilling scheme for each truck also proves the effect of capacity constraints, with trucks traveling to the central depot to unload the cargo and returning to continue the collection of waste.
Figure S1 brings the separate routes for the trucks according to each algorithm for those interested in more detailed visualization of the routes proposed for each truck.
4.3. Comparison with Real Scenario
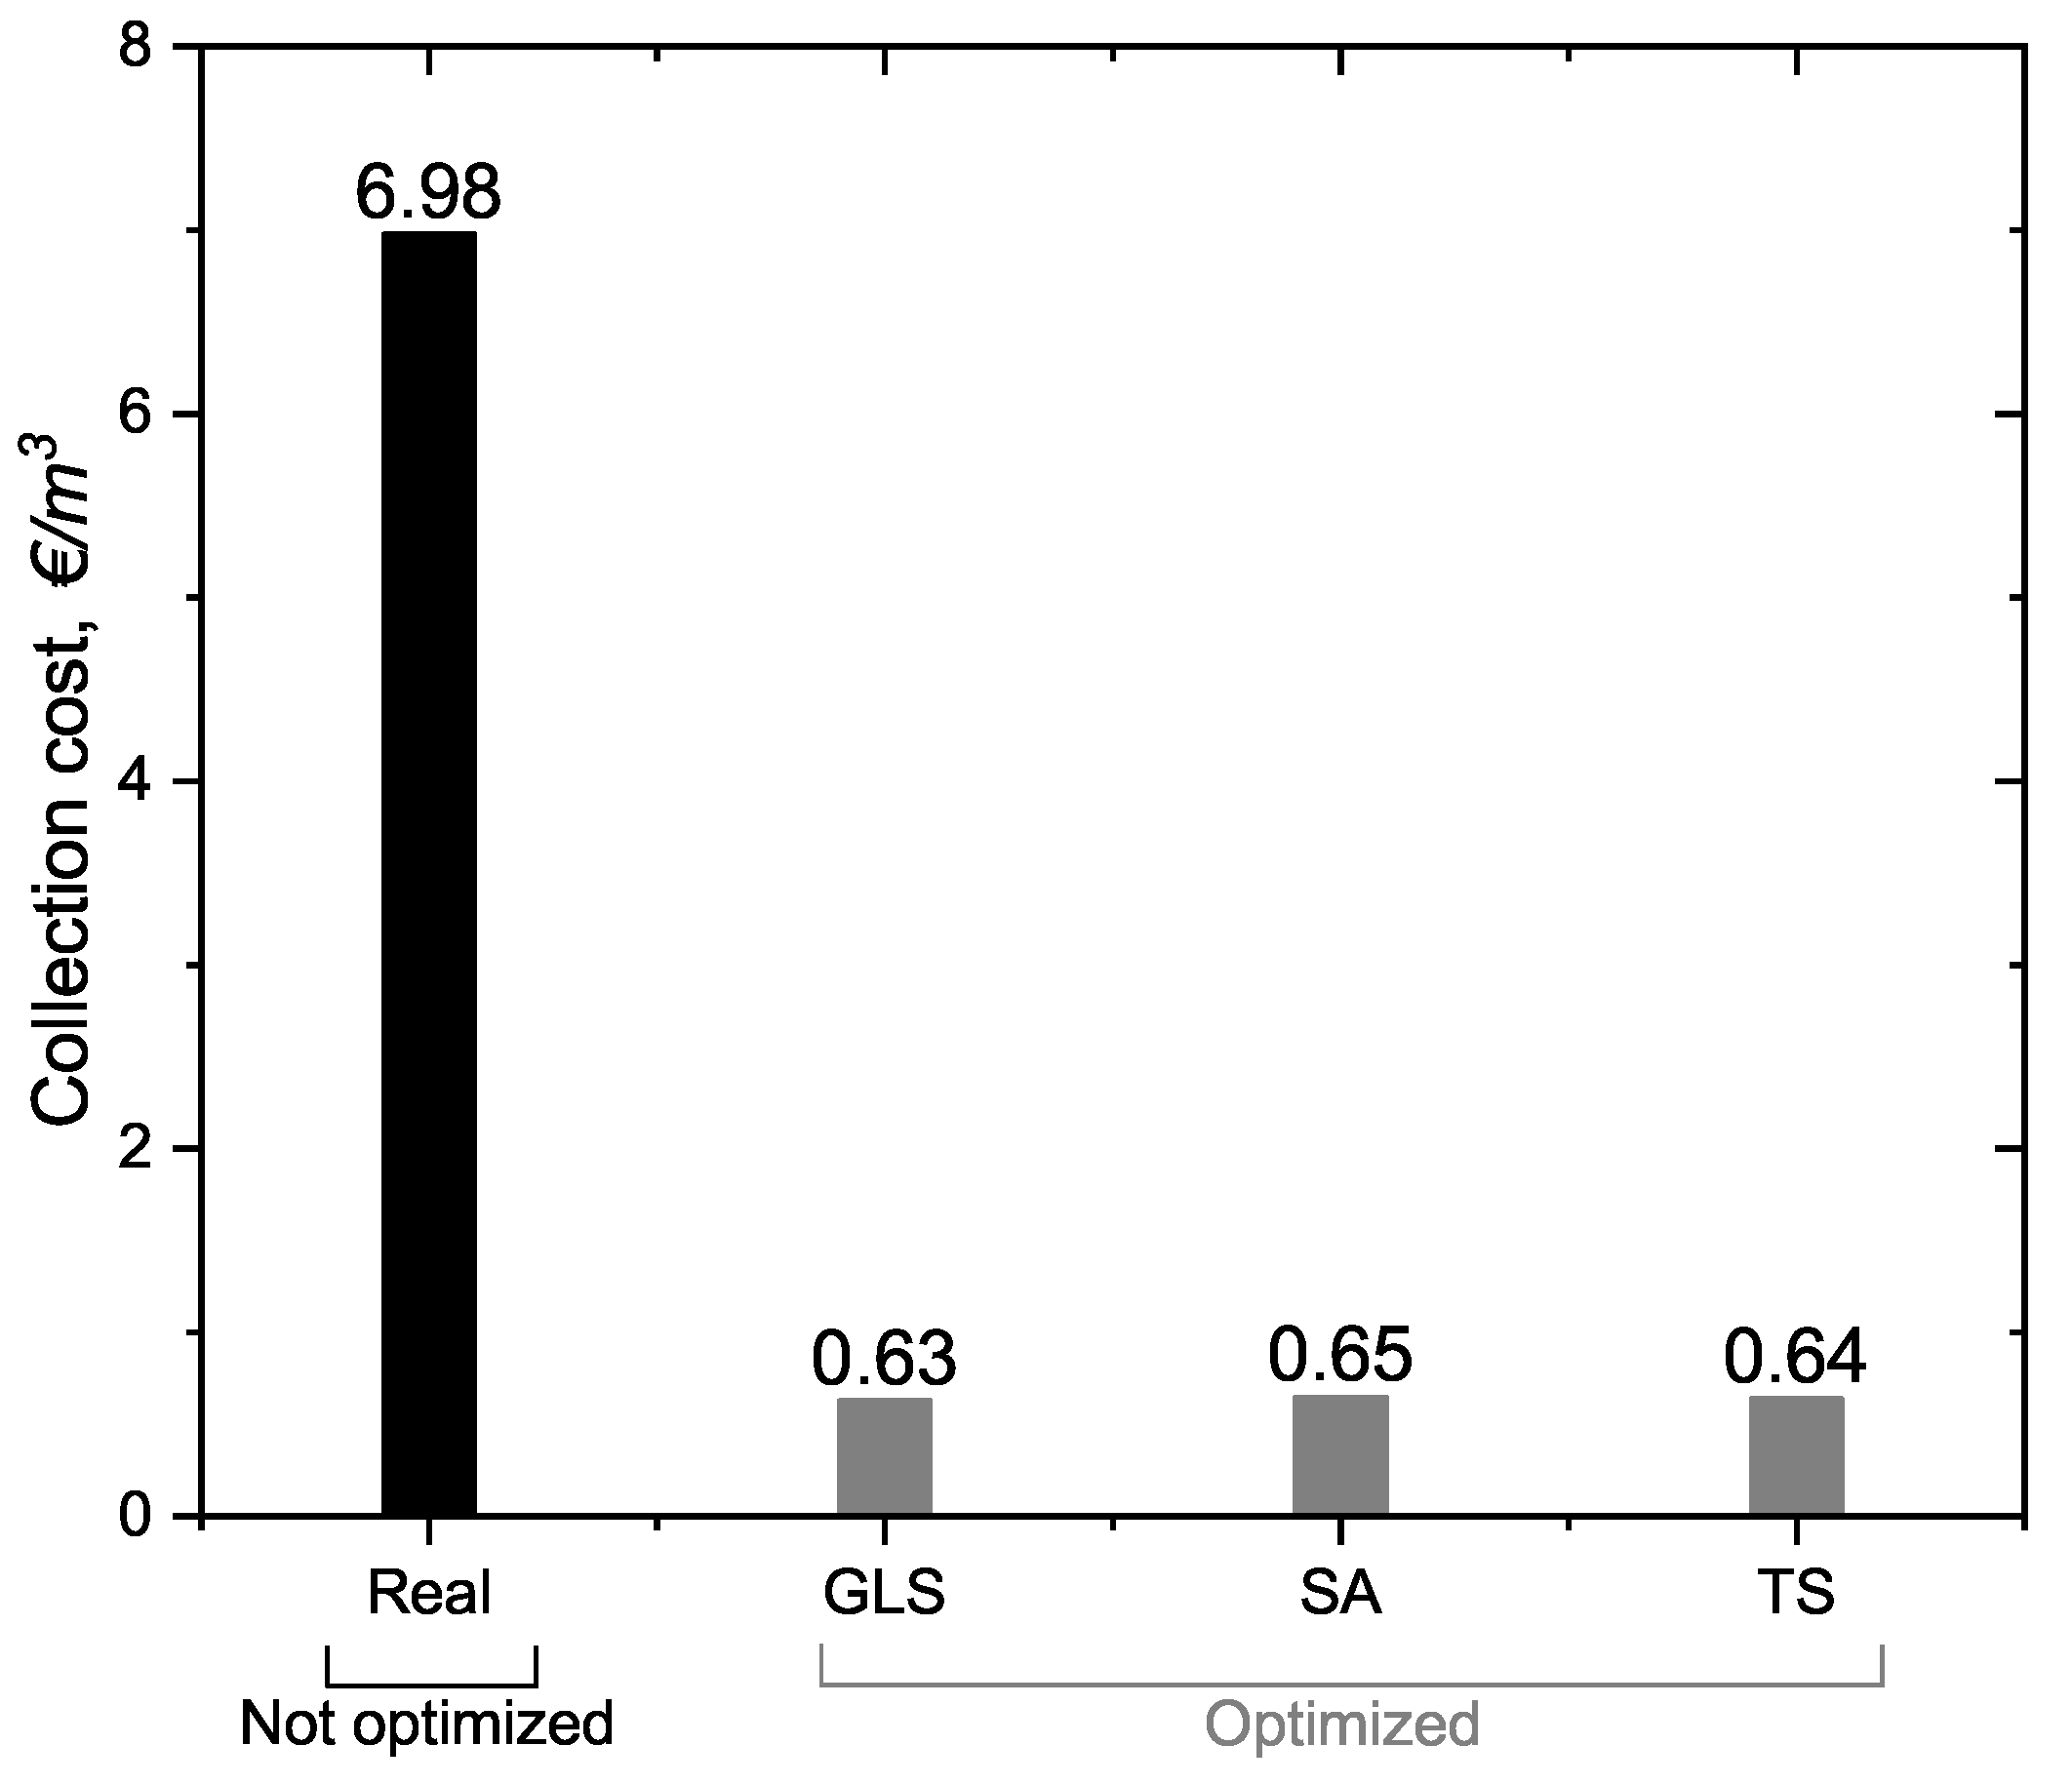
The results obtained for waste collection optimization using the three metaheuristics available in Google OR-Tools showed few differences in kilometers traveled. Nonetheless, it is important to highlight that all algorithms work with route optimization, so the differences between their responses will not be high. In this case, the result obtained for each one should be enough to overcome nonoptimized real-case scenarios. A comparison with the real scenario was performed to confirm that all metaheuristics deliver a better solution than the one found in nonoptimized scenarios. The real data provided by the company include the annual amount of waste collected per type in the selective collection of waste in 2020, the amount of fuel spent by each truck, and the distance they traveled to collect the waste. The real system comprises many trucks and dumpsters, and the fleet collects paper and plastic wastes on different days. In this scenario, comparing the real waste collection operation in the region of interest with the results obtained here requires a correlation parameter that fits both systems (real and simulated). Therefore, here, we used the collection cost (CC) to evaluate the efficiency of collection operation in the systems. This parameter represents the connection between the amount of waste collected and the distance traveled to collect this waste.
Data provided by the company for the amount of waste collected comes in mass unity, and the system used here to simulate waste generation returns volume units. The conversion of data from mass units to the volume of waste collected annually was performed based on reported literature that has the average density of paper and plastic waste [
56]. The fleet of vehicles is composed of vehicles that use regular gas as fuel, and gas consumption was considered homogeneous for this analysis because the algorithm does not consider fuel consumption to ascribe routes to trucks. The average gas price was obtained considering average gas prices from 2020 reported by the regulatory entity of energy services in Portugal (ERSE, see
www.erse.pt, accessed on 5 October 2022). The result obtained for collection costs according to the solutions of metaheuristics and real scenario is shown in
Figure 17.
There is a considerable difference between the collection cost of the real system and the collection cost calculated based on the route optimized situations. However, it is important to highlight that real collection cost was determined based on estimates of the average waste collection during the period studied here. Furthermore, the waste density used to convert from mass to volume units differs from the waste in the region studied. On the other hand, efforts to achieve a higher degree of similarity between the systems guarantee that one premise from this result is true: there is a lot of space in the room to save resources in waste collection operations in Bragança. In a previous study, the same evaluation was performed considering a smaller system composed of 20 dumpsters [
57]. The metaheuristics in that case achieved collection costs of 0.50, 0.51, and 0.52 €/m
3 for GLS, TS and SA, respectively. The comparison of the results shows the scalability of this solution, considering that increasing 150% of dumpsters in the system resulted in an increase of 26.01, 25.49, and 23.07% the CC for GLS, TS, and SA, respectively.
4.4. Insights of the Numerical Results
In brief, the strategy adopted to simulate waste oscillation throughout the days fulfilled both desired criteria: the dependency on the area where dumpsters are located and the stochasticity of waste generation. The criteria could be verified through the demonstrated correlation between the demographic factor of dumpsters with the amount of waste generated and the high standard deviation observed for all locations. The computational results obtained for the best route according to the metaheuristics showed differences that might seem small. Still, considering bigger systems, the difference can result in higher savings considering the algorithm with the best performance. The difference observed can be ascribed to the compatibility of the algorithm with the problem approached, which is deeply dependent on the search mechanism adopted by the algorithm.
SA search mechanism is random and exploits the metal cooling in the annealing process, in which the metal goes from a high to a lower temperature. In this process, the material seeks minimum energy in the crystalline structure, ensuring higher stability. In practice, the search will work like a bouncing ball, for which the dimension of the bounce will depend on the temperature. In the beginning, the temperature is high, and the bouncing process will run a higher search space. The ball will become trapped in a relatively small range as the temperature cools down [
58]. TS is a nonmetaphor-based metaheuristic for which the search mechanism is based on prohibition. In brief, the main driving idea behind TS operation is related to the “taboo" of visiting some locations already visited in early iterations [
42]. GLS operates the search based on penalties. The main idea behind the search mechanism for this metaheuristic is related to penalizing the solutions that are unlikely to be part of a near-optimal solution. In practice, the algorithm will penalize long distances between consecutive stops for routing optimization. GLS and TS have similar search mechanisms since both are nonmetaphor-based metaheuristics. The difference is that constraints in TS refer to moves and are implemented as lists. On the other hand, constraints in GLS refer to solutions features, taking the form of penalties that augment the cost function [
59].
The computational results for route optimization and collection costs confirmed that GLS is the best metaheuristic available in OR-Tools, followed by TS and SA. This result shows that for routing problems under capacity constraints, the search mechanism based on penalty overcomes the results obtained for the search mechanism based on cooling temperature and tabu list. From the results, nonmetaphor-based algorithms performed better than SA, an algorithm based on the cooling equation of metals in the annealing process. In the literature, another work was also reported comparing the performance of TS and SA, for which TS also performed better [
60]. From the results, it is clear that a search mechanism based on the evaluation of previously visited candidates is preferred to solve waste collection problems with capacity constraints. Additionally, the best performance observed for GLS compared to TS can be explained by how hard is to override the constraint in each metaheuristic. For instance, TS constraints are hard and can only be overridden by another mechanism that is considered complementary (aspiration criteria). In contrast, GLS constraints are soft and can be overridden by definition.
5. Conclusions
This paper shows the great performance of open-source Google OR-Tools for solving a real capacitated waste collection problem (CWCP) in Bragança, Portugal. The MSW generation model respected the demographic factor used as a driving agent for paper waste generation. Furthermore, as desired, the stochastic characteristic was also present in waste generation.
The route optimization step in this work involved the utilization of three metaheuristics (GLS, SA, and TS) available in OR-Tools. The collection criteria were defined to put the algorithms under stress, collecting all waste once every two days. The numerical results showed that all algorithms perform satisfactorily to find the best route considering capacity constraints and keeping the relation between dumpster/truck similar to the real system. Despite a few differences, GLS has proved to be the best metaheuristic algorithm available in OR-Tools to solve the CWCP. The tool also allowed the verification of each path followed by trucks and the amount of waste inside the trucks at each stop. This feature enabled a graphical representation of routes as well as a representation of filling profiles for the trucks. Furthermore, comparing the results obtained considering the simulated scenario with real results showed how powerful this strategy could be in saving resources in the real SWMS.
The mathematical model used in this work to approach waste collection considers only capacity constraints to find the shortest path, which is one limitation due to the complexity of real waste collection tasks. For instance, another important parameter to be considered is time—not only time windows commonly found in the literature (that are also important) but also the working hours of the people in charge of driving and collecting waste. In this regard, for future works, time constraints will be considered to increase the compatibility between the studied scenario with the real waste collection operation. Furthermore, improvements in the study of dynamic routings are required for waste collection tasks due to the dynamic nature of waste levels inside dumpsters. The current approaches explored are static and might return good results. However, the real scenario is dynamic. Adapting the algorithms to perform in dynamic scenarios will probably return even more sophisticated and better solutions to save resources and avoid pollutant emissions due to the circulation of trucks moved by petrol.


 ,
, 


