Article

Application of Feature Selection Approaches for Prioritizing and Evaluating the Potential Factors for Safety Management in Transportation Systems

by
Giuseppe Guido
*,
Sami Shaffiee Haghshenas
,
Sina Shaffiee Haghshenas
,
Alessandro Vitale
and
Vittorio Astarita
Department of Civil Engineering, University of Calabria, Via Bucci, 87036 Rende, Italy
*
Author to whom correspondence should be addressed.
Computers 2022, 11(10), 145; https://doi.org/10.3390/computers11100145
Submission received: 31 August 2022 / Revised: 20 September 2022 / Accepted: 21 September 2022 / Published: 23 September 2022
(This article belongs to the Special Issue Machine Learning for Traffic Modeling and Prediction)

Abstract

:
Road safety assessment is one of the most important parts of road transport safety management. When road transportation networks are managed safely, they improve the quality of life for citizens and the economy as a whole. On the one hand, there are many factors that affect road safety. On the other hand, this issue is a dynamic problem, which means that it is always changing. So, there is a dire need for a thorough evaluation of road safety to deal with complex and uncertain problems. For this purpose, two machine learning methods called “feature selection algorithms” are used. These algorithms include a combination of artificial neural network (ANN) with the particle swarm optimization (PSO) algorithm and the differential evolution (DE) algorithm. In this study, two data sets with 202 and 564 accident cases from cities and rural areas in southern Italy are investigated and analyzed based on several factors that affect transportation safety, such as light conditions, weekday, type of accident, location, speed limit, average speed, and annual average daily traffic. When the performance and results of the two models were compared, the results showed that the two models made the same choices. In rural areas, the type of accident and the location were chosen as the highest and lowest priorities, respectively. According to the results, useful suggestions regarding the improvement of road safety on urban and rural roads were provided. The average speed and location were considered the highest and lowest priorities in urban areas, respectively. Finally, there was not a big difference between the results of the two algorithms in terms of how well the algorithm models worked, but the proposed PSO model converged more quickly than the proposed DE model.

1. Introduction

Road transportation systems are one of the oldest ways to get people and goods from one place to another. They also play an effective role in helping countries grow and improve social welfare. As a result of the increasing volume of urban and rural travel in recent decades, problems related to road transport such as accidents, unconventional traffic, and environmental pollution have significantly increased. Hence, they are considered continuous problems for traffic engineers [1,2]. Vehicular accidents represent one of the greatest threats because of their social cost, both in urban and rural contexts. An increase in the frequency of accidents leads to a corresponding increase in the need to reduce the impact of crash occurrences or even outright prevent them. The factors affecting traffic accidents are several (weather, roadway geometrics, human error, etc.), and it can be difficult to determine the causes of an accident event. In addition, it is very important to know what actions are to be taken to mitigate accident occurrences [3,4,5]. Traditionally, road safety studies only looked at where deaths happened and did not investigate the main factors that affected how severe they were. This made it hard to understand the benefits of safety measures [6]. Road safety assessment is one of the most important and necessary issues in road transport; it has been extensively studied by adopting traditional approaches based on advanced statistical analysis [7,8,9,10,11,12,13] and innovative approaches through the use of simulation techniques and the adoption of techniques of artificial intelligence [14,15,16,17,18,19,20]. Even though many studies have been conducted in the field of road safety, it is a complicated issue with many uncontrollable parts and factors, so more research is needed in this area. Due to the complexity of road safety and its components, the use of approaches such as artificial intelligence techniques can play an effective role in more accurate assessments. This is because artificial intelligence (AI) is a powerful tool that can be used to study complex phenomena without making any prior assumptions about the model [21,22,23].
Zeng et al. [24] created neural network models to examine the nonlinear connection between accident frequency using severity and risk variables. For this purpose, they first suggested a structure optimization approach to enhance generalization performance, and then they suggested a rule extraction algorithm to highlight the impacts of the influencing elements. Their findings supported the assumption that variables are nonlinearly related to accident frequency by severity. Halim et al. [25] provided a thorough review of the many artificial intelligence methods that have been utilized in the literature to both analyze and predict dangerous driving behaviors. The literature reviewed in this essay dates from 2004 to 2014. The identification of risky driving behavior and accident prediction were investigated using AI approaches. They also offered a list of datasets and simulations that the scientific community may use to carry out studies in the area. Ait-Mlouk et al. [26] investigated association rule mining, a broad data mining approach that might anticipate accidents in the future and help drivers steer clear of threats. Finally, a survey was done on road accidents in Morocco between 2004 and 2014 based on their proposed method. The results showed that the proposed method worked well. Fernandes et al. [27] focused on the development of a vulnerable road user (VRU) social machine to assess VRUs’ behavior in order to improve road safety. Based on their study, the formal backdrop utilized Logic Programming to describe its architecture based on deep learning and evolutionary computing. Based on their results, they made some recommendations for using evolutionary computation in road safety. Xu et al. [28] used an artificial neural network to figure out how road lighting affects traffic safety at access points. Their findings demonstrated the profound effect that road lighting has on access point road safety. Additionally, when there are more lanes or faster moving vehicles, the impact of road lighting is greater. Silva et al. [29] modeled road safety using several machine learning techniques. Their results showed that machine learning techniques can be reliable systems in crash analyses. Boukerche et al. [30] conducted an investigation to predict vehicular traffic flow using two kinds of prediction methods, including statistics-based and machine learning (ML)-based. Finally, they introduced the characteristics of both methods and discussed the limitations and capabilities of the two types of methods. Afework and Sipos [31] employed the artificial neural network technique to simulate accidents for four lane non-urban highways. They created an accident prediction model that had high accuracy for accident prediction analysis. Guido et al. [32] investigated road safety by using stochastic models. For this purpose, they evaluated 154 accident cases with two clustering techniques. Lastly, it was found that PSO modeling performed better than GA modeling when it came to looking into road safety. In another study, Guido et al. [33] evaluated 775 crash cases. They developed a binary classification model to assess the safety of road transportation. Their results showed that binary classification modeling can be applied as a powerful tool for evaluating road safety. A road safety analysis was carried out for accident prevention by Tonni et al. [34]. They introduced an AI-based driver vigilance system for helping drivers with crash prevention.
As reviewed, there have been many studies done on road safety, but it is a complicated issue with a lot of unknown parts and factors, so more research is needed. To close this gap, the paper aims to provide information on factors influencing accident occurrences in both urban and rural settings. The study of the scientific literature showed that ANN has been widely utilized to forecast accident severity and is therefore a promising new modeling approach in the area of traffic safety. Therefore, the overarching goal of this research is to investigate the potential of optimizing ANN performance. Another goal of this study is to test two distinct artificial intelligence methods for predicting crash severity and then to contrast their relative efficacy. Hence, two data sets with 202 and 564 accident cases for urban and rural areas of Cosenza, in southern Italy, were selected and evaluated. The accident dataset was extracted from the database of the Automobile Club Italia (ACI), which collaborates with the National Institute of Statistics (ISTAT) in collecting road accident data in Italy. The ACI-ISTAT crash database was integrated with that of the “Regional Center for the Collection of Data on Road Accidents in Calabria—CRISC” [35].
This paper’s remaining sections are structured as follows. Section 2 provides a brief overview of artificial intelligence techniques and then explains the case study and how to gather the dataset. Section 3 constructs models and discusses the results. In Section 3, a sensitivity analysis is also conducted. The conclusion and suggestions for further research are presented in Section 4.

2. Methodology

In the scientific literature, most of the statistical models used to predict road accident severity and, consequently, contributing factors are regression methods such as choice models and logistic regression models [36,37,38]. These models are frequently built on predefined relationships and assumptions, which can have a significant impact on the accuracy of the results. To overcome these limits, the present study used two different types of AI techniques based on ANN. Based on an analysis of the scientific literature, it became clear that ANN has often been used to predict crash severity. It can be thought of as a new modeling technique in the field of traffic safety. Accordingly, the goal of this study is to use the capabilities of optimization algorithms to take into account the possibility that the optimization approach could help improve the performance of an ANN. In particular, on the one hand, the Particle Swarm Optimization showed better performance in real function optimizations; on the other hand, the application of a hybrid approach for ranking of road crash severities using the Differential Evolution (DE) algorithm and ANN generated very good results. Therefore, another objective of the present research is to apply two types of AI techniques to crash severity prediction and subsequently compare them to determine which approach performs better.
It should be noted that performance indicators are a useful tool for evaluating the performance of algorithms in modeling. Therefore, in this study, the mean squared error (MSE) is used to evaluate the performance of algorithms that calculates the average squared deviation between the observed and predicted values based on Equation (1). In fact, MSE is introduced as the best cost (minimum cost) in the modeling process, and the lower this value is, the better the performance of the algorithms in modeling.
M S E = 1 n i = 1 n ( y i y ^ i ) 2
where y i and y ^ i are the ith observed value and the corresponding predicted value, respectively. The number of observations is represented by n.

2.1. Artificial Neural Networks (ANNs)

In recent decades, artificial intelligence has played an effective role in the development of various sciences and industries [39,40,41,42,43]. Artificial neural networks (ANNs) are an intelligent method to model problems, analyze them accurately, and find the best solutions. They have been studied and used in many scientific and industrial fields [44,45,46]. ANN is computational system that operates to process information by modeling the mechanism of the human nervous system [47]. One of the most efficient models of existing neural networks is the multilayer perceptron (MLP), which is inspired by the behavior of human brain networks and the propagation of signals in the human brain and is also called the feedforward network [48]. The back-propagation (BP) algorithm is one of the most effective algorithms for training ANN [49]. The feed-forward back-propagation neural network (BPNN) falls into the category of supervised learning techniques and consists of at least three layers. The first to third layers are called input layer, hidden layer, and output layer, respectively [50,51]. The number of neurons in the input and output layers is equal to the number of inputs and outputs of the problem, respectively. The number of neurons and the number of hidden layers vary based on the characteristics of the problem [52]. Then, the predicted value of the output of the problem is compared with the actual value of the problem in the output layer. During the processing of data, the biases of the individual neurons and the individual weights of the connections are updated when the difference between predicted and actual data is propagated back through the network [53,54]. In fact, in BP, one output is made during each epoch by swapping input signals between the computational nodes of successive layers. In order to get the net weighted input (netj) that each node receives, Equation (2) is used as follows:
n e t j = i = 1 n x i   w i θ
where the number of inputs is denoted by n, the input signal and weight for the ith node by xi and wi, and the threshold for the nodes is denoted by θ . This net input is sent via an activation function (such a step, sigmoid, or linear function). This process keeps going until the algorithm finds the best answer with the fewest errors [55]. In this study, two meta-heuristic algorithms are applied to train the multilayer perceptron neural network, which are explained in the following sections.

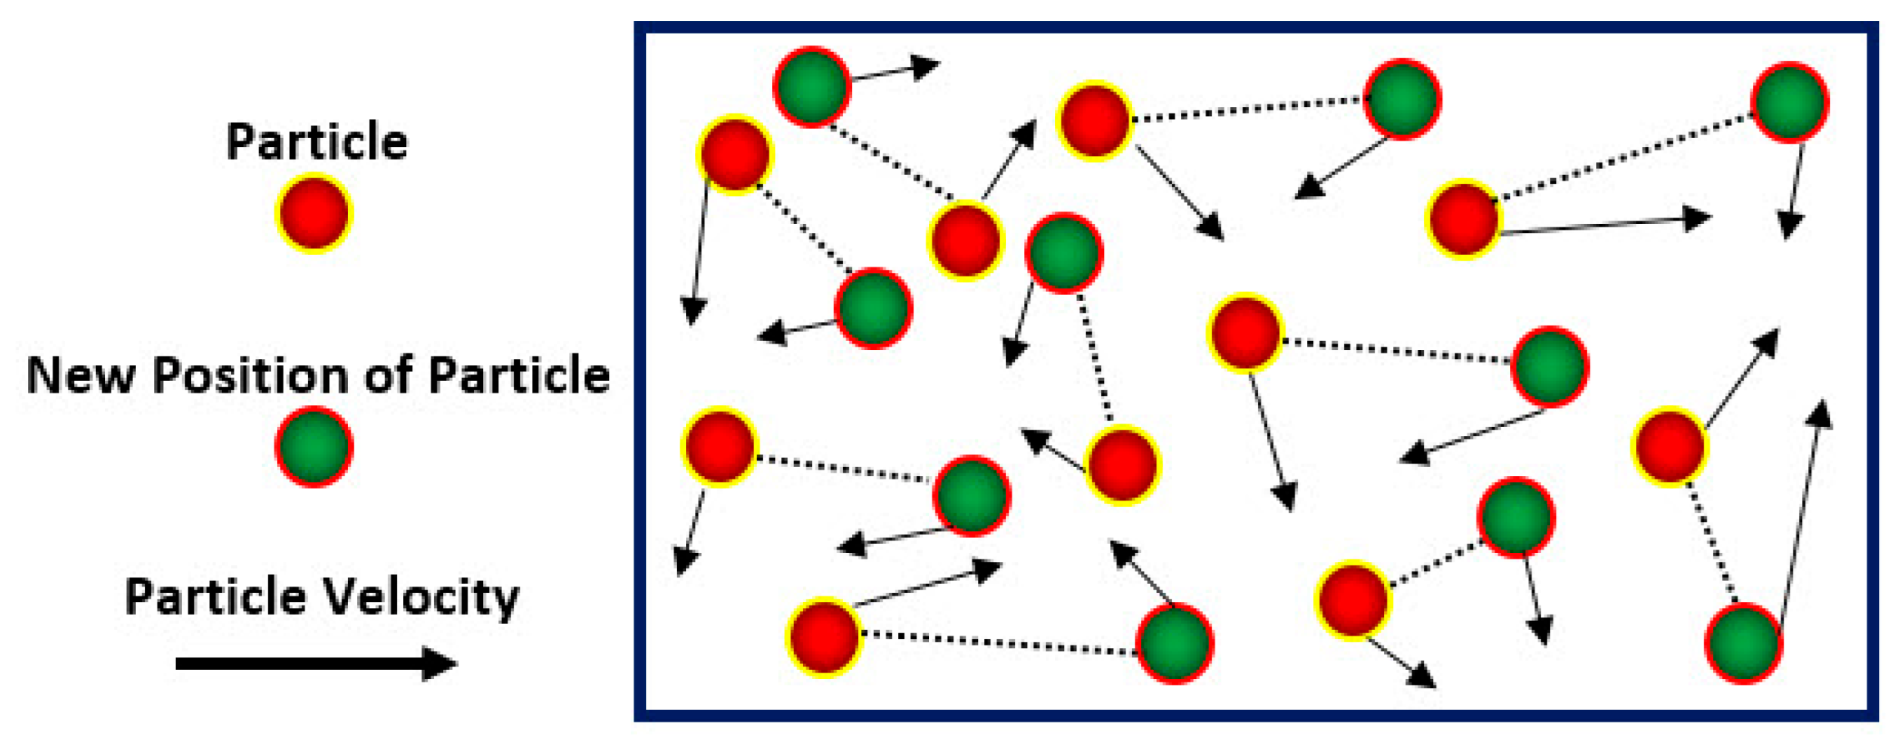
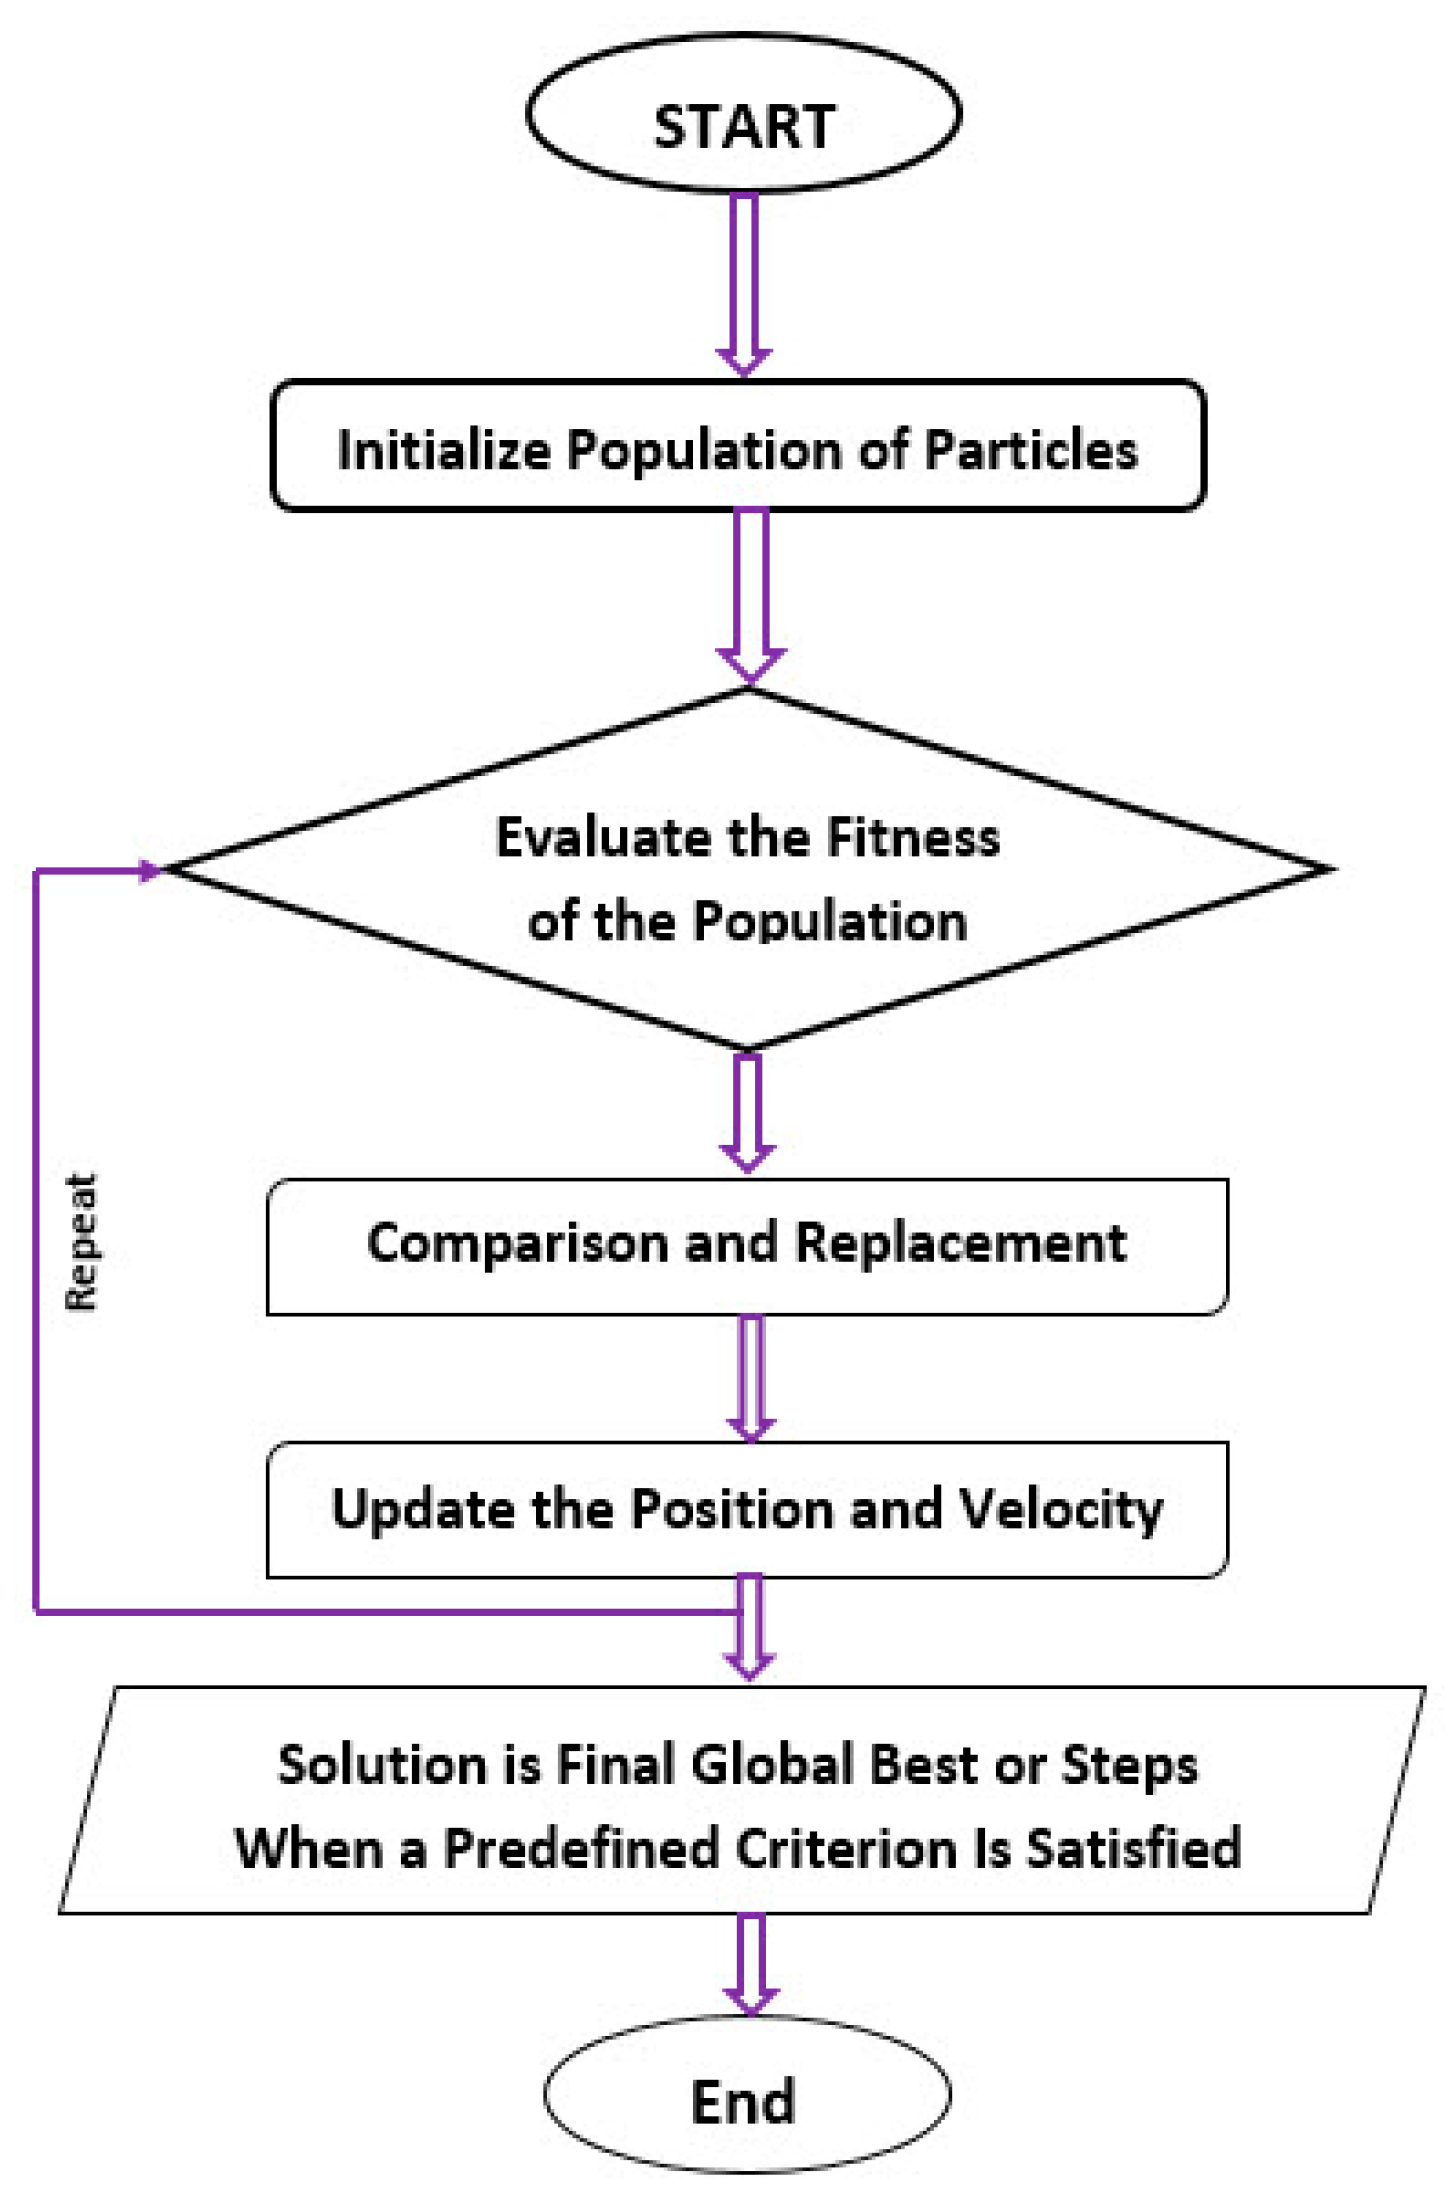
2.2. Particle Swarm Optimization (PSO)

Particle swarm optimization (PSO) is an efficient population-based optimization method that is widely used for dealing with complex systems in computational science [56,57,58,59]. The concept of this algorithm is based on swarm intelligence (SI) and inspired by the social behavior and movements of a bird flocks or fish schooling [60]. In 1995, it was introduced and developed by Kennedy and Eberhart [61]. In the process of optimizing the algorithm, a set of solutions is randomly created in a D-dimensional community or search space [61,62]. It should be noted that each answer (solution) is considered a particle. There is a position vector and a velocity vector for each particle. These vectors demonstrate the direction and velocity of each particle, respectively. In determining the best optimal solution, two factors, including the personal best position (Pbest) and global best position (Gbest), are considered in the velocity vector [57,58]. Figure 1 shows the motion of a set of particles and their locations in new positions. Equations (3) and (4) show how the velocity vector and position are updated, respectively [63].
V i ( k + 1 ) = w V i k + c 1   r 1 · ( p b e s t i X i k ) + c 2   r 2 · ( g b e s t X i k )
X i ( k + 1 ) = X i k + V i k
where V i ( k + 1 ) and X i ( k + 1 ) are the new velocity vector and the new position vector, V i ( k ) and X i ( k ) represent the current velocity and position, w is the inertia weight, which has impact on in controlling the current velocity vector on the new velocity vector; it can vary between 0.4 to 0.9. r1 and r2 are two random parameters within [0, 1], and c1 and c2 are two positive constants, which are called the individual learning factor and the social learning factor. The values of c1 and c2 are determined by experts and based on experience as the learning factor [60]. In addition, Equation (5) should be met. The flowchart of the process optimization of the PSO algorithm is shown in Figure 2 [64].
c 1 + c 2 4

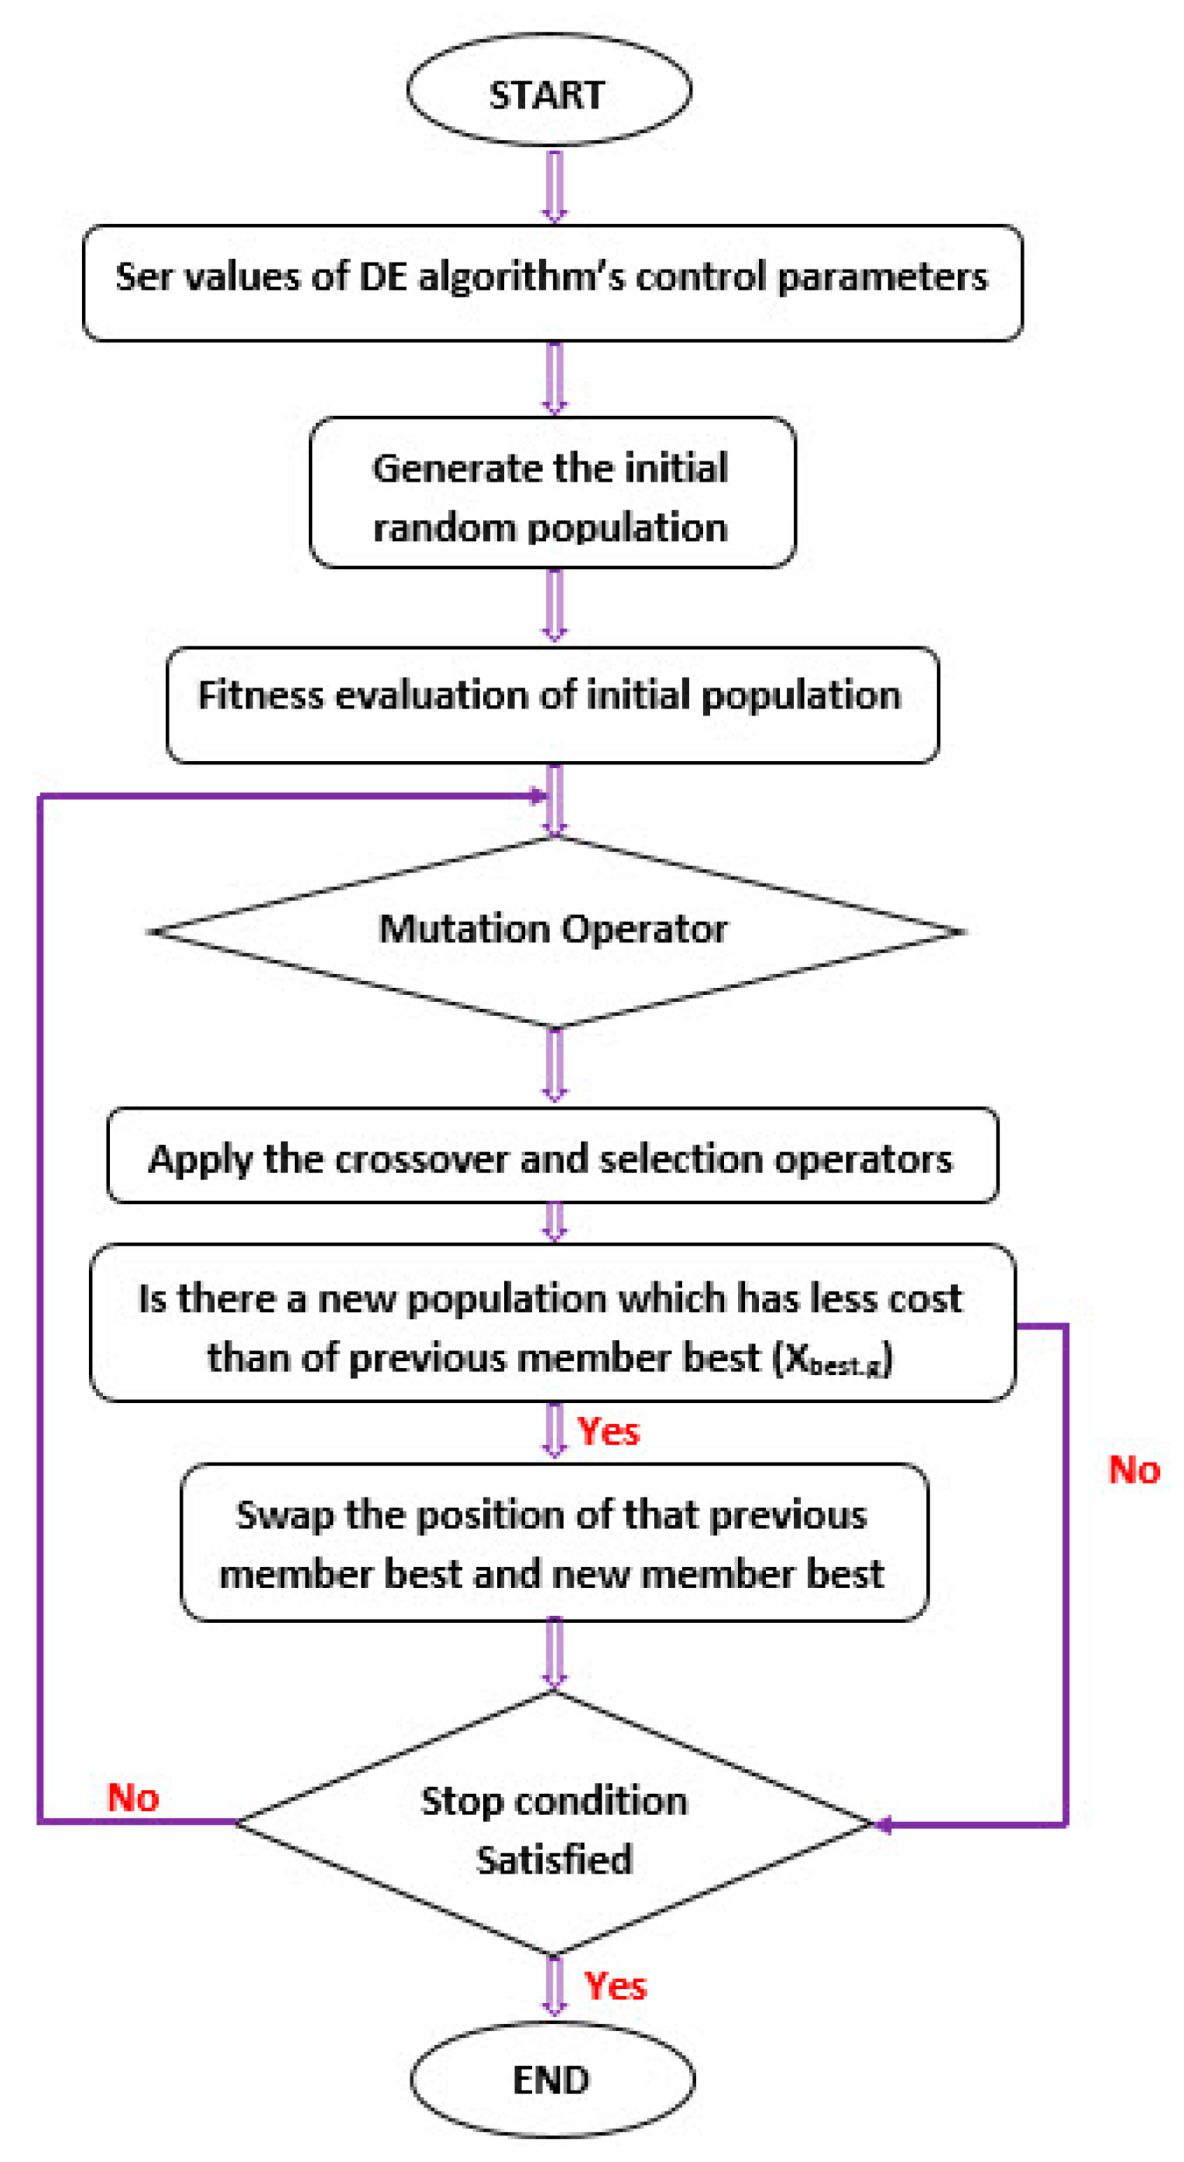
2.3. Differential Evolution (DE)

Differential evolution (DE) is a simple and effective population-based metaheuristic search algorithm that was introduced by Storn and Price in 1995 for solving problems with continuous values, and then it was developed for solving binary and discrete problems [65,66]. Gradient information is not required in the DE algorithm, which means that the optimization problem does not need to be differentiable [67]. The DE algorithm has been used successfully in dealing with uncertainty for modeling complex problems, and it can be a reliable and robust algorithm for training ANN [68]. In the optimization process of the DE algorithm, a random initial population is generated like in a genetic algorithm. The next generation will be generated, and the best generation will be selected. In this process, there are four operators, including initialization, mutation, crossover, and selection. It should be noted that in the process of generating new generations and mutation operators, the DE algorithm differs from the genetic algorithm [68]. After generating a random initial population in the initialization step, the search space is developed by the mutation, where V i g represents the mutant solution vector of X i g . Equation (6) calculates the value of V i g . The length of the mutation step is determined by F k , which is the scaling factor varying within [0, 1].
V i g = X r 3 g + F k · ( X r 2 g X r 1 g )
where X r 1 g , X r 2 g and X r 3 g represent solution vectors that are randomly chosen, and Equation (7) should be satisfied for these vectors [69].
X r 1 g , X r 2 g , X r 3 g r 1 r 2 r 3 i i = [ 1 , 2 , 3 , , N P ]
where i is the index of the current solution. In the next step, by combining two vectors, including the mutated and the parent vectors, in a crossover operation based on Equation (8), a trial vector ( U i j g ) is produced [69].
U i j g = V i j g R a n d j C R , X i j g R a n d j > C R , j = 1 , 2 , 3 , , n
where Randj is a randomly selected real number. The crossover probability (CR) is a constant in the range of [0, 1]. According to Equation (8), if the Randj is less than or equal to CR, the trial vector ( U i j g ) is considered from the mutant solution vector; otherwise, the trial vector ( U i j g ) is equal to X i j g . Figure 3 indicates the flowchart of the DE algorithm [60].

2.4. Data Description

In this study, two data sets were used to look at and rate potential safety management elements for the transportation system. The data sets included 202 and 564 accident reports from urban and rural Cosenza in southern Italy. The data set of accidents is derived from the records of the Automobile Club Italia (ACI), an organization that works with the Italian National Institute of Statistics (ISTAT) to compile information on traffic accidents around the country. The Regional Center for the Collection of Data on Road Accidents in Calabria (CRISC) database was added to the ACI-ISTAT database [35]. The present study takes into account seven qualitative and quantitative explanatory (independent) variables, of which four are qualitative and three are quantitative. The seven variables were chosen based on all of the available data that could be used as input data for the case study. These variables include light conditions, weekday, type of accident, location, speed limit, average speed, and annual average daily traffic. In addition, the number of vehicles involved in accidents was considered as an output. The variables are coded and described in Table 1.
Based on the available data, seven factors were identified as having important modeling implications. As part of the modeling process, we put in variables at the same time and look at how each one changes the equation. The effects of each possible combination of variables were studied, and the best variables were chosen for the model.

3. Results and Discussion

For modelling, two data sets with 202 and 564 accident cases, respectively, for urban and rural areas of Cosenza, in southern Italy, were gathered for the purpose of investigating and prioritizing potential factors for safety management in the transportation system. For this purpose, seven factors affecting transport safety including the light conditions, weekday, type of accident, location, speed limit, average speed and annual average daily traffic were considered, and the combination of MLP neural network with two meta-heuristic algorithms, namely PSO and DE algorithms, were applied. It should be noted that 70% of the datasets were considered for training, and the rest were selected for validation (15%) and testing (15%) [68]. Additionally, the mean squared error (MSE) was considered for investigation of the modeling performance (best cost of the model’s performance). More discussions regarding the development of the ANN with PSO and DE models to rank potential factors for road safety will be given in the next sections.

3.1. Modelling by ANN-PSO

In the first model, the PSO algorithm was used to train the MLP neural network. In the first step, control parameters of the model should be determined. For modeling to be faster and more accurate, these parameters need to have accurate values [30,31]. In general, there are no specific rules for determining the values of these parameters. Instead, experts and trial and error are used to figure out their values [30,31]. Hence, a set of values was considered for the hidden layer of ANN equal to 5, 10, and 15, the swarm sizes were 5, 10, 15, and 20, and the maximum iteration value was selected as 10, 20, 30, and 40 for the modelling of urban areas. In addition, a set of values was considered for the hidden layer of ANN equal to 5, 10, 15 and 20, the swarm sizes were 5, 10, 20 and 30, and the maximum iteration value was considered equal to 10, 20, 30, 40, and 50 for modelling of rural areas. According to the number of control parameters, 60 and 80 models were constructed for urban and rural areas, respectively. After evaluating and comparing the results, the best developed models for urban and rural areas were determined and selected; their characteristics are shown in Table 2. In addition, the results obtained in terms of the best cost in each iteration for urban and rural areas are indicated in Figure 4 and Figure 5, respectively.
According to Figure 4, the PSO algorithm was able to converge rapidly in the sixth iteration, in which the values of the best cost were equal to almost 0.018. Then, the best cost value of the best developed model for urban areas was fixed from the sixth iteration to the 30th iteration. In addition, the convergence process of the algorithm in urban data analysis was also appropriate, which meant it was equal to approximately 0.0025. The best cost of the best developed model for urban areas was fixed from the 11th iteration to the 30th iteration based on Figure 5. Consequently, it can be concluded that the best developed models of urban and rural areas obtained satisfactory performances.

3.2. Modeling by ANN-DE

In the second model, the MLP neural network was trained by the DE algorithm. As mentioned before, the first step is to figure out the control parameters of the algorithm. For this purpose, a set of values was considered for urban areas including population sizes of the algorithm of 5, 10, and 15, the range of the hidden layers of ANN was equal to 5, 10, and 15, and a range of values equal to 10, 20, 30, and 40 was considered for the maximum iteration. Furthermore, in the modeling of rural areas, the ranges of population sizes of the algorithm and the hidden layers of ANN were considered as equal to 10, 20, and 25 and 5, 10, 15, 20, respectively. The set of the maximum iterations, which was a range of values equal to 10, 20, 30, 40, and 50, was considered for the maximum iteration. Finally, for the modelling of both areas, the crossover probability was considered 0.2, which can have a significant effect on optimization performance [68]. In total, 36 models for urban areas and 60 models for rural areas were constructed and developed. Consequently, after evaluating all models, the best developed model for urban areas was selected, whose structure included the population sizes of the algorithm and had hidden layers equal to 10 and 5. In addition, the structure of the best developed model for rural areas included the population sizes of the algorithm and the hidden layers equal to 5 and 10. Figure 6 shows the results obtained for the best cost in each iteration for urban and rural areas.
The results obtained from Figure 7 show that the DE algorithm was converged in the 10th iteration for the analysis of urban data, and the best cost was fixed up to the 30th iteration, at which point it was almost 0.0183. In addition, it could be converged in the 10th iteration, and then this value was fixed to the last iteration, which was equal to 0.0026. Consequently, the results obtained indicate that the modeling of the DE algorithm was acceptable.

3.3. Discussion

In this work, two feature selection techniques, which include the combination of ANN with the PSO algorithm and DE algorithms, were applied to evaluate and prioritize some potential factors for safety management in transportation systems in urban and rural areas. Before modeling, the two data sets with 202 and 564 accident cases from Cosenza’s cities and rural areas were gathered, and many models were made. After considering the modelling results, the best developed models for urban and rural areas were determined based on the ANN-PSO and ANN-DE algorithms. A comparison was made between the performances of the two models of ANN-PSO and ANN-DE based on convergence. When testing the performance of an algorithm that uses an iterative calculation method, the convergence rate is especially important because it tells us how long these calculations take. If the number of calculations needed to get a certain level of accuracy is reduced or reaches a required level of accuracy in the least number of iterations of the algorithm, the cost of calculations (like errors) will be lower. In this case, there was not a big difference between models in terms of how quickly they converged, but ANN-PSO models converged faster than ANN-DE models for both urban and rural areas.
In the next evaluation, a sensitivity analysis was performed, and a comparison was made between the results obtained. This was done by comparing the accuracy of the best ANN-PSO and ANN-DE model predictions to the input data. In this sensitivity study, the cosine amplitude approach, which was based on Equation (9), was used, where rij is the strength of the correlation and n is the total number of data points. Both the input (xik) and predicted (yij) parameters are designated by their respective notations [42].
r i j = k = 1 n ( x i k × y j k ) k = 1 n x i k 2 k = 1 n y i k 2
The results of the sensitivity analysis are shown in Figure 8 and Figure 9 for urban and rural areas, respectively.
The results indicated that both models have similar results for the two areas. According to Figure 8, the two algorithms ranked the average speed and the annual average daily traffic with the highest ranks (based on the weight) among the seven factors that have an impact on transport safety in urban areas, while the location had the lowest rank in urban areas. In fact, the results of prioritization by intelligent algorithms were very consistent with the field surveys from previous studies [32,33]. For instance, it was expected that depending on the studied urban environment and the previous studies, the average speed and the average annual daily traffic could represent potential risk factors for road safety. In addition, considering the number and type of intersections in the urban area, these factors could be considered as factors with low potential risk. Hence, it is recommended that in reviewing traffic plans in the future, using suitable traffic calming measures will be considered more and more, based on the situation of the studied urban environment.
Meanwhile, according to Figure 9, in rural areas, the type of accident and the average speed were prioritized by both algorithms as the factors with the highest potential risk, while location was selected as the lowest priority among the seven factors affecting road safety in rural areas. On the basis of the acquired results, prioritizing the factors affecting road safety were consistent with observations and field studies in the rural area [42]. For example, the type of accident plays a key role in road safety in rural areas where, unlike on urban roads, frontal or front-to-side collisions can occur, with lethal consequences for vehicle occupants. The second factor that was prioritized as a potential risk was average speed. According to the World Health Organization [70], “an increase in average speed is directly related both to the likelihood of a crash occurring and to the severity of the consequences of the crash”, especially when crashes occur on rural roads. In addition, the results of the experimental analysis are in line with the findings of several studies that report that operating speed is one of the most dangerous things on the road in rural areas [71,72,73]. Finally, since the amount of traffic flow volume on the studied rural roads was lower than the projected flow rate of the roads, choosing the location as a factor with the lowest priority was the right choice by artificial intelligence algorithms. Therefore, in reviewing traffic plans for rural roads, it is suggested that two important issues, including suitable traffic calming measures and geometric specifications, be considered.
It is worth mentioning that developed models are unique models and they should be applied only to urban and rural areas of Cosenza, in southern Italy. Furthermore, although the results of these techniques indicated their high capability in prioritizing the potential factors for safety management in transportation systems, they are not reliable techniques for incomplete datasets; hence, it is recommended to use other artificial intelligence method algorithms in these cases.
Finally, although ANN-DE and ANN-PSO approaches may be employed as dependable systems for modeling, it is important to highlight that they have certain limitations that prevent them from being fully used for feature selection analysis. Most importantly, they cannot be utilized to examine incomplete datasets.

4. Conclusions

There is a set of unpredicted factors that can affect road safety analysis; hence, road safety analysis deals with uncertainty. Since computational intelligence methods have a high capability to evaluate complex problems, in this study, two artificial intelligence techniques were applied to the evaluation of road safety. For this purpose, two data sets with 202 and 564 accident cases for urban and rural areas of Cosenza in southern Italy were measured and gathered in the first step. Then, the best developed models for urban and rural areas were determined by the ANN-PSO and ANN-DE algorithms. A comparison was made between how fast the best-developed models converged. For both urban and rural areas, ANN-PSO models were better than ANN-DE models. The results obtained from data analysis showed that the models built with both feature selection algorithms had the same results. In urban areas, the average speed and location had the highest and lowest priorities, respectively. In addition, in rural areas, the type of accident and location were selected as the highest and lowest priorities, respectively. The results also fit well with the conditions of the environments that were looked at. For future work, it is recommended to use other feature selection algorithms and other factors that may affect transport safety.

Author Contributions

Conceptualization, G.G., S.S.H. (Sami Shaffiee Haghshenas) and S.S.H. (Sina Shaffiee Haghshenas); methodology, S.S.H. (Sami Shaffiee Haghshenas) and S.S.H. (Sina Shaffiee Haghshenas); software, S.S.H. (Sami Shaffiee Haghshenas); formal analysis, S.S.H. (Sami Shaffiee Haghshenas); investigation, S.S.H. (Sami Shaffiee Haghshenas) and S.S.H. (Sina Shaffiee Haghshenas); resources, G.G. and A.V.; writing—original draft preparation, S.S.H. (Sami Shaffiee Haghshenas); writing—review and editing, G.G., S.S.H. (Sami Shaffiee Haghshenas), S.S.H. (Sina Shaffiee Haghshenas) and V.A.; supervision, G.G., V.A. and A.V. All authors have read and agreed to the published version of the manuscript.

Funding

This research received no external funding.

Institutional Review Board Statement

Not applicable.

Informed Consent Statement

Not applicable.

Data Availability Statement

Not applicable.

Acknowledgments

We would like to extend our sincere gratitude to Mahdi Ghaem for his good counsel.

Conflicts of Interest

The authors declare no conflict of interest.

References

  1. Abdelwahab, H.T.; Abdel-Aty, M.A. Development of artificial neural network models to predict driver injury severity in traffic accidents at signalized intersections. Transp. Res. Rec. 2001, 1746, 6–13. [Google Scholar] [CrossRef]
  2. Abdelwahab, H.T.; Abdel-Aty, M.A. Artificial neural networks and logit models for traffic safety analysis of toll plazas. Transp. Res. Rec. 2002, 1784, 115–125. [Google Scholar] [CrossRef]
  3. Sayed, T.; Brown, G.; Navin, F. Simulation of traffic conflicts at unsignalized intersections with TSC-Sim. Accid. Anal. Prev. 1994, 26, 593–607. [Google Scholar] [CrossRef]
  4. Abduljabbar, R.; Dia, H.; Liyanage, S.; Bagloee, S.A. Applications of artificial intelligence in transport: An overview. Sustainability 2019, 11, 189. [Google Scholar] [CrossRef]
  5. Imprialou, M.; Quddus, M. Crash data quality for road safety research: Current state and future directions. Accid. Anal. Prev. 2019, 130, 84–90. [Google Scholar] [CrossRef] [PubMed]
  6. Mussone, L.; Bassani, M.; Masci, P. Analysis of factors affecting the severity of crashes in urban road intersections. Accid. Anal. Prev. 2017, 103, 112–122. [Google Scholar] [CrossRef] [PubMed]
  7. Zheng, L.; Sayed, T.; Mannering, F. Modeling traffic conflicts for use in road safety analysis: A review of analytic methods and future directions. Anal. Meth. Accid. Res. 2021, 29, 100142. [Google Scholar] [CrossRef]
  8. Yang, D.; Xie, K.; Ozbay, K.; Yang, H. Fusing crash data and surrogate safety measures for safety assessment: Development of a structural equation model with conditional autoregressive spatial effect and random parameters. Accid. Anal. Prev. 2021, 152, 105971. [Google Scholar] [CrossRef]
  9. Lord, D.; Mannering, F. The statistical analysis of crash-frequency data: A review and assessment of methodological alternatives. Transp. Res. Part A Policy Pract. 2010, 44, 291–305. [Google Scholar] [CrossRef]
  10. Schlögl, M.; Stütz, R. Methodological considerations with data uncertainty in road safety analysis. Accid. Anal. Prev. 2019, 130, 136–150. [Google Scholar] [CrossRef]
  11. Zheng, L.; Sayed, T. Application of Extreme Value Theory for Before-After Road Safety Analysis. Transp. Res. Rec. J. Transp. Res. Board 2019, 2673, 1001–1010. [Google Scholar] [CrossRef]
  12. Abdel-Aty, M.A.; Radwan, A. Modeling traffic accident occurrence and involvement. Accid. Anal. Prev. 2000, 32, 633–642. [Google Scholar] [CrossRef]
  13. Huang, H.; Abdel-Aty, M. Multilevel data and Bayesian analysis in traffic safety. Accid. Anal. Prev. 2010, 42, 1556–1565. [Google Scholar] [CrossRef] [PubMed]
  14. Chong, M.M.; Abraham, A.; Paprzycki, M. Traffic accident analysis using decision trees and neural networks. arXiv 2004, arXiv:cs/0405050. [Google Scholar]
  15. Darcin, A.; Bulent, A. A neural network (NN) model to predict intersection crashes based upon driver, vehicle and roadway surface characteristics. J. Sci. Res. Essays 2010, 5, 2832–2836. [Google Scholar]
  16. Astarita, V.; Giofré, V.P.; Guido, G.; Vitale, A. Investigating road safety issues through a microsimulation model. Procedia-Soc. Behav. Sci. 2011, 20, 226–235. [Google Scholar] [CrossRef]
  17. Guido, G.; Astarita, V.; Giofré, V.P.; Vitale, A. Safety performance measures: A comparison between microsimulation and observational data. Procedia-Soc. Behav. Sci. 2011, 20, 217–225. [Google Scholar] [CrossRef]
  18. Moghaddam, F.R.; Afandizadeh, S.; Ziyadi, M. Prediction of accident severity using artificial neural networks. Int. J. Civ. Eng. 2011, 9, 41–48. [Google Scholar]
  19. Young, W.; Sobhani, A.; Lenné, M.G.; Sarvi, M. Simulation of safety: A review of the state of the art in road safety simulation modelling. Accid. Anal. Prev. 2014, 66, 89–103. [Google Scholar] [CrossRef]
  20. Gallelli, V.; Guido, G.; Vitale, A.; Vaiana, R. Effects of calibration process on the simulation of rear-end conflicts at roundabouts. J. Traffic Transp. Eng. 2019, 6, 175–184. [Google Scholar] [CrossRef]
  21. Shankar, V.; Mannering, F.; Barfield, W. Statistical analysis of accident severity on rural freeways. Accid. Anal. Prev. 1996, 28, 391–401. [Google Scholar] [CrossRef]
  22. Astarita, V.; Festa, D.C.; Giofré, V.P.; Guido, G. Surrogate Safety Measures from Traffic Simulation Models a Comparison of different Models for Intersection Safety Evaluation. Transp. Res. Procedia 2019, 37, 219–226. [Google Scholar] [CrossRef]
  23. Karimi, A.; Bassani, M.; Boroujerdian, A.M.; Catani, L. Investigation into passing behavior at passing zones to validate and extend the use of driving simulators in two-lane roads safety analysis. Accid. Anal. Prev. 2020, 139, 105487. [Google Scholar] [CrossRef] [PubMed]
  24. Zeng, Q.; Huang, H.; Pei, X.; Wong, S.C. Modeling nonlinear relationship between crash frequency by severity and contributing factors by neural networks. Anal. Meth. Accid. Res. 2016, 10, 12–25. [Google Scholar] [CrossRef]
  25. Halim, Z.; Kalsoom, R.; Bashir, S.; Abbas, G. Artificial intelligence techniques for driving safety and vehicle crash prediction. Artif. Intell. Rev. 2016, 46, 351–387. [Google Scholar] [CrossRef]
  26. Ait-Mlouk, A.; Gharnati, F.; Agouti, T. An improved approach for association rule mining using a multi-criteria decision support system: A case study in road safety. Eur. Transp. Res. Rev. 2017, 9, 1–13. [Google Scholar] [CrossRef]
  27. Fernandes, B.; Vicente, H.; Ribeiro, J.; Analide, C.; Neves, J. Evolutionary Computation on Road Safety. In Proceedings of the International Conference on Hybrid Artificial Intelligence Systems, Oviedo, Spain, 20–22 June 2018; Springer: Cham, Switzerland, 2018; pp. 647–657. [Google Scholar]
  28. Xu, Y.; Ye, Z.; Wang, Y.; Wang, C.; Sun, C. Evaluating the influence of road lighting on traffic safety at accesses using an artificial neural network. Traffic Inj. Prev. 2018, 19, 601–606. [Google Scholar] [CrossRef]
  29. Silva, P.B.; Andrade, M.; Ferreira, S. Machine learning applied to road safety modeling: A systematic literature review. J. Transp. Eng. 2020, 7, 775–790. [Google Scholar] [CrossRef]
  30. Boukerche, A.; Tao, Y.; Sun, P. Artificial intelligence-based vehicular traffic flow prediction methods for supporting intelligent transportation systems. Comput. Netw. 2020, 182, 107484. [Google Scholar] [CrossRef]
  31. Afework, A.; Sipos, T. Modelling of accidents for four lane non-urban highways using artificial neural networks technique. In Proceedings of the 2020 IEEE 14th International Symposium on Applied Computational Intelligence and Informatics (SACI), Timisoara, Romania, 21–23 May 2020; pp. 47–52. [Google Scholar]
  32. Guido, G.; Haghshenas, S.S.; Haghshenas, S.S.; Vitale, A.; Astarita, V.; Haghshenas, A.S. Feasibility of stochastic models for evaluation of potential factors for safety: A case study in Southern Italy. Sustainability 2020, 12, 7541. [Google Scholar] [CrossRef]
  33. Guido, G.; Haghshenas, S.S.; Haghshenas, S.S.; Vitale, A.; Gallelli, V.; Astarita, V. Development of a binary classification model to assess safety in transportation systems using GMDH-type neural network algorithm. Sustainability 2020, 12, 6735. [Google Scholar] [CrossRef]
  34. Tonni, S.I.; Aka, T.A.; Antik, M.M.; Taher, K.A.; Mahmud, M.; Kaiser, M.S. Artificial intelligence based driver vigilance system for accident prevention. In Proceedings of the 2021 International Conference on Information and Communication Technology for Sustainable Development (ICICT4SD), Dhaka, Bangladesh, 27–28 February 2021; pp. 412–416. [Google Scholar]
  35. Ministero delle Infrastrutture e dei Trasporti. Studio di Valutazione dei Costi Sociali dell’incidentalità Stradale; Direzione Generale per la Sicurezza Stradale: Rome, Italy, 2012.
  36. Wang, K.; Shirani-Bidabadi, N.; Shaon, M.R.R.; Zhao, S.; Jackson, E. Correlated mixed logit modeling with heterogeneity in means for crash severity and surrogate measure with temporal instability. Accid. Anal. Prev. 2021, 160, 106332. [Google Scholar] [CrossRef]
  37. Ghasedi, M.; Sarfjoo, M.; Bargegol, I. Prediction and analysis of the severity and number of suburban accidents using logit model, factor analysis and machine learning: A case study in a developing country. SN Appl. Sci. 2021, 3, 1–16. [Google Scholar] [CrossRef]
  38. Yan, X.; He, J.; Zhang, C.; Liu, Z.; Qiao, B.; Zhang, H. Single-vehicle crash severity outcome prediction and determinant extraction using tree-based and other non-parametric models. Accid. Anal. Prev. 2021, 153, 106034. [Google Scholar] [CrossRef] [PubMed]
  39. Haghshenas, S.S.; Haghshenas, S.S.; Geem, Z.W.; Kim, T.H.; Mikaeil, R.; Pugliese, L.; Troncone, A. Application of harmony search algorithm to slope stability analysis. Land 2021, 10, 1250. [Google Scholar] [CrossRef]
  40. Guido, G.; Haghshenas, S.S.; Vitale, A.; Astarita, V. Challenges and Opportunities of Using Data Fusion Methods for Travel Time Estimation. In Proceedings of the 2022 8th International Conference on Control, Decision and Information Technologies (CoDIT), Istanbul, Turkey, 17–20 May 2022; Volume 1, pp. 587–592. [Google Scholar]
  41. Guido, G.; Haghshenas, S.S.; Haghshenas, S.S.; Vitale, A.; Gallelli, V.; Astarita, V. Prioritizing the Potential Smartification Measures by Using an Integrated Decision Support System with Sustainable Development Goals (a Case Study in Southern Italy). Safety 2022, 8, 35. [Google Scholar] [CrossRef]
  42. Guido, G.; Shaffiee Haghshenas, S.; Shaffiee Haghshenas, S.; Vitale, A.; Astarita, V.; Park, Y.; Geem, Z.W. Evaluation of Contributing Factors Affecting Number of Vehicles Involved in Crashes Using Machine Learning Techniques in Rural Roads of Cosenza, Italy. Safety 2022, 8, 28. [Google Scholar] [CrossRef]
  43. Akbarzadeh, M.; Shaffiee Haghshenas, S.; Jalali, S.M.E.; Zare, S.; Mikaeil, R. Developing the Rule of Thumb for Evaluating Penetration Rate of TBM, Using Binary Classification. Geotech. Geol. Eng. 2022, 40, 4685–4703. [Google Scholar] [CrossRef]
  44. Amiri, A.M.; Sadri, A.; Nadimi, N.; Shams, M. A comparison between artificial neural network and hybrid intelligent genetic algorithm in predicting the severity of fixed object crashes among elderly drivers. Accid. Anal. Prev. 2020, 138, 105468. [Google Scholar] [CrossRef]
  45. Qian, Y.; Zhang, X.; Fei, G.; Sun, Q.; Li, X.; Stallones, L.; Xiang, H. Forecasting deaths of road traffic injuries in China using an artificial neural network. Traffic Inj. Prev. 2020, 21, 407–412. [Google Scholar] [CrossRef]
  46. Golafshani, E.M.; Behnood, A.; Arashpour, M. Predicting the compressive strength of normal and High-Performance Concretes using ANN and ANFIS hybridized with Grey Wolf Optimizer. Constr. Build. Mater. 2020, 232, 117266. [Google Scholar] [CrossRef]
  47. Naderpour, H.; Rafiean, A.H.; Fakharian, P. Compressive strength prediction of environmentally friendly concrete using artificial neural networks. J. Build. Eng. 2018, 16, 213–219. [Google Scholar] [CrossRef]
  48. Naderpour, H.; Fakharian, P. Predicting the torsional strength of reinforced concrete beams strengthened with FRP sheets in terms of artificial neural networks. J. Struct. Constr. Eng. 2018, 5, 20–35. [Google Scholar]
  49. Mikaeil, R.; Shaffiee Haghshenas, S.; Ozcelik, Y.; Shaffiee Haghshenas, S. Development of intelligent systems to predict diamond wire saw performance. J. Soft Comput. Civ. Eng. 2017, 1, 52–69. [Google Scholar]
  50. Eidgahee, D.R.; Jahangir, H.; Solatifar, N.; Fakharian, P.; Rezaeemanesh, M. Data-driven estimation models of asphalt mixtures dynamic modulus using ANN, GP and combinatorial GMDH approaches. Neural Comput. Appl. 2022, 1–26. [Google Scholar] [CrossRef]
  51. Se, C.; Champahom, T.; Jomnonkwao, S.; Ratanavaraha, V. Motorcyclist injury severity analysis: A comparison of Artificial Neural Networks and random parameter model with heterogeneity in means and variances. Int. J. Inj. Contr. Saf. Promot. 2022, 1–16. [Google Scholar] [CrossRef]
  52. Ali, G.A.; Tayfour, A. Characteristics and prediction of traffic accident casualties in Sudan using statistical modeling and artificial neural networks. Int. J. Transp. Sci. Technol. 2012, 1, 305–317. [Google Scholar] [CrossRef]
  53. Sanayei, R.; Vafaeinejad, A.; Karami, J.; Zanjirabad, H.A. A model development on GIS-driven data to predict temporal daily collision through integrating Discrete Wavelet Transform (DWT) and Artificial Neural Network (ANN) algorithms; case study: Tehran-Qazvin freeway. Geocarto Int. 2021, 1–17. [Google Scholar] [CrossRef]
  54. Kim, S.; Lee, J.; Yoon, T. Road surface conditions forecasting in rainy weather using artificial neural networks. Saf. Sci. 2021, 140, 105302. [Google Scholar] [CrossRef]
  55. Huang, J.; Koopialipoor, M.; Armaghani, D.J. A combination of fuzzy Delphi method and hybrid ANN-based systems to forecast ground vibration resulting from blasting. Sci. Rep. 2020, 10, 19397. [Google Scholar] [CrossRef]
  56. Mikaeil, R.; Haghshenas, S.S.; Sedaghati, Z. Geotechnical risk evaluation of tunneling projects using optimization techniques (case study: The second part of Emamzade Hashem tunnel). Nat. Hazards 2019, 97, 1099–1113. [Google Scholar] [CrossRef]
  57. Abbasi, E.; Hadji Hosseinlou, M. The Importance of Exercise and General Mental Health on Prediction of Property-Damage-Only Accidents among Taxi Drivers in Tehran: A Study Using ANFIS-PSO and Regression Models. J. Adv. Transp. 2019, 2019, 1–10. [Google Scholar] [CrossRef]
  58. Noori, A.M.; Mikaeil, R.; Mokhtarian, M.; Haghshenas, S.S.; Foroughi, M. Feasibility of intelligent models for prediction of utilization factor of TBM. Geotech. Geol. Eng. 2020, 38, 3125–3143. [Google Scholar] [CrossRef]
  59. Amiri, A.M.; Nadimi, N.; Yousefian, A. Comparing the efficiency of different computation intelligence techniques in predicting accident frequency. IATSS Res. 2020, 44, 285–292. [Google Scholar] [CrossRef]
  60. Shaffiee Haghshenas, S.; Pirouz, B.; Shaffiee Haghshenas, S.; Pirouz, B.; Piro, P.; Na, K.S.; Geem, Z.W. Prioritizing and analyzing the role of climate and urban parameters in the confirmed cases of COVID-19 based on artificial intelligence applications. Int. J. Environ. Res. Public Health 2020, 17, 3730. [Google Scholar] [CrossRef]
  61. Kennedy, J.; Eberhart, R. Particle swarm optimization. In Proceedings of the ICNN’95-international conference on neural networks, Perth, WA, Australia, 27 November 1995; Volume 4, pp. 1942–1948. [Google Scholar]
  62. Poli, R.; Kennedy, J.; Blackwell, T. Particle swarm optimization. Swarm Intell. 2007, 1, 33–57. [Google Scholar] [CrossRef]
  63. Xu, X.; Zeng, Z.; Wang, Y.; Ash, J. Crash Density and Severity Prediction Using Recurrent Neural Networks Combined with Particle Swarm Optimization. In Proceedings of the International Conference on Management Science and Engineering Management, Ontario, ON, Canada, 5–8 August 2019; Springer: Cham, Switzerland, 2019; pp. 566–580. [Google Scholar]
  64. Armaghani, D.J.; Koopialipoor, M.; Marto, A.; Yagiz, S. Application of several optimization techniques for estimating TBM advance rate in granitic rocks. J. Rock Mech. Geotech. Eng. 2019, 11, 779–789. [Google Scholar] [CrossRef]
  65. Storn, R.; Price, K. Minimizing the real functions of the ICEC’96 contest by differential evolution. In Proceedings of the IEEE International Conference on Evolutionary Computation, Nagoya, Japan, 20–22 May 1996; pp. 842–844. [Google Scholar]
  66. Storn, R.; Price, K. Differential evolution—A simple and efficient heuristic for global optimization over continuous spaces. J. Glob. Optim. 1997, 11, 341–359. [Google Scholar] [CrossRef]
  67. Pan, X.; Zhou, W.; Lu, Y.; Sun, N. Prediction of network traffic of smart cities based on DE-BP neural network. IEEE Access 2019, 7, 55807–55816. [Google Scholar] [CrossRef]
  68. Dormishi, A.; Ataei, M.; Mikaeil, R.; Khalokakaei, R.; Haghshenas, S.S. Evaluation of gang saws’ performance in the carbonate rock cutting process using feasibility of intelligent approaches. Eng. Sci. Technol. Int. J. 2019, 22, 990–1000. [Google Scholar] [CrossRef]
  69. Aryafar, A.; Mikaeil, R.; Haghshenas, S.S.; Haghshenas, S.S. Application of metaheuristic algorithms to optimal clustering of sawing machine vibration. Measurement 2018, 124, 20–31. [Google Scholar] [CrossRef]
  70. World Health Organization. Global Status Report on Road Safety; World Health Organization: Geneva, Switzerland, 2018. [Google Scholar]
  71. Elvik, R. A comprehensive and unified framework for analysing the effects on injuries of measures influencing speed. Accid. Anal. Prev. 2019, 125, 63–69. [Google Scholar] [CrossRef]
  72. Eboli, L.; Guido, G.; Mazzulla, G.; Pungillo, G. Experimental relationships between operating speeds of successive road design elements in two-lane rural highways. Transport 2017, 32, 2138–2145. [Google Scholar] [CrossRef]
  73. Camacho-Torregrosa, F.J.; Pérez-Zuriaga, A.M.; Campoy-Ungría, J.M.; García-García, A. New geometric design consistency model based on operating speed profiles for road safety evaluation. Accid. Anal. Prev. 2013, 61, 33–42. [Google Scholar] [CrossRef]
Figure 1. A basic form of particle motions with velocity and position vectors in a set.
Computers 11 00145 g001
Figure 2. The flowchart of PSO algorithm.
Computers 11 00145 g002
Figure 3. The flowchart of DE algorithm.
Computers 11 00145 g003
Figure 4. The best cost per each iteration of the best developed model for urban area by ANN-PSO algorithm.
Computers 11 00145 g004
Figure 5. The best cost per each iteration of the best developed model for rural area by ANN-PSO algorithm.
Computers 11 00145 g005
Figure 6. The best cost per each iteration of the best developed model for urban areas using the ANN-DE algorithm.
Computers 11 00145 g006
Figure 7. The best cost per each iteration of the best developed model for rural areas using the ANN-DE algorithm.
Computers 11 00145 g007
Figure 8. Comparison between the results of ANN-DE and ANN-PSO models for urban data.
Computers 11 00145 g008
Figure 9. Comparison between the results of ANN-DE and ANN-PSO models for rural data.
Computers 11 00145 g009
Table 1. Independent and dependent variables with different degrees of qualitative and quantitative content.
Data Field TypeVariableCode/UnitDescriptionPercentage of Total Crashes
Traffic flow characteristicsAADT (veh/day)1<50006.9
25000–99994.7
310,000–14,99954.8
4>14,99933.6
Avg Speed (km/h)Not codedMin. 28100
Max. 122
Avg. 85.29
Speed Limit (km/h)15026.3
27031.2
39017.6
41100.8
513024.1
Environment characteristicsLight Conditions0Daylight66.8
1Nighttime33.2
Day of the Week0Weekend or Holiday30
1Weekday70
Location environmentRoad classification1Highway37.5
2Other62.5
Accident characteristicNumber of Vehicles1131.6
2252
33 or more16.4
Accident Type1Collision with vehicle68.6
2Collision with pedestrian3
3Collision with obstacle7.2
4Other21.3
Table 2. The control parameters of the best developed models for urban and rural areas by ANN-PSO.
Control ParametersValues for the Best
Developed Model of Urban Area
Values for the Best
Developed Model of Rural Area
Number of hidden layers55
Swarm size1520
Individual learning factor (C1)1.491.49
Social learning factor (C2)1.491.49
Publisher’s Note: MDPI stays neutral with regard to jurisdictional claims in published maps and institutional affiliations.

