1. Introduction
Bladder cancer (BCa) is among the most frequently diagnosed malignancies worldwide and continues to impose a substantial burden on public health [
1]. Globally, more than 500,000 new cases are diagnosed each year, with a pronounced male predominance [
2,
3]. Despite continuous advances in diagnostic and therapeutic strategies, BCa remains responsible for over 200,000 cancer-related deaths annually [
4]. Ongoing population ageing, together with sustained exposure to established risk factors—most notably tobacco smoking—is expected to further exacerbate the global incidence and mortality of this disease [
5]. Clinically, BCa exhibits remarkable biological and clinical heterogeneity, resulting in unsatisfactory long-term outcomes for a considerable proportion of patients [
6]. Although non-muscle-invasive BCa is generally associated with relatively favorable survival, its high recurrence rate necessitates intensive and lifelong surveillance [
6]. In contrast, muscle-invasive and advanced-stage BCa are characterized by aggressive behavior, limited treatment options, and poor prognosis [
7]. Current therapeutic approaches, including platinum-based chemotherapy, radical surgery, and immune checkpoint blockade, provide durable benefit to only a part of patients [
8]. Moreover, conventional clinicopathological parameters show limited accuracy in predicting disease progression or treatment response [
9]. Accordingly, there is an urgent need to identify novel molecular biomarkers that can improve early diagnosis, refine prognostic stratification, and facilitate the development of more effective personalized therapeutic strategies for BCa.
Suppressor anaphase-promoting complex domain containing 2 (SAPCD2), also referred to as p42.3 or C9orf140, is a cell cycle-associated protein encoded on chromosome 9q34.3 [
10]. SAPCD2 was originally characterized as a mitosis-related factor with tightly regulated expression during cell cycle progression. Mechanistic studies revealed that SAPCD2 played an essential role in mitotic spindle orientation and symmetric cell division through negative regulation of the Gαi–LGN–NuMA complex, thereby influencing cell fate decisions and tissue organization during development [
11]. Beyond its physiological functions, increasing evidence indicates that SAPCD2 was aberrantly upregulated in a wide spectrum of human malignancies and predominantly functioned as an oncogenic driver. Elevated expression of SAPCD2 has been documented in breast cancer [
12], neuroblastoma [
12], fibrosarcoma [
13] and colorectal cancer [
14], where it was frequently correlated with enhanced tumor proliferation, migration, invasion, metastatic capacity, and unfavorable clinical outcomes in vitro and in vivo models. Furthermore, accumulating evidence suggested that SAPCD2 participated in oncogenic signaling networks. For example, SAPCD2 has been reported to promote breast cancer cell migration and invasiveness through activation of YAP/TAZ signaling [
12], while studies in other tumor contexts have linked SAPCD2 to Wnt/β-catenin-related regulatory circuits [
15]. Moreover, MAPK-associated signaling has been implicated downstream of SAPCD2 in melanoma [
16]. Notwithstanding these advances, the biological role and clinical relevance of SAPCD2 in BCa have not yet been systematically investigated.
Given its reported involvement in tumor progression in other malignancies, we focused on SAPCD2 as a candidate oncogenic regulator in BCa. Using a combination of gain- and loss-of-function approaches in BCa cell lines and in vivo tumor models, we examined the effects of SAPCD2 on malignant phenotypes. In parallel, we explored the signaling pathways and regulatory networks associated with SAPCD2, with particular emphasis on its potential involvement in MAPK signaling and upstream transcriptional regulation. Therefore, we sought to investigate whether SAPCD2 contributed to the progression of BCa and to elucidate the molecular mechanisms underlying its oncogenic function in this study.
2. Materials and Methods
2.1. Public Database Data Mining
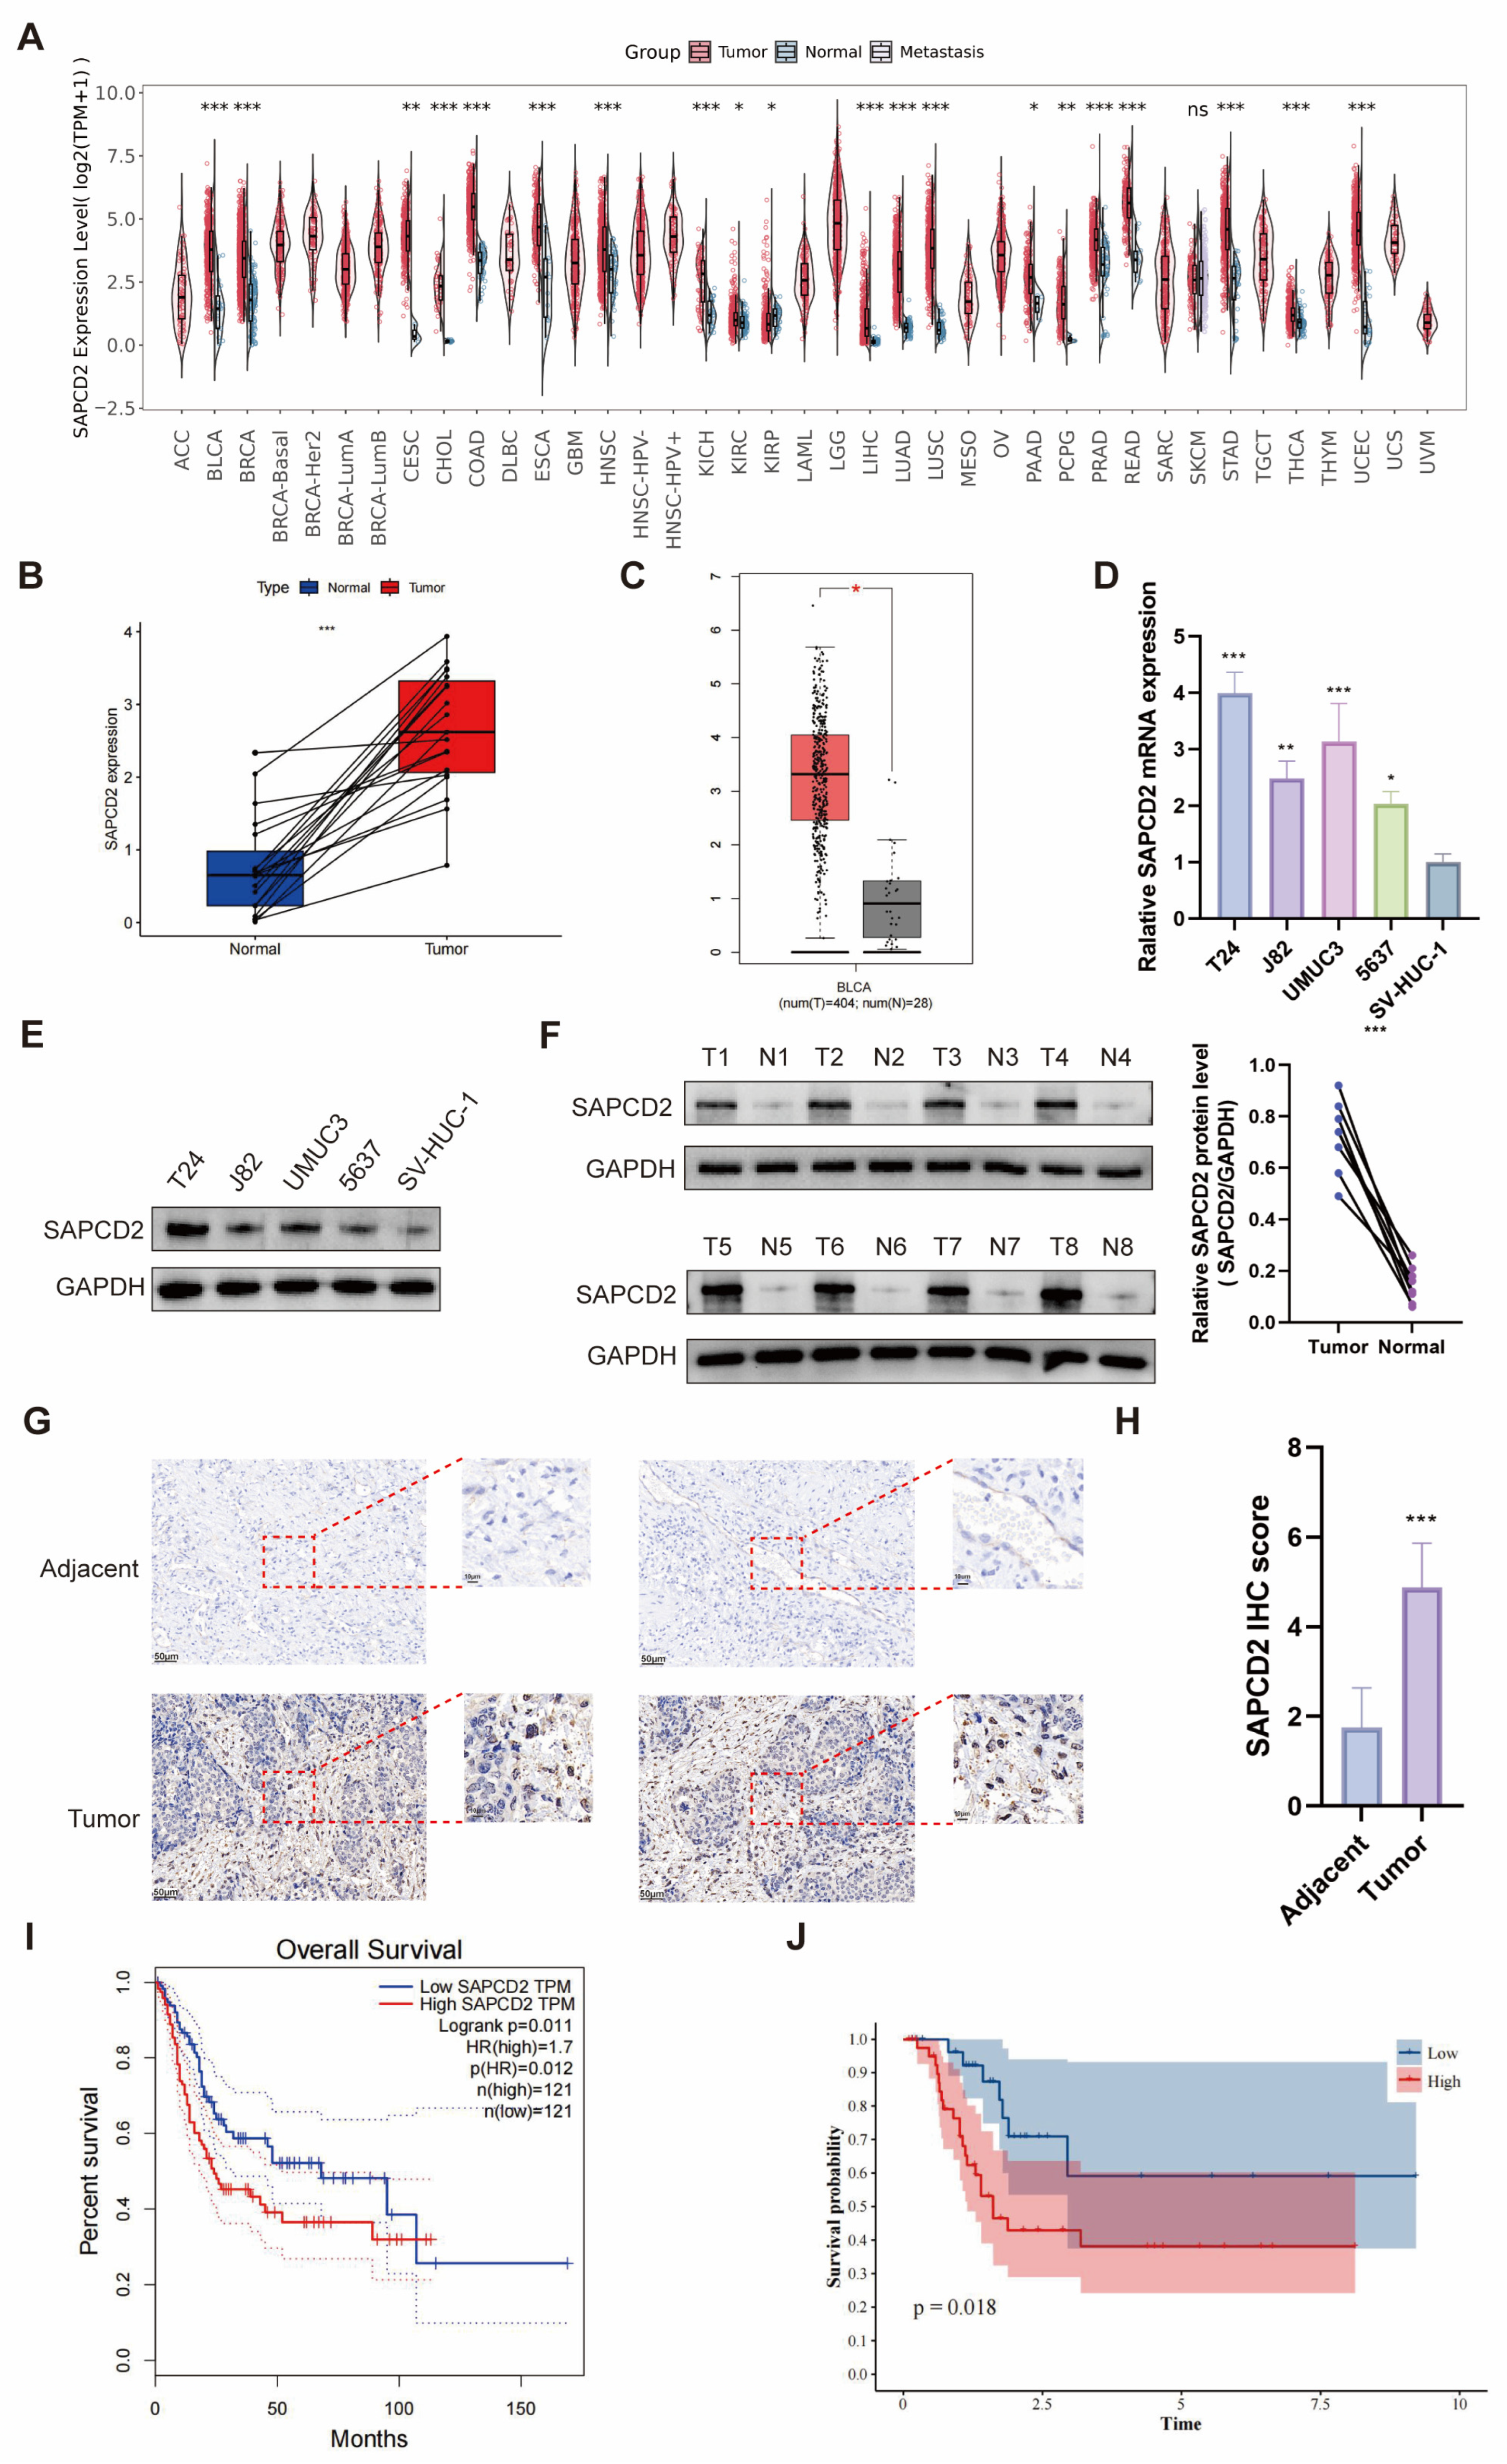
We retrieved clinical and transcriptomic data for BCa from The Cancer Genome Atlas (TCGA) portal (
https://portal.gdc.cancer.gov/, accessed on 20 September 2024). To serve as a control, transcriptomic data from normal bladder tissues were sourced from GTEx via UCSC Xena (
https://xena.ucsc.edu/, accessed on 21 September 2024). For normal tissue gene expression profiles, we consulted the Human Protein Atlas (HPA) database (
https://www.proteinatlas.org/, accessed on 3 May 2025). Protein–protein interactions prediction was performed by using GeneMANIA (
https://genemania.org/, accessed on 11 May 2025) and the BioGRID database (
https://thebiogrid.org/, accessed on 11 May 2025). Ubiquitination sites were predicted with the UbiBrowser tool (
http://ubibrowser.ncpsb.org.cn, accessed on 7 June 2025). To identify upstream transcriptional regulators, predictions from JASPAR (
https://jaspar.elixir.no/, accessed on 1 July 2025), hTFtarget (
https://guolab.wchscu.cn/hTFtarget/, accessed on 1 July 2025), and GeneCards (
https://www.genecards.org/, accessed on 1 July 2025) were carried out. Single-cell RNA-seq data were downloaded from GEO (GSE130001;
https://www.ncbi.nlm.nih.gov/geo/, accessed on 16 January 2025). All analyses were performed using R (version 4.4.1).
2.2. Cell Culture
Human BCa cell lines T24, UMUC3, J82, and 5637, together with the normal human urothelial cell line SV-HUC-1, were purchased from Procell (Wuhan, China). Among these, T24, UMUC3, and J82 cells are commonly used as models of highly invasive urothelial carcinoma, whereas 5637 cells are derived from a grade II urothelial carcinoma. T24 cells were cultured in McCoy’s 5A medium, while 5637 cells were maintained in RPMI-1640 medium (Procell, China). UMUC3 and J82 cells were grown MEM (Procell, China), whereas SV-HUC-1 cells were cultured in F-12K medium (Procell, China). All media were supplemented with 10% fetal bovine serum (Servicebio, Wuhan, China) and 1% penicillin–streptomycin solution (Servicebio, China). Cells were maintained at 37 °C in a humidified atmosphere containing 5% CO2.
2.3. Quantitative Real-Time PCR (qRT-PCR)
Total RNA was isolated with TRIzol (Invitrogen, Carlsbad, CA, USA). cDNA was generated using a reverse transcription kit (Servicebio, China). qRT–PCR was carried out with SYBR Green Mix (Servicebio), and relative expression was calculated by the 2
−ΔΔCt method with GAPDH as the internal control. Primer sequences are listed in
Supplementary Table S1.
2.4. Western Blot (WB)
Cells were lysed in RIPA buffer containing protease/phosphatase inhibitors (Servicebio, China). Protein concentration was measured by BCA (Servicebio). Equal amounts of protein were separated by SDS–PAGE, transferred to PVDF membranes, blocked with 5% milk, and incubated with primary antibodies overnight at 4 °C, followed by HRP-conjugated secondary antibodies. Bands were visualized using ECL (NCM Biotech, Suzhou, China) and quantified in ImageJ (version 1.5.1), normalized to the indicated loading controls. Antibody details are listed in
Supplementary Table S2.
2.5. siRNA and Plasmid Transfection
siNC and siRNAs targeting SAPCD2 (two sequences, si-1 and si-2), PLAGL2, and CREB were purchased from GenePharma (Shanghai, China) (sequences in
Table S3). Cells were transfected with siRNAs using Lipofectamine 3000 (Invitrogen, USA). Knockdown was confirmed by qRT–PCR and/or WB. For overexpression, full-length SAPCD2 and TANK were cloned into pcDNA3.1(+) (Thermo Fisher Scientific, Waltham, MA, USA). Plasmids were introduced with Lipofectamine 3000, and expression was validated by qRT–PCR and WB.
2.6. Lentiviral Plasmid Construction and Transduction
Lentiviruses carrying PLAGL2 or TANK overexpression constructs, as well as lentiviruses encoding specific shRNAs targeting PLAGL2 or TANK, were designed and packaged by GeneChem (Shanghai, China). Corresponding negative control lentiviruses containing empty vectors or non-targeting shRNAs were used as controls. The shRNA target sequences are provided in
Table S4. Cells were seeded in 24-well plates and transduced according to the manufacturer’s instructions. After transduction, stable cell populations were selected and expanded for subsequent experiments.
2.7. Immunohistochemistry (IHC)
Paraffin-embedded tissue sections were deparaffinized in xylene, rehydrated through graded ethanol, and subjected to heat-induced antigen retrieval. After blocking endogenous peroxidase activity and nonspecific binding, sections were incubated overnight at 4 °C with the indicated primary antibodies, including anti-SAPCD2 antibody (Bioss, Beijing, China; BS-15314R; 1:200 dilution) and anti-Ki67 antibody (Proteintech, Wuhan, China; 27309-1-AP; 1:10,000 dilution). Following incubation with appropriate HRP-conjugated secondary antibodies, immunoreactive signals were visualized using diaminobenzidine (DAB) and counterstained with hematoxylin.
Immunostaining was independently evaluated by two experienced pathologists who were blinded to the clinical information. Staining scores were determined by combining the staining intensity and the percentage of positively stained tumor cells. Staining intensity was graded as 0 (negative), 1 (weak), 2 (moderate), or 3 (strong), and the proportion of positive cells was scored as 0 (<5%), 1 (5–25%), 2 (26–50%), 3 (51–75%), or 4 (>75%). The final immunoreactivity score was calculated by multiplying the intensity score by the percentage score. In cases of discrepant evaluations, a consensus score was reached after joint review.
BCa tissue samples were obtained from patients who underwent surgical resection at our institution with written informed consent. Detailed clinicopathological characteristics are summarized in
Table 1 and
Supplementary Table S5.
2.8. Colony Formation Assay
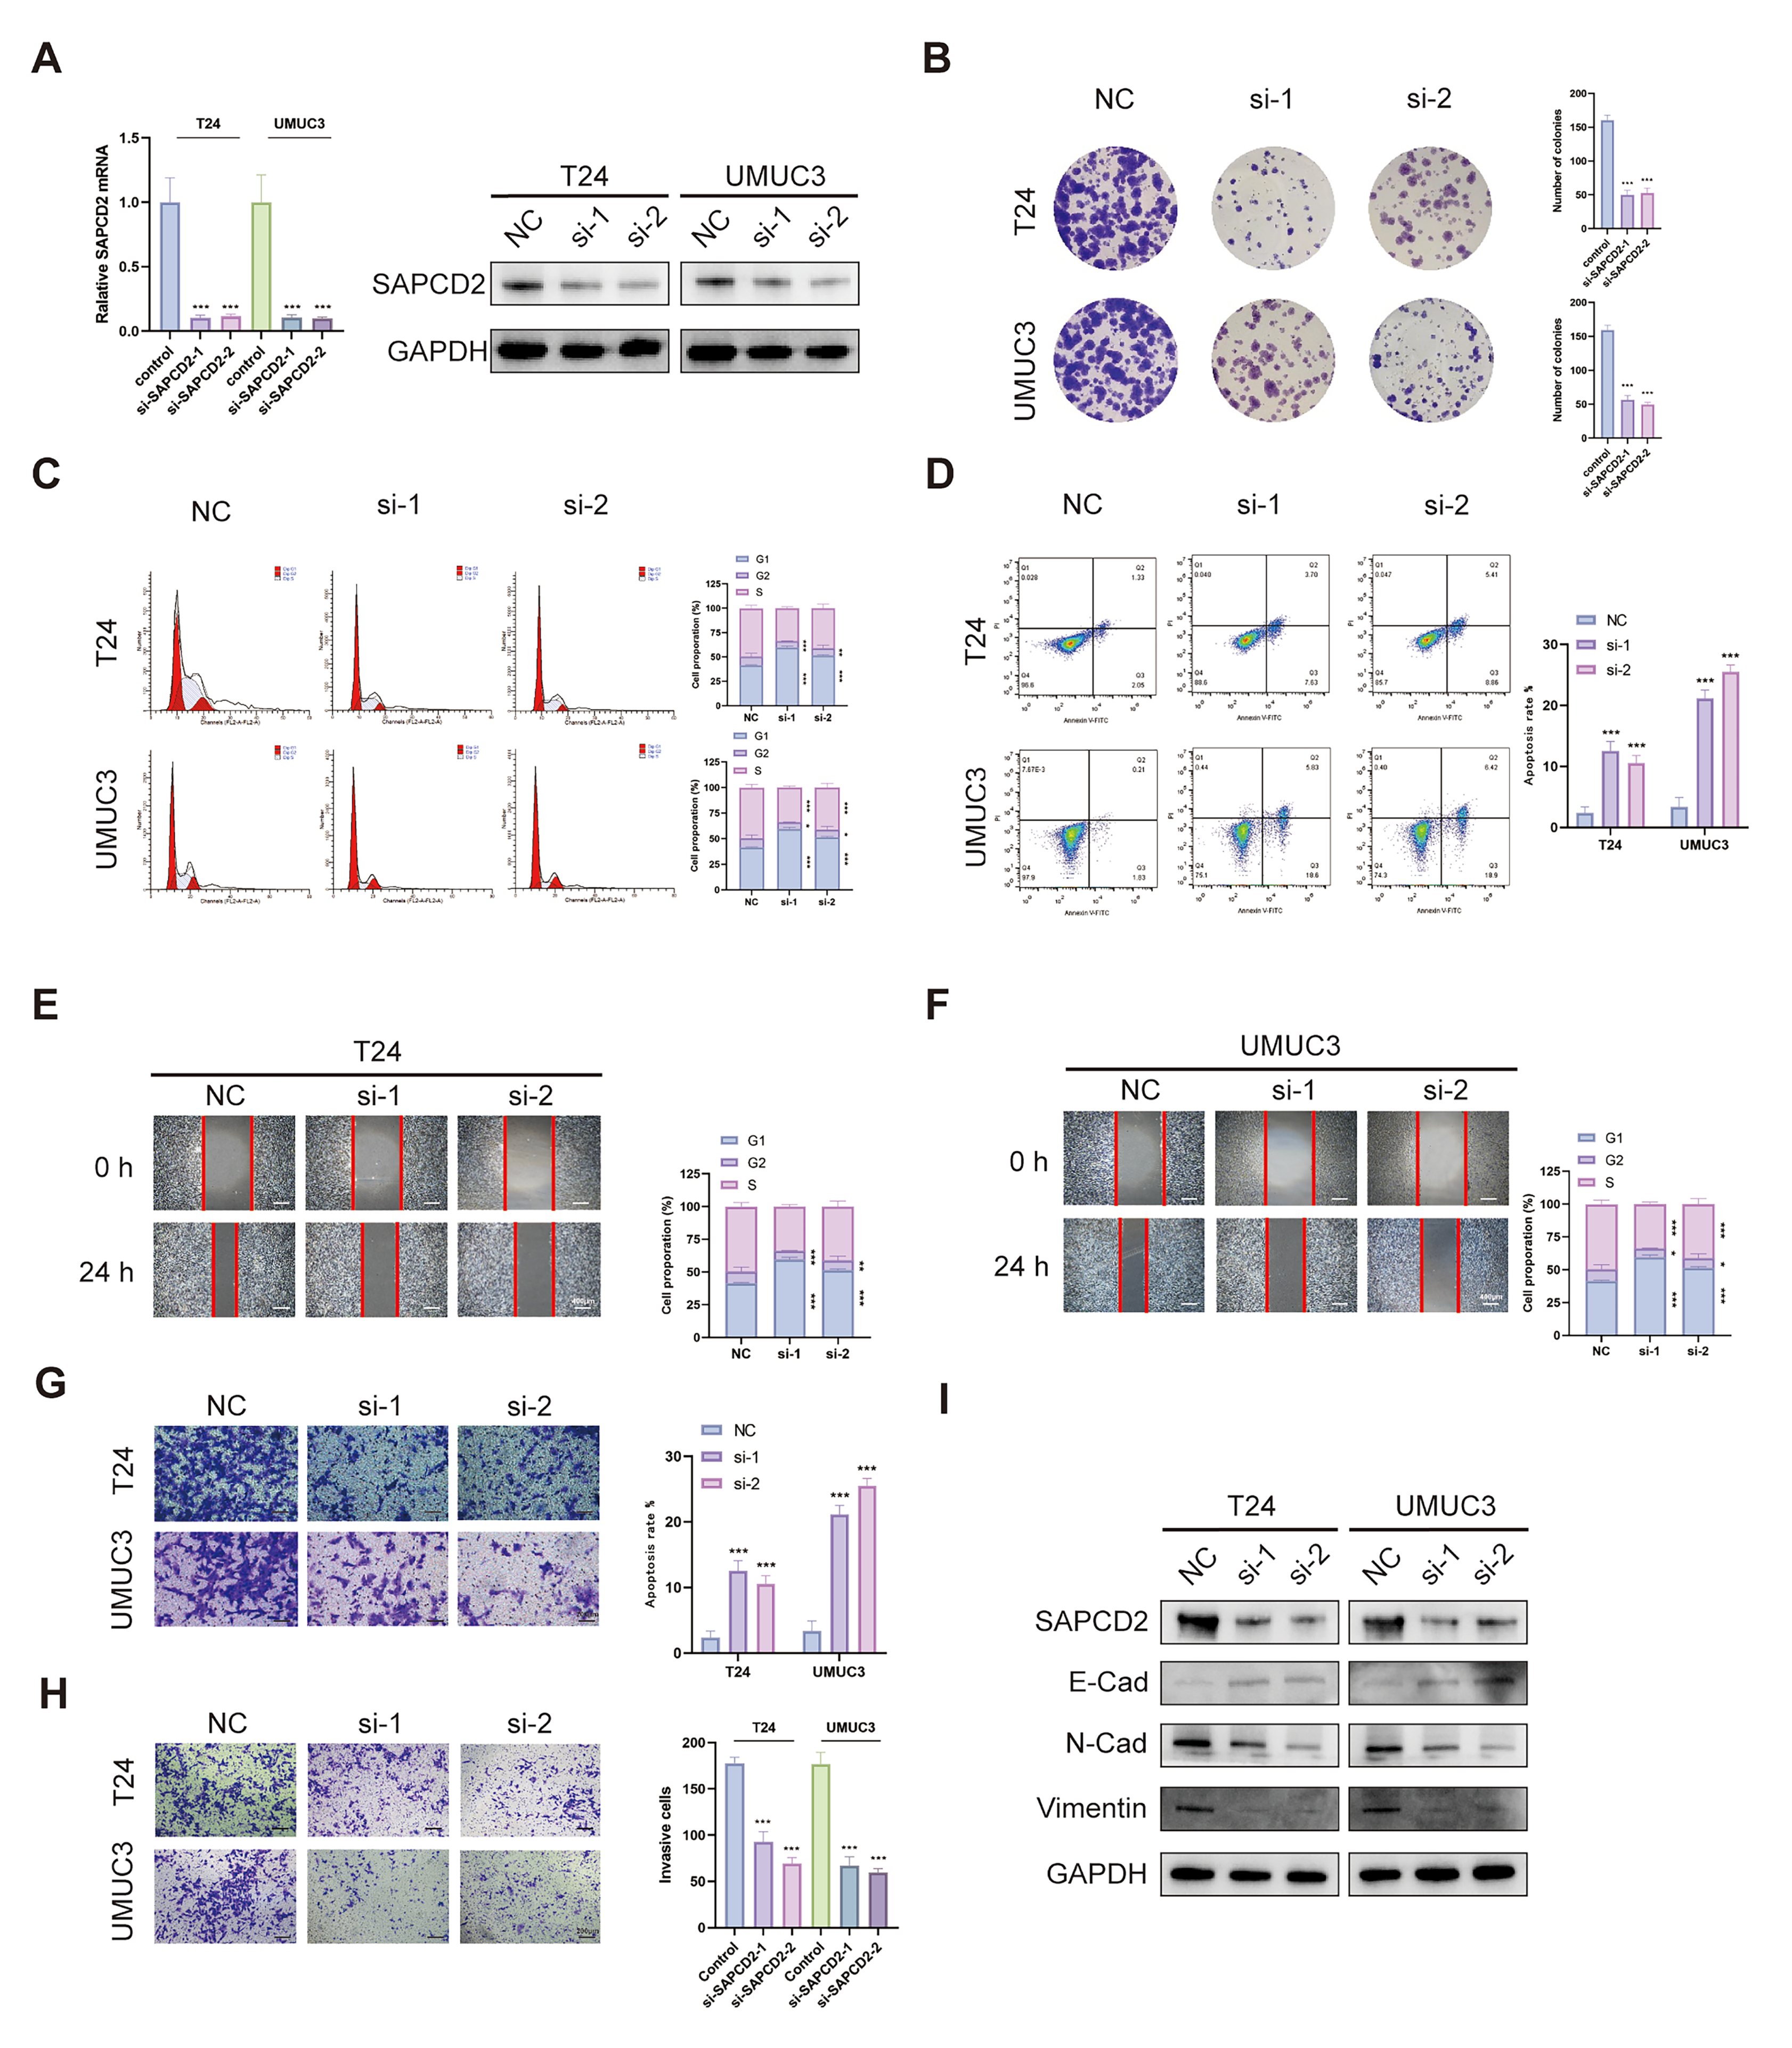
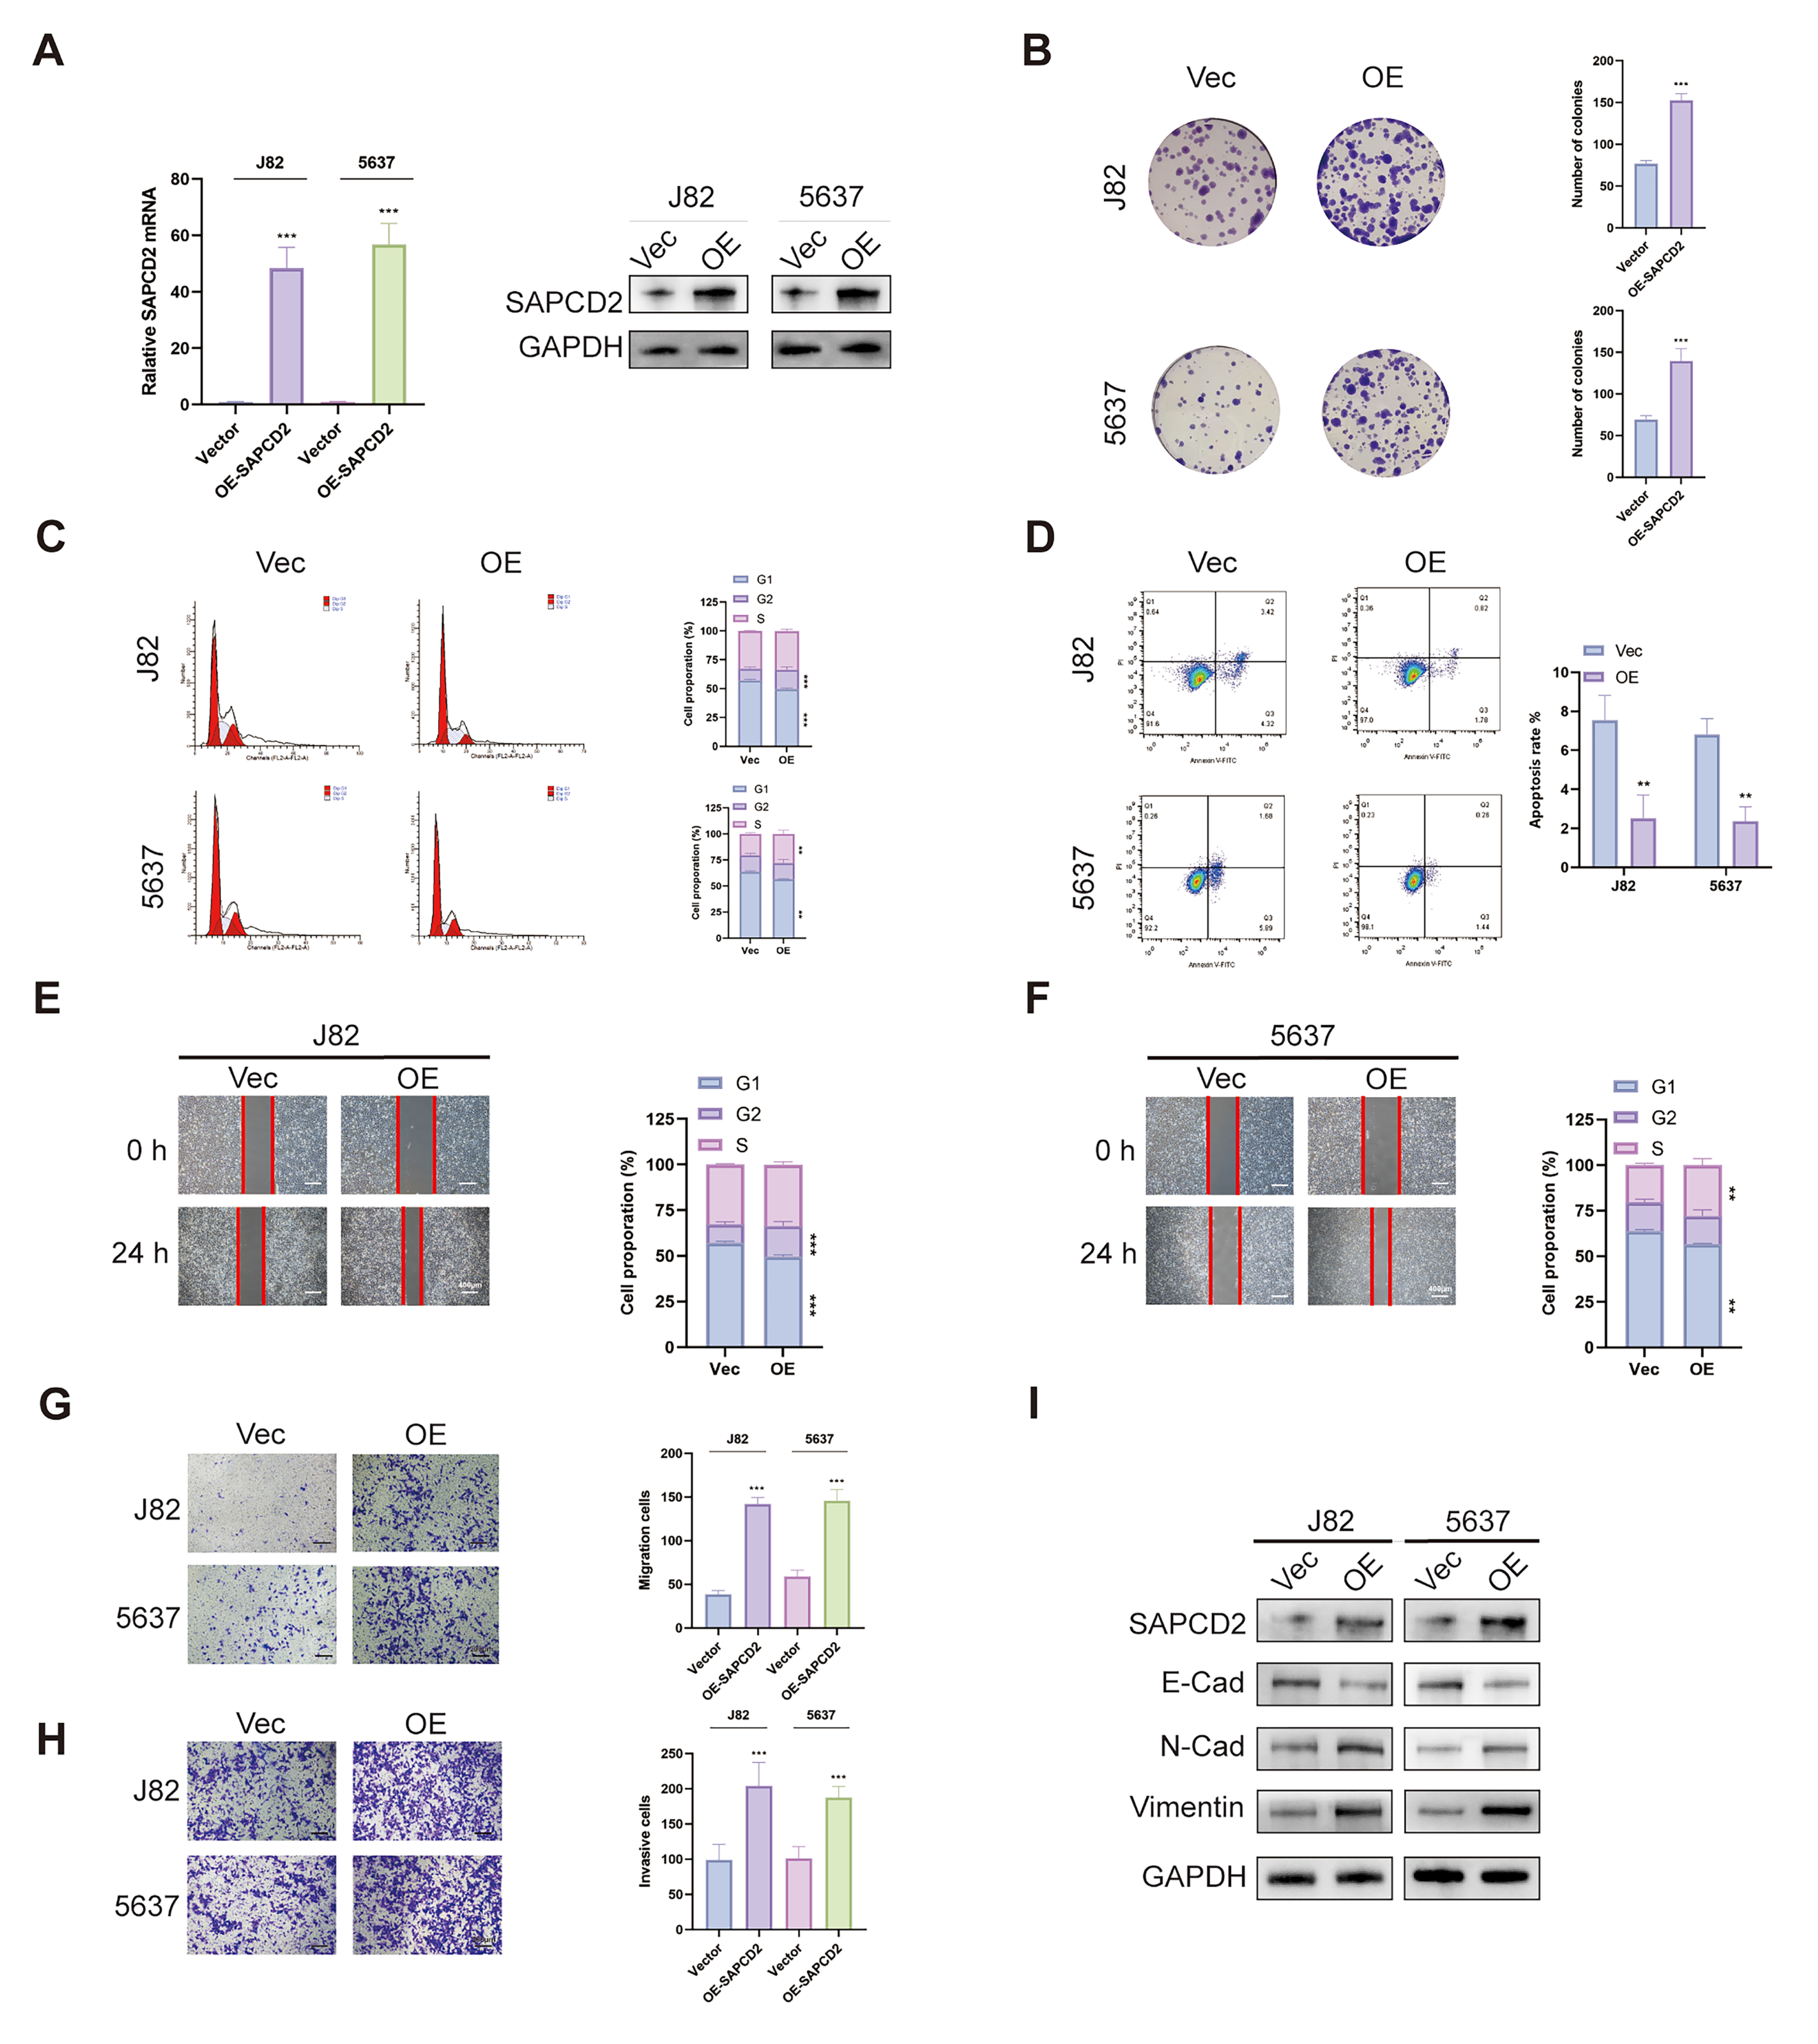
Cells were seeded into six-well plates at a density of 500 cells per well and cultured under standard conditions for approximately 10 days to allow colony formation. After incubation, colonies were fixed with paraformaldehyde and stained with crystal violet. Visible colonies were photographed and counted.
2.9. Cell Counting Kit-8 Assay
Cells were seeded into 96-well plates at a density of 2 × 10³ cells per well and cultured under standard conditions. At the indicated time points, CCK-8 reagent (Beyotime, Shanghai, China) was added to each well according to the manufacturer’s instructions, followed by incubation at 37 °C. Absorbance was measured at 450 nm using a microplate reader.
2.10. Wound Healing Assay
Cells were seeded into six-well plates and grown to approximately 90–100% confluence. A linear scratch was created using a sterile 200 µL pipette tip, and detached cells were removed by gentle washing with phosphate-buffered saline (PBS). Cells were then cultured in serum-free medium. Wounds were photographed at 0 h and 24 h, and closure was quantified in ImageJ.
2.11. Transwell Assay
Cell invasion was assessed using Transwell chambers with 8 µm pore size inserts (Corning, Corning, NY, USA), precoated with (Invasion) or without (Migration) Matrigel (Beyotime, China). Cells were serum-starved, resuspended in serum-free medium, and seeded into the upper chamber at a density of 1.5 × 10⁵ cells per insert. Medium containing 10% fetal bovine serum was added to the lower chamber as a chemoattractant. After incubation for 24 h at 37 °C, non-invading cells on the upper surface were removed with a cotton swab, whereas invaded cells on the lower surface were fixed, stained with crystal violet, photographed, and counted under a microscope. For quantification, cells were counted in four randomly selected microscopic fields per insert, and the average number of cells was calculated.
2.12. Cell Cycle and Apoptosis
Apoptosis was assessed using an Annexin V/propidium iodide (PI) double-staining assay. Cells were harvested with EDTA-free trypsin, washed with cold PBS and stained with Annexin V and propidium iodide (PI) according to the manufacturer’s instructions (Beyotime, China). Apoptotic cells were analyzed by flow cytometry. For cell cycle analysis, cells were collected after treatment, washed with PBS, and fixed in 70% ethanol at 4 °C overnight. After fixation, cells were incubated with PI and RNase-containing staining solution and subjected to flow cytometric analysis to determine cell cycle distribution.
2.13. RNA Sequencing and Analysis
Total RNA was extracted from T24 cells following siRNA-mediated knockdown and subjected to high-throughput RNA sequencing. Differentially expressed genes (DEGs) were identified based on the criteria of an |log2(FoldChange)| ≥ 1.0 and a p-value < 0.05. All downstream bioinformatic analyses were conducted using R software (Version 4.4.1). Gene Ontology (GO), Kyoto Encyclopedia of Genes and Genomes (KEGG) and Gene Set Enrichment Analysis (GSEA) enrichment analysis was performed using the clusterProfiler R package (version 4.8.1).
2.14. Co-Immunoprecipitation (Co-IP)
Co-IP was performed with the Pierce Classic Magnetic IP/Co-IP Kit (Thermo Fisher Scientific, Waltham, MA, USA). Cells were lysed on ice in IP lysis/wash buffer supplemented with protease inhibitors, and clarified lysates were obtained by centrifugation. For each reaction, 500–1000 µg total protein was combined with 2–10 µg specific antibody (or IgG), topped up to 500 µL with IP lysis/wash buffer, and left to allow immune-complex formation (1 h at room temperature or overnight at 4 °C). Meanwhile, 25 µL protein A/G magnetic beads were washed as recommended, then added to the mixture and rotated for 1 h at room temperature. After binding, the beads were rinsed three times with 500 µL IP lysis/wash buffer and once briefly with water to reduce background. Complexes were released with 100 µL elution buffer for 10 min and immediately neutralized (10 µL neutralization buffer per 100 µL eluate); when needed, elution was instead performed directly in 1× sample buffer for SDS–PAGE. The eluates were finally subjected to immunoblotting with the indicated antibodies
2.15. Molecular Docking
Rigid protein–protein docking was performed using the HDOCK platform. Three-dimensional structures of the target proteins were retrieved from the UniProtKB database based on their corresponding gene names. The protein structures were submitted to the HDOCK server, and docking calculations were carried out using default protein–protein docking parameters. The top 10 predicted docking models were collected according to the HDOCK scoring system, with the top-ranked model considered the most favorable binding conformation. Binding free energy was used as a primary evaluation criterion, with values lower than −30 kcal/mol indicating stable interactions. Following docking, binding free energy was further estimated using HawkDock, and molecular interaction features, including interaction interface, hydrogen bonding, and key amino acid residues, were analyzed. Docking results were visualized using PyMOL (version 3.1). It should be noted that molecular docking was applied as a supportive in silico approach to provide structural insight into the potential protein interaction and does not represent experimental structural validation.
2.16. Dual-Luciferase Reporter Assay
Promoter regions of SAPCD2 and PLAGL2 were amplified and inserted upstream of the luciferase coding sequence in the pGL3-Basic vector (Promega, Madison, WI, USA) to generate the corresponding wild-type reporter constructs (WT-SAPCD2 and WT-PLAGL2). To assess sequence-specific regulatory effects, matched mutant promoters carrying the intended binding-site substitutions were produced and cloned into the same vector to obtain MUT-SAPCD2 and MUT-PLAGL2 reporters. Cells were plated in advance and co-transfected with the indicated pGL3 reporter plasmids together with the relevant expression plasmid (or control vector) using standard transfection procedures. After 48 h, luciferase signals were quantified with the Dual-Luciferase® Reporter Assay System (Promega) according to the manufacturer’s guidelines.
2.17. Chromatin Immunoprecipitation (ChIP)
ChIP was conducted with the BeyoChIP™ ChIP Assay Kit (Beyotime, China). Cells were fixed with formaldehyde, and the reaction was stopped with glycine. After lysis, chromatin was incubated with an anti-PLAGL2 antibody; IgG (Proteintech, China) served as the negative control. Protein–DNA complexes were collected on protein A/G magnetic beads, washed stringently, and then eluted. Crosslinks were reversed, proteins were digested, and DNA was purified for qPCR. qPCR targeted three predicted PLAGL2-binding regions in the SAPCD2 promoter using the following primers: site 1 (F: 5′-GCTGACCGCACTACATCCTT-3′; R: 5′-CCTAGAAGGAGCCCTGTCCT-3′), site 2 (F: 5′-ACCCCCTCCAAAGATCCCAC-3′; R: 5′-AGCCTACGATCCTCTTGGGG-3′), and site 3 (F: 5′-ACGGCGACAATAGCGACTAC-3′; R: 5′-GCGGCGCATGTTAATGAGG-3′). Enrichment was normalized to input DNA, with the IgG signal treated as background.
2.18. In Vivo Experiment
Stable BCa cell lines were used to establish xenograft and metastasis models in 4-week-old female BALB/c nude mice. The mice were obtained from SPF Biotechnology (Beijing, China) and housed in a barrier facility under specific pathogen-free conditions with a 12 h light/dark cycle. The animals had not undergone any previous experimental procedures prior to enrollment in this study. The experimental unit was defined as a single mouse.
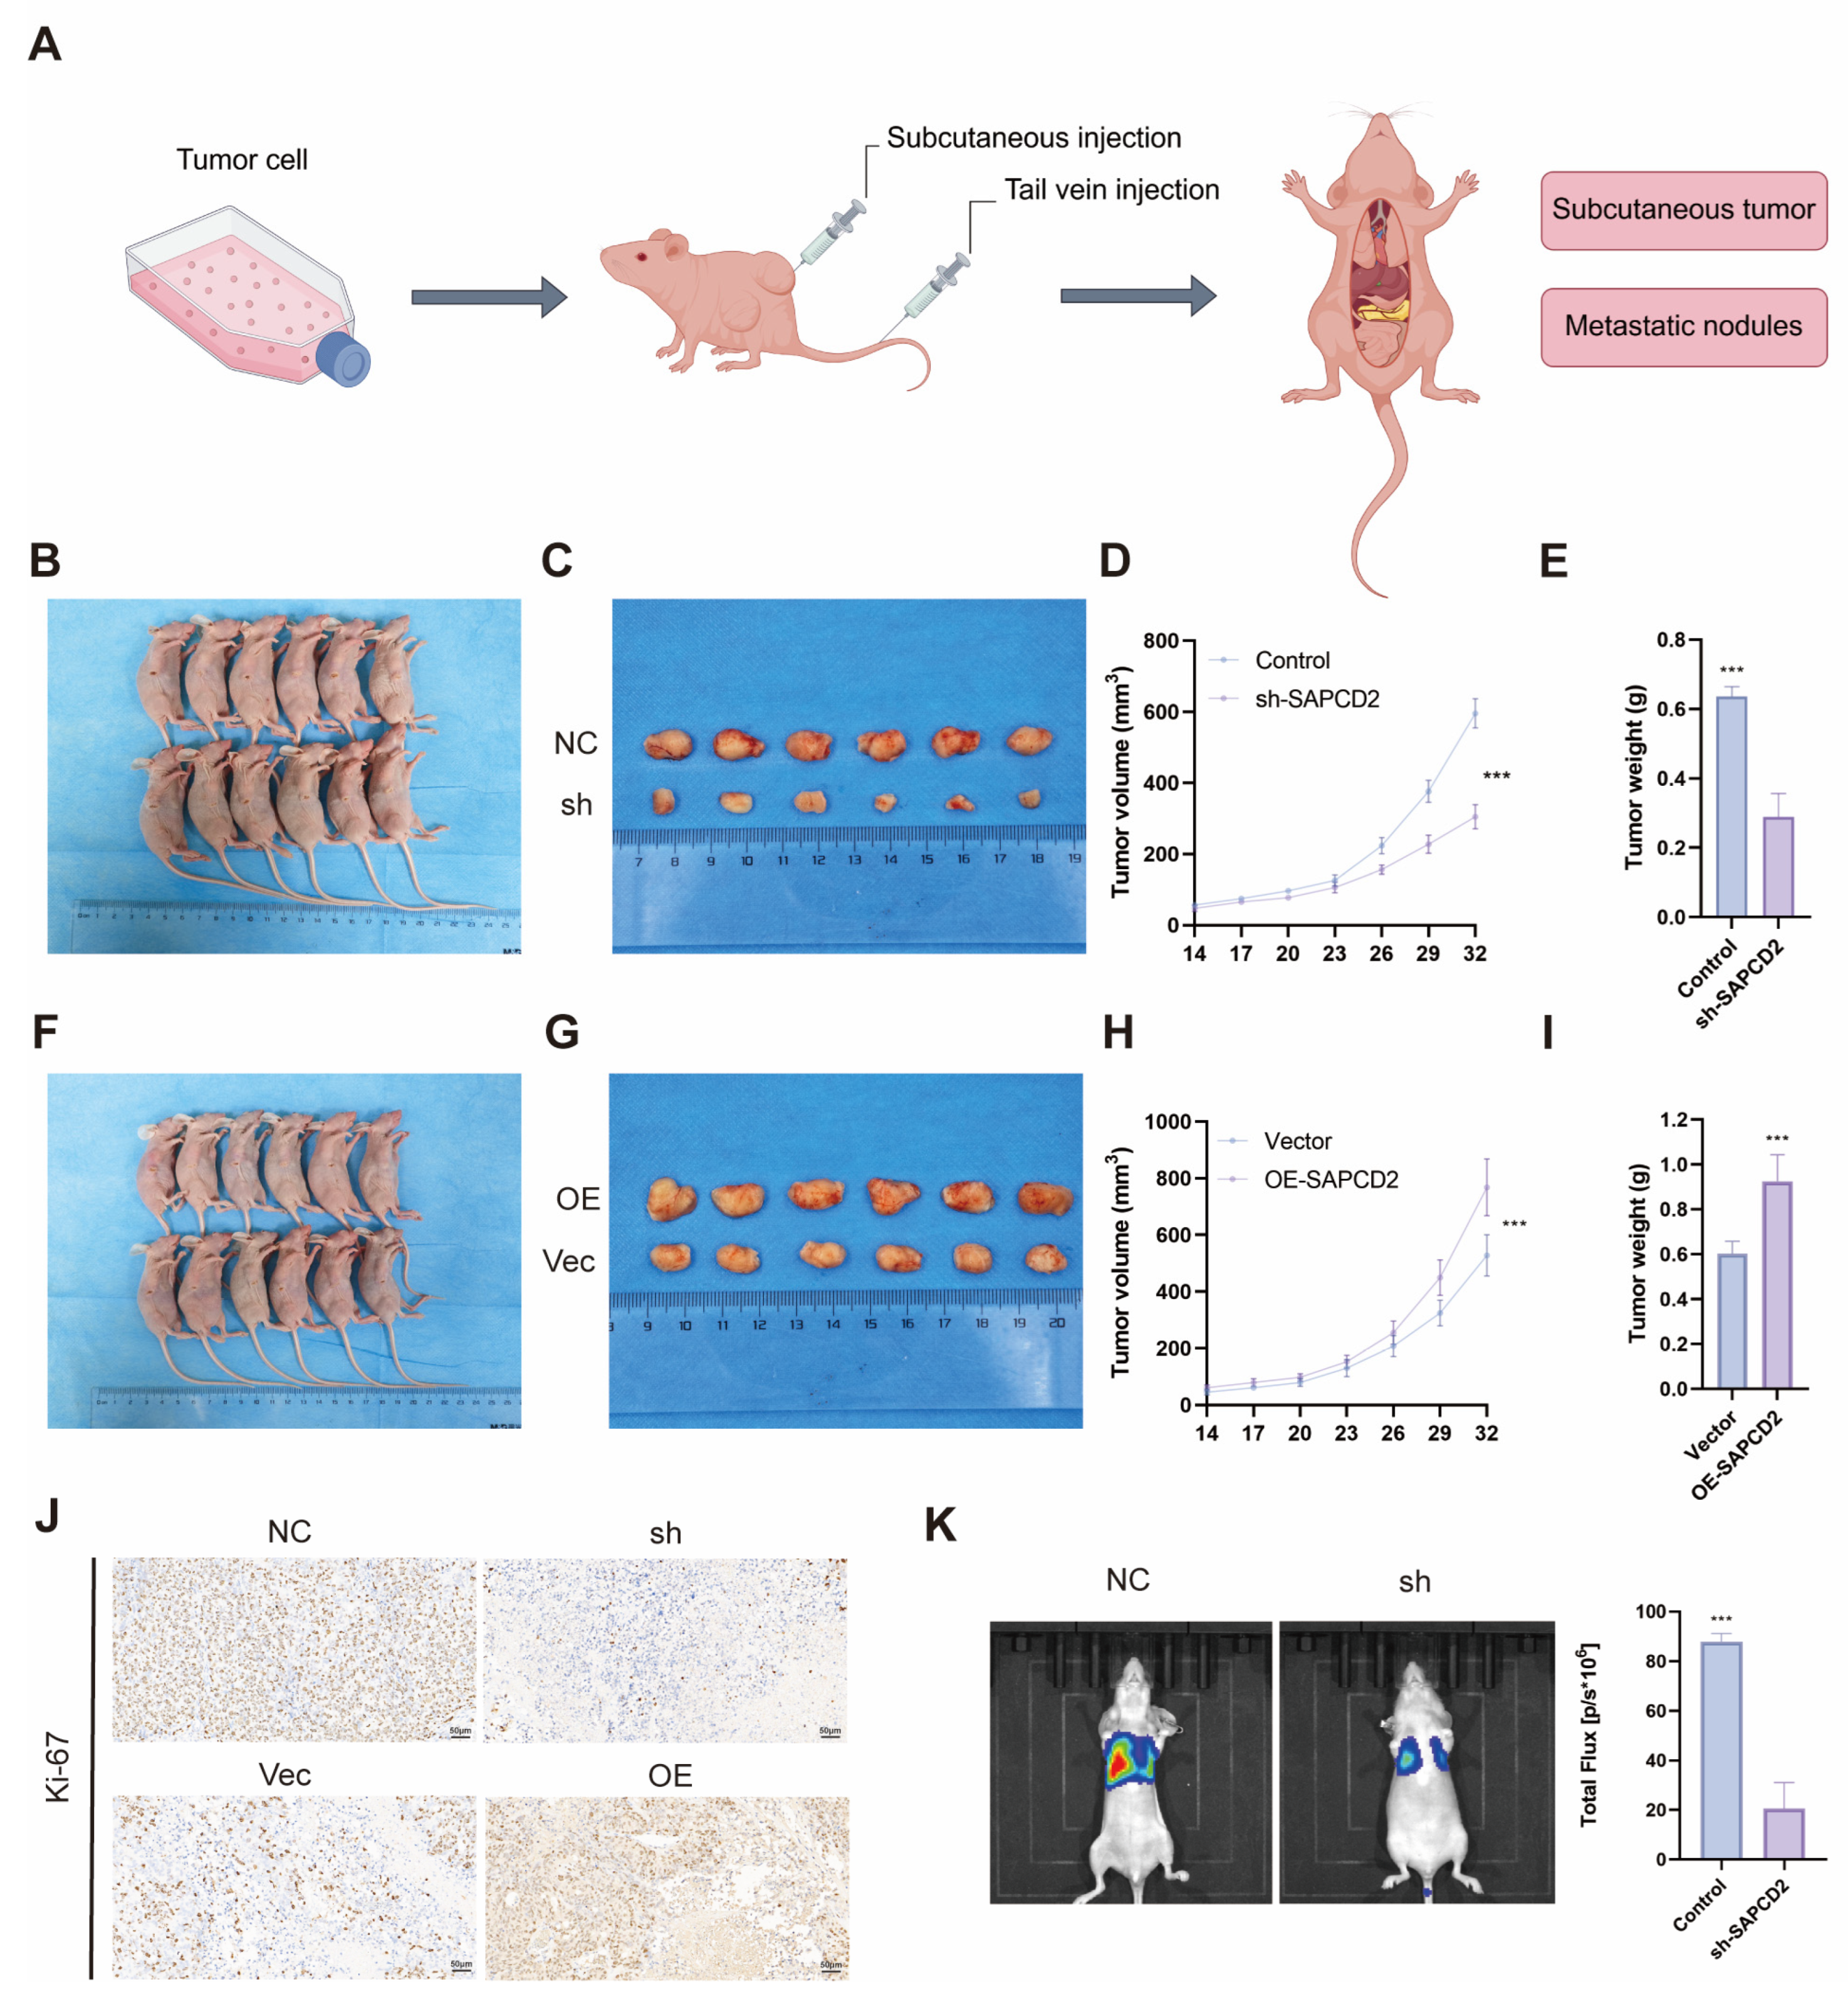
For subcutaneous growth, 5 × 10⁶ cells were injected into the flank. Tumor size and body weight were recorded every 3 days, and volume was calculated as (length × width2)/2.
For experimental metastasis, 1 × 10⁶ luciferase-labeled cells were delivered via tail vein injection. Metastatic burden was evaluated by bioluminescence imaging, followed by sacrifice and collection of lungs for fixation in 4% paraformaldehyde and H&E staining to assess metastatic nodules.
The animal experiments were conducted with 6 mice in each group, and a total of 72 mice were used. Sample sizes were determined based on prior experience with similar xenograft models and on commonly used group sizes reported in the literature, which are sufficient to detect biologically meaningful differences in tumor growth and metastatic burden. All animals injected with viable tumor cells and surviving until the predefined experimental endpoint were included in the analyses. No animals, experimental units, or data points were excluded. Randomization was performed using a simple random number generator. Animals were age- and sex-matched and housed under identical conditions. Tumor cell injections and measurements were performed using standardized procedures at comparable time points across groups. No additional measures were taken to control for the order of measurements or cage location. Group allocation was performed by one investigator, who was not involved in outcome assessment or data analysis. Tumor measurements and data analysis were conducted by independent investigators who were unaware of group allocation.
This experiment was approved by the Animal Welfare Ethics Committee of Beijing MDKN Biotechnology Co., Ltd. (Approval Number: MDKN-2025-063), and was conducted in strict accordance with the experimental animal care and use guidelines of the Beijing Animal Control Committee.
2.19. Statistical Analysis
All quantitative data are presented as the mean ± SD. Data distribution was assessed prior to statistical analysis. Differences between the two groups were assessed using Student’s t-test when data met normality assumptions, while comparisons among multiple groups were evaluated by one-way ANOVA. When assumptions for parametric tests were not met, appropriate non-parametric methods were applied. Differences between categorical variables were analyzed using the chi-square test or Fisher’s exact test, as appropriate. Survival analyses were performed using the Kaplan–Meier method. Correlations between variables were assessed using Pearson or Spearman correlation analysis, depending on data distribution. Statistical significance was defined as a two-sided p value < 0.05. Data visualization and statistical analyses were conducted using GraphPad Prism software (version 9.0; La Jolla, CA, USA).
4. Discussion
In this study, we provided evidence supporting a role for SAPCD2 in BCa progression and proposed a multilayered regulatory network through which SAPCD2 might contribute to sustained malignant signaling. Our data indicated that SAPCD2 was frequently upregulated in BCa, was associated with aggressive clinicopathological features and unfavorable prognosis, and influenced tumor growth and metastatic behavior in experimental models. Beyond its potential clinical relevance, our findings suggested that SAPCD2 participated in the integration of post-translational regulation, oncogenic signaling, and transcriptional feedback mechanisms converging on MAPK pathway activity in BCa.
SAPCD2 upregulation has been reported in multiple malignancies and is commonly associated with enhanced proliferation, invasion, and poor clinical outcomes [
20,
21]. Previous mechanistic studies have primarily linked SAPCD2 to mitotic regulation and chromosomal stability, as well as to signaling pathways such as Wnt/β-catenin [
15]. Our results extended these observations by suggesting that, in BCa, SAPCD2 was closely connected with MAPK signaling. This finding was consistent with a context-dependent model in which SAPCD2 engaged distinct downstream pathways depending on tumor type and cellular background.
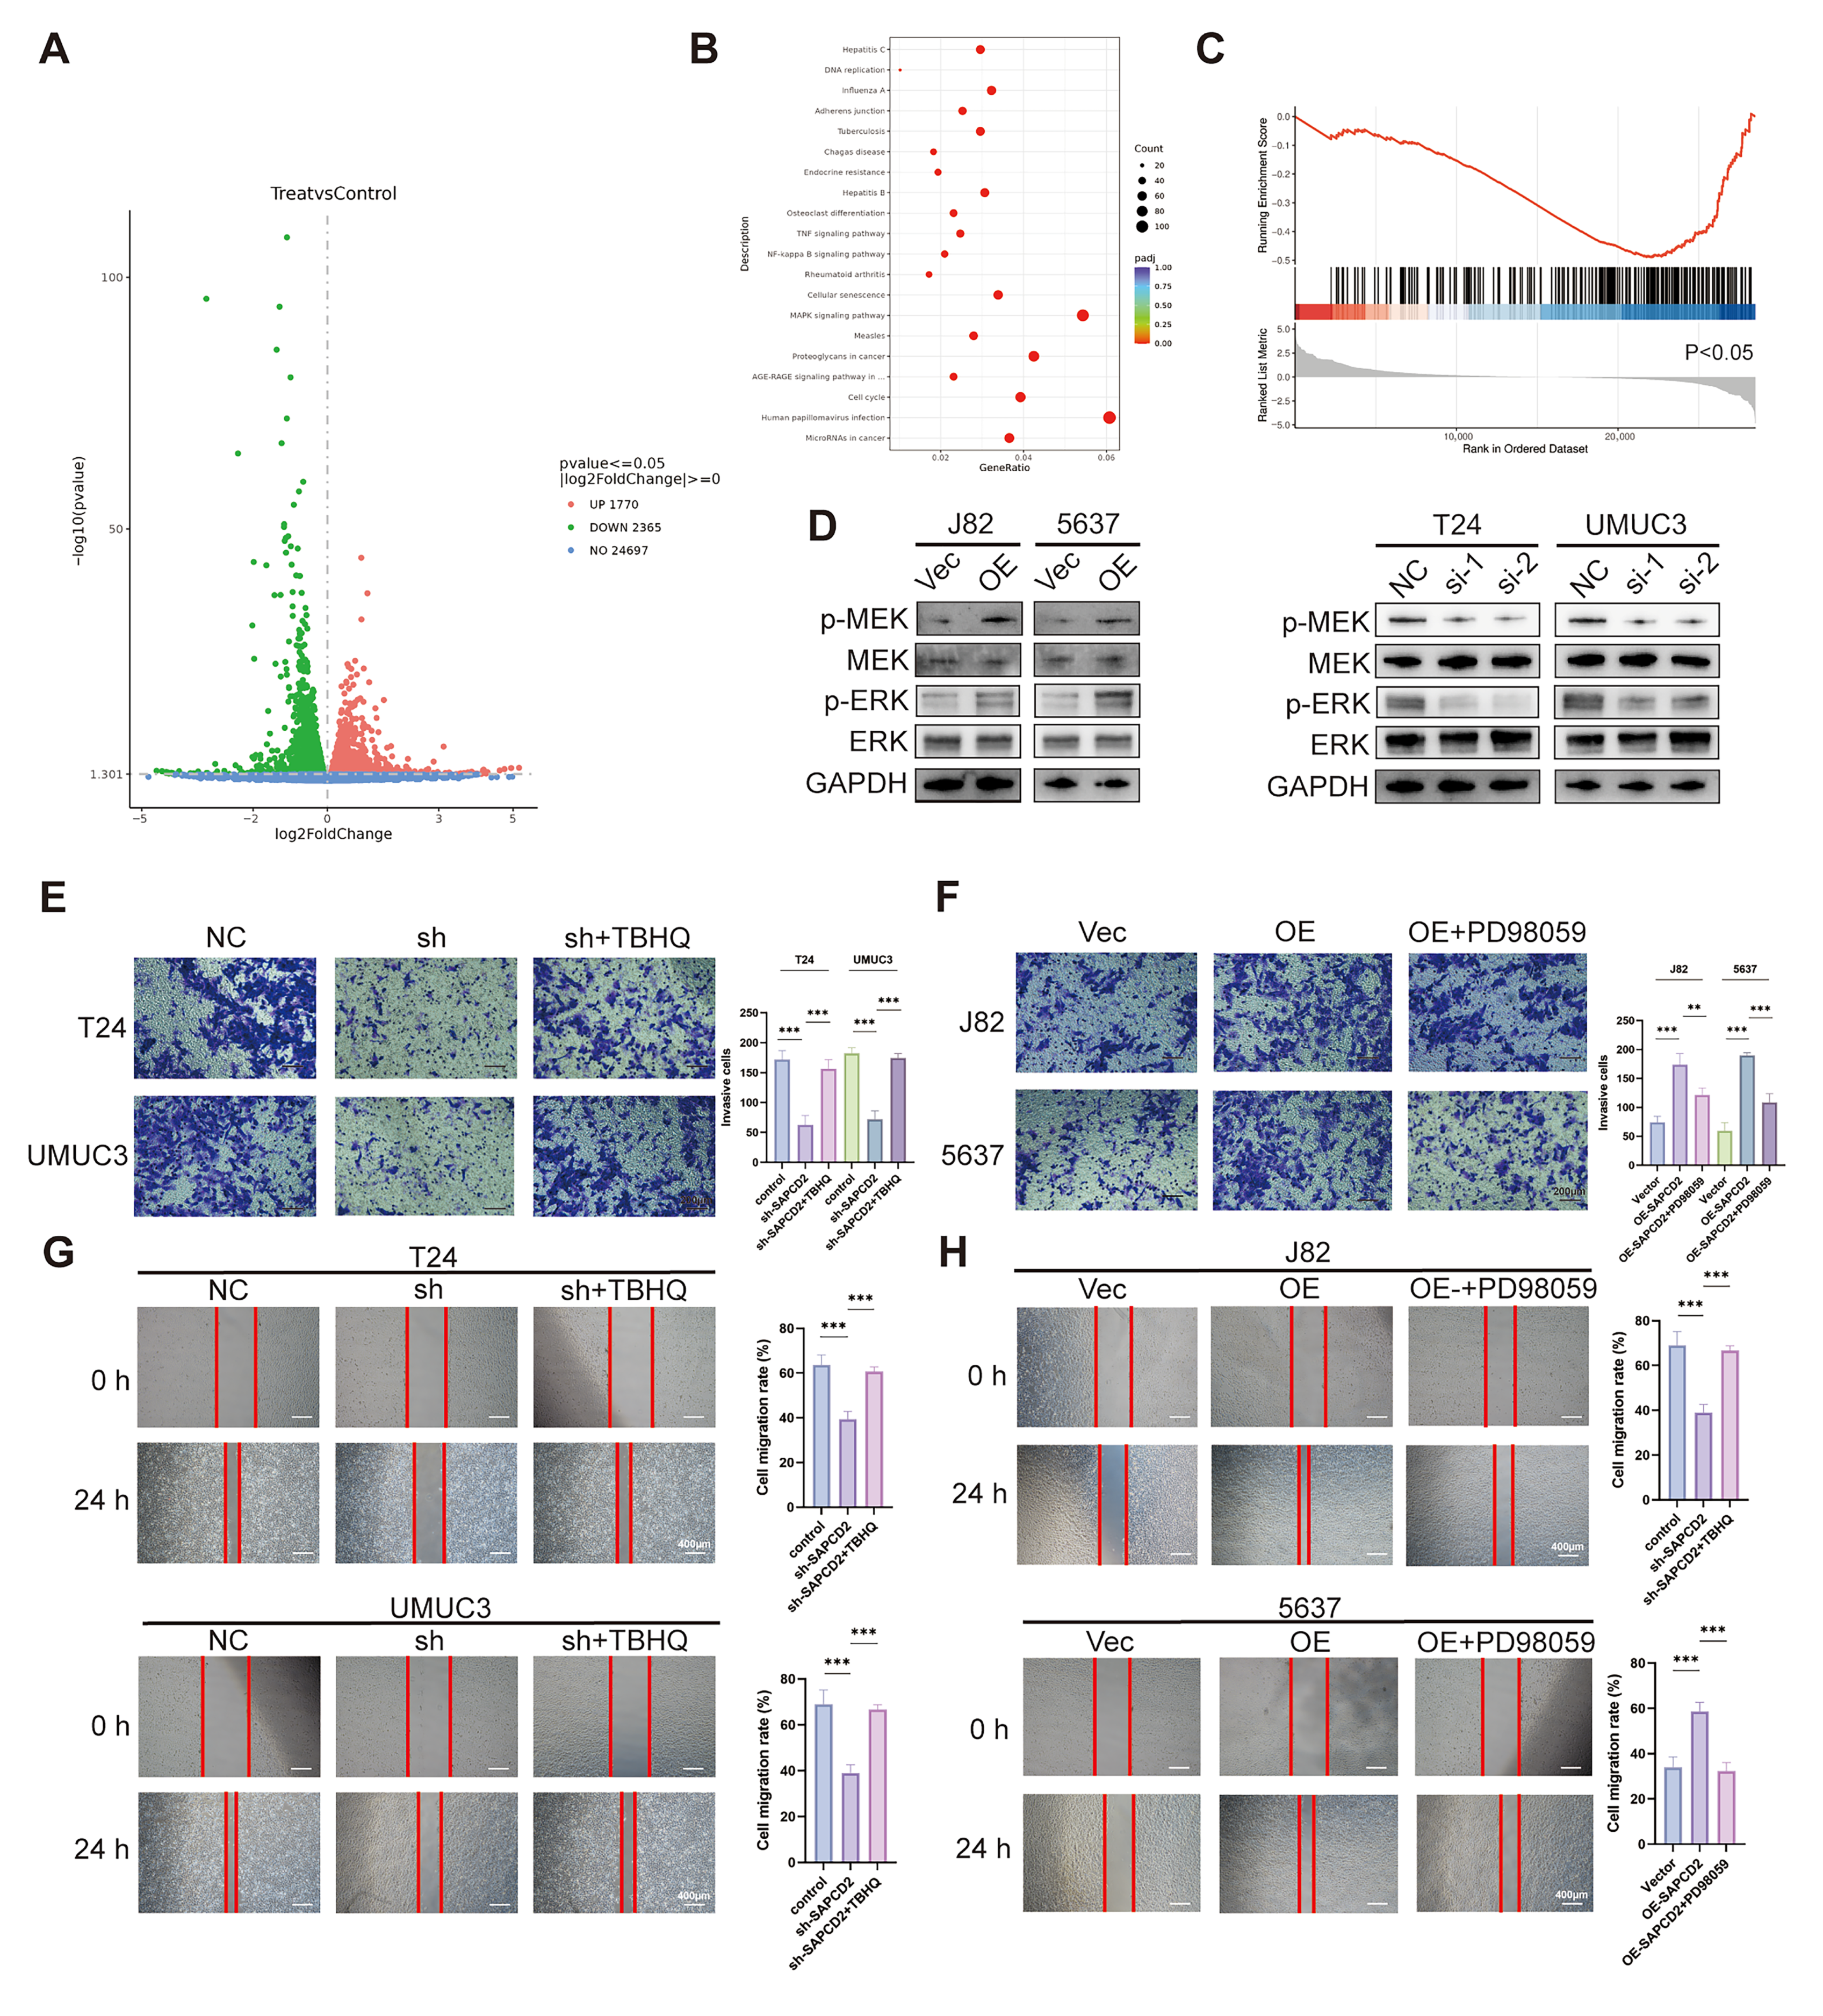
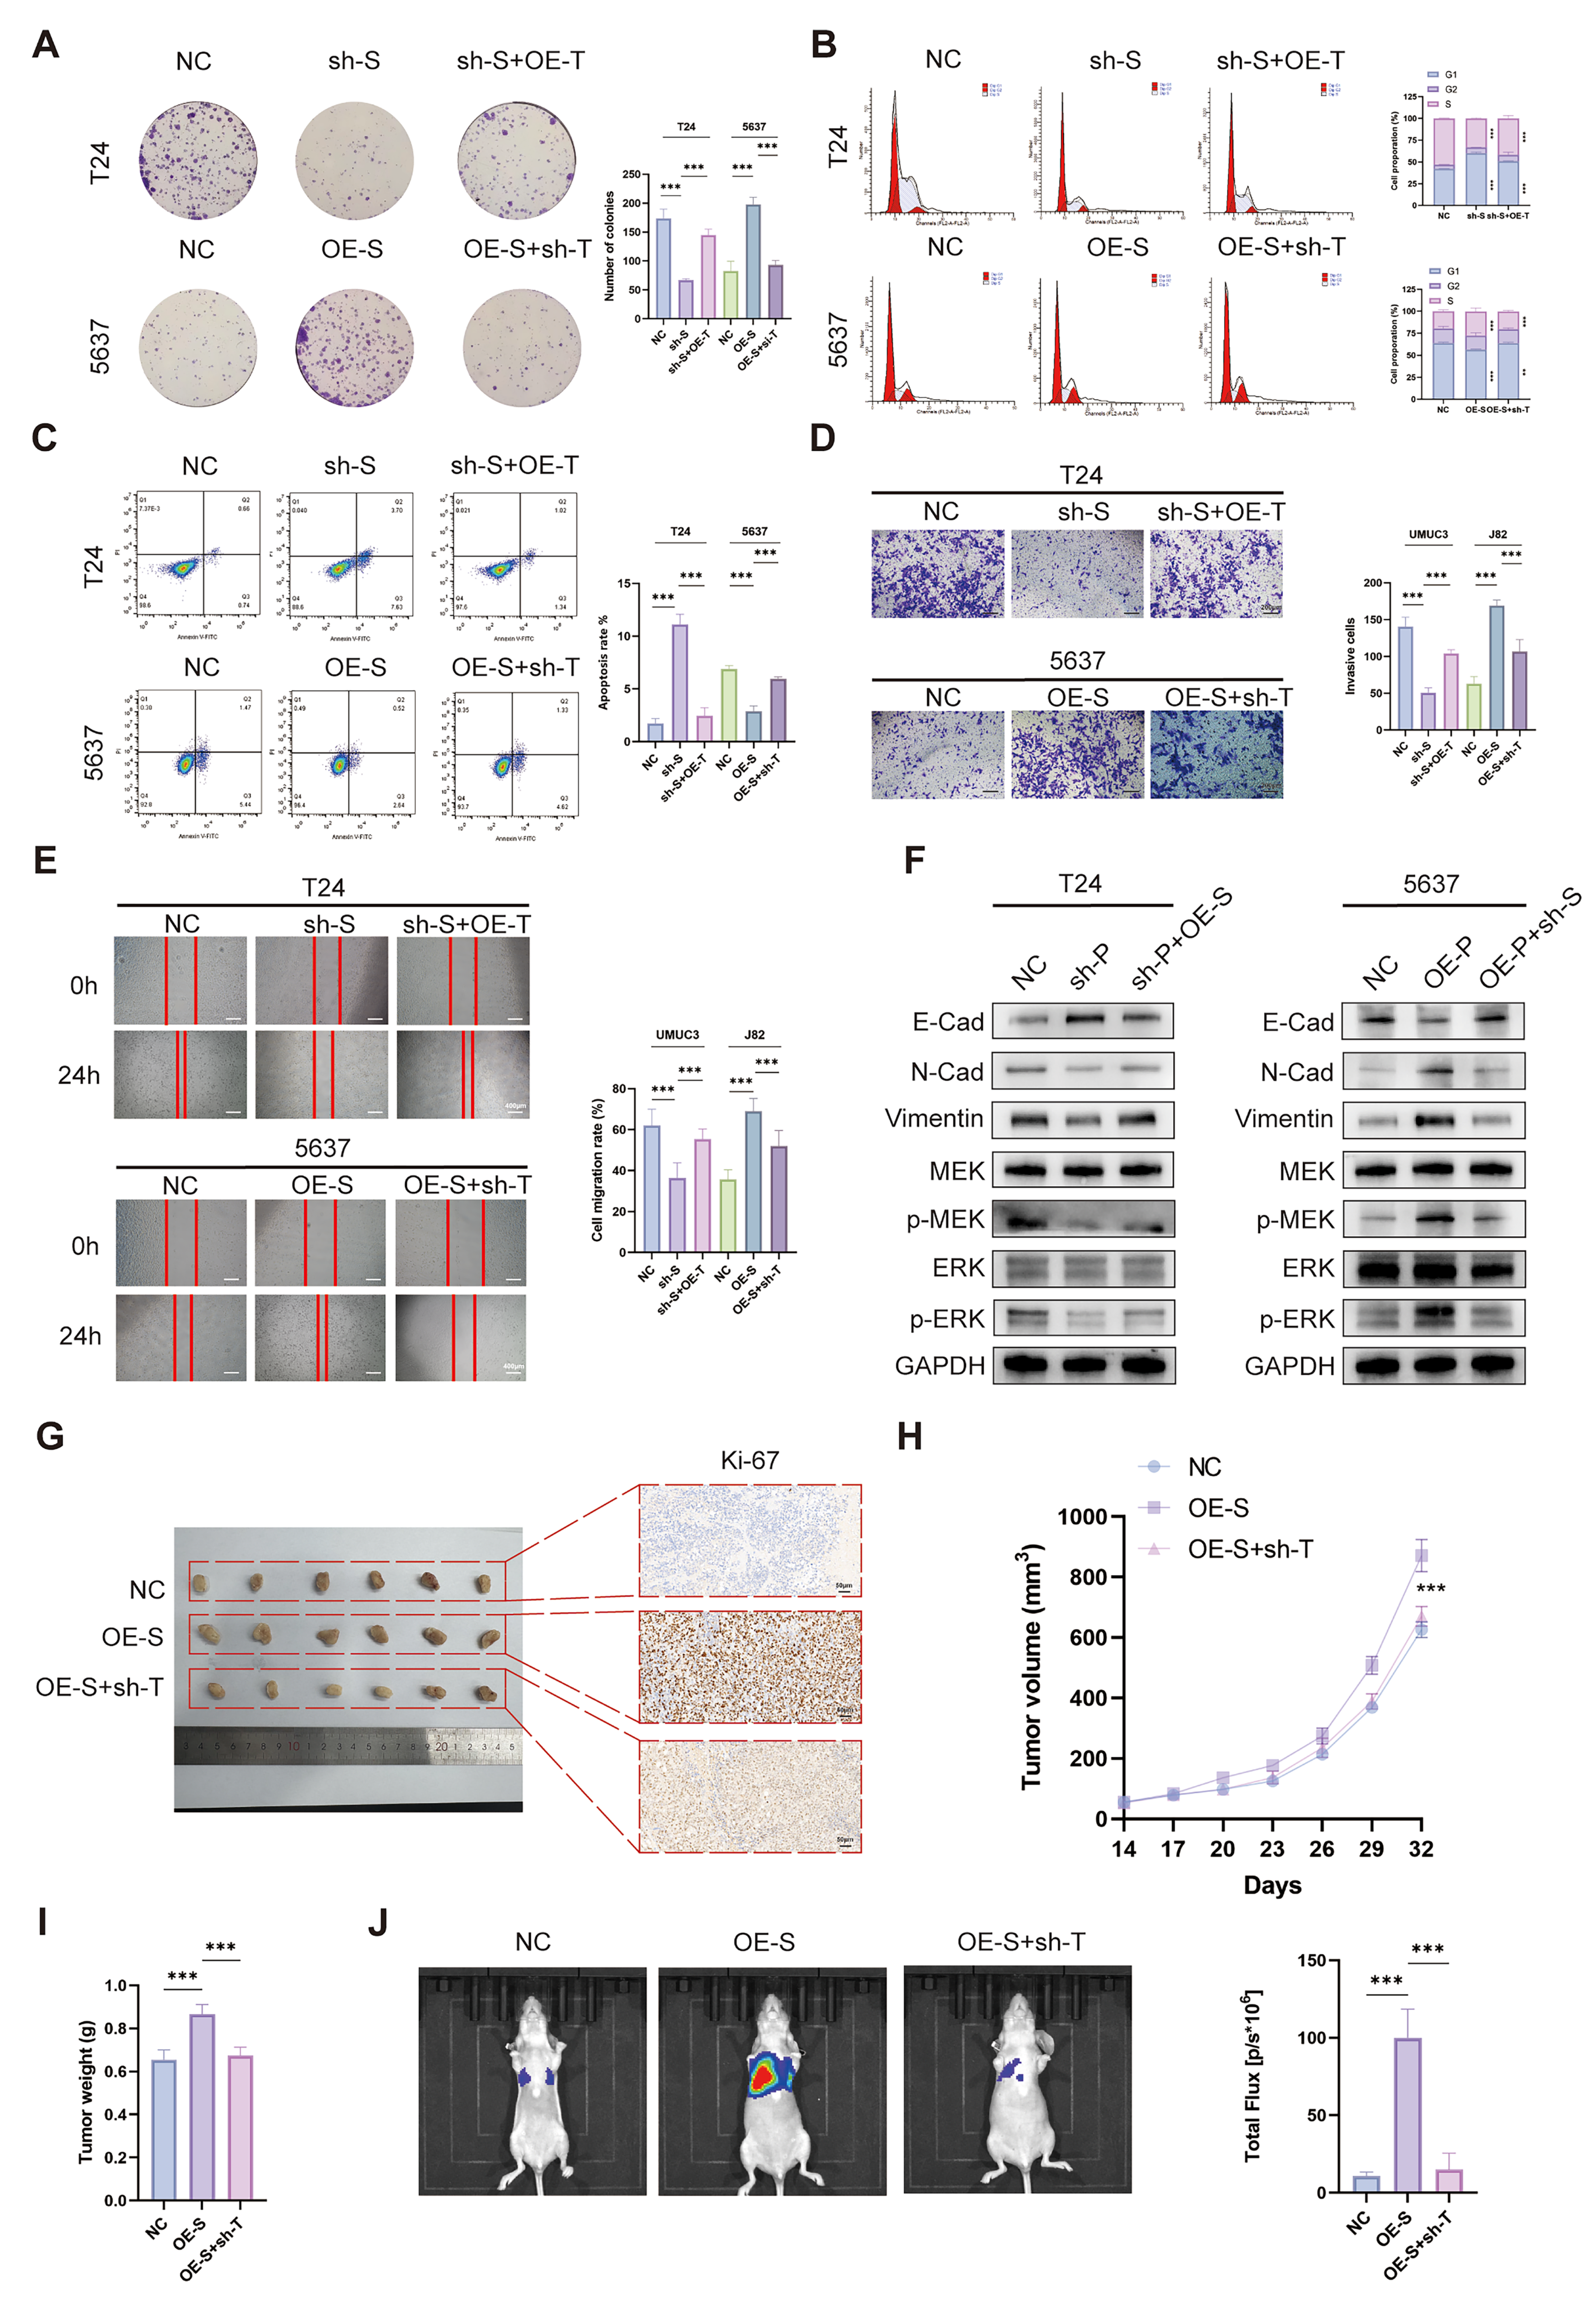
Although modulation of SAPCD2 expression produced pronounced effects on cell cycle progression, survival, and metastatic phenotypes, the significance of these observations lay in their convergence on pathway-level dependency. Transcriptomic profiling, pathway enrichment analyses, and pharmacological modulation collectively pointed to MAPK signaling as a major pathway associated with SAPCD2 activity in BCa models. Notably, altering MAPK pathway activity substantially modified the phenotypic consequences of SAPCD2 gain or loss, supporting a model in which SAPCD2 influenced malignant behavior at least in part through MAPK-related signaling.
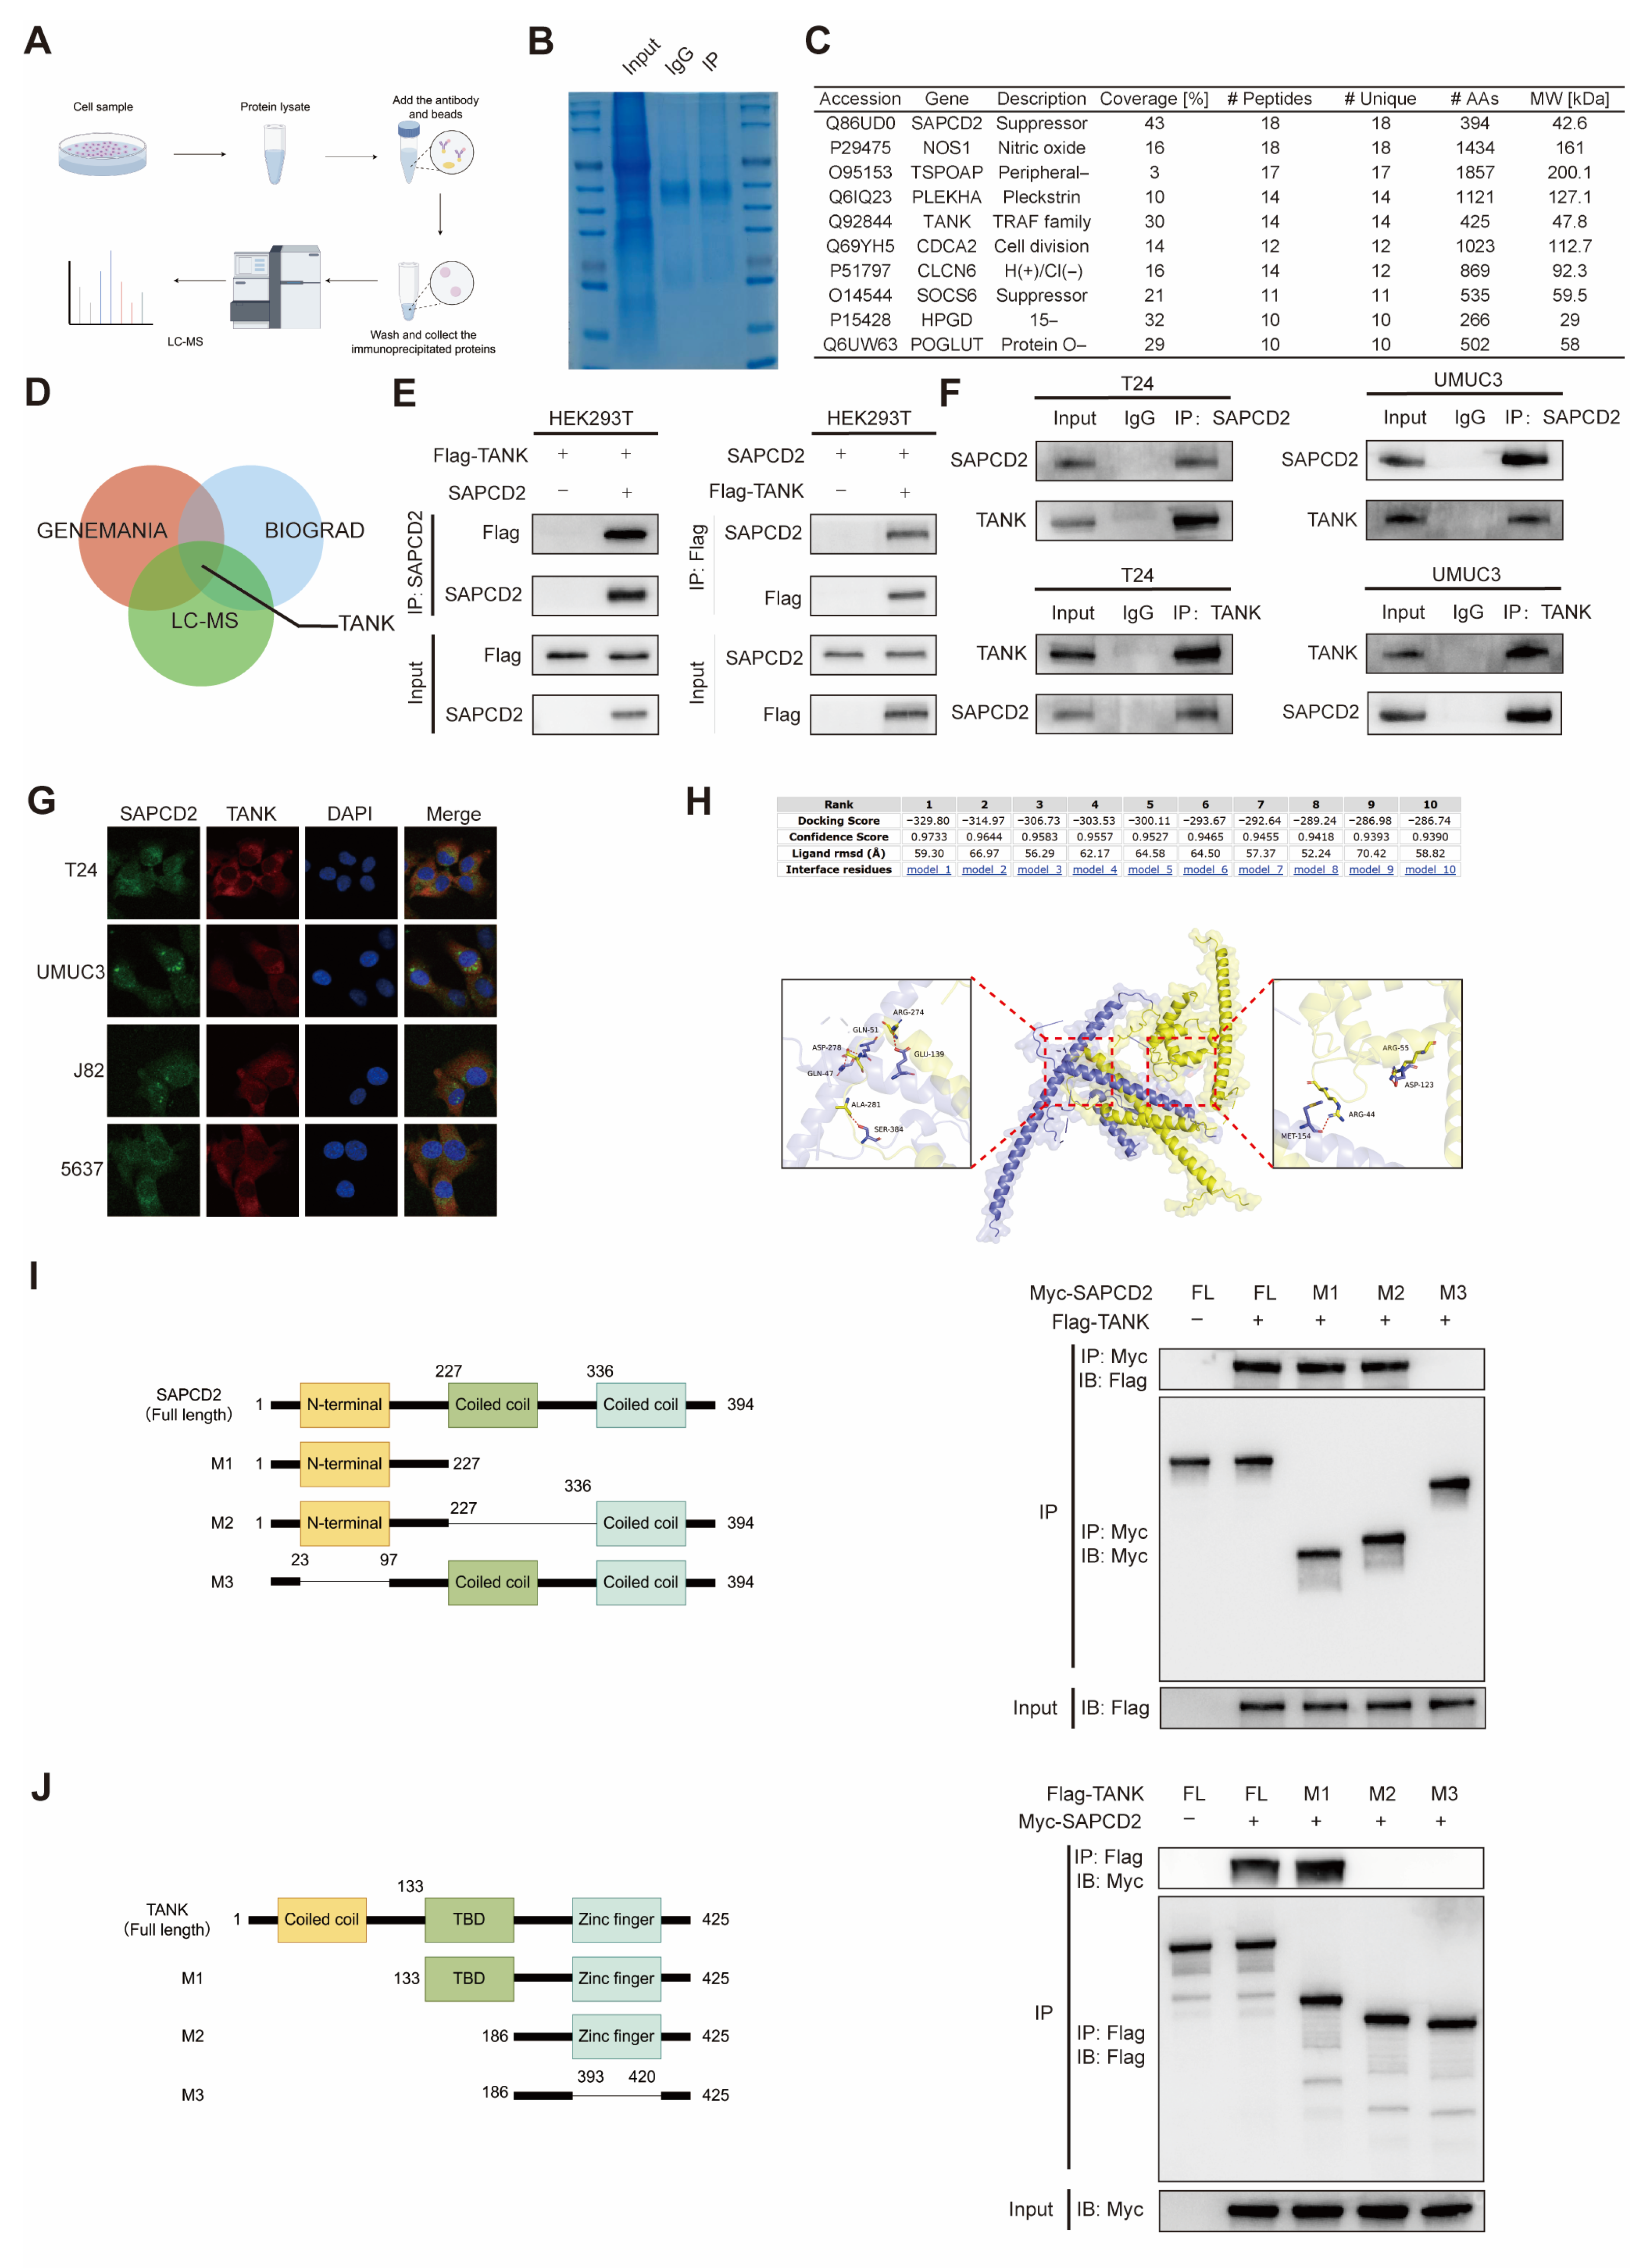
An important mechanistic aspect of this study was the identification of TANK as an interaction partner linking SAPCD2 to MAPK pathway regulation. TANK has been characterized as a scaffold protein involved in integrating TNF, NF-κB, and MAPK signaling; however, the regulation of its protein stability in cancer contexts has remained incompletely understood [
18]. Our data suggested that SAPCD2 associated with TANK and modulates its abundance, and that genetic manipulation of TANK alters MAPK activity and malignant phenotypes in SAPCD2-modified models. Together, these observations supported the notion that TANK might function as an intermediary through which SAPCD2 influenced MAPK signaling.
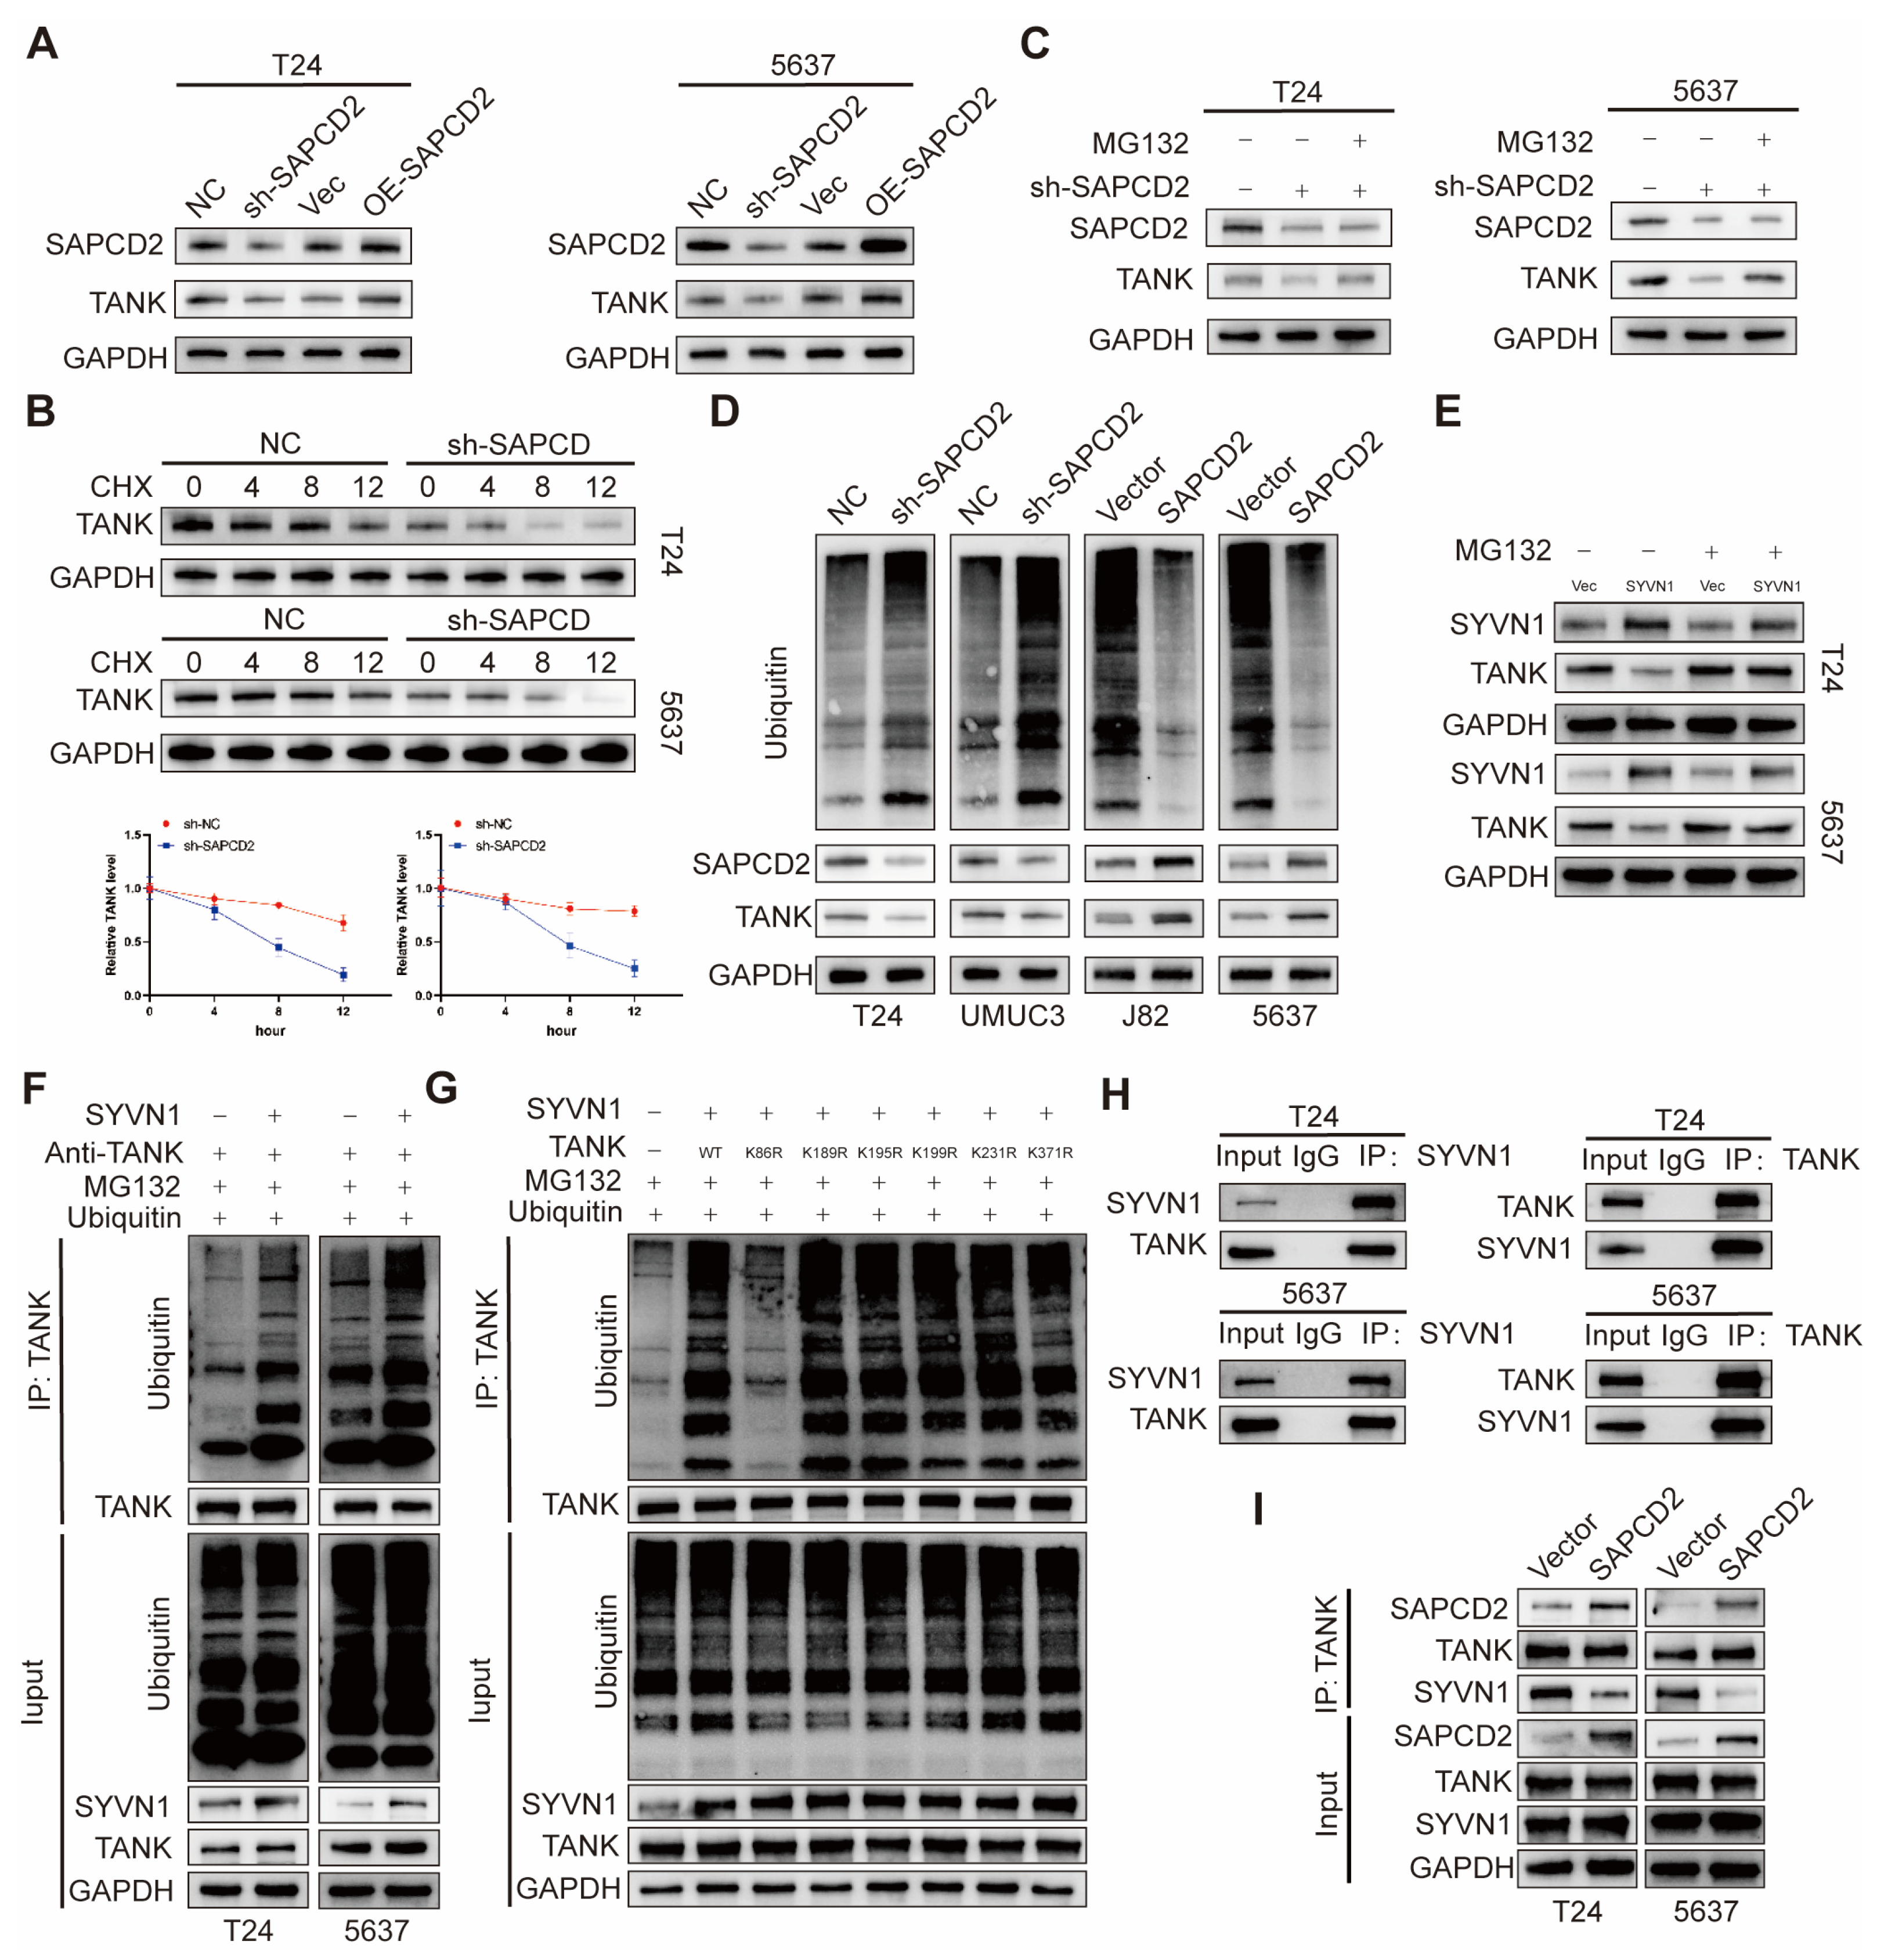
Further analyses suggested that SAPCD2 affected TANK stability by interfering with SYVN1-dependent ubiquitination. SYVN1 is an ER-resident E3 ubiquitin ligase that has been implicated in the regulation of multiple signaling pathways [
22,
23,
24]. Our findings showed that SYVN1 directly ubiquitinated TANK at lysine 86, promoting its proteasomal degradation, and that SAPCD2 interfered with this process by limiting the interaction between SYVN1 and TANK. As a result, SAPCD2 enabled sustained accumulation of TANK and prolonged MAPK pathway activation. Unlike typical transient signaling, where pathways were tightly regulated, this mode of regulation emphasizes how SAPCD2 reprograms the cellular proteostasis machinery to maintain prolonged signaling. By stabilizing TANK, SAPCD2 ensured continuous MAPK activation, promoting the persistent malignant behaviors seen in BCa cells
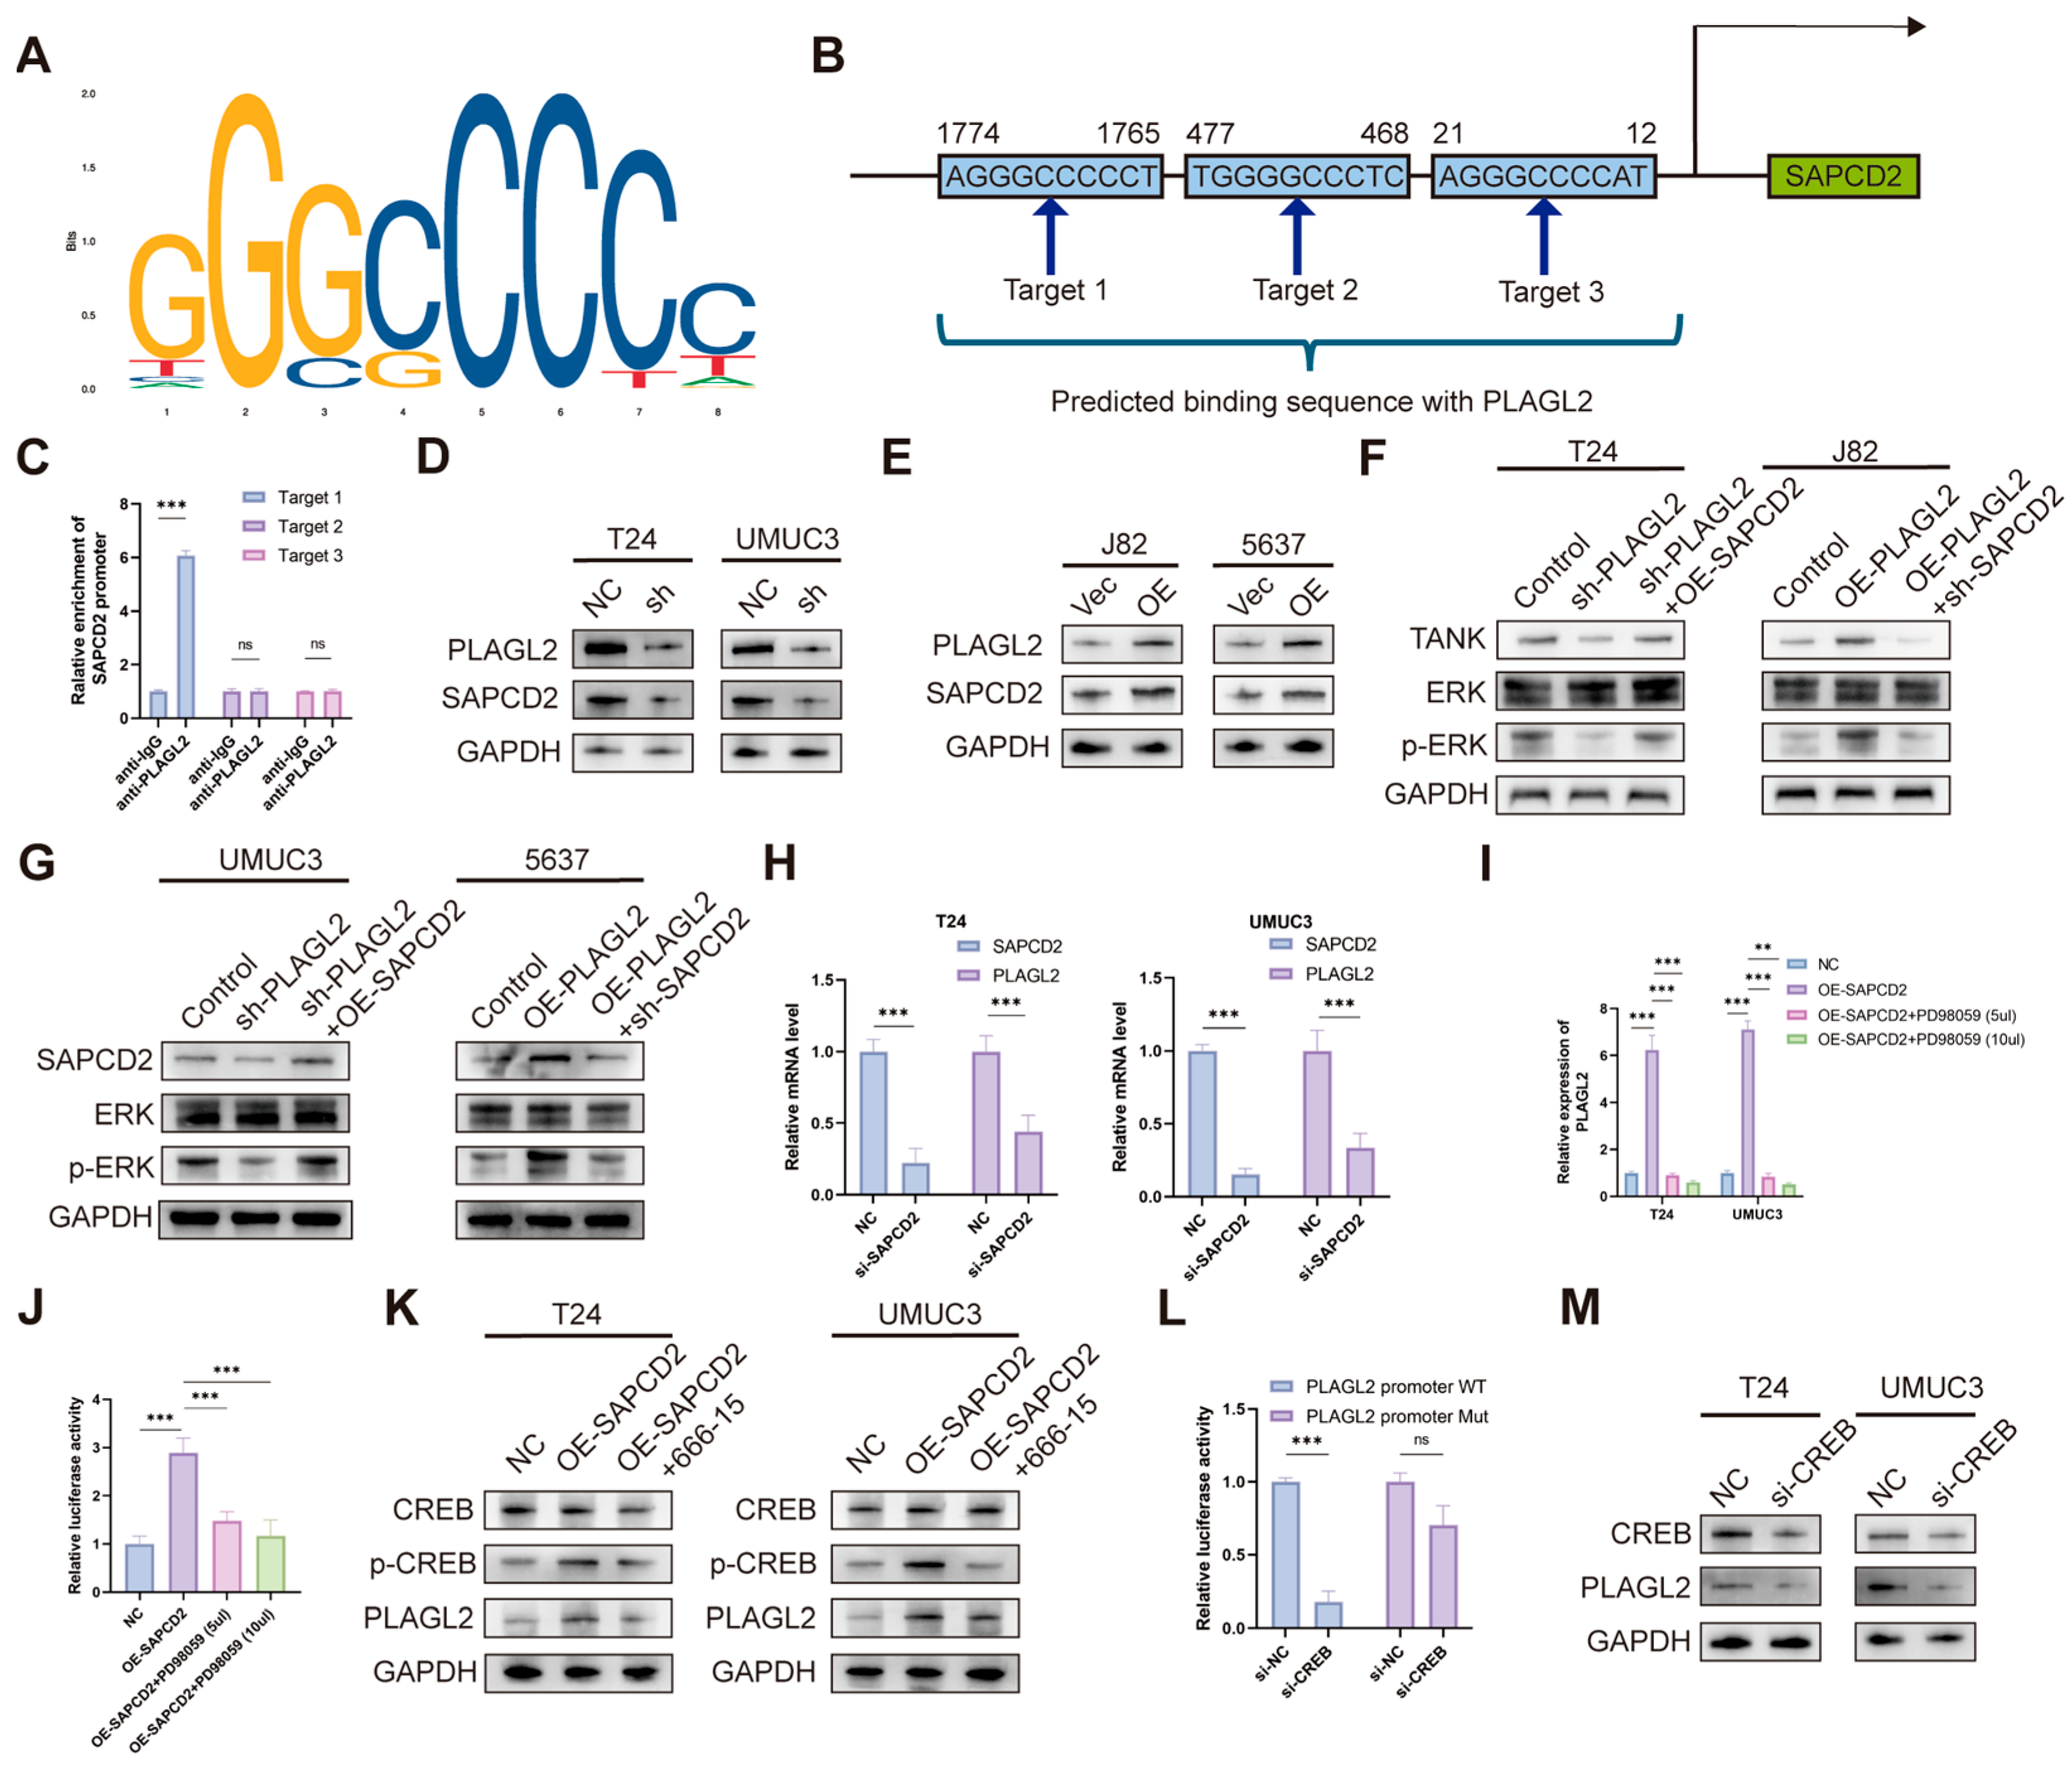
Upstream of SAPCD2, we identified PLAGL2 as a direct transcriptional activator that binds the SAPCD2 promoter and enhances its expression. PLAGL2 has recently emerged as an oncogenic transcription factor capable of coordinating tumor-intrinsic programs with microenvironmental remodeling [
25,
26]. Our findings extended its functional repertoire by establishing SAPCD2 as a critical PLAGL2 target in BCa. Notably, SAPCD2 did not merely act downstream of PLAGL2 but fed back to reinforce PLAGL2 expression through MAPK-dependent CREB phosphorylation. In this circuit, SAPCD2 enhanced MAPK signaling, leading to CREB activation, which in turn drives PLAGL2 transcription; elevated PLAGL2 then further promoted SAPCD2 expression. This closed-loop architecture provides a mechanistic explanation for the sustained and self-amplifying signaling observed in SAPCD2-high tumors and illustrates how transcriptional and post-translational regulation converge to stabilize oncogenic states.
Such positive feedback loops have been implicated in maintaining sustained oncogenic signaling and promoting phenotypic stability in cancer cells, often buffering against perturbations from upstream inhibitors and contributing to aggressive tumor behavior [
27,
28]. the multi-layered feedback circuitry identified here suggests that targeting a single pathway component may be insufficient for durable therapeutic benefit. Future studies could explore combination strategies aimed at disrupting this network at multiple nodes, such as concurrently modulating MAPK signaling, transcriptional regulators (e.g., PLAGL2 or CREB), and protein stability mechanisms affecting TANK. Such approaches may help overcome pathway redundancy and adaptive resistance.
Several limitations of this study warranted careful consideration. First, much of the mechanistic work was performed using established BCa cell lines, which might not fully capture the molecular heterogeneity of primary tumors. Second, the number of human BCa tissue samples analyzed was relatively limited, which might restrict the generalizability of the clinical correlations observed. Third, the in vivo experiments relied primarily on xenograft models in immunodeficient mice, which did not recapitulate the complexity of tumor–immune interactions. Given the known roles of MAPK signaling and PLAGL2 in immunomodulation, future studies using immunocompetent or patient-derived models will be important to more fully define the biological relevance of this signaling axis.




 ,
,