CT-Based Radiomics in the Characterization of Solid Renal Tumors: A Systematic Review

 ,
,  ,
,  , and
, and
Simple Summary
Abstract
1. Introduction
2. Methods
2.1. Literature Search Strategy and Selection Criteria
2.2. Data Extraction
2.3. Quality Assessment
2.4. Statistical Analysis
3. Results
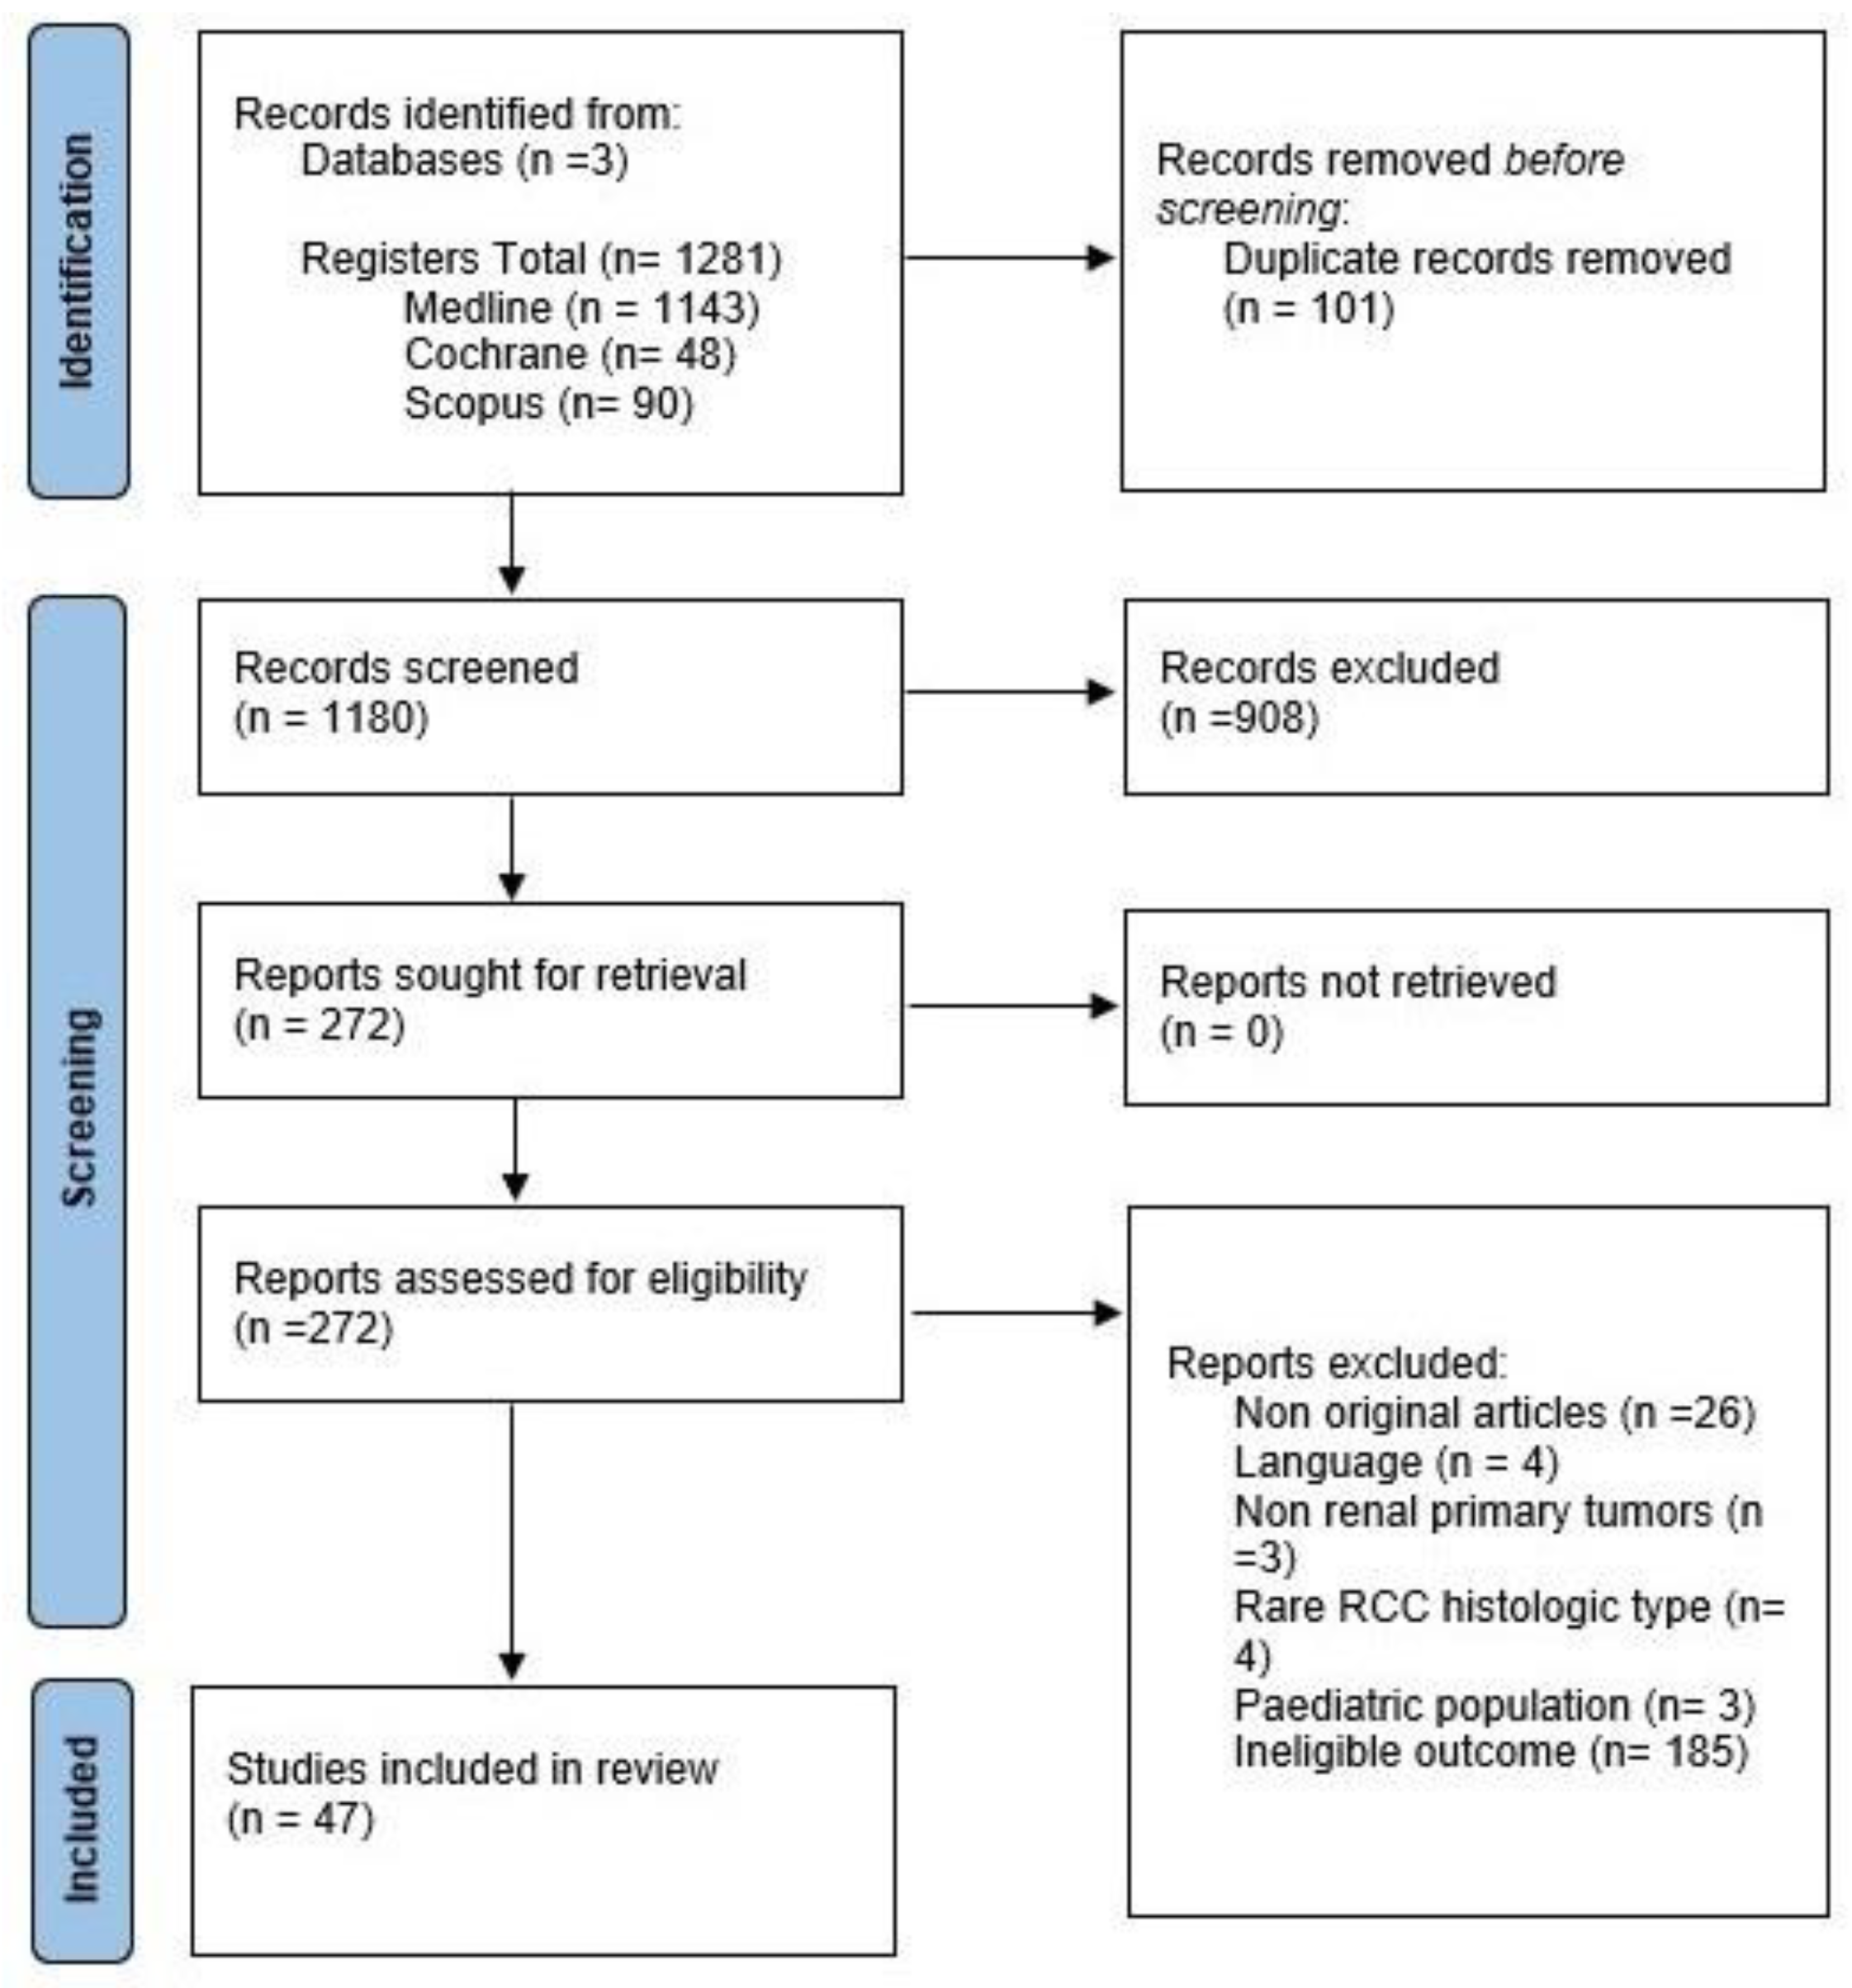
3.1. Search Finding
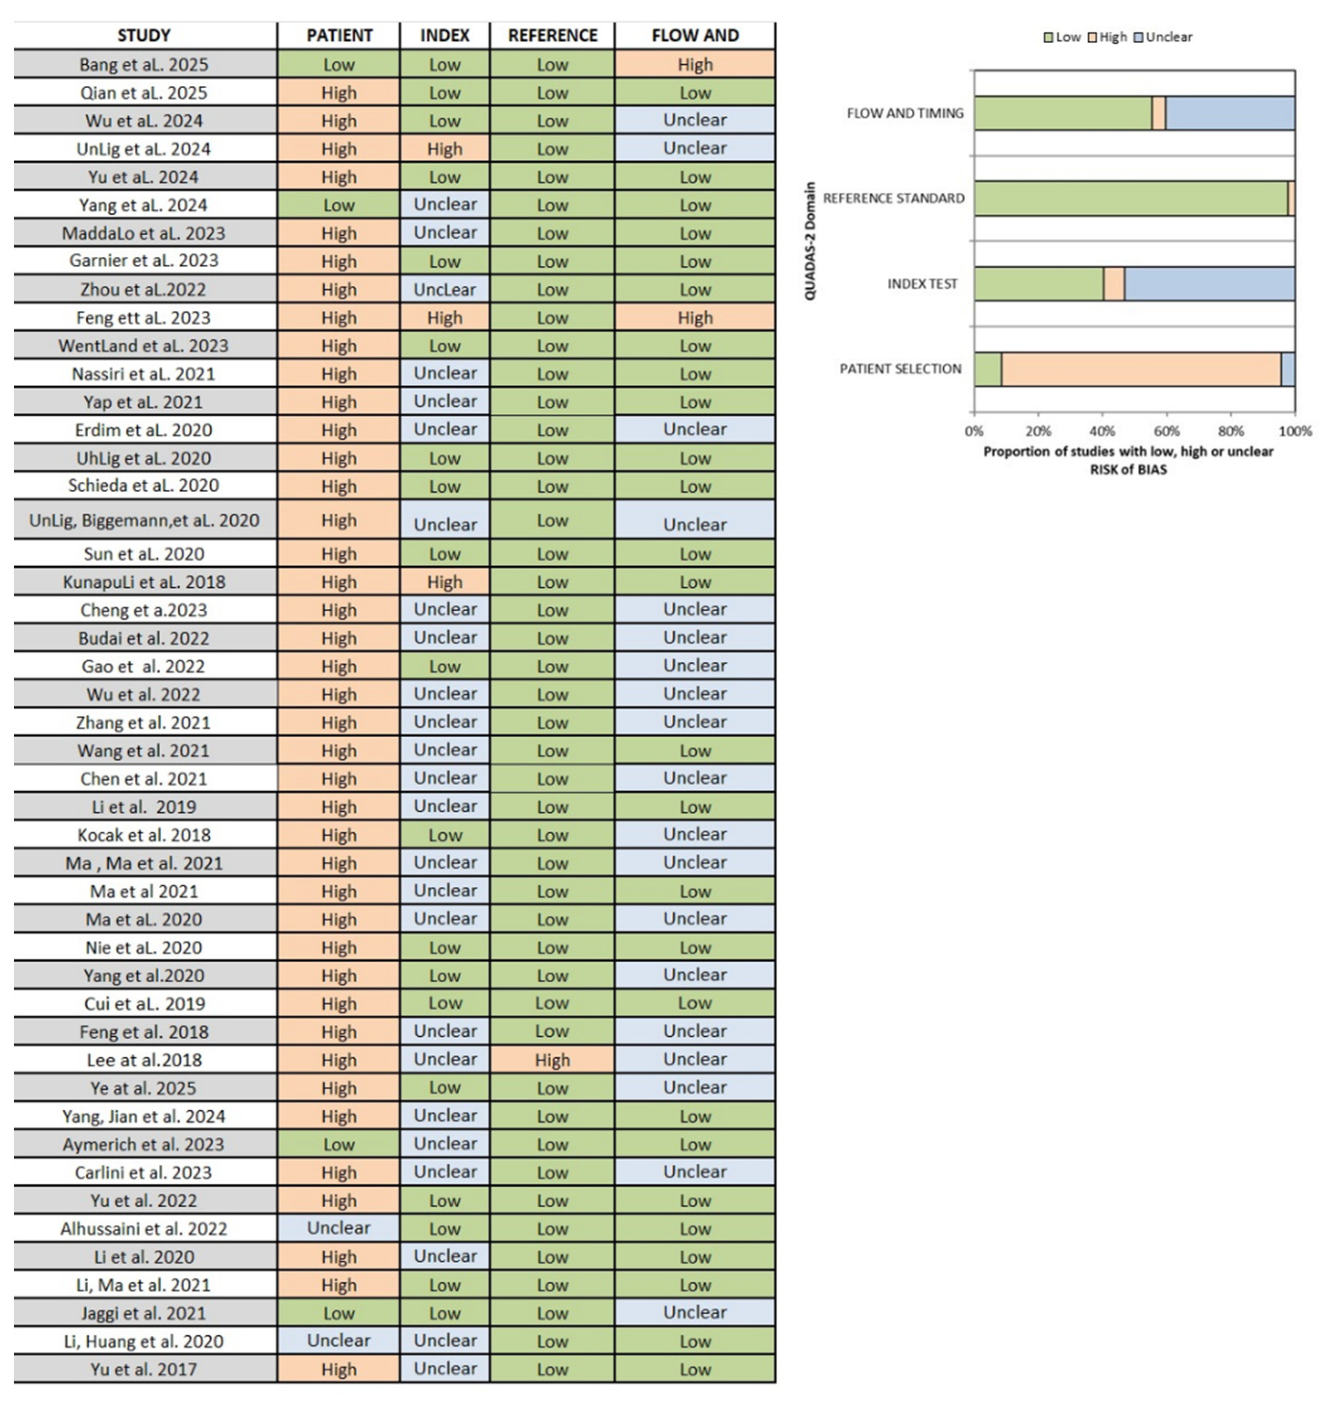
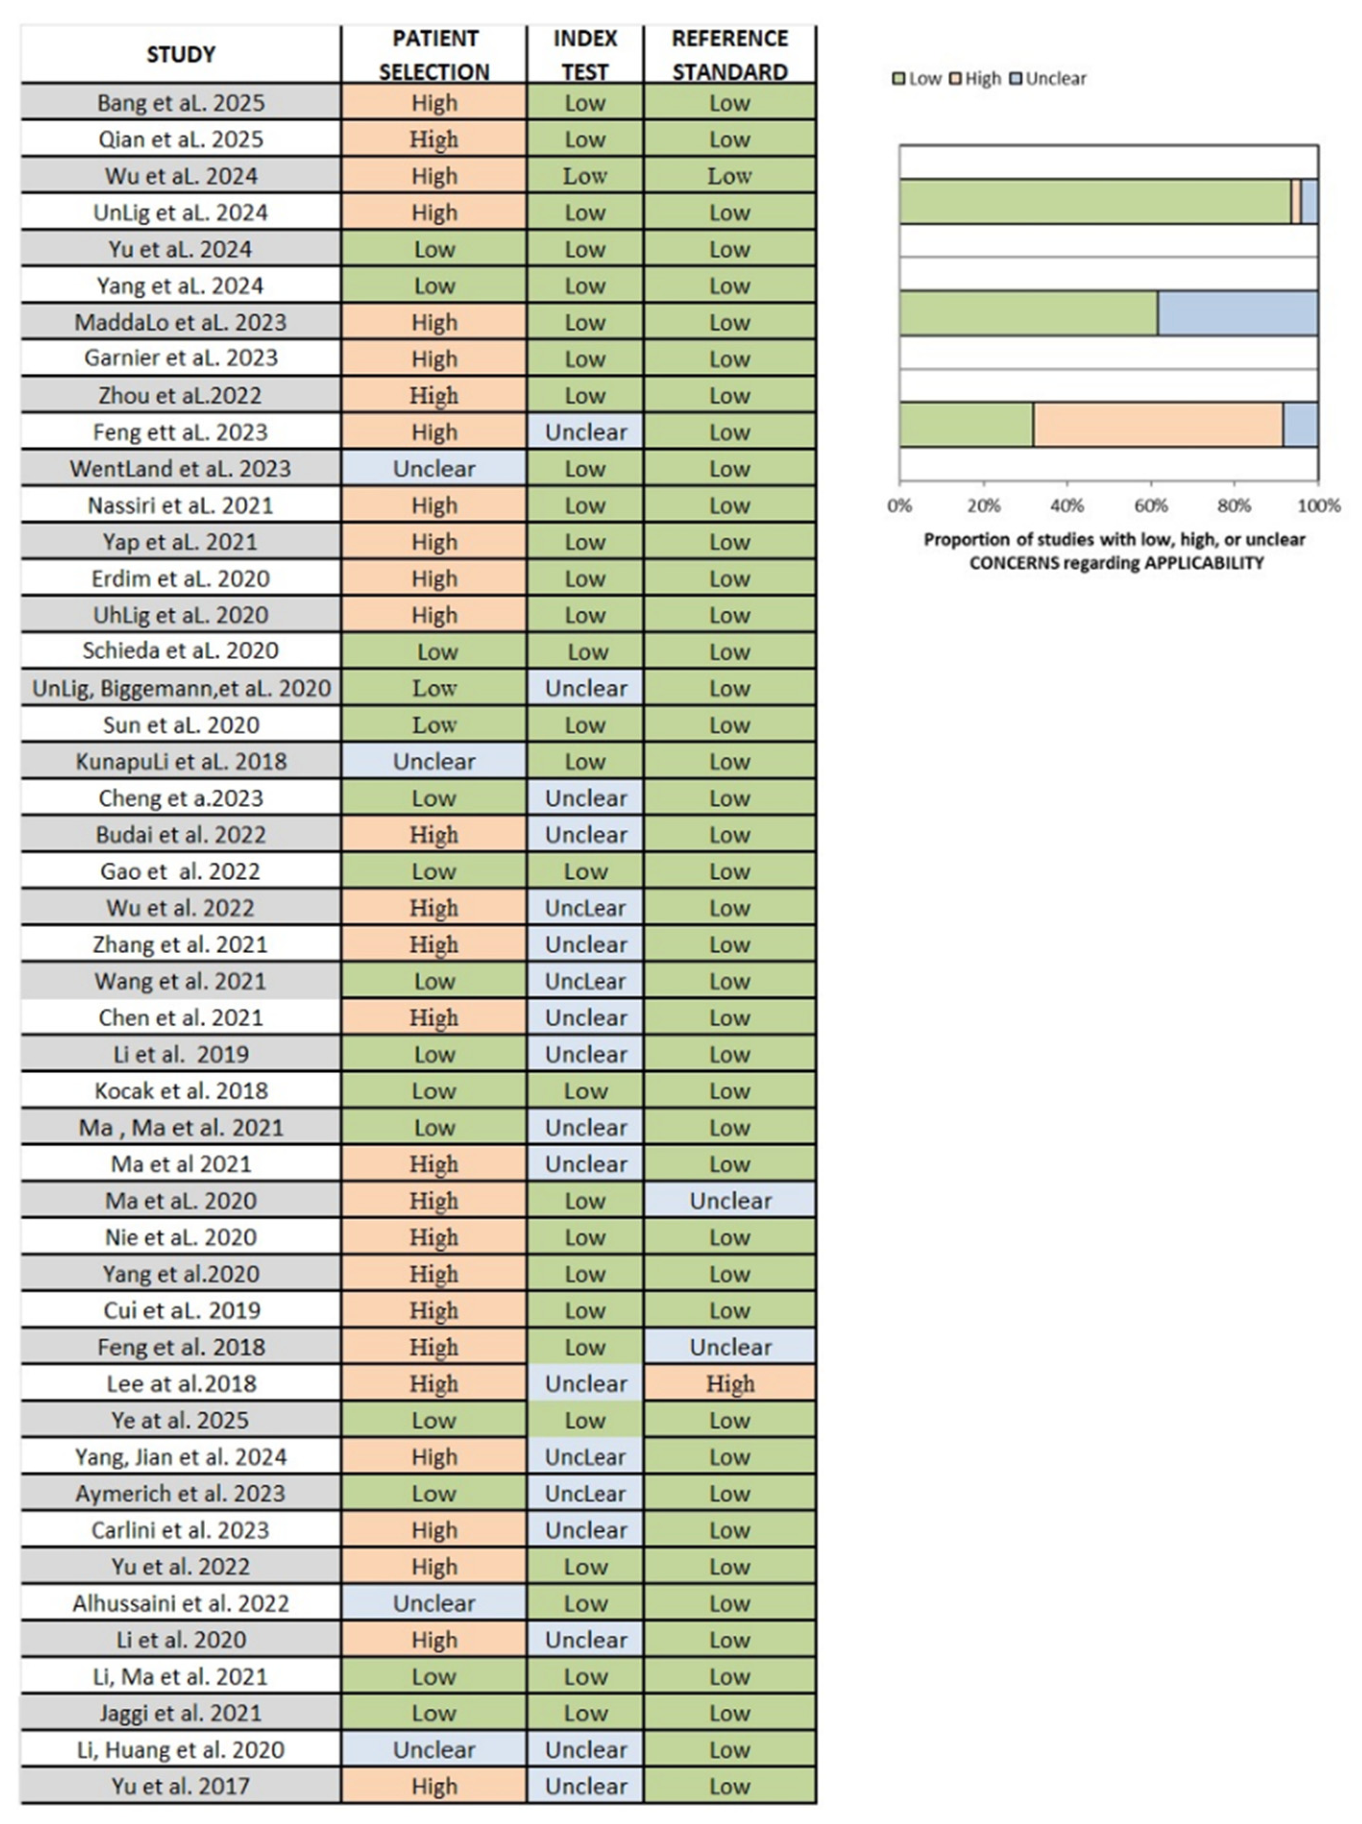
3.2. Risk of Bias and Applicability Assessment
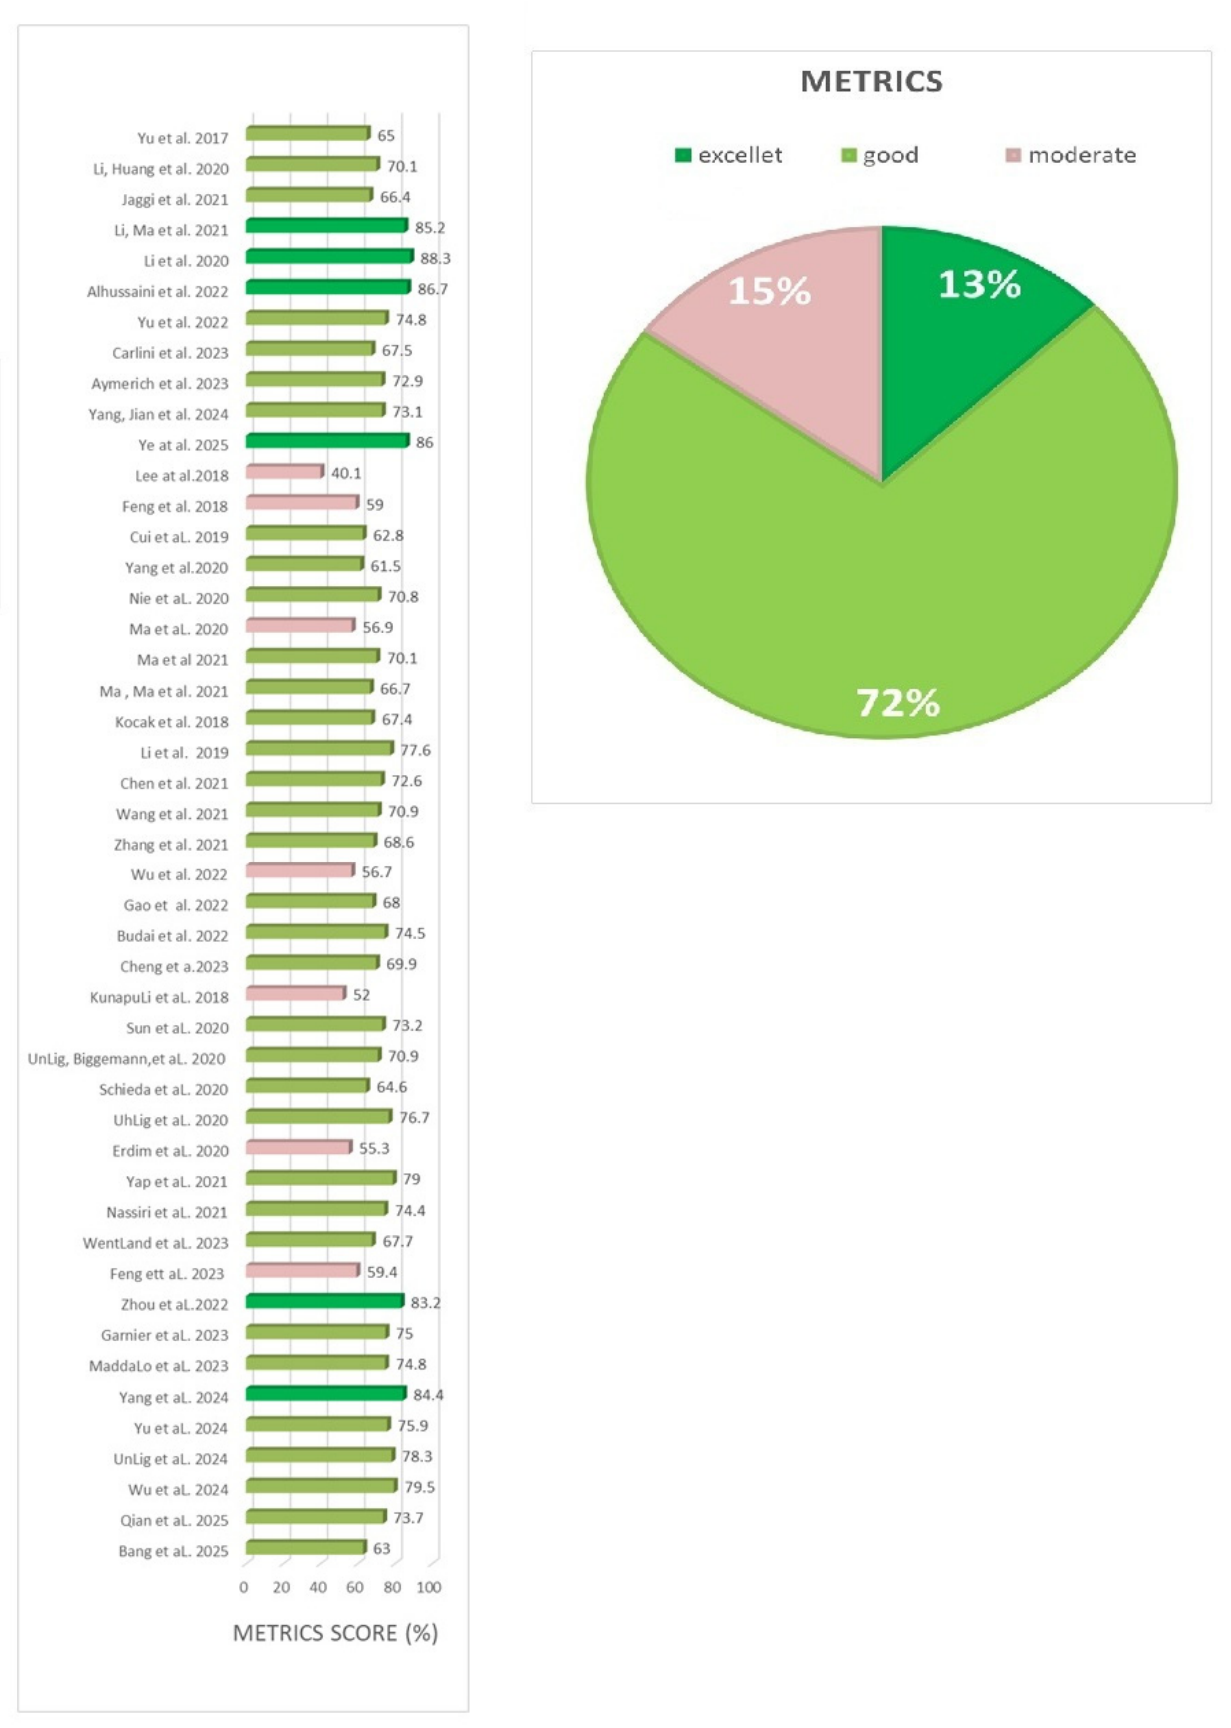
3.3. Methodological Quality Assessment
3.4. Studies Characteristics
3.5. CT-Based Radiomics for Differentiating Benign from Malignant Renal Tumors
3.6. CT-Based Radiomics for Differentiating Clear Cell Renal Cell Carcinoma from Non-Clear Cell Renal Cell Carcinoma
3.7. CT-Based Radiomics for Differentiating Fat-Poor Angiomyolipoma from Renal Cell Carcinoma
3.8. CT-Based Radiomics for Differentiating Renal Oncocytoma from Renal Cell Carcinoma
4. Discussion
4.1. Quality Assessment
4.2. Clinical Implications and Future Directions
4.3. Limitations
5. Conclusions
Supplementary Materials
Author Contributions
Funding
Data Availability Statement
Conflicts of Interest
Abbreviations
| RCC | renal cell carcinoma |
| ccRCC | clear cell renal cell carcinoma |
| pRCC | papillary renal cell carcinoma |
| chRCC | chromophobe renal cell carcinoma |
| fpAML | fat-poor angiomyolipoma |
| RO | renal oncocytoma |
| PN | partial nephrectomy |
| CECT | contrast-enhanced CT |
| ML | Machine Learning |
| VOI | Volume of Interest |
| AUC | Area Under the Curve |
| PRISMA | Preferred Reporting Items for Systematic Reviews and Meta-Analyses |
| kV | kilovolt |
| mA | milliampere |
| iv | intravenous |
| RF | radiomics feature |
| METRICS | METhodological RadiomICs Score |
| SD | standard deviation |
| IQR | interquartile range |
| M/F | male/female |
| TCIA | The Cancer Imaging Archive |
| CMP | corticomedullary phase |
| NP | nephrographic phase |
| UECT | unenhanced CT |
| EP | excretory phase |
| 3D | three-dimensional |
| 3D | two-dimensional |
| GLCM | Gray-Level Co-occurrence Matrix |
| GLRLM | Gray-Level Run Length Matrix |
| GLSZM | Gray-Level Size Zone Matrix |
| NGTDM | Neighboring Gray-Tone Difference Matrix |
| GLDM | Gray-Level Difference Matrix |
| LASSO | Least Absolute Shrinkage and Selection Operator |
| RF | Random Forest |
| XGBoost | extreme Gradient Boosting |
| RFE-SVM | Recursive Feature Elimination-Support Vector Machines |
| kNN | k-Nearest Neighbors |
| LR | Logistic Regression |
| DT | Decision Tree |
| LoG | Laplacian of Gaussian |
| KiTS19 | Kidney Tumor Segmentation Challenge 2019 |
| TCGA | The Cancer Genome Atlas |
| NN | Neural Networks |
References
- Bex, A.; Abu-Ghanem, Y.; Bedke, J.; Breen, D.J.; Capitanio, U.; Dabestani, S.; Hora, M.; Klatte, T.; Kuusk, T.; Lund, L.; et al. EAU Guidelines on Renal Cell Carcinoma. EAU Guidelines on Renal Cell Carcinoma; European Association of Urology: Arnhem, The Netherlands, 2026; Available online: https://d56bochluxqnz.cloudfront.net/documents/full-guideline/EAU-Guidelines-on-Renal-Cell-Carcinoma-2026.pdf (accessed on 24 March 2026).
- Musaddaq, B.; Musaddaq, T.; Gupta, A.; Ilyas, S.; von Stempel, C. Renal cell carcinoma: The evolving role of imaging in the 21st century. Semin. Ultrasound. CT. MR. 2020, 41, 344–350. [Google Scholar] [CrossRef] [Scilit]
- Tsili, A.C.; Andriotis, E.; Gkeli, M.G.; Krokidis, M.; Stasinopoulou, M.; Varkarakis, I.M.; Moulopoulos, L.A. The role of imaging in the management of renal masses. Eur. J. Radiol. 2021, 141, 109777. [Google Scholar] [CrossRef] [Scilit] [PubMed]
- Bellin, M.F.; Valente, C.; Bekdache, O.; Maxwell, F.; Balasa, C.; Savignac, A.; Meyrignac, O. Update on renal cell carcinoma diagnosis with novel imaging approaches. Cancers 2024, 16, 1926. [Google Scholar] [CrossRef] [Scilit]
- Moch, H.; Amin, M.B.; Berney, D.M.; Compérat, E.M.; Gill, A.J.; Hartmann, A.; Menon, S.; Raspollini, M.R.; Rubin, M.A.; Srigley, J.R. The 2022 World Health Organization classification of tumours of the urinary system and male genital organs—Part A: Renal, penile, and testicular tumours. Eur. Urol. 2022, 82, 458–468. [Google Scholar] [CrossRef] [Scilit]
- Hora, M.; Albiges, L.; Bedke, J.; Campi, R.; Capitanio, U.; Giles, R.H.; Ljungberg, B.; Marconi, L.; Klatte, T.; Volpe, A.; et al. European Association of Urology Guidelines Panel on Renal Cell Carcinoma update on the new World Health Organization classification of kidney tumours 2022: The urologist’s point of view. Eur. Urol. 2023, 83, 97–100. [Google Scholar] [CrossRef] [Scilit]
- Herts, B.R.; Silverman, S.G.; Hindman, N.M.; Uzzo, R.G.; Hartman, R.P.; Israel, G.M.; Baumgarten, D.A.; Berland, L.L.; Pandharipande, P.V. Management of the incidental renal mass on CT: A white paper of the ACR Incidental Findings Committee. J. Am. Coll. Radiol. 2018, 15, 264–273. [Google Scholar] [CrossRef] [Scilit] [PubMed]
- Wang, Z.J.; Nikolaidis, P.; Khatri, G.; Dogra, V.S.; Ganeshan, D.; Goldfarb, S.; Gore, J.L.; Gupta, R.T.; Hartman, R.P.; Heilbrun, M.E.; et al. ACR Appropriateness Criteria® indeterminate renal mass. J. Am. Coll. Radiol. 2020, 17, S415–S428. [Google Scholar] [CrossRef] [Scilit]
- Krishna, S.; Murray, C.A.; McInnes, M.D.; Chatelain, R.; Siddaiah, M.; Al-Dandan, O.; Narayanasamy, S.; Schieda, N. CT imaging of solid renal masses: Pitfalls and solutions. Clin. Radiol. 2017, 72, 708–721. [Google Scholar] [CrossRef] [Scilit] [PubMed]
- Kay, F.U.; Pedrosa, I. Imaging of solid renal masses. Urol. Clin. North Am. 2018, 45, 311–330. [Google Scholar] [CrossRef] [Scilit] [PubMed]
- Vikram, R.; Beland, M.D.; Blaufox, M.D.; Moreno, C.C.; Gore, J.L.; Harvin, H.J.; Heilbrun, M.E.; Liauw, S.L.; Nguyen, P.L.; Nikolaidis, P. ACR Appropriateness Criteria renal cell carcinoma staging. J. Am. Coll. Radiol. 2016, 13, 518–525. [Google Scholar] [CrossRef] [Scilit]
- Alsaikhan, N.; Alshehri, W.; Cassidy, F.; Aganovic, L.; Vahdat, N. Renal tumor structured reporting including nephrometry score and beyond: What the urologist and interventional radiologist need to know. Abdom. Radiol. 2019, 44, 190–200. [Google Scholar] [CrossRef] [Scilit] [PubMed]
- Lambin, P.; Leijenaar, R.T.H.; Deist, T.M.; Peerlings, J.; de Jong, E.E.C.; van Timmeren, J.; Sanduleanu, S.; Larue, R.T.H.M.; Even, A.J.G.; Jochems, A.; et al. Radiomics: The bridge between medical imaging and personalized medicine. Nat. Rev. Clin. Oncol. 2017, 14, 749–762. [Google Scholar] [CrossRef] [Scilit] [PubMed]
- Wu, X.; Dai, W. Beyond imaging: Integrating radiomics, genomics, and multi-omics for precision breast cancer management. Cancers 2025, 17, 3408. [Google Scholar] [CrossRef] [Scilit]
- Fathi Kazerooni, A.; Bagley, S.J.; Akbari, H.; Saxena, S.; Bagheri, S.; Guo, J.; Chawla, S.; Nabavizadeh, A.; Mohan, S.; Bakas, S.; et al. Applications of radiomics and radiogenomics in high-grade gliomas in the era of precision medicine. Cancers 2021, 13, 5921. [Google Scholar] [CrossRef] [Scilit]
- Huang, M.; Law, H.K.W.; Tam, S.Y. Radiomics-driven tumor prognosis prediction across imaging modalities: Advances in sampling, feature selection, and multi-omics integration. Cancers 2025, 17, 3121. [Google Scholar] [CrossRef] [Scilit]
- Preuss, K.; Thach, N.; Liang, X.; Baine, M.; Chen, J.; Zhang, C.; Du, H.; Yu, H.; Lin, C.; Hollingsworth, M.A.; et al. Using quantitative imaging for personalized medicine in pancreatic cancer: A review of radiomics and deep learning applications. Cancers 2022, 14, 1654. [Google Scholar] [CrossRef] [Scilit]
- Feretzakis, G.; Juliebø-Jones, P.; Tsaturyan, A.; Sener, T.E.; Verykios, V.S.; Karapiperis, D.; Bellos, T.; Katsimperis, S.; Angelopoulos, P.; Varkarakis, I.; et al. Emerging trends in AI and radiomics for bladder, kidney, and prostate cancer: A critical review. Cancers 2024, 16, 810. [Google Scholar] [CrossRef] [Scilit]
- Lubner, M.G. Radiomics and artificial intelligence for renal mass characterization. Radiol. Clin. N. Am. 2020, 58, 995–1008. [Google Scholar] [CrossRef] [Scilit]
- Suarez-Ibarrola, R.; Basulto-Martinez, M.; Heinze, A.; Gratzke, C.; Miernik, A. Radiomics applications in renal tumor assessment: A comprehensive review of the literature. Cancers 2020, 12, 1387. [Google Scholar] [CrossRef] [Scilit] [PubMed]
- Gutiérrez Hidalgo, B.; Gómez Rivas, J.; de la Parra, I.; Marugán, M.J.; Serrano, Á.; Hermida Gutiérrez, J.F.; Barrera, J.; Moreno-Sierra, J. The use of radiomic tools in renal mass characterization. Diagnostics 2023, 13, 2743. [Google Scholar] [CrossRef] [Scilit]
- Ferro, M.; Crocetto, F.; Barone, B.; Del Giudice, F.; Maggi, M.; Lucarelli, G.; Busetto, G.M.; Autorino, R.; Marchioni, M.; Cantiello, F.; et al. Artificial intelligence and radiomics in evaluation of kidney lesions: A comprehensive literature review. Ther. Adv. Urol. 2023, 15, 17562872231164803. [Google Scholar] [CrossRef] [Scilit]
- Mühlbauer, J.; Egen, L.; Kowalewski, K.F.; Grilli, M.; Walach, M.T.; Westhoff, N.; Nuhn, P.; Laqua, F.C.; Baessler, B.; Kriegmair, M.C. Radiomics in renal cell carcinoma—A systematic review and meta-analysis. Cancers 2021, 13, 1348. [Google Scholar] [CrossRef] [Scilit] [PubMed]
- Ursprung, S.; Beer, L.; Bruining, A.; Woitek, R.; Stewart, G.D.; Gallagher, F.A.; Sala, E. Radiomics of computed tomography and magnetic resonance imaging in renal cell carcinoma—A systematic review and meta-analysis. Eur. Radiol. 2020, 30, 3558–3566. [Google Scholar] [CrossRef] [Scilit]
- Lomer, N.B.; Abdi, S.; Ashoobi, M.A.; Ahmadzadeh, A.M.; Ghasemi, A.; Torigian, D.A. Accuracy of CT-based radiomics models for preoperative grading of clear cell renal cell carcinoma: A systematic review and meta-analysis. Acad. Radiol. 2025, 32, 6664–6676. [Google Scholar] [CrossRef] [Scilit]
- Raman, A.G.; Fischer, D.; Yap, F.; Oberai, A.; Duddalwar, V.A. Radiomics and Artificial Intelligence: Renal Cell Carcinoma. Urol. Clin. N. Am. 2024, 51, 35–45. [Google Scholar] [CrossRef] [Scilit]
- Rallis, K.S.; Kleeman, S.O.; Grant, M.; Ordidge, K.L.; Sahdev, A.; Powles, T. Radiomics for renal cell carcinoma: Predicting outcomes from immunotherapy and targeted therapies—A narrative review. Eur. Urol. Focus 2021, 7, 717–721. [Google Scholar] [CrossRef] [Scilit]
- Bhandari, A.; Ibrahim, M.; Sharma, C.; Liong, R.; Gustafson, S.; Prior, M. CT-based radiomics for differentiating renal tumours: A systematic review. Abdom. Radiol. 2021, 46, 2052–2063. [Google Scholar] [CrossRef] [Scilit]
- Dehghani Firouzabadi, F.; Gopal, N.; Hasani, A.; Homayounieh, F.; Li, X.; Jones, E.C.; Yazdian Anari, P.; Turkbey, E.; Malayeri, A.A. CT radiomics for differentiating fat-poor angiomyolipoma from clear cell renal cell carcinoma: Systematic review and meta-analysis. PLoS ONE 2023, 18, e0287299. [Google Scholar] [CrossRef] [Scilit] [PubMed]
- Dehghani Firouzabadi, F.; Gopal, N.; Homayounieh, F.; Anari, P.Y.; Li, X.; Ball, M.W.; Jones, E.C.; Samimi, S.; Turkbey, E.; Malayeri, A.A. CT radiomics for differentiating oncocytoma from renal cell carcinomas: Systematic review and meta-analysis. Clin. Imaging 2023, 94, 9–17. [Google Scholar] [CrossRef] [Scilit]
- Page, M.J.; McKenzie, J.E.; Bossuyt, P.M.; Boutron, I.; Hoffmann, T.C.; Mulrow, C.D.; Shamseer, L.; Tetzlaff, J.M.; Akl, E.A.; Brennan, S.E.; et al. The PRISMA 2020 statement: An updated guideline for reporting systematic reviews. BMJ 2021, 372, n71. [Google Scholar] [CrossRef] [Scilit] [PubMed]
- Whiting, P.F.; Rutjes, A.W.; Westwood, M.E.; Mallett, S.; Deeks, J.J.; Reitsma, J.B.; Leeflang, M.M.; Sterne, J.A.; Bossuyt, P.M.; QUADAS-2 Group. QUADAS-2: A revised tool for the quality assessment of diagnostic accuracy studies. Ann. Intern. Med. 2011, 155, 529–536. [Google Scholar] [CrossRef] [Scilit] [PubMed]
- Kocak, B.; Akinci D’Antonoli, T.; Mercaldo, N.; Alberich-Bayarri, A.; Baessler, B.; Ambrosini, I.; Andreychenko, A.E.; Bakas, S.; Beets-Tan, R.G.H.; Bressem, K. METhodological RadiomICs Score (METRICS): A quality scoring tool for radiomics research endorsed by EuSoMII. Insights Imaging 2024, 15, 8. [Google Scholar] [CrossRef] [Scilit]
- Bang, S.; Wang, H.; Bae, H.; Hong, S.H.; Cha, J.; Choi, M.H. Computed tomography-based radiomics diagnostic model for fat-poor small renal tumor subtypes. Diagnostics 2025, 15, 1365. [Google Scholar] [CrossRef] [Scilit]
- Qian, L.; Fu, B.; He, H.; Liu, S.; Lu, R. CECT-based radiomic nomogram of different machine learning models for differentiating malignant and benign solid-containing renal masses. J. Multidiscip. Healthc. 2025, 18, 421–433. [Google Scholar] [CrossRef] [Scilit]
- Wu, Y.; Cao, F.; Lei, H.; Zhang, S.; Mei, H.; Ni, L.; Pang, J. Interpretable multiphasic CT-based radiomic analysis for preoperatively differentiating benign and malignant solid renal tumors: A multicenter study. Abdom. Radiol. 2024, 49, 3096–3106. [Google Scholar] [CrossRef] [Scilit]
- Uhlig, A.; Uhlig, J.; Leha, A.; Biggemann, L.; Bachanek, S.; Stöckle, M.; Reichert, M.; Lotz, J.; Zeuschner, P.; Maßmann, A. Radiomics and machine learning for renal tumor subtype assessment using multiphase computed tomography in a multicenter setting. Eur. Radiol. 2024, 34, 6254–6263. [Google Scholar] [CrossRef] [Scilit]
- Yu, S.; Yang, Y.; Wang, Z.; Zheng, H.; Cui, J.; Zhan, Y.; Liu, J.; Li, P.; Fan, Y.; Jia, W. CT-based conventional radiomics and quantification of intratumoral heterogeneity for predicting benign and malignant renal lesions. Cancer Imaging 2024, 24, 130. [Google Scholar] [CrossRef] [Scilit]
- Yang, H.; Liu, H.; Lin, J.; Xiao, H.; Guo, Y.; Mei, H.; Ding, Q.; Yuan, Y.; Lai, X.; Wu, K.; et al. An automatic texture feature analysis framework of renal tumor: Surgical, pathological, and molecular evaluation based on multi-phase abdominal CT. Eur. Radiol. 2024, 34, 355–366. [Google Scholar] [CrossRef] [Scilit]
- Maddalo, M.; Bertolotti, L.; Mazzilli, A.; Flore, A.G.M.; Perotta, R.; Pagnini, F.; Ziglioli, F.; Maestroni, U.; Martini, C.; Caruso, D.; et al. Small renal masses: Developing a robust radiomic signature. Cancers 2023, 15, 4565. [Google Scholar] [CrossRef] [Scilit] [PubMed]
- Garnier, C.; Ferrer, L.; Vargas, J.; Gallinato, O.; Jambon, E.; Le Bras, Y.; Bernhard, J.C.; Colin, T.; Grenier, N.; Marcelin, C. A CT-based clinical, radiological and radiomic machine learning model for predicting malignancy of solid renal tumors (UroCCR-75). Diagnostics 2023, 13, 2548. [Google Scholar] [CrossRef] [Scilit] [PubMed]
- Zhou, T.; Guan, J.; Feng, B.; Xue, H.; Cui, J.; Kuang, Q.; Chen, Y.; Xu, K.; Lin, F.; Cui, E.; et al. Distinguishing common renal cell carcinomas from benign renal tumors based on machine learning: Comparing various CT imaging phases, slices, tumor sizes, and ROI segmentation strategies. Eur. Radiol. 2023, 33, 4323–4332. [Google Scholar] [CrossRef] [Scilit]
- Feng, S.; Gong, M.; Zhou, D.; Yuan, R.; Kong, J.; Jiang, F.; Zhang, L.; Chen, W.; Li, Y. A CT-based radiomics nomogram for differentiation of benign and malignant small renal masses (≤4 cm). Transl. Oncol. 2023, 29, 101627. [Google Scholar] [CrossRef] [Scilit]
- Wentland, A.L.; Yamashita, R.; Kino, A.; Pandit, P.; Shen, L.; Jeffrey, R.B.; Rubin, D.; Kamaya, A. Differentiation of benign from malignant solid renal lesions using CT-based radiomics and machine learning: Comparison with radiologist interpretation. Abdom. Radiol. 2023, 48, 642–648. [Google Scholar] [CrossRef] [Scilit]
- Nassiri, N.; Maas, M.; Cacciamani, G.; Varghese, B.; Hwang, D.; Lei, X.; Aron, M.; Desai, M.; Oberai, A.A.; Cen; et al. A radiomic-based machine learning algorithm to reliably differentiate benign renal masses from renal cell carcinoma. Eur. Urol. Focus 2022, 8, 988–994. [Google Scholar] [CrossRef] [Scilit]
- Yap, F.Y.; Varghese, B.A.; Cen, S.Y.; Hwang, D.H.; Lei, X.; Desai, B.; Lau, C.; Yang, L.L.; Fullenkamp, A.J.; Hajian, S.; et al. Shape and texture-based radiomics signature on CT effectively discriminates benign from malignant renal masses. Eur. Radiol. 2021, 31, 1011–1021. [Google Scholar] [CrossRef] [Scilit]
- Erdim, C.; Yardimci, A.H.; Bektas, C.T.; Kocak, B.; Koca, S.B.; Demir, H.; Kilickesmez, O. Prediction of benign and malignant solid renal masses: Machine learning-based CT texture analysis. Acad. Radiol. 2020, 27, 1422–1429. [Google Scholar] [CrossRef] [Scilit]
- Uhlig, J.; Leha, A.; Delonge, L.M.; Haack, A.M.; Shuch, B.; Kim, H.S.; Bremmer, F.; Trojan, L.; Lotz, J.; Uhlig, A. Radiomic features and machine learning for the discrimination of renal tumor histological subtypes: A pragmatic study using clinical-routine computed tomography. Cancers 2020, 12, 3010. [Google Scholar] [CrossRef] [Scilit] [PubMed]
- Schieda, N.; Nguyen, K.; Thornhill, R.E.; McInnes, M.D.F.; Wu, M.; James, N. Importance of phase enhancement for machine learning classification of solid renal masses using texture analysis features at multi-phasic CT. Abdom. Radiol. 2020, 45, 2786–2796. [Google Scholar] [CrossRef] [Scilit] [PubMed]
- Uhlig, J.; Biggemann, L.; Nietert, M.M.; Beißbarth, T.; Lotz, J.; Kim, H.S.; Trojan, L.; Uhlig, A. Discriminating malignant and benign clinical T1 renal masses on computed tomography: A pragmatic radiomics and machine learning approach. Medicine 2020, 99, e19725. [Google Scholar] [CrossRef] [Scilit] [PubMed]
- Sun, X.Y.; Feng, Q.X.; Xu, X.; Zhang, J.; Zhu, F.P.; Yang, Y.H.; Zhang, Y.D. Radiologic-radiomic machine learning models for differentiation of benign and malignant solid renal masses: Comparison with expert-level radiologists. AJR Am. J. Roentgenol. 2020, 214, W44–W54. [Google Scholar] [CrossRef] [Scilit]
- Kunapuli, G.; Varghese, B.A.; Ganapathy, P.; Desai, B.; Cen, S.; Aron, M.; Gill, I.; Duddalwar, V. A decision-support tool for renal mass classification. J. Digit. Imaging 2018, 31, 929–939. [Google Scholar] [CrossRef] [Scilit]
- Cheng, D.; Abudikeranmu, Y.; Tuerdi, B. Differentiation of clear cell and non-clear-cell renal cell carcinoma through CT-based radiomics models and nomogram. Curr. Med. Imaging 2023, 19, 1005–1017. [Google Scholar] [CrossRef] [Scilit]
- Budai, B.K.; Stollmayer, R.; Rónaszéki, A.D.; Körmendy, B.; Zsombor, Z.; Palotás, L.; Fejér, B.; Szendrõi, A.; Székely, E.; Maurovich-Horvat, P. Radiomics analysis of contrast-enhanced CT scans can distinguish between clear cell and non-clear cell renal cell carcinoma in different imaging protocols. Front. Med. 2022, 9, 974485. [Google Scholar] [CrossRef] [Scilit]
- Gao, Y.; Zhao, X.; Wang, X.; Zhu, C.; Li, C.; Li, J.; Wu, X. A clinical radiomics nomogram was developed by integrating radiomics signatures and clinical variables to distinguish high-grade ccRCC from type 2 pRCC. J. Oncol. 2022, 2022, 6844349. [Google Scholar] [CrossRef] [Scilit] [PubMed]
- Wu, K.; Wu, P.; Yang, K.; Li, Z.; Kong, S.; Yu, L.; Zhang, E.; Liu, H.; Guo, Q.; Wu, S. A comprehensive texture feature analysis framework of renal cell carcinoma: Pathological, prognostic, and genomic evaluation based on CT images. Eur. Radiol. 2022, 32, 2255–2265. [Google Scholar] [CrossRef] [Scilit]
- Zhang, H.; Yin, F.; Chen, M.; Qi, A.; Lai, Z.; Yang, L.; Wen, G. A reliable prediction model for renal cell carcinoma subtype based on radiomic features from 3D multiphase enhanced CT images. J. Oncol. 2021, 2021, 6595212. [Google Scholar] [CrossRef] [Scilit] [PubMed]
- Wang, P.; Pei, X.; Yin, X.P.; Ren, J.L.; Wang, Y.; Ma, L.Y.; Du, X.G.; Gao, B.L. Radiomics models based on enhanced computed tomography to distinguish clear cell from non-clear cell renal cell carcinomas. Sci. Rep. 2021, 11, 13729. [Google Scholar] [CrossRef] [Scilit]
- Chen, M.; Yin, F.; Yu, Y.; Zhang, H.; Wen, G. CT-based multi-phase radiomic models for differentiating clear cell renal cell carcinoma. Cancer Imaging 2021, 21, 42. [Google Scholar] [CrossRef] [Scilit]
- Li, Z.C.; Zhai, G.; Zhang, J.; Wang, Z.; Liu, G.; Wu, G.Y.; Liang, D.; Zheng, H. Differentiation of clear cell and non-clear cell renal cell carcinomas by all-relevant radiomics features from multiphase CT: A VHL mutation perspective. Eur. Radiol. 2019, 29, 3996–4007. [Google Scholar] [CrossRef] [Scilit]
- Kocak, B.; Yardimci, A.H.; Bektas, C.T.; Turkcanoglu, M.H.; Erdim, C.; Yucetas, U.; Koca, S.B.; Kilickesmez, O. Textural differences between renal cell carcinoma subtypes: Machine learning-based quantitative computed tomography texture analysis with independent external validation. Eur. J. Radiol. 2018, 107, 149–157. [Google Scholar] [CrossRef] [Scilit] [PubMed]
- Ma, Y.; Ma, W.; Xu, X.; Guan, Z.; Pang, P. A convention-radiomics CT nomogram for differentiating fat-poor angiomyolipoma from clear cell renal cell carcinoma. Sci. Rep. 2021, 11, 4644. [Google Scholar] [CrossRef] [Scilit]
- Ma, Y.; Xu, X.; Pang, P.; Wen, Y. A CT-based tumoral and mini-peritumoral radiomics approach: Differentiate fat-poor angiomyolipoma from clear cell renal cell carcinoma. Cancer. Manag. Res. 2021, 13, 1417–1425. [Google Scholar] [CrossRef] [Scilit]
- Ma, Y.; Cao, F.; Xu, X.; Ma, W. Can whole-tumor radiomics-based CT analysis better differentiate fat-poor angiomyolipoma from clear cell renal cell carcinoma: Compared with conventional CT analysis? Abdom. Radiol. 2020, 45, 2500–2507. [Google Scholar] [CrossRef] [Scilit]
- Nie, P.; Yang, G.; Wang, Z.; Yan, L.; Miao, W.; Hao, D.; Wu, J.; Zhao, Y.; Gong, A.; Cui, J.; et al. A CT-based radiomics nomogram for differentiation of renal angiomyolipoma without visible fat from homogeneous clear cell renal cell carcinoma. Eur. Radiol. 2020, 30, 1274–1284. [Google Scholar] [CrossRef] [Scilit]
- Yang, R.; Wu, J.; Sun, L.; Lai, S.; Xu, Y.; Liu, X.; Ma, Y.; Zhen, X. Radiomics of small renal masses on multiphasic CT: Accuracy of machine learning-based classification models for the differentiation of renal cell carcinoma and angiomyolipoma without visible fat. Eur. Radiol. 2020, 30, 1254–1263. [Google Scholar] [CrossRef] [Scilit]
- Cui, E.M.; Lin, F.; Li, Q.; Li, R.G.; Chen, X.M.; Liu, Z.S.; Long, W.S. Differentiation of renal angiomyolipoma without visible fat from renal cell carcinoma by machine learning based on whole-tumor computed tomography texture features. Acta Radiol. 2019, 60, 1543–1552. [Google Scholar] [CrossRef] [Scilit] [PubMed]
- Feng, Z.; Rong, P.; Cao, P.; Zhou, Q.; Zhu, W.; Yan, Z.; Liu, Q.; Wang, W. Machine learning-based quantitative texture analysis of CT images of small renal masses: Differentiation of angiomyolipoma without visible fat from renal cell carcinoma. Eur. Radiol. 2018, 28, 1625–1633. [Google Scholar] [CrossRef] [Scilit]
- Lee, H.; Hong, H.; Kim, J.; Jung, D.C. Deep feature classification of angiomyolipoma without visible fat and renal cell carcinoma in abdominal contrast-enhanced CT images with texture image patches and hand-crafted feature concatenation. Med. Phys. 2018, 45, 1550–1561. [Google Scholar] [CrossRef] [Scilit] [PubMed]
- Ye, Y.; Weng, B.; Guo, Y.; Huang, L.; Xie, S.; Zhong, G.; Feng, W.; Lin, W.; Song, Z.; Wang, H.; et al. Intratumoral and peritumoral radiomics using multi-phase contrast-enhanced CT for diagnosis of renal oncocytoma and chromophobe renal cell carcinoma: A multicenter retrospective study. Front. Oncol. 2025, 15, 1501084. [Google Scholar] [CrossRef] [Scilit]
- Yang, S.; Jian, Y.; Yang, F.; Liu, R.; Zhang, W.; Wang, J.; Tan, X.; Wu, J.; Chen, Y.; Zhou, X. Radiomics analysis based on single phase and different phase combinations of radiomics features from tri-phasic CT to distinguish renal oncocytoma from chromophobe renal cell carcinoma. Abdom. Radiol. 2024, 49, 182–191. [Google Scholar] [CrossRef] [Scilit] [PubMed]
- Aymerich, M.; García-Baizán, A.; Franco, P.N.; Otero-García, M. Exploratory analysis of the role of radiomic features in the differentiation of oncocytoma and chromophobe RCC in the nephrographic CT phase. Life 2023, 13, 1950. [Google Scholar] [CrossRef] [Scilit]
- Carlini, G.; Gaudiano, C.; Golfieri, R.; Curti, N.; Biondi, R.; Bianchi, L.; Schiavina, R.; Giunchi, F.; Faggioni, L.; Giampieri, E.; et al. Effectiveness of radiomic ZOT features in the automated discrimination of oncocytoma from clear cell renal cancer. J. Pers. Med. 2023, 13, 478. [Google Scholar] [CrossRef] [Scilit]
- Yu, Z.; Ding, J.; Pang, H.; Fang, H.; He, F.; Xu, C.; Li, X.; Ren, K. A triple-classification for differentiating renal oncocytoma from renal cell carcinoma subtypes and CK7 expression evaluation: A radiomics analysis. BMC Urol. 2022, 22, 147. [Google Scholar] [CrossRef] [Scilit]
- Alhussaini, A.J.; Steele, J.D.; Nabi, G. Comparative analysis for the distinction of chromophobe renal cell carcinoma from renal oncocytoma in computed tomography imaging using machine learning radiomics analysis. Cancers 2022, 14, 3609. [Google Scholar] [CrossRef] [Scilit]
- Li, X.; Ma, Q.; Nie, P.; Zheng, Y.; Dong, C.; Xu, W. A CT-based radiomics nomogram for differentiation of renal oncocytoma and chromophobe renal cell carcinoma with a central scar-matched study. Br. J. Radiol. 2022, 95, 20210534. [Google Scholar] [CrossRef] [Scilit]
- Li, X.; Ma, Q.; Tao, C.; Liu, J.; Nie, P.; Dong, C. A CT-based radiomics nomogram for differentiation of small masses (<4 cm) of renal oncocytoma from clear cell renal cell carcinoma. Abdom. Radiol. 2021, 46, 5240–5249. [Google Scholar] [CrossRef] [Scilit] [PubMed]
- Jaggi, A.; Mastrodicasa, D.; Charville, G.W.; Jeffrey, R.B., Jr.; Napel, S.; Patel, B. Quantitative image features from radiomic biopsy differentiate oncocytoma from chromophobe renal cell carcinoma. J. Med. Imaging 2021, 8, 054501. [Google Scholar] [CrossRef] [Scilit] [PubMed]
- Li, Y.; Huang, X.; Xia, Y.; Long, L. Value of radiomics in differential diagnosis of chromophobe renal cell carcinoma and renal oncocytoma. Abdom. Radiol. 2020, 45, 3193–3201. [Google Scholar] [CrossRef] [Scilit]
- Yu, H.; Scalera, J.; Khalid, M.; Touret, A.S.; Bloch, N.; Li, B.; Qureshi, M.M.; Soto, J.A.; Anderson, S.W. Texture analysis as a radiomic marker for differentiating renal tumors. Abdom. Radiol. 2017, 42, 2470–2478. [Google Scholar] [CrossRef] [Scilit] [PubMed]
- Zhu, H.; Chen, Z.; Zhang, J.; Yang, M.; Gu, K.; Bao, W.; Du, Y.; Hou, S.; Yao, W. Application of adaptive deep learning-based automatic segmentation in radiomics model for preoperative WHO/ISUP grading of clear cell renal cell carcinoma: A retrospective comparative study with manual segmentation. Peer. J. 2026, 14, e21022. [Google Scholar] [CrossRef] [Scilit]
- McAlpine, K.; Mirajkar, N.; Deniffel, D.; Kohan, A.; Krishna, S.; Kulkarni, G.; Haider, M.A. Automated vs. manual segmentation for small renal mass imaging. Can. Urol. Assoc. J. 2026, 13. [Google Scholar] [CrossRef] [Scilit] [PubMed]
- Repeckaite, G.; Zviniene, K.; Jankauskiene, J.; Basevicius, A.; Milonas, D. Small renal masses without gross fat: What is the role of contrast-enhanced MDCT? Diagnostics 2022, 12, 553. [Google Scholar] [CrossRef] [Scilit] [PubMed]
- Yang, C.W.; Shen, S.H.; Chang, Y.H.; Chung, H.J.; Wang, J.H.; Lin, A.T.; Chen, K.K. Are there useful CT features to differentiate renal cell carcinoma from lipid-poor renal angiomyolipoma? Am. J. Roentgenol. 2013, 201, 1017–1028. [Google Scholar] [CrossRef] [Scilit]
- Lim, R.S.; Flood, T.A.; McInnes, M.D.F.; Lavallee, L.T.; Schieda, N. Renal angiomyolipoma without visible fat: Can we make the diagnosis using CT and MRI? Eur. Radiol. 2018, 28, 542–553. [Google Scholar] [CrossRef] [Scilit]
- Jinzaki, M.; Silverman, S.G.; Akita, H.; Nagashima, Y.; Mikami, S.; Oya, M. Renal angiomyolipoma: A radiological classification and update on recent developments in diagnosis and management. Abdom. Imaging 2014, 39, 588–604. [Google Scholar] [CrossRef] [Scilit]
- Choudhary, S.; Rajesh, A.; Mayer, N.J.; Mulcahy, K.A.; Haroon, A. Renal oncocytoma: CT features cannot reliably distinguish oncocytoma from other renal neoplasms. Clin. Radiol. 2009, 64, 517–522. [Google Scholar] [CrossRef] [Scilit]
- Sasaguri, K.; Takahashi, N.; Gomez-Cardona, D.; Leng, S.; Schmit, G.D.; Carter, R.E.; Leibovich, B.C.; Kawashima, A. Small (<4 cm) renal mass: Differentiation of oncocytoma from renal cell carcinoma on biphasic contrast-enhanced CT. AJR Am. J. Roentgenol. 2015, 205, 999–1007. [Google Scholar] [CrossRef] [Scilit]
- Li, X.; Nie, P.; Zhang, J.; Hou, F.; Ma, Q.; Cui, J. Differential diagnosis of renal oncocytoma and chromophobe renal cell carcinoma using CT features: A central scar-matched retrospective study. Acta Radiol. 2022, 63, 253–260. [Google Scholar] [CrossRef] [Scilit]
- Young, J.R.; Margolis, D.; Sauk, S.; Pantuck, A.J.; Sayre, J.; Raman, S.S. Clear cell renal cell carcinoma: Discrimination from other renal cell carcinoma subtypes and oncocytoma at multiphasic multidetector CT. Radiology 2013, 267, 444–453. [Google Scholar] [CrossRef] [Scilit]
- Powles, T.; Albiges, L.; Bex, A.; Comperat, E.; Grünwald, V.; Kanesvaran, R.; Kitamura, H.; McKay, R.; Porta, C.; Procopio, G. Renal cell carcinoma: ESMO Clinical Practice Guideline for diagnosis, treatment and follow-up. Ann. Oncol. 2024, 35, 692–706. [Google Scholar] [CrossRef] [Scilit] [PubMed]
- Ibrahim, A.; Lu, L.; Yang, H.; Akin, O.; Schwartz, L.H.; Zhao, B. The impact of image acquisition parameters and ComBat harmonization on the predictive performance of radiomics: A renal cell carcinoma model. Appl. Sci. 2022, 12, 9824. [Google Scholar] [CrossRef] [Scilit]
- Ziasaeedi, N.; Lemaréchal, Y.; Agharazii, M.; Manem, V.S.K.; Després, P.; Ebrahimpour, L. Radiomics-based kidney lesion classification: Mitigating batch effect with nested ComBat harmonization. Med. Phys. 2025, 52, e18070. [Google Scholar] [CrossRef] [Scilit] [PubMed]
- Nardone, V.; Reginelli, A.; Rubini, D.; Gagliardi, F.; Del Tufo, S.; Belfiore, M.P.; Boldrini, L.; Desideri, I.; Cappabianca, S. Delta radiomics: An updated systematic review. Radiol. Med. 2024, 129, 1197–1214. [Google Scholar] [CrossRef] [Scilit]
- Liu, X.; Han, X.; Zhang, G.; Zhu, X.; Zhang, W.; Wang, X.; Wu, C. Computed tomography-based delta-radiomics analysis for preoperative prediction of ISUP pathological nuclear grading in clear cell renal cell carcinoma. Abdom. Radiol. 2025, 50, 4289–4300. [Google Scholar] [CrossRef] [Scilit]
- Chen, Y.; Yuan, E.; Sun, G.; Song, B.; Yao, J. Delta radiomics model predicts lesion-level responses to tyrosine kinase inhibitors in patients with advanced renal cell carcinoma: A preliminary result. J. Clin. Med. 2023, 12, 1301. [Google Scholar] [CrossRef] [Scilit] [PubMed]
- Khaleel, S.; Katims, A.; Cumarasamy, S.; Rosenzweig, S.; Attalla, K.; Hakimi, A.A.; Mehrazin, R. Radiogenomics in clear cell renal cell carcinoma: A review of the current status and future directions. Cancers 2022, 14, 2085. [Google Scholar] [CrossRef] [Scilit]
- He, Z.; Huang, L. From radiomics to radiogenomics: Decoding renal cell carcinoma biology for precision medicine—A narrative review. Insights Imaging 2025, 16, 278. [Google Scholar] [CrossRef] [Scilit]
- Kan, H.C.; Lin, P.H.; Shao, I.H.; Cheng, S.C.; Fan, T.Y.; Chang, Y.H.; Huang, L.K.; Chu, Y.C.; Yu, K.J.; Chuang, C.K.; et al. Using deep learning to differentiate among histology renal tumor types in computed tomography scans. BMC Med. Imaging 2025, 25, 66. [Google Scholar] [CrossRef] [Scilit] [PubMed]
- Klontzas, M.E.; Kalarakis, G.; Koltsakis, E.; Papathomas, T.; Karantanas, A.H.; Tzortzakakis, A. Convolutional neural networks for the differentiation between benign and malignant renal tumors with a multicenter international computed tomography dataset. Insights Imaging 2024, 15, 26. [Google Scholar] [CrossRef] [Scilit]



| Study | Year | Type of Study | Outcome | Number of Patients with Renal Tumors | Age (Years) | Sex (Male vs. Female) | Tumor Size (cm) | Type of Surgery |
|---|---|---|---|---|---|---|---|---|
| Bang et al. [34] | 2025 | retrospective, single-center | Dd RCC vs. benign renal tumors (SRMs) | 499 (373 RCCs: 200 ccRCCs, 89 pRCCs, 84 chRCCs; 126 benign: 74 fpAMLs, 48 ROs) | 56.02 ± 12.18 | 285/214 | 3.515 ± 2.42 | nephrectomy, PN |
| Qian et al. [35] | 2025 | retrospective, single-center | Dd RCC vs. benign malignant tumors | 122 (75 malignant: 58 RCCs, 17 various; 47 benign: 40 AMLs, 7 ROs) | 54.2 (malignant) 46.5 (benign) | 82/40 | n/a | n/a |
| Wu et al. [36] | 2024 | retrospective, multicenter | Dd RCC vs. benign renal tumors | 427 (279 RCCs: 237 ccRCCs, 16 pRCCs, 26 chRCCs; 148 benign: 144 AMLs, 4 ROs) | 51 (42–61) | 213/214 | 4.0 (2.8–5.5) | n/a |
| Uhlig et al. [37] | 2024 | retrospective, multicenter | renal tumor subtypes | 418 (259 ccRCCs, 100 pRCCs, 26 chRCCs, 19 AMLs, 54 ROs) | 64 ± 13 | 268/159 | 4.2 ± 1.6 | nephrectomy, PN |
| Yu et al. [38] | 2024 | retrospective, single-center | Dd malignant vs. benign renal tumors | 1795 (1396 malignant: 1191 ccRCCs, 51 pRCCs, 78 chRCCs, others; 399 benign (307 AMLs, 18 ROs, others) | 56 (18–86, malignant) 50 (18–84, benign) | 978/418 | 3.5 (0.9–13.9, malignant) 3.9 (0.9–19.3, benign) | PN |
| Yang et al. [39] | 2024 | retrospective, multicenter | Dd RCC vs. benign renal tumors | 1051 (901 RCCs: 678 ccRCCs, 149 pRCCs, 74 chRCCs; 150 benign: 67 AMLs, 23 ROs, 30 others) | 52.89 ± 13.94 | 624/427 | n/a | nephrectomy, PN |
| Maddalo et al. [40] | 2023 | retrospective, single-center | Dd RCC vs. benign renal tumors (SRMs) | 85 (51 RCCs: 37 ccRCCs, 7 pRCCs, 7 chRCCs; 34 benign: 7 fpAMLs, 25 ROs, 2 leiomyomas) | 67 (RCC), 64 (benign) | 35/16 (RCC), 16/18 (benign) | 28.5 (RCC), 22.6 (benign) | nephrectomy, PN, tumorectomy |
| Garnier et al. [41] | 2023 | retrospective, single-center | Dd RCC vs. benign renal tumors | 122 (111 RCCs: 79 ccRCCs, 13 pRCCs, 16 chRCCs, 3 rare; 21 benign: 2 fpAMLs, 18 ROs, 1 rare) | 58 ± 14 | 87/45 | 4.3 (1–12.3) | PN |
| Zhou et al. [42] | 2023 | retrospective, multicenter + TCIA | Dd RCC vs. benign renal tumors | 798 (680 RCCs: 533 ccRCCS, 78 pRCCs, 69 chRCCs; 125 benign: 83 fpAMLs, 42 ROs) | 53.88 ± 12.24 (benign) 56.35 ± 12.66 (RCC) | 160/638 | n/a | surgery, biopsy |
| Feng et al. [43] | 2023 | retrospective, single-center | Dd RCC vs. benign renal tumors (SRMs) | 156 (92 RCCs: 79 ccRCCs, 7 pRCCs, 6 chRCCs; 64 benign: 37 AMLs, 25 fpAMLs, 1 RO, 1 rare) | 54.65 ± 12.12 (RCC) 44.36 ± 11.66 (benign) | 70/86 | 31.19 ± 8.04 (RCC) 25.85 ± 8.91 (benign) | n/a |
| Wentland et al. [44] | 2023 | retrospective, single-center | Dd RCC vs. benign renal tumors | 148 (98 RCCs: 23 ccRCCs, 44 pRCCs, 31 chRCCs; 50 benign: 23 AMLs, 27 ROs) | 57.5 ± 12.1 (25–87) | 87/61 | 3.3 ± 1.6 (1.2–11.6, RCC) 2.7 ± 1.1 (1.2–5.6, benign) | PN |
| Nassiri et al. [45] | 2022 | prospective, single-center | Dd RCC vs. benign renal tumors | 684 (521 RCCs: 401 ccRCCs, 73 pRCCs, 42 chRCCs, 5 others; 163 benign: 59 fpAMLs, 104 ROs) | 62 (23–94, RCC) 63 (17–92, benign) | 468/215 | <4: 284/106; 4–7: 149/32; 7–10: 48/12; >10: 40/13 | nephrectomy, PN |
| Yap et al. [46] | 2021 | retrospective, single-center | Dd RCC vs. benign renal tumors | 735 (539 malignant: 407 ccRCCs, 73 pRCCs, 42 chRCCs, 17 others; 196 benign (59 fpAMLs, 104 ROs, 33 others) | 60.8 (17–93) | 495/240 | n/a | nephrectomy, PN |
| Erdim et al. [47] | 2020 | retrospective, single-center | Dd RCC vs. benign renal tumors | 79 (63 RCCs: 25 ccRCCs, 23 pRCCs, 15 chRCCs; 22 benign: 11 fpAMLs, 10 ROs) | 57.2 ± 12.6 (RCC) 54.9 ± 15.5 (benign) | 55/24 | 58.41 ± 33.01 (RCC) 36.04 ± 13.96 (benign) | surgery, biopsy |
| Uhlig et al. [48] | 2020 | retrospective, multicenter | Dd RCC vs. benign renal tumors | 201 (171 RCCs: 131 ccRCCs, 29 pRCCs, 11 chRCCs; 30 benign: 14 AMLs, 16 ROs) | 66 (56–74) | 121/73 | 5.16 (3.84–6.84) | nephrectomy, biopsy |
| Schieda et al. [49] | 2020 | retrospective, single-center | Dd RCC vs. benign renal tumors | 165 (116 RCCs: 51 ccRCCs, 40 pRCCs, 25 chRCCs; 61 benign: 12 fpAMLs, 49 ROs) | 52 ± 16 62 ± 10 (benign) 63 ± 12 59 ± 12 (RCC) | 36/25 (benign) 36/25 (RCC) | 1.9 ± 1.3 (8–44) 3.5 ± 2.4 (6–10.8, benign) 5.2 ± 2.7 (1.7–14.8) 3.6 ± 2.2 (1.2–9.8) 4.5 ± 2.0 (1.7–8.8, RCC) | nephrectomy, biopsy |
| Uhlig et al. [50] | 2020 | retrospective, multicenter | Dd RCC vs. benign renal tumors (clinical T1) | 94 (76 RCCs: 67 ccRCCs, 7 pRCCs, 2 chRCCs; 18 benign: 9 AMLs, 9 ROs) | 64.4 | 66/28 | 4,65 | nephrectomy, PN |
| Sun et al. [51] | 2020 | retrospective, single-center | Dd RCC vs. benign renal tumors | 288 (254 RCCs: 190 ccRCCs, 26 pRCCs, 38 chRCCs; 36 benign: 26 fpAMLs, 10 ROs) | 55 (19–85) | 178/110 | 3.94 | nephrectomy, PN, biopsy |
| Kunapuli et al. [52] | 2018 | retrospective, single-center | Dd RCC vs. benign renal tumors | 150 (100 RCCs: 70 ccRCCs, 20 pRCCs, 10 chRCCs; 50 benign: 20 fpAMLs, 30 ROs) | n/a | n/a | n/a | n/a |
| Study | Year | Type of Study | Outcome | Number of Patients with Renal Tumors | Age (Years) | Sex (Male vs. Female) | Tumor Size (cm) | Type of Surgery |
|---|---|---|---|---|---|---|---|---|
| Yang et al. [39] | 2024 | retrospective, multicenter | Dd ccRCC vs. non-ccRCC | 901 RCCs (678 ccRCCs, 149 pRCCs, 74 chRCCs) | 52.89 ± 13.94 | n/a | n/a | nephrectomy, PN |
| Sun et al. [51] | 2020 | retrospective, single-center | Dd ccRCC vs. non-ccRCC | 254 (190 ccRCCs, 26 pRCCs, 36 chRCCs) | 59 (23–85, ccRCC) 54 (19–76, pRCC) 51 (24–83, chRCC) | n/a | 4.00 (ccRCC) 4.16 (pRCC) 4.61 (chRCC) | nephrectomy, PN, biopsy |
| Cheng et al. [53] | 2023 | retrospective, single-center | Dd ccRCC vs. non-ccRCC | 147 (100 ccRCCs, 25 pRCCs, 22 chRCCs) | 58.56 ± 11.42 (29–80, ccRCC) 53.06 ± 13.37 (31–82 non-ccRCC) | 67/33 (ccRCC) 31/16 (non-ccRCC) | n/a | n/a |
| Budai et al. [54] | 2022 | retrospective, single-center + KiTS19 | Dd ccRCC vs. non-ccRCC | 278 (211 ccRCCs, 47 pRCCs, 27 chRCCs) | 60.5 (ccRCC) 53 (non-ccRCC) | 140/44 | n/a | nephrectomy, PN |
| Gao et al. [55] | 2022 | retrospective, single-center | Dd RCC subtypes: high-grade ccRCC vs. pRCC 2 | 142 (71 ccRCCs, 71 pRCCs) | 54 (50–66, ccRCC) 61 (55–71, pRCC) | 109/33 | 6.4 (4.1–8.3, ccRCC) 5.5 (3.4–7.5, pRCC) | n/a |
| Wu et al. [56] | 2022 | retrospective, multicenter | Dd ccRCC vs. non-ccRCC | 443 (350 ccRCCs, 39 pRCCs, 30 chRCCs, 24 others) | 59.4 ± 13.5 | 278/165 | n/a | n/a |
| Zhang et al. [57] | 2021 | retrospective, single-center | Dd RCC subtypes + ccRCC vs. non-ccRCC | 261 (209 ccRCCs, 25 pRCCs, 29 chRCCs) | 52 (ccRCC) 52 (pRCC) 54 (chRCC) | 166/95 | 4.507 (ccRCC) 4.523 (pRCC) 4.737 (chRCC) | n/a |
| Wang et al. [58] | 2021 | retrospective, single-center | Dd ccRCC vs. non-ccRCC | 190 (147 ccRCCs, 24 pRCCs, 13 chRCCs, 6 collecting duct carcinomas) | 59.32 ± 10.68 (27–88) | 100/90 | 2–11 (6.5 ± 3.5) | n/a |
| Chen et al. [59] | 2021 | retrospective, single-center | Dd ccRCC vs. non-ccRCC | 197 (143 ccRCCs, 25 pRCCs, 29 chRCCs) | 53.202 ± 13.086 (ccRCC), 52.804 ± 12.857 (non-ccRCC) | 123/74 | 5.283 ± 2.602 cm (ccRCC), 4.929 ± 2.615 (non-RCC) | nephrectomy, PN, biopsy |
| Li et al. [60] | 2019 | retrospective, multicenter | Dd ccRCC vs. non-ccRCC | 255 (188 ccRCCs, 36 pRCCs, 31 chRCCs) | 58.89 (33–81) | 169/86 | n/a | n/a |
| Kocak et al. [61] | 2018 | retrospective, single-center + TCIA | Dd RCC subtypes + ccRCC vs. non-ccRCC | 93 (61 ccRCCs, 20 pRCCs, 13 chRCCs) | 55.1 (38–88) | 67/26 | 6.85 (2.1–22.6) | n/a |
| Study | Year | Type of study | Outcome | Number of Patients with Renal Tumors | Age (Years) | Sex (Male vs. Female) | Tumor Size (cm) | Type of Surgery |
|---|---|---|---|---|---|---|---|---|
| Ma et al. [62] | 2021 | retrospective, single-center | Dd fpAML vs. ccRCC | 139 (29 fpAMLs, 110 ccRCCs) | 47.3 ± 10.9 (fpAML) 59.5 ± 12 (ccRCC) | 12/17 (fpAML) 77/33 (ccRCC) | n/a | nephrectomy, PN |
| Ma et al. [63] | 2021 | retrospective, single-center | Dd fpAML vs. ccRCC | 230 (58 fpAMLs, 172 ccRCCs) | 48.4 ± 11.9 (fpAML) 61.3 ± 13.2 (ccRCC) | 38/20 (fpAML) 59/113 (ccRCC) | 2.71 ± 1.55 (fpAML) 3.49 ± 1.29 (ccRCC) | nephrectomy, PN |
| Ma et al. [64] | 2020 | retrospective, single-center | Dd fpAML vs. ccRCC | 84 (22 fpAMLs, 62 ccRCCs) | 50.5 ± 12.8 (fpAML) 57.9 ± 10.8 (ccRCC) | 6/16 (fpAML) 38/24 (ccRCC) | 3.20 ± 0.98 (fpAML) 3.74 ± 1.56 (ccRCC) | nephrectomy, PN |
| Nie et al. [65] | 2020 | retrospective, single-center | Dd fpAML vs. ccRCC | 99 (36 fpAMLs, 63 ccRCCs) | 50.08 ± 8.3 (fpAMLs) 58.57 ± 11.45 (ccRCC) | 10/42 (fpAML) 26/21 (ccRCC) | 2.19 (0.78–8.83, fpAMLs) 2.72 (1.30–6.24, ccRCC) | n/a |
| Yang et al. [66] | 2020 | retrospective, single-center | Dd fpAML vs. RCC | 163 (45 fpAMLs, 113 RCCs: 95 ccRCCs, 10 pRCCs, 13 chRCCs) | 48.6 ± 13.7 (fpAML) 52.9 ± 13.1 (RCC) | 13/32 (fpAML) 87/31 (RCC) | 2.5 (2.1–3.3 fpAML) 2.9 (2.4–3.3, RCC) | nephrectomy, PN |
| Cui et al. [67] | 2019 | retrospective, single-center | Dd fpAML vs. RCC | 168 (41 fpAMLs, 130 RCCs: 82 ccRCCs, 22 pRCCs, 26 chRCCs) | 48.56 ± 12.9 (fpAML) 55.27 ± 11.56 (ccRCC) 49.27 ± 12.99 (pRCC) 55.00 ± 11.8 (chRCC) | 11/29 (fpAMLs) 72/56 (RCCs) | <4 | nephrectomy, PN |
| Feng et al. [68] | 2018 | retrospective, single-center | Dd fpAML vs. RCC (SRMs) | 58 (17 fpAMLs, 41 RCCs) | 48.7 ± 10.8 (fpAML) 56.2 ± 12.3 (RCC) | 7/10 fpAML 27/14 RCC | ≤4 | nephrectomy, PN |
| Lee et al. [69] | 2017 | retrospective, single-center | Dd fpAML vs. ccRCC (SRMs) | 80 (39 fpAMLs, 41 ccRCCs) | n/a | n/a | 1.62 ± 0.53 (fpAML) 2.36 ± 0.72 (ccRCC) | n/a |
| Study | Year | Type of Study | Outcome | Number of Patients with Renal Tumors | Age (Years) | Sex (Male vs. Female) | Tumor Size (cm) | Type of Surgery |
|---|---|---|---|---|---|---|---|---|
| Ye et al. [70] | 2025 | retrospective, multicenter | Dd RO vs. chRCC | 92 (41 ROs, 51 chRCCs) | 54.5 ± 8.96 (RO) 51.4 ± 13.63 (chRCC) | 38/54 | n/a | nephrectomy, PN |
| Yang et al. [71] | 2024 | retrospective, single-center | Dd RO vs. chRCC | 96 (30 ROs, 66 chRCCs) | 53.23 ± 9.71 (RO) 50.82 ± 12.10 (chRCC) | 45/51 | 3.6 (2.35–4.45, RO) 4.3 (3.27–6.00 chRCC) | n/a |
| Aymerich et al. [72] | 2023 | retrospective, single-center | Dd RO vs. chRCC | 38 (19 ROs, 19 chRCCs) | 69 (57–86, RO) 70 (38–85, chRCC) | 19/19 | n/a | n/a |
| Carlini et al. [73] | 2023 | retrospective, single-center | Dd RO vs. ccRCC (SRMs) | 77 (30 ROs, 47 ccRCC) | n/a | n/a | n/a | PN |
| Yu et al. [74] | 2022 | retrospective, single-center | Dd RO vs. RCC (chRCC, ccRCC) | 180 (41 ROs, 139 RCCs: 75 chRCCs, 64 ccRCCs) | 59.4 ± 7.8 (RO) 57.3 ± 9.7 (chRCC) 54.0 ± 10.9 (ccRCC) | 86/94 | n/a | nephrectomy, PN, active surveillance |
| Alhussaini et al. [75] | 2022 | prospective + retrospective, multicenter | Dd RO vs. chRCC | 78 (41 ROs, 37 chRCCs) | 68.17 ± 8.74 (RO) 56.83 ± 14.30 (chRCC) | 38/40 | 3.54 ± 1.47 (RO) 5.4 ± 3.32 (chRCC) | nephrectomy, biopsy |
| Li et al. [76] | 2022 | retrospective, multicenter | Dd RO vs. chRCC | 141 (47 ROs, 94 chRCCs) | 57.16 ± 11.37 (RO) 54.53 ± 11.07 (chRCC) | 61/80 | n/a | n/a |
| Li et al. [77] | 2021 | retrospective, multicenter | Dd RO vs. ccRCC (SRMs) | 122 (46 ROs, 76 ccRCCs) | 54.43 ± 16.19 (RO) 54.0 ± 10.9 (ccRCC) | 21/25 (RO) 64/22 (ccRCC) | ≤4 | nephrectomy, PN |
| Jaggi et al. [78] | 2021 | retrospective, single-center | Dd RO vs. chRCC | 102 (42 ROs, 60 chRCCs) | 63 ± 12 | 68/34 | n/a | nephrectomy, PN |
| Li et al. [79] | 2020 | retrospective, single-center | Dd RO vs. chRCC | 61 (17 ROs, 44 chRCCs) | 54.9 (35–79, RO) 50.8 (22–79, chRCC) | 40/21 | n/a | nephrectomy, PN |
| Yu et al. [80] | 2017 | retrospective, single-center | Dd RO vs. RCC | 119 (10 ROs, 46 ccRCCs, 41 pRCCs, 22 chRCCs) | n/a | n/a | n/a | n/a |
| Study | Segmentation Method |
|---|---|
| Bang et al. [34] | whole tumor, manual 3D segmentation, 2 radiologists |
| Qian et al. [35] | whole tumor, manual 3D segmentation, 2 radiologists, 3D Slicer (version 5.3.0, https://www.slicer.org/, accessed on 23 May 2026) |
| Wu et al. [36] | whole tumor, manual 3D segmentation, 4 observers, ITK-SNAP, 3.8.0 |
| Uhlig et al. [37] | 3D Slicer |
| Yu et al. [38] | manual 3D segmentation: whole tumor + 3 mm inside + 3 mm + 5 mm expanding tumor margins + 3 mm + 5 mm peritumoral + 6 mm + 8 mm crossing tumor borders (CMP), whole tumor (UECT, NP), ITK-SNAP |
| Yang et al. [39] | manual delineation, 3 radiologists + automated kidney and kidney tumor segmentation, 3D-Unet |
| Maddalo et al. [40] | whole tumor, manual 3D segmentation, 3 radiologists, 3D Slicer, version 4.10.2 |
| Garnier et al. [41] | whole tumor, 3D semi-automated segmentation, NP, SOPHiA DDM, Radiomics v2.1.21 (SOPHiA GENETICS, Saint-Sulpice, Switzerland) |
| Zhou et al. [42] | manual 2D (largest tumor slice) + 3D (whole tumor) segmentation, 5 radiologists, Python (version 3.6.5), PyRadiomics |
| Feng et al. [43] | whole tumor, 1 mm from tumor margins, manual 3D segmentation, 3D Slicer, version: 4.10.2. |
| Wentland et al. [44] | whole tumor, 3D semi-automated segmentation, 2 radiologists, syngoVia Frontier (Siemens Healthineers, Forchheim, Germany) |
| Nassiri et al. [45] | whole tumor, manual 3D segmentation, 4 radiologists, Synapse 3D (FujiFilm, Stamford, CT, USA) |
| Yap et al. [46] | whole tumor, manual 2D + 3D segmentation, 4 radiologists, Synapse 3D (Fujifilm) |
| Erdim et al. [47] | whole tumor, 1mm from tumor margins, manual 3D segmentation, 2 radiologists, MaZda (version 4.6, P. M. Szczypinski, Institute of Electronics, Technical University of Lodz) |
| Uhlig et al. [48] | whole tumor, manual 3D segmentation, 3D Slicer, PyRadiomics |
| Schieda et al. [49] | largest tumor slice, manual 2D segmentation, 2 radiologists, ImageJ ®, version 1.52r (National Institutes of Health, USA http://rsbweb.nih.gov/, accessed on 23 May 2026) |
| Uhlig et al. [50] | whole tumor, manual 3D segmentation, 2 radiologists, 3D Slicer |
| Sun et al. [51] | whole tumor, 3D semi-automated segmentation, 2 radiologists, Python (version 3.6.1, Python Software Foundation) |
| Kunapuli et al. [52] | manual 2D (largest tumor slice) + 3D (whole tumor) segmentation, 3D Synapse (Fujifilm, Stamford CT) |
| Study | Extracted Features | Feature Selection | Model Training | Classification Results | AUC (±SD OR 95% CI) |
|---|---|---|---|---|---|
| Bang et al. [34] | 1288 RFs: first order, 3D shape, GLCM, GLRM, GLSZM, NGTDM, GLDM, PyRadiomics + Python (version 3.10.8) | statistical tests + dimensionality reduction | LinearSVM, RadialbasisfunctionSVM, RF, XGBoost | radiomics: XGBoost trained with 20% of principal components + all CT phases | 0.744 ± 0.004 |
| Qian et al. [35] | 322 RFs: shape, first-order, texture (GLCM, GLDM, GLRLM, GLSZM, NGTDM), PyRadiomics, Python (https://pyradiomics.readthedocs.io/en/2.1.2/, accessed on 23 May 2026). | reproducibility analysis + statistical tests + LASSO | SVM, kNN, LightGBM, LR | clinical model | 0.747 (0.5660–0.9274) |
| radiomics: LR | 0.887 (0.7782–0.995) | ||||
| nomogram | 0.900 (0.7874–1.0000) | ||||
| Wu et al. [36] | 1781 RFs: first order, LoG, wavelet, square, logarithm, squareRoot, exponential, gradient filtered, PyRadiomics (version 3.0.1), Python 3.7.6 | mRMR | NB, Ensemble: Boosting + Bagging + RF, DT, LR, SVM: Linear + Polynomial + Gaussian, NN: 2 + 3 Layers, RFGB | radiomics: EP | 0.921 (0.879–0.963) |
| Uhlig et al. [37] | 127 RFs: first-order, 3D shape, 2D shape, GLCM, GLSZM, GLRLM, NGTDM, GLDM, 3D Slicer | no feature selection; RFE; PCA | XGBoost | radiomics | 0.75 |
| Yu et al. [38] | 14,248 RFs: histogram, GLCM, GLSZM, GLRLM, NGTDM, GLCM | reproducibility analysis + statistical tests + LASSO | LR | clinical model | 0.784 (0.740–0.828) |
| radiomics | 0.929 | ||||
| nomogram | 0.954 (0.933–0.975) | ||||
| Yang et al. [39] | 200 RFs (morphological + texture), PyRadiomics, Python, version 3.7 (https://www.python.Org, accessed on 23 May 2026) + 520 combined features | LASSO | LR, SVM, RF, XGBoost | radiomics: XGBoost + both CT phases | 0.88 (0.82–0.95) |
| Maddalo et al. [40] | 108 RFs: first-order, shape, GLCM, GLRLM, GLSZM, NGTDM, GLDM, SlicerRadiomics® | redundant elimination scaling + centering, balancing with RWO, reproducibility analysis | kNN | radiomics | 0.79 ± 0.04 |
| Garnier et al. [41] | >200 RFs: shape, intensity, texture | dimensionality reduction | Logit-LASSO, rpart, SVMLinear, RF, C5.0 Tree, wC5Tree | radiomics: C5.0Tree | 0.736 |
| Zhou et al. [42] | first-order, shape, GLCM, GLSZM, GLRLM, NGTDM, GLDM, Python (version 3.6.5), PyRadiomics | reproducibility analysis, CatBoost DT | CatBoost DT | radiomics, 3D + all CT phases | 0.81 |
| Feng et al. [43] | 479 RFs: shape, first-order, texture, LoG | reproducibility analysis + statistical tests + LASSO | LR, DT | clinical model | 0.814 (0.690–0.938) |
| radiomics | 0.954 (0.902–1.000) | ||||
| nomogram | 0.968 (0.928–1.000) | ||||
| Wentland et al. [44] | first-order, GLCM, GLSZM, GLRLM, PyRadiomics | RF | RF | radiomics signature: wavelet transform, RF | 0.80 |
| Nassiri et al. [45] | 2D + 3D shape, texture features | reproducibility analysis | RF, real AdaBoost | clinical model | 0.62 90.54–0.700 |
| radiomics | 0.83 (0.77–0.88) | ||||
| nomogram | 0.84 (0.79–0.90) | ||||
| Yap et al. [46] | 33 shape, 760 texture features | RF | RF, AdaBoost | radiomics: shape features, independent of CT phase, RF | 0.68 (0.62–0.74) |
| Erdim et al. [47] | 271 RFs/phase: histogram, gradient, run-length matrix, co-occurrence matrix, autoregressive, Haar wavelet, MaZda (version 4.6, P. M. Szczypinski, Institute of Electronics, Technical University of Lodz) | reproducibilty + Waikato Environment for Knowledge Analysis toolkit + correlation analysis | kNN, NN, LR, J48 DT, SVM, NB, LWL, RF | radiomics: CMP + RF | 0.916 |
| Uhlig et al. [48] | first-order, 3D shape, 2D shape, GLCM, GLSZM, GLRLM, NGTDM, GLDM, PyRadiomics | no feature selection; RFE; PCA | RF, RF ranger, XGBoost, boosted classification trees (C5.0), glmnet, SVM, kNN, NN | radiomics: XGBoost + no feature selection + SMOTE | 0.72 |
| Schieda et al. [49] | 25 2D texture features: histogram, GLCM, RLM MaZda®, version 4.6 (P.M. Szczypiński, Institute of Electronics, Technical University of Lodz, Poland) | XGBoost | XGBoost | radiomics: all CT phases | 0.73 |
| Uhlig et al. [50] | 120 RFs: first-order, 3D shape, 2D shape, GLCM, GLSZM, GLRLM, NGTDM, GLDM | RFE | XGBoost, RF, NN, SVM, kNN | radiomics: RF | 0.83 |
| Sun et al. [51] | first-order, shape, GLSZM, GLRLM, GLCM, CMP, PyRadiomics | reproducibility analysis + statistical testes + RFE-SVM | RFE-SVM | radiomics: combined model | 0.94 (0.89–0.96) |
| Kunapuli et al. [52] | 204 texture features: histogram, 2D/3D GLCM, 2D/3D GLDM, 2D FFT | RFE | RFGB | radiomics: RFGB | 0.83 |
| Study | Segmentation Method |
|---|---|
| Yang et al. [39] | manual delineation, 3 radiologists + automated kidney and tumor segmentation, 3D-Unet |
| Sun et al. [51] | whole tumor, 3D semi-automated segmentation, 2 radiologists, Python (version 3.6.1, Python Software Foundation) |
| Cheng et al. [53] | whole tumor, manual 3D segmentation, 3 radiologists, 3D Slicer |
| Budai et al. [54] | whole tumor, not tumor margins, manual 3D segmentation, 2 radiologists, 3D Slicer, v.4.10.2 |
| Gao et al. [55] | whole tumor, 1–2 mm from tumor margins, manual 3D segmentation, ITK-SNAP (version 3.8, www.itksnap.org, accessed on 23 May 2026) |
| Wu et al. [56] | automated segmentation, 3D-Unet |
| Zhang et al. [57] | whole tumor, 2 mm from tumor margins, manual 3D segmentation, 2 radiologists, ITK-SNAP (http://www.itk-snap.org, accessed on 23 May 2026) |
| Wang et al. [58] | whole tumor, 0–1 mm from tumor margins, manual 3D segmentation, 2 observers, ITK-SNAP |
| Chen et al. [59] | manual 3D segmentation, 2 mm from tumor margins, 2 radiologists, ITK-SNAP (www.itk-snap.org, accessed on 23 May 2026) |
| Li et al. [60] | whole tumor, manual 3D segmentation, ITK-SNAP |
| Kocak et al. [61] | largest tumor slice, 1–2 mm from tumor margins, manual 2D segmentation, MazDa (version 4.6, P. M. Szczypiński, Institute of Electronics, Technical University of Lodz) |
| Study | Extracted Features | Feature Selection | Model Training | Classification Results | AUC (±SD OR 95% CI) |
|---|---|---|---|---|---|
| Yang et al. [39] | 200 RFs (morphological + texture), PyRadiomics, Python, version 3.7 (https://www.python.Org, accessed on 23 May 2026) + 520 combined features | LASSO | LR, SVM, RF, XGB | radiomics: XGBoost + both CT phases | 0.90 (0.85–0.94) |
| Sun et al. [51] | RFs: first-order, shape, GLSZM, GLRLM, GLCM, PyRadiomics, CMP | reproducibility analysis + statistical tests + RFE-SVM | RFE-SVM | radiomics: combined model | 0.93 (0.89–0.95) |
| Cheng et al. [53] | 1168 RFs: original (first-order, GLCM, GLDM, GLRLM, GLSZM, NGDTM, shape 2D + 3D), LOG preprocessed + wavelet-transformed features, 3D Slicer | statistical tests + LASSO | LR, DT, RF, SVM, AdaBoost | radiomics: LR | 0.929 (0.855–1.000) |
| nomogram | 0.949 (0.885–1.000) | ||||
| Budai et al. [54] | 321 RFs: first-order, shape, GLCM, GLRLM, GLSZM, GLDM, NGTDM | correlation, reproducibility analysis + LASSO or tuned ReliefF | SVM, RF | radiomics: SVM + CMP | 0.834 (0.730–0.938) |
| Gao et al. [55] | 1595 RFs/phase | reproducibility analysis + statistical tests + LASSO | LR | clinical model | 0.717 (0.611–0.826) |
| radiomics | 0.821 (0.702–0.922) | ||||
| nomogram | 0.831 (0.716–0.930) | ||||
| Wu et al. [56] | 520 RFs: texture, morphologic, statistical, PyRadiomics | n/a | XGBoost | radiomics | 0.83 ± 0.1 |
| Zhang et al. [57] | 105 RFs/phase: first-order, 3D shape, texture (GLCM, GLSZM, GLRLM, GLDM, NGTDM), PyRadiomics | reproducibility analysis + LASSO | LR | clinical model | 0.79 |
| radiomics: CMP/all CT phases | 0.89 | ||||
| Wang et al. [58] | 397 RFs: histogram, haralick, formfactor, GLSZM, GLCM, RLM (CMP) | reproducibility + correlation analysis + statistical tests | LR, RF, SVM | radiomics: RF | 0.906 |
| Chen et al. [59] | 296 texture features: GLCM, GLRLM, GLSZM, NGTDM, GLDM, PyRadiomics | LASSO | LASSO | clinical model: CMP | 0.823 (0.745–0.901) |
| radiomics: same performance on CMP, NP, EP | 0.887 (0.828–0.945) | ||||
| nomogram: same performance on CMP, NP, EP | 0.900 (0.837–0.963) | ||||
| Li et al. [60] | 156 RFs: GLCM, GLRLM, GLSZM, NGTDM | reproducibility analysis + RF (Boruta) + mRMR | RF | radiomics: Boruta | 0.949 (0.889–0.933) |
| radiomics nomogram | 0.951 | ||||
| Kocak et al. [61] | 275 RFs/phase: histogram, gradient, GLCM, RLM, autoregressive model, Haar wavelet | reproducibility analysis + wrapper-based feature selection (ML classifiers) | MLP-ANN, SVM + SMOTE, adaptive boosting, bagging | radiomics: ANN + SMOTE, CMP | 0.909 |
| Study | Segmentation Method |
|---|---|
| Ma et al. [62] | whole tumor, 2–3 mm from tumor margins, manual 3D segmentation, 2 radiologists, ITK-SNAP (http://www.itksnap.org/; V 3.4.0, accessed on 23 May 2026) |
| Ma et al. [63] | whole tumor, 2–3 mm from tumor margins + peri-tumoral, 2 mm outside tumor margins: perirenal + perifat, manual 3D segmentation, 2 radiologists, mostly NP, ITK-SNAP (http://www.itksnap.org/, V3.4.0) |
| Ma et al. [64] | whole tumor, 2–3 mm from tumor margins, manual 3D segmentation, ITK-SNAP, version 3.4.0 (http://www.itksnap.org/, accessed on 23 May 2026) |
| Nie et al. [65] | whole tumor, manual 3D segmentation, 2 radiologists, ITK-SNAP (version 3.8, www.itksnap.org, accessed on 23 May 2026) |
| Yang et al. [66] | largest tumor slice, manual 2D segmentation, 2 radiologists, ITK-SNAP (http://www.itksnap.org, accessed on 23 May 2026) |
| Cui et al. [67] | whole tumor, 3 mm from tumor margins, manual 3D segmentation, 2 radiologists, ITK-SNAP (version 3.6.0, www.itksnap.Org, accessed on 23 May 2026) |
| Feng et al. [68] | largest tumor slice, 2–3 mm from tumor margins, manual 2D segmentation, 2 radiologists, DT kinetics |
| Lee et al. [69] | central tumor slice, manual 2D segmentation |
| Study | Extracted Features | Feature Selection | Model Training | Classification Results | AUC (±SD OR 95% CI) |
|---|---|---|---|---|---|
| Ma et al. [62] | 396 RFs: histogram, texture, form factor, GLCM, RLM | reproducibility + univariate + correlation analysis + LASSO | LR | radiomics | 0.923 (0.797–0.982) |
| nomogram | 0.968 (0.923–0.990) | ||||
| Ma et al. [63] | 396 RFs/phase: histogram, texture, form factor, GLCM, GLRLM, GLZSM | reproducibility + univariate +correlation analysis + LASSO | LR | radiomics: tumoral + perirenal model | 0.89 (0.842–0.927) |
| Ma et al. [64] | 396 RFs: histogram, texture, form factor, GLCM, RLM, AK software (Artificial Intelligence Kit V 3.0.0, GE Healthcare) | statistical tests + correlation analysis + LASSO | LR | clinical model | 0.935 (0.860–0.9770 |
| radiomics | 0.925 (0.824–1.000) | ||||
| nomogram | 0.988 (0.935–1.000) | ||||
| Nie et al. [65] | 2818 RFs: intensity, shape, texture (GLCM, GLRLM, GLSZM), filter, wavelet, CMP + NP, RadCloud platform (Huiying Medical Technology Co., Ltd) | reproducibility analysis + statistical tests + LASSO | n/a | clinical model | 0.878 (0.718–1.000) |
| radiomics | 0.846 (0.634–1.000) | ||||
| nomogram | 0.949 (0.856–1.000) | ||||
| Yang et al. [66] | 103 RFs: shape, first-order, texture, PyRadiomics | 28 feature selection methods | LR, SVM, NB, kNN, DT, bagging, RF, AdaBoosting | radiomics: SVM + t_score (UECT), SVM + relief (UECT + NP) | 0.90 |
| Cui et al. [67] | original features: first-order, shape, GLCM, GLSZM, GLRLM, NGTDM, GLDM + filtered: wavelet, LoG, square, squareroot, logarithm, exponential, PyRadiomics | SMOTE + Boruta package + SVM-RFECV | SVM-RFECV | clinical model: fpAML vs. RCC | 0.67 |
| clinical model: fpAML vs. ccRCC | 0.68 | ||||
| radiomics: Dd fpAML vs. RCC | 0.96 | ||||
| radiomics: Dd fpAML vs. ccRCC | 0.97 | ||||
| Feng et al. [68] | 42 RFs: histogram, GLCM | reproducibility analysis + statistical tests + SVM-RFE | SVM-RFE + SMOTE | radiomics: SVM-RFE + SMOTE | 0.955 (0.855–0.988) |
| Lee et al. [69] | 71 RFs: histogram, texture, shape | statistical tests | RF | radiomics | 0.774 |
| Study | Segmentation Method |
|---|---|
| Ye et al. [70] | whole tumor manual 3D segmentation, 2 radiologists, ITK-SNAP (http://www.itksnap.org, accessed on 23 May 2026) + peritumoral: 1mm, 2mm, 3mm beyond tumor margins, “scipy.ndimage” |
| Yang et al. [71] | whole tumor, 1mm from tumor margins, manual 3D segmentation, 2 radiologists, 3D Slicer (https://www.slicer.org/), accessed on 23 May 2026 |
| Aymerich et al. [72] | whole tumor, manual 3D segmentation, 3 radiologists |
| Carlini et al. [73] | whole tumor + tumor’s zone of transition, manual 3D segmentation, multiple observers, D2PTM (‘DICOM to PRINT’; 3D Systems Inc., Rock Hill, SC, USA) |
| Yu et al. [74] | whole tumor, manual 3D segmentation, 3 observers, ITK-SNAP version 4.11.0 (www.itk-snap.Org, accessed on 23 May 2026) |
| Alhussaini et al. [75] | whole tumor, 2mm from tumor margins, manual 3D segmentation, Python + whole tumor, 3D semi-automated segmentation, 2 observers |
| Li et al. [76] | whole tumor, manual 3D segmentation, 2 radiologists |
| Li et al. [77] | whole tumor, manual 3D segmentation, 2 observers, 3D Slicer (version 4.10.2, https://www.slicer.Org, accessed on 23 May 2026) |
| Jaggi et al. [78] | Radiomic Biopsy: a spherical sample, or a cluster of connected spherical samples, of a Volume of Interest, Fovia’s FAST (Fovia Inc., Palo Alto, CA, USA) |
| Li et al. [79] | whole tumor, manual 3D segmentation, 2 radiologists, RadCloud (Big Data Intelligent Analysis Cloud Platform, Huiying Medical Technology Co., Ltd., Beijing, China) |
| Yu et al. [80] | 10 consecutive axial slices (tumor mid-portion), manual 3D segmentation |
| Study | Extracted Features | Feature Selection | Model Training | Classification Results | AUC (±SD OR 95% CI) |
|---|---|---|---|---|---|
| Ye et al. [70] | 2260 tumoral + 6780 peritumoral RFs: shape, texture, first-order, LoG, GLCM, GLRLM, GLSZM, NGTDM, GLDM + exponential, gradient, square, wavelet transforms, PyRadiomics | reproducibility analysis + statistical tests + LASSO | SVM | radiomics | 0.900 (0.792–1.00) |
| Yang et al. [71] | 1278 RFs: first-order, shape, texture (GLCM, GLSZM, GLRLM, NGTDM, GLDM), wavelet, LοG, PyRadiomics | reproducibility + correlation analysis + LASSO | LR | radiomics | 0.84 (0.69–0.99) |
| nomogram | 0.93 (0.83–1.00) | ||||
| Aymerich et al. [72] | 105 RFs: shape, first-order, GLCM, GLRLM, GLSZM, NGTDM, Quibim Precision 2.8 (Quibim S.L., Valencia, Spain) | reproducibility + correlation analysis + statistical tests | LR, RF, SVM | radiomics: LR | 0.75 (0.55–1.00) |
| Carlini et al. [73] | 2436 RFs: 2D, 3D, Laplacian, wavelet (CMP), PyRadiomics | genetic algorithm | DT | radiomics: ZOT features, feature selection + whole data set | 0.87 ± 0.09 |
| Yu et al. [74] | 396 RFs/phase: histogram, texture, GLCM | reproducibility analysis + mRMR + LASSO | SVM | clinical model | 0.630 (0.240–1.000) |
| nomogram | 0.950 (0.850–1.000) | ||||
| Alhussaini et al. [75] | 204 original: first-order, GLCM, GLRLM, GLSZM, NGTDM, GLDM, shape + 3.180 filtered: wavelet, LoG, square, logarithm, square-root, gradient exponential, LBP 2D/3D PyRadiomics Python version 3.6.1 | LASSO | RF, SVM, LR, kNN, NB | signature: whole tumor volume + RF | 1.00 ± 0.000 |
| Li et al. [76] | 851 RFs/phase: 107 original + 744 wavelet-filtered, 3D Slicer (Pyradiomics v. 2.2.0, accessed on 23 May 2026) | reproducibility analysis + statistical testes + LASSO | LR | clinical model | 0.895 (0.796–0.993) |
| radiomics | 0.957 (0.904–1.000) | ||||
| nomogram | 0.988 (0.966–1.000) | ||||
| Li et al. [77] | 2553 RFs | reproducibility analysis + statistical tests + LASSO | LR | clinical model | 0.761 (0.609–0.913( |
| radiomics | 0.842 (0.684–0.999) | ||||
| nomogram | 0.898 (0.791–1.000) | ||||
| Jaggi et al. [78] | 6.206 RFs: intensity, texture, quantitative image feature engine | reproducibility analysis + mRMR | RF + adaBoost | radiomics | 0.71 ± 0.024 |
| Li et al. [79] | 1029 RFs/phase: intensity, shape, texture (GLCM, GLRLM, GLSZM), high-order (Laplacian, exponential, logarithmic, square, square root, wavelet), RadCloud (Big Data Intelligent Analysis Cloud Platform, Huiying Medical Technology Co., Ltd., Beijing, China) | LASSO + statistical tests | kNN, SVM, RF, LR, MLP | radiomics: SVM, CMP + NP | 0.964 ± 0.054 |
| Yu et al. [80] | 43 texture features: histogram, GLCM, GLRL, GLG, Laws’ features, MATLAB-based (R2015b, Mathworks Inc., Natick, MA, USA) | SVM | SVM | radiomics: RO vs. RCC | 0.917(0.856–0.978) |
| radiomics: RO vs. chRCC | 0.882 (0.764–1.000) |
Disclaimer/Publisher’s Note: The statements, opinions and data contained in all publications are solely those of the individual author(s) and contributor(s) and not of MDPI and/or the editor(s). MDPI and/or the editor(s) disclaim responsibility for any injury to people or property resulting from any ideas, methods, instructions or products referred to in the content. |
© 2026 by the authors. Licensee MDPI, Basel, Switzerland. This article is an open access article distributed under the terms and conditions of the Creative Commons Attribution (CC BY) license.
Share and Cite
Koumpis, P.; Vartholomatos, E.; Romeo, E.; Alexiou, G.A.; Argyropoulou, M.I.; Tsili, A.C. CT-Based Radiomics in the Characterization of Solid Renal Tumors: A Systematic Review. Cancers 2026, 18, 1758. https://doi.org/10.3390/cancers18111758
Koumpis P, Vartholomatos E, Romeo E, Alexiou GA, Argyropoulou MI, Tsili AC. CT-Based Radiomics in the Characterization of Solid Renal Tumors: A Systematic Review. Cancers. 2026; 18(11):1758. https://doi.org/10.3390/cancers18111758
Chicago/Turabian StyleKoumpis, Petros, Eyrysthenis Vartholomatos, Eleni Romeo, George A. Alexiou, Maria I. Argyropoulou, and Athina C. Tsili. 2026. "CT-Based Radiomics in the Characterization of Solid Renal Tumors: A Systematic Review" Cancers 18, no. 11: 1758. https://doi.org/10.3390/cancers18111758
APA StyleKoumpis, P., Vartholomatos, E., Romeo, E., Alexiou, G. A., Argyropoulou, M. I., & Tsili, A. C. (2026). CT-Based Radiomics in the Characterization of Solid Renal Tumors: A Systematic Review. Cancers, 18(11), 1758. https://doi.org/10.3390/cancers18111758