


Simple Summary
Epithelial ovarian cancer (EOC) is the deadliest cancer of the female reproductive system because it is often diagnosed late and remains difficult to treat after it has spread. EOC cells commonly disseminate as multicellular clusters called spheroids, which promote survival in suspension, enhance resistance to stress and therapy, and support the formation of new tumors. Cells within spheroids rely on autophagy, a conserved survival pathway regulated by unc-51-like autophagy activating kinase 1 (ULK1). We previously showed that ULK1 contributes to EOC progression, with additional results suggesting it has important functions beyond the canonical role in autophagy initiation. Here, we investigated ULK1 function impacting mitochondrial homeostasis and metabolism in EOC spheroids. We found that ULK1 regulates mitochondrial degradation through mechanisms that may be uncoupled from canonical autophagy, while ULK1 loss remodels spheroid energy metabolism. Finally, combined inhibition of ULK1 using DCC-3116 and oxidative phosphorylation using metformin showed potential enhanced therapeutic efficacy, revealing new opportunities to target advanced EOC.
Abstract
Background/objectives: Epithelial ovarian cancer (EOC) is the deadliest gynaecologic malignancy, largely due to late-stage diagnosis and ineffective therapy. EOC commonly spreads through the peritoneal cavity as multicellular spheroids, which are metastatic structures that enhance survival under detachment stress, promote dissemination, and contribute to therapeutic resistance. We previously showed that ULK1, a serine/threonine kinase classically linked to macroautophagy initiation, supports EOC progression, suggesting non-canonical roles in spheroid biology and pathogenesis. Methods: CRISPR/Cas9 ULK1 knockout (ULK1KO) models were generated in OVCAR8, HEYA8, and ES2 cells. Mitochondrial degradation phenotypes were assessed in spheroids by immunoblotting and fluorescence microscopy. Label-free proteomics with bioinformatic pathway analysis identified ULK1-associated programs in EOC spheroids. Bioenergetic consequences were quantified using Seahorse ATP-Rate assays. Therapeutic interactions were evaluated using multi-dose combination matrices testing the ULK1 inhibitor DCC-3116 with metformin. Results: ULK1 modulated mitochondrial degradation in a cell-line-specific manner, either promoting or protecting against mitochondrial loss through mechanisms that were uncoupled from canonical autophagy machinery. Proteomic and bioinformatic analyses revealed significant alterations in mitochondria-related processes, aligning with emerging ULK1 functions in mitochondrial homeostasis. ULK1 loss broadly reduced OXPHOS complex proteins in EOC spheroids and consistently decreased hexokinase 2 (HK2), indicating coordinated metabolic remodeling. Seahorse profiling mirrored these shifts: OVCAR8 ULK1KO spheroids showed reduced OCR and ATP production, whereas HEYA8 and ES2 ULK1KO spheroids exhibited increased mitochondrial ATP production. Combination matrices showed potential synergy between DCC-3116 and metformin. Conclusions: These data show that ULK1 differentially regulates mitochondrial degradation across EOC spheroid models through potential mechanisms alternative to canonical autophagy machinery, while reshaping spheroid metabolism and revealing potential therapeutic vulnerabilities in advanced EOC.
1. Introduction
Epithelial ovarian cancer (EOC) ranks as the most lethal gynaecological cancer in developed countries, primarily due to its late-stage diagnosis and the ineffectiveness of treatments for chemo-resistant disease [1]. Standard treatment typically involves cytoreductive surgery and platinum–taxane combination chemotherapy, with maintenance approaches such as PARP inhibitors and/or bevacizumab used in selected patients. Despite these advances, many patients relapse, highlighting the need to identify stress-adaptive pathways that support EOC persistence and therapeutic resistance [2]. EOC typically spreads by the direct dissemination of tumor cells into the peritoneal cavity [2,3], where they aggregate to form spheroids [4]. These spheroids are central to the metastatic process, as they exhibit increased adhesion and invasion abilities, and resist cytotoxic chemotherapy [5,6]. In addition, spheroids undergo various phenotypic changes, such as the induction of autophagy [7,8]. Autophagy is a well-preserved and tightly controlled metabolic degradation process, where proteins and organelles are broken down in the lysosome [9,10]. This process releases lysosome-derived metabolic by-products, including amino acids and other molecules, which provide nutrients and energy to support essential cellular functions during nutrient scarcity or metabolic stress [11,12]. Autophagy occurs at low basal levels to maintain cellular homeostasis but is rapidly upregulated in response to stress [13]. The serine/threonine kinase ULK1 (Unc-51-like kinase 1) is recognized as the primary regulator of autophagy, responding to upstream signals about nutrient and energy availability to trigger the autophagic process. In nutrient-abundant conditions, Mechanistic Target of Rapamycin Complex 1 (mTORC1) phosphorylates ULK1, thus restraining its activity and autophagy initiation. Conversely, the absence of nutrients leads to mTORC1 deactivation and ULK1 dephosphorylation, while AMPK (AMP-activated protein kinase) phosphorylates and activates ULK1 [9]. Consequently, ULK1 and autophagy are essential in maintaining cellular equilibrium by eliminating impaired proteins and organelles and preserving intracellular energy supplies to meet the demands of the cell [13]. Because mitochondria both fuel cellular energetics and generate damaging ROS (reactive oxygen species), ULK1’s control of autophagy and related pathways can directly determine mitochondrial homeostasis.
To maintain mitochondrial homeostasis and energy metabolism, cells have developed several quality control mechanisms, including catabolic pathways such as mitophagy, but also mitochondrial biogenesis [14]. Mitophagy, a specific type of macroautophagy, is one such mechanism that selectively eliminates dysfunctional or damaged mitochondria [15,16]. Mitochondria adapt to meet cellular energy and physiological demands through continuous fission and fusion processes [17]. Increased respiratory activity and ROS production lead to mitochondrial damage, triggering mitophagy [18,19]. Indeed, ULK1 is upregulated in response to mitophagy, translocating to fragmented mitochondria through receptor-mediated interactions between autophagic machinery and mitochondria [20,21,22,23], while it can also balance cellular reliance on glycolysis and mitochondrial metabolism [24,25]. Mitochondria play a critical role in cellular metabolism and overall physiological function, with mitochondrial damage linked to a wide range of diseases. Dysfunctions in mitochondrial degradation can disturb cellular balance, potentially leading to tumor development, illustrating the intricate relationship between mitochondria, autophagy, and the onset and progression of cancer. Mitochondria are pivotal in cancer, contributing significantly to the invasiveness and metastatic traits of tumors [15].
We have previously identified that ULK1 is required for autophagy initiation and mediates metastatic progression in EOC, contributing to spheroid invasion, survival, and tumour growth, highlighting its canonical and non-canonical functions [8]. Additionally, label-free proteomic mass spectrometry and bioinformatic analysis revealed significant alterations in pathways and processes related to mitochondria, including oxidative phosphorylation (OXPHOS), electron transport chain, and mitochondrial gene expression. This aligns with recent studies that have uncovered new ULK1 functions in mitochondrial homeostasis [22,26,27,28]. We have previously observed that EOC spheroids display varied patterns in the regulation of mitochondrial dynamics, including fission, fusion, and mitophagy [29], and have increased OXPHOS protein expression relative to adherent cells [30]. However, few studies have investigated ULK1-mediated mitochondrial homeostasis in EOC spheroids. Building on our prior work investigating the role of ULK1 in EOC progression, we aimed to elucidate non-canonical functions of ULK1 that may contribute to EOC metastasis and uncover additional therapeutic vulnerabilities in the absence of ULK1.
2. Materials and Methods
2.1. Antibodies and Reagents
Antibodies against ULK1 (#8054S), LC3B (#2775S), Beclin1 S30 (#5410S), Beclin1 (#3738S), ATG5 (#2630S), ATG7 (#8558S), VDAC (#4662S), PINK1 (#6946S), and the Glycolysis Antibody Sampler Kit (#8337) were purchased from Cell Signaling Technology (Danvers, MA, USA). Total OXPHOS Rodent WB Antibody Cocktail (ab410113) and mCherry (ab167453; 1:500) were purchased from Abcam (Cambridge, UK). Anti-actin antibody (A2066; 1:25,000) was purchased from Millipore (Burlington, MA, USA). Antibodies against tubulin (T5168; 1:40,000) and vinculin (V9264; 1:25,000) were purchased from Sigma-Aldrich (Burlington, MA, USA). Horseradish peroxidase (HRP)-conjugated antibodies against mouse IgG (NA931; 1:10,000) and rabbit IgG (NA934; 1:10,000) were purchased from Cytiva (Malborough, MA, USA). Antibodies were diluted in tris-buffered saline-Tween 20 containing either 5% bovine serum albumin or non-fat milk 1:1000. Brefeldin A (#9972) and Chloroquine (#14774) were purchased from Cell Signaling Technology (Danvers, MA, USA). DCC-3116 (#HY-160699) and metformin (#HY-17471A) were purchased from MedChemExpress (Monmouth Junction, NJ, USA).
2.2. Generation of ULK1KO Cell Lines
Generation of OVCAR8-ULK1KO, HEYA8-ULK1KO, and ES2-ULK1KO cell lines has been previously described [8].
2.3. Cultured Cell Lines
The cell lines OVCAR8, OVCAR8-ULK1KO, HEYA8, and HEYA8-ULK1KO were grown in RPMI-1640 (#350-700 CL, Wisent (Saint-Jean-Baptiste, QC, Canada)), whereas ES2 and ES2-ULK1KO were grown in DMEM/F12 medium (#11320033, Thermo Fisher Scientific, Waltham, MA, USA). All growth media were supplemented with 10% fetal bovine serum. OVCAR8, HEYA8, and ES2 cells were procured from the American Type Culture Collection (ATCC; Manassas, VA, USA). Adherent cells were sustained on tissue culture-treated polystyrene (Sarstedt, Newton, NC, USA), and spheroids were maintained in Ultra-Low Attachment (ULA) cluster plates (Corning, NY, USA). All cell lines were authenticated through short tandem repeat analysis by the Center for Applied Genomics (The Hospital for Sick Children, Toronto, ON, Canada) and routinely examined for mycoplasma using a Universal Mycoplasma Detection Kit (30-1012K; ATCC; Manassas, VA, USA).
2.4. Plasmids
Parental and ULK1KO cells were transfected with either the mCherry-eGFP-LC3B autophagy or mCherry-eGFP-FIS1101–152 mitophagy-reporter plasmid. pBABE-puro mCherry-eGFP-LC3B was a gift from Jayanta Debnath (Addgene plasmid #22418; http://n2t.net/addgene:22418 (accessed on 10 March 2022); RRID:Addgene_22418) [31], while pBABE-puro.mCherry-eGFP-FIS1101–152 was obtained from the MRC PPU Reagents and Services facility (DU40799; University of Dundee). The mCherry-eGFP-LC3B cDNA was placed under control of a CMV promoter, as described in [29]. Briefly, mCherry-eGFP-LC3B cDNA was cloned into pcDNA3 to enable G-418 selection and CMV promoter-driven expression. Using the Q5 Site-Directed Mutagenesis Kit (New England Biolabs, E0554; Ipswich, MA, USA), the unique NgoMIV and SalI sites in pBABE-puro.mCherry-eGFP-LC3B were converted to HindIII and BamHI sites, respectively. Following confirmation by diagnostic digest, mCherry-eGFP-LC3B was excised with HindIII/BamHI and ligated into similarly digested pcDNA3 to generate pcDNA3.mCherry-eGFP-LC3B. Gel extractions were performed using the QIAEX II Gel Extraction Kit (Qiagen, 20021; Germantown, MA, USA) and ligations were performed using T4 DNA Ligase (New England Biolabs, M0202; Ipswich, MA, USA) according to the manufacturers’ protocols. After transfection, cells were selected in complete medium containing G-418 (400 μg/mL) for two weeks, cultured without G-418 for four additional weeks, and then sorted by FACS to isolate double-positive cells.
2.5. Preparation of Whole-Cell Lysates
For whole-cell protein analysis, adherent cells were seeded at 0.75–1 × 10⁶ cells in 10 mL medium in 10 cm dishes, while spheroid cells were seeded at 1–3 × 10⁶ cells in 15 mL medium in 35 mm ULA wells. Seeding densities were optimized to ensure sufficient protein yield for each cell line.
Adherent cells were washed twice with cold PBS and scraped into modified RIPA buffer containing 50 mM HEPES pH 7.4, 150 mM NaCl, 10% glycerol, 1.5 mM MgCl2, 1 mM EGTA, 1% Triton X-100, 0.1% SDS, 1 mM Na3VO4, 10 mM NaF, 1 mM PMSF, 1× SIGMAFAST protease inhibitor cocktail, and 10 mM beta-glycerophosphate. Spheroids were collected by centrifugation at 800× g for 4 min at 4 °C, washed twice with cold PBS, and lysed in modified RIPA buffer. Lysates were vortexed, subjected to one freeze–thaw cycle, and clarified by centrifugation at maximum speed for 20 min at 4 °C.
2.6. Immunoblot Analysis
Immunoblotting was performed using the Bio-Rad Mini-PROTEAN II Electrophoresis System according to the manufacturer’s guidelines, with in-house prepared gels made from 30% acrylamide/bis solution 37.5:1 (Bio-Rad, 1610158; Hercules, CA, USA). Densitometric analysis was performed using Image Lab 6.05 software.
2.7. SPoRTS Analysis
Time-course fluorescence images of mitoR and autoR spheroids were captured in the RFP and eGFP channels using an IncuCyte S3 live-cell analysis system, with exposure times of 400 ms and 300 ms, respectively. Spatial analyses of the RFP:eGFP ratio were performed using the profile method from the original SPoRTS workflow [32]. Default settings for SPoRTS were used for all analyses, except for “rmaps_compare_conditions” setting, which was set to “True”.
2.8. Transient Knockdown of ULK1, ATG5, and ATG7
Cells were seeded in 6-well plates (1.5 × 10⁵ cells/well) and transfected using DharmaFECT1 (1/500 final dilution) as per the manufacturer’s protocol (Dharmacon, Cat# T-2001; Lafayette, CO, USA) using a final total siRNA concentration of 10 nM. ULK1 (L-005049-00-0005), ATG5 (M-004374-04), and ATG7 (M-020112-01) ON-TARGETplus SMARTpool or ON-TARGETplus Non-targeting Pool (D-001810-10-20) were used (Dharmacon; Lafayette, CO, USA). Medium was aspirated 24 h after transfection, and 5 mL of fresh medium was added to each well. Cells were trypsinized, counted and seeded 48 h later for experiments.
2.9. MitoSOX
Cells were seeded in a 96-well round-bottom ULA plate at a density of 2000 cells per well in 100 μL of medium. After 72-h, cells were incubated with MitoSOX (#M36008, Thermo Fischer, Waltham, MA, USA) with a final dilution of 5 uM. Fluorescent images were captured in the IncuCyte S3 Live-Cell Analysis System (Sartorius, Oakville, ON, Canada). Analyses of whole-spheroid red fluorescence intensity were conducted using the intensity method described in the original version of SPoRTS [32].
2.10. Proteomic Mass Spectrometry
Protein extraction and mass spectrometry analysis were performed on OVCAR8 wild-type and OVCAR8-ULK1KO 24-h spheroids as previously described [8]. Pathway analysis was performed using gene set enrichment analysis (GSEA) [33], and KEGG [34] (http://bioinformatics.sdstate.edu/go/ (accessed on 18 February 2024)) and Reactome databases [35] (https://reactome.org (accessed on 18 February 2024)).
2.11. Seahorse XF Real-Time ATP Rate Assay
Agilent Seahorse XF Real-Time ATP Rate Assay (#103592-100, Santa Clara, CA, USA) was performed in the Seahorse XFe24 analyzer (#102238-100) according to the manufacturer’s protocols. Adherent cells were seeded at 200,000 cells/mL on Seahorse 24-well cell culture plates and allowed to grow for 24 h; spheroids were grown in 96-well ULA plates for 48 h, then 15 spheroids were combined per well of a Seahorse 24-well cell culture plate. Spheroid washing and data normalization were adapted from [36]. Cell number was estimated for adherent cells using Nt = N02t/Td, where N0 = 50,000 cells, from 250 μL of cells at 200,000 cells/mL, and Td = 48.85 h. Doubling time (Td) was averaged from previous studies [37,38].
2.12. Synergy Finder Analysis
Cells were seeded in 96-well round-bottom ULA plates at 2000 cells/well in 100 μL medium. Twenty-four hours after seeding, spheroids were treated with 96 combinations of DCC-3116 and metformin for 72 h. Cell viability was assessed by incubating spheroids with a 1:1 dilution of CellTiter-Glo (Promega, #G7572; Madison, WI, USA) for 60 min in the dark on a plate rocker. Well contents were then transferred to 96-well opaque white plates, and luminescence was measured using an Agilent BioTek Synergy H1 plate reader (Agilent Technologies, Mississauga, ON, Canada). Normalized data were formatted according to the SynergyFinder user manual (https://synergyfinder.aittokallio.group/synfin_docs/ (accessed on 3 December 2025)) and analyzed on the SynergyFinder platform using the ZIP Synergy Score model [39,40].
2.13. Statistical Analysis
Statistical analyses were performed using GraphPad Prism 10 (GraphPad Software) and the details for specific statistical tests are described in each figure legend.
3. Results
3.1. ULK1 Deficiency Impacts Mitochondrial Degradation
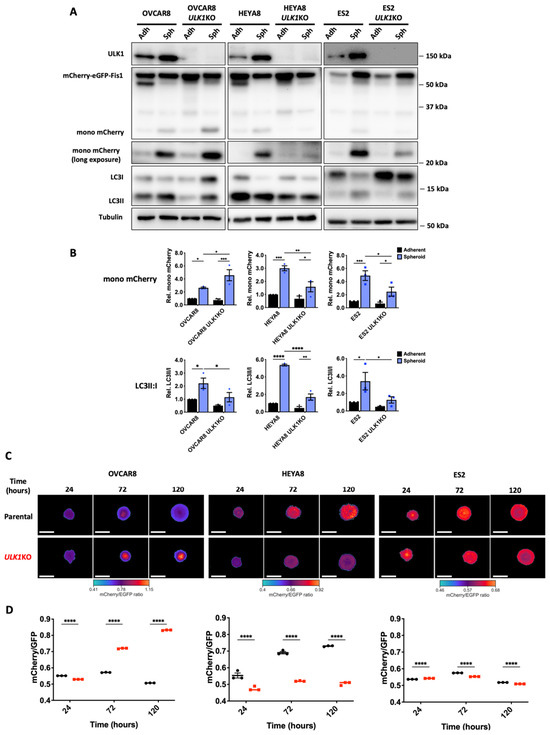
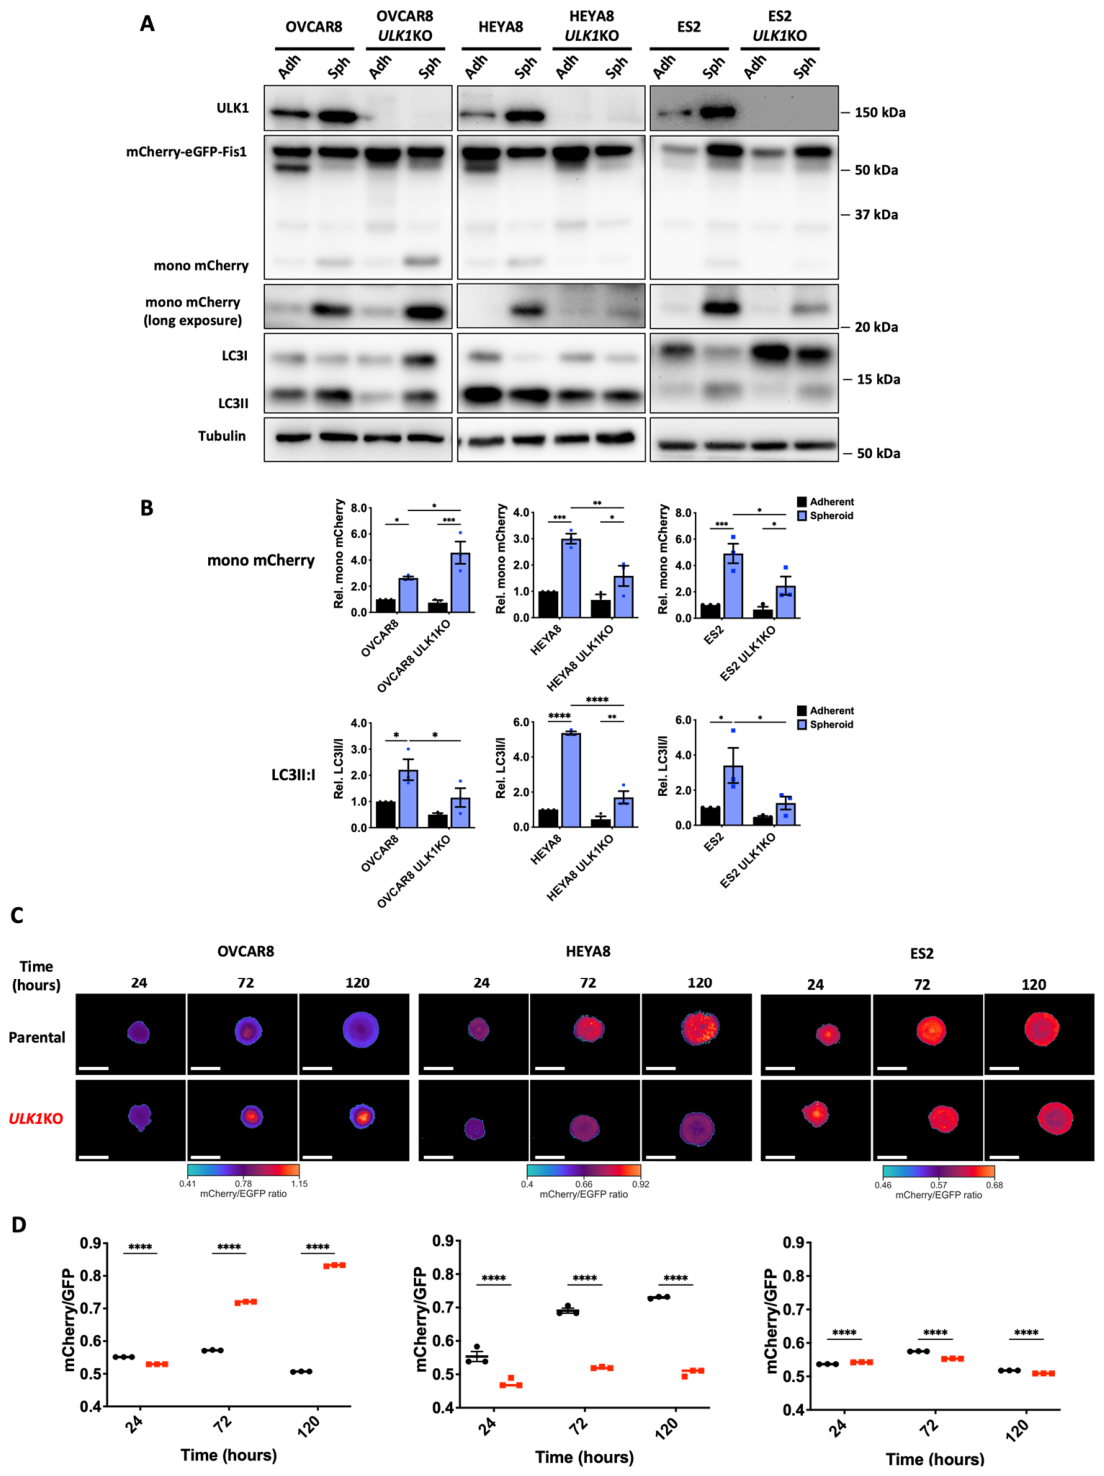
Beyond its well-characterized role in initiating macroautophagy under nutrient deprivation, ULK1 is a critical regulator of selective autophagy, facilitating the targeted clearance of damaged or excess organelles, including mitochondria via mitophagy. We have previously observed spatial and temporal differences in autophagy and mitophagy in EOC spheroids [29]; thus, we sought to assess the role of ULK1 in regulating mitophagy in this context. To assess mitophagy in EOC spheroids, we used a mitochondria-targeted mCherry-eGFP-FIS1101–152 reporter [41]. In this system, eGFP is quenched in acidic autolysosomes while mCherry remains stable, allowing detection of mitochondrial delivery to these degradative compartments. Molecular analysis via immunoblotting demonstrated increased monomeric mCherry and the LC3II:I ratio in parental EOC cell line spheroids, consistent with both autophagy and mitophagy activation. By contrast, ULK1 loss produced cell line-specific effects: OVCAR8 ULK1KO spheroids showed a further rise in mono-mCherry, whereas HEYA8 ULK1KO and ES2 ULK1KO spheroids displayed significant decreases in mono-mCherry, even though ULK1-deficient lines were autophagy-impaired (Figure 1A,B). Live-cell fluorescence imaging revealed an elevated mCherry/eGFP ratio in OVCAR8 ULK1KO spheroids, yet a reduced ratio in HEYA8 and ES2 ULK1KO spheroids beyond 72 h (Figure 1C,D). Together, these data indicate that ULK1 may differentially control mitochondrial degradation among these EOC cell line models; intriguingly, mitochondrial clearance may proceed despite impaired canonical autophagy, pointing to potential ULK1-dependent, autophagy-independent mitochondrial degradation mechanisms.
Figure 1.
ULK1 deficiency exhibits cell-line-specific impacts on mitochondrial degradation. (A) OVCAR8, HEYA8, and ES2 parental and ULK1KO cells were seeded in adherent and spheroid culture. Protein lysates were harvested 72 h after seeding for Western blot analysis of mono-mCherry and LC3. (B) Densitometric analysis of mono-mCherry (mono-mCherry/(mono-mCherry + mCherry-eGFP-FIS1101–152)) and LC3II:I relative to expression in parental adherent conditions (N = 3). Data displayed as mean ± SEM; two-way ANOVA followed by Šidák’s multiple comparisons test, * p < 0.05, ** p < 0.01, *** p < 0.001, **** p < 0.0001. (C) Representative heatmaps generated with SPoRTS (Spatial Profiling of Ratiometric Trends in Spheroids) from paired mCherry and eGFP images of OVCAR8, HEYA8, and ES2 parental and ULK1KO-mitoR spheroids. Per-pixel mCherry/eGFP ratios are displayed on a common color scale (warm colors = higher ratio), providing spatial visualization of mitochondrial delivery to acidic compartments. Images were processed with identical analysis settings; color bars indicate the ratio range (N = 3, with at least 6 technical replicates per biological replicate). Scale bar, 400 µm. (D) Quantification of reporter activity as mCherry/eGFP ratio over time (24–168 h in suspension) across the entire spheroid. Black and red symbols reflect parental and ULK1KO spheroids, respectively. Data displayed as mean ± SEM (N = 3, with at least 8 technical replicates per biological replicate); multiple Student’s t-test, **** p < 0.0001. Original western blots are presented in File S1.
3.2. ULK1 Differentially Regulates Mitochondrial Degradation Through Mechanisms Uncoupled from ATG5/7-Dependent Autophagic Flux
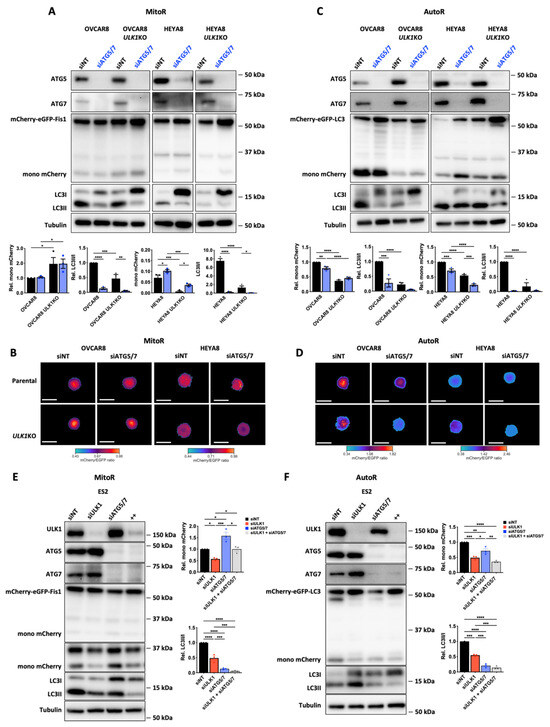
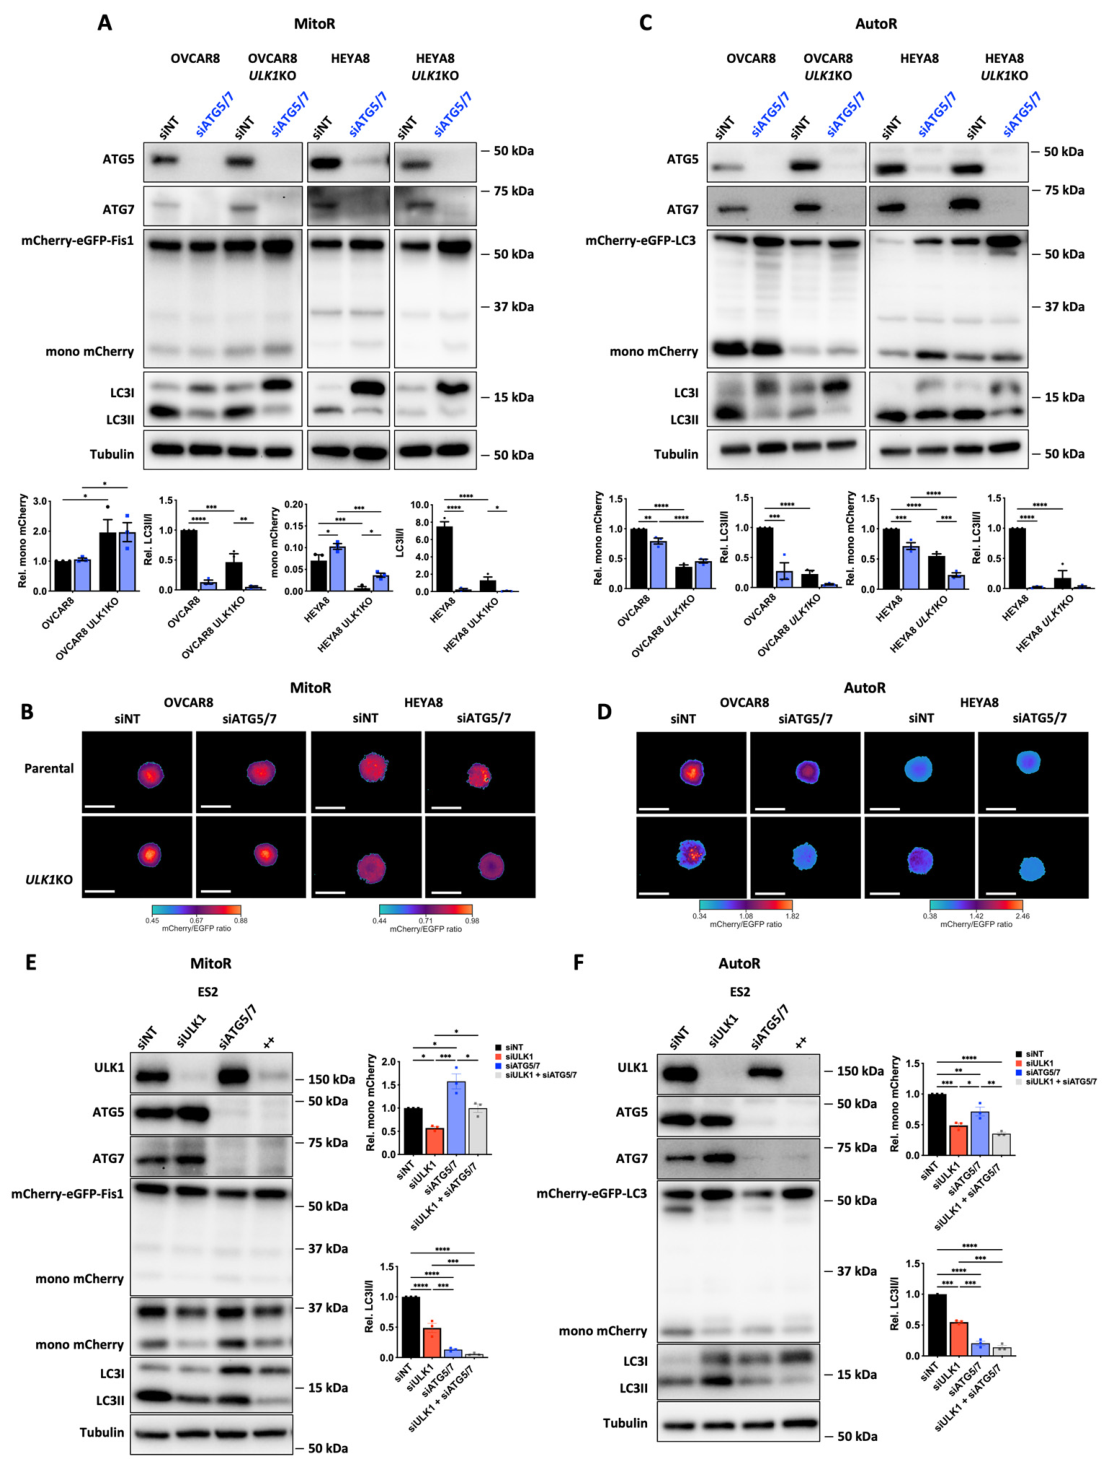
To test whether ULK1-associated changes in mitochondrial degradation depend on core autophagy machinery, we further utilized our cells expressing mCherry-eGFP-FIS1101–152 by performing knockdown of ATG5 and ATG7 in parental and ULK1KO cells. In OVCAR8 ULK1KO spheroids, the increase in mono-mCherry persisted despite ATG5/7 knockdown, suggesting that ULK1 normally restrains mitochondrial degradation in this model, while the enhanced degradation caused by ULK1 loss can occur independently of ATG5/7-mediated canonical autophagy (Figure 2A). In contrast, ULK1 loss in HEYA8 and ES2 spheroids decreased mitochondrial degradation as seen with mono-mCherry levels, indicating that ULK1 supports mitochondrial turnover in these models. However, ATG5/7 knockdown paradoxically enhanced mitochondrial degradation, suggesting that canonical autophagy may act to preserve mitochondria in this context. Among all cell lines, siATG5/7 significantly decreased LC3II:I alone and with ULK1 loss, confirming impaired autophagy activation. Live-cell imaging of parental and ULK1KO-mitoR spheroids deficient for ATG5 and ATG7 phenocopied these molecular readouts (Figure 2B). To confirm that macroautophagy was being affected, we repeated key perturbations in matched autophagy reporter lines (mCherry-eGFP-LC3B) by immunoblot. As expected, ULK1KO and siATG5/7 both decreased mono-mCherry and LC3II:I in EOC cell lines (Figure 2C,D), confirming that our genetic tools directly impair autophagic flux. In contrast, these same genetic perturbations exerted divergent effects on mitochondrial degradation as indicated using analogous dual fluorescence mitophagy-reporter cell lines, indicating that ULK1 can differentially modulate mitochondrial degradation through mechanisms that may be uncoupled from ATG5/7-dependent canonical autophagy.
Figure 2.
ULK1 regulates mitochondrial degradation independently of ATG5/7-mediated autophagy. Western blot analysis of OVCAR8 and HEYA8 (parental and ULK1KO) (A) mitophagy-reporter and (C) autophagy-reporter cells transfected with non-targeting siRNA (siNT), siATG5/7, and siULK1. Cells were transfected in adherent conditions for 48 h before trypsinizing, counting, and seeding in spheroid culture. Protein lysates were collected 72 h after seeding in spheroid culture. Densitometric analysis of mono-mCherry (mono-mCherry/(mono-mCherry + mCherry-eGFP-FIS1)) and LC3II:I relative to expression in siNT conditions (N = 3). Black and blue symbols reflect siNT and siATG5/7 conditions, respectively. Data displayed as mean ± SEM; two-way ANOVA followed by Šidák’s multiple comparisons test, * p < 0.05, ** p < 0.01, *** p < 0.001, **** p < 0.0001. Representative heatmaps generated with SPoRTS (Spatial Profiling of Ratiometric Trends in Spheroids) from paired mCherry and eGFP images of (B) mitophagy-reporter and (D) autophagy-reporter spheroids under siNT or siATG5/7 conditions. Per-pixel mCherry/eGFP ratios are displayed on a common color scale (warm colors = higher ratio), providing spatial visualization of mitochondrial delivery to acidic compartments. Images were processed with identical analysis settings; color bars indicate the ratio range (N = 3, with at least 6 technical replicates per biological replicate). Scale bar, 400 µm. Western blot analysis of ES2 (E) mitophagy-reporter and (F) autophagy-reporter cells transfected with non-targeting siRNA (siNT), siATG5/7, siULK1, or the combination (siULK1 + siATG5/7) as indicated. Cells were transfected in adherent conditions for 48 h before trypsinizing, counting, and seeding in spheroid culture. Protein lysates were collected 72 h after seeding in spheroid culture. Densitometric analysis of mono-mCherry (mono-mCherry/(mono-mCherry + mCherry-eGFP-FIS1)) and LC3II:I relative to expression in siNT conditions (N = 3). Data displayed as mean ± SEM; two-way ANOVA followed by Šidák’s multiple comparisons test, * p < 0.05, ** p < 0.01, *** p < 0.001, **** p < 0.0001. Original western blots are presented in File S1.
To this point, these experiments have utilized EOC cell lines with stable genetic ablation of ULK1. To determine whether ULK1 loss affects mitochondrial degradation through acute changes rather than long-term adaptation, we performed transient ULK1 knockdown in ES2 mitophagy-reporter-expressing spheroids. Transient ULK1 knockdown significantly reduced mono-mCherry levels, phenocopying our ULK1KO data. Interestingly, ATG5/7 knockdown increased mono-mCherry levels as we observed already (Figure 2A,B), suggesting enhanced mitochondrial degradation, while combined siULK1 + siATG5/7 attenuated this effect. As expected, knockdown of either ULK1 or ATG5/7 or in combination significantly decreased LC3II:I, confirming impaired autophagic flux (Figure 2E). Importantly, repeating these knockdowns in matched ES2-autoR lines again showed that siULK1 and siATG5/7 (alone and combined) decreased mono-mCherry and LC3II:I (Figure 2F), reinforcing the idea that mitochondrial degradation occurs in parallel with autophagy due to ULK1-mediated regulation.
OVCAR8 ULK1KO spheroids possessed enhanced mitochondrial degradation that appeared to be autophagy independent. To determine if this degradation was still lysosome-dependent, we treated OVCAR8 mitoR-expressing spheroids with the lysosomotropic agent chloroquine (CQ) for 24 h and performed immunoblot analysis. Treatment with CQ significantly decreased mono-mCherry in parental spheroids, while attenuating the significant increase observed in ULK1KO spheroids (Supplementary Figure S1), supporting a lysosome-dependent mechanism for the mitochondrial degradation.
Given that enhanced mitochondrial degradation in OVCAR8 ULK1KO spheroids persisted despite ATG5/7 knockdown yet remained sensitive to CQ, we next asked whether altered vesicular trafficking could contribute to this phenotype. Reanalysis of our previous OVCAR8 ULK1KO spheroid proteomics [8] identified enrichment of protein secretion and Golgi-associated vesicle signatures, with ADP-ribosylation factor 1 (ARF1) among the most significantly enriched proteins within the Hallmark protein secretion gene set (Supplementary Figure S2A). Because brefeldin A (BFA) disrupts ARF-GEF/ARF-dependent Golgi and secretory trafficking [42], we treated OVCAR8-mitoR spheroids with BFA. BFA increased mono-mCherry accumulation in parental spheroids, partially phenocopying the enhanced mitochondrial reporter degradation observed in ULK1KO spheroids. BFA further increased mono-mCherry levels in ULK1KO spheroids, indicating that mitochondrial reporter degradation in this model remains responsive to pharmacological disruption of Golgi/secretory trafficking (Supplementary Figure S2B–D). Chloroquine attenuated the enhanced mono-mCherry signal observed in both ULK1KO and BFA-treated spheroids (Supplementary Figure S2E), supporting that this increased mitochondrial reporter processing remains lysosome-associated.
Collectively, these results suggest that ULK1 has the potential to either promote or protect against lysosomal-associated mitochondrial degradation in EOC spheroids, but neither process is affected by ATG5/7-mediated canonical autophagy. These findings support an important role for ULK1 in controlling mitochondrial homeostasis beyond its classical function in macroautophagy initiation.
3.3. ULK1-Mediated Mitochondrial Degradation Correlates with ROS Generation
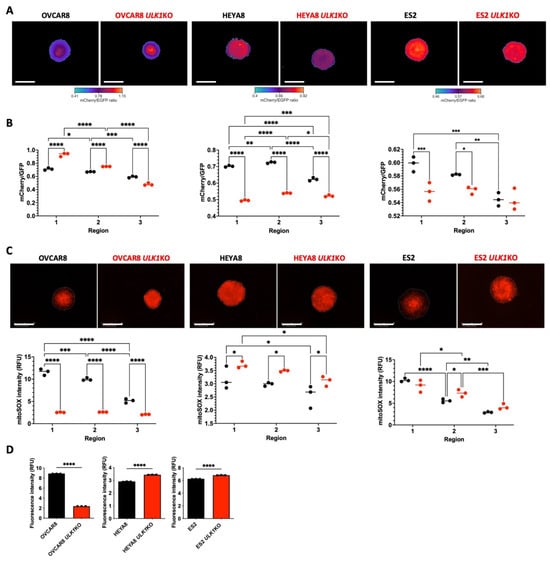
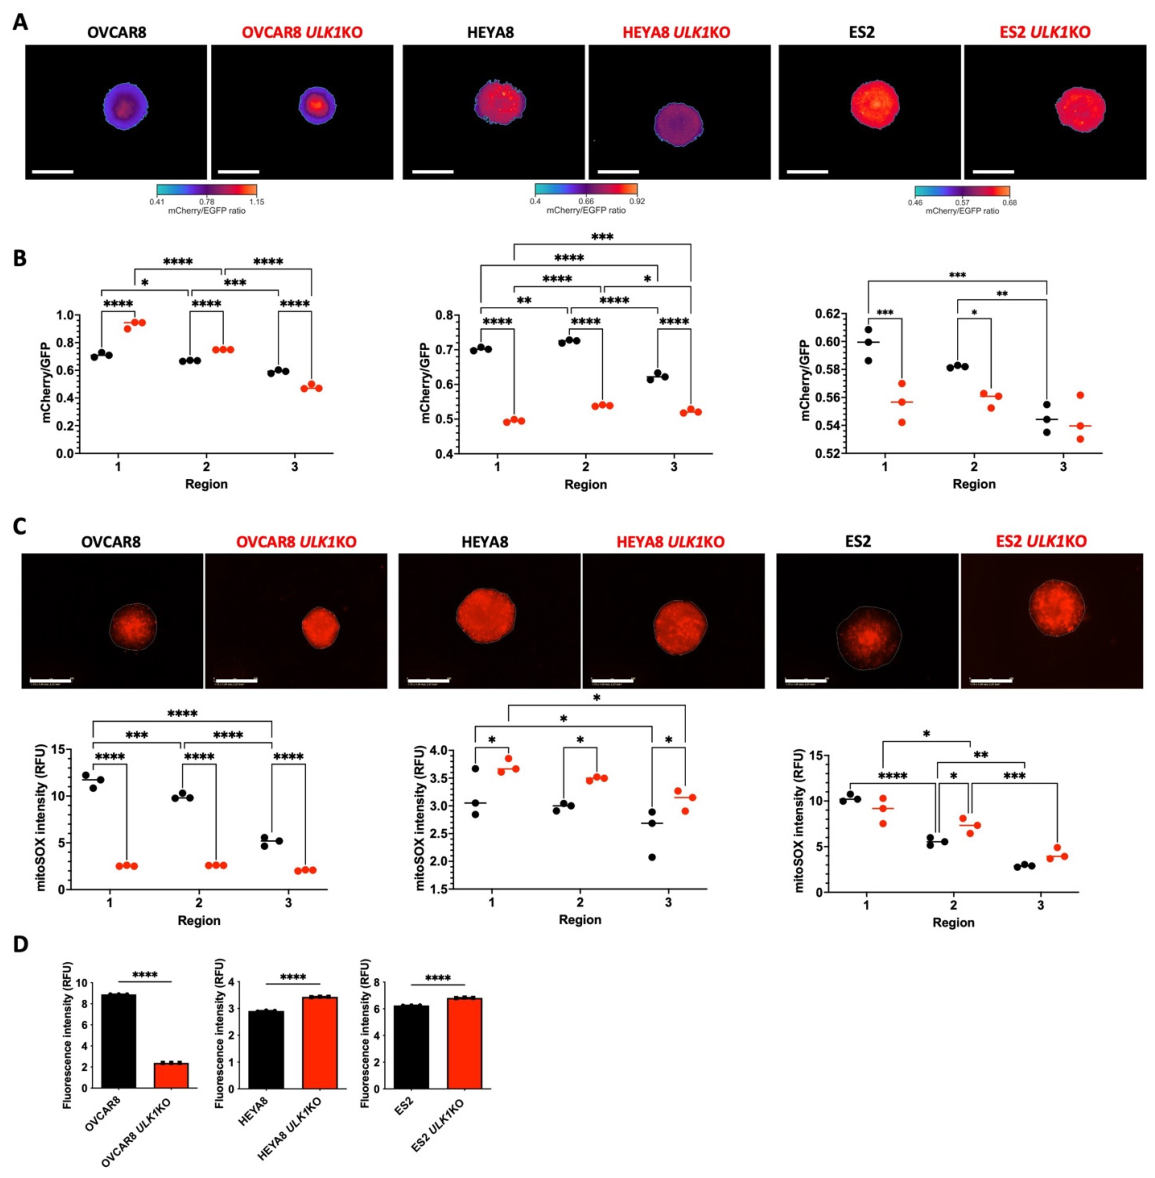
Given that mitochondria are a major source of reactive oxygen species (ROS), and mitochondrial degradation represents a fundamental homeostatic mechanism, we investigated whether the impact of ULK1 loss on mitochondrial degradation alters ROS production. Using our recently developed SPoRTS analysis [32] for spatio-temporal monitoring of fluorescence-based reporters, we assessed spatial patterns of mitochondrial degradation in EOC spheroids. In both OVCAR8 parental and ULK1KO spheroids, mitochondrial degradation was highest in the spheroid core, with ULK1KO spheroids showing significantly increased degradation. Similarly, HEYA8 and ES2 parental spheroids exhibited peak mitochondrial degradation in the core; however, HEYA8 ULK1KO spheroids displayed markedly reduced degradation across all spheroid regions, while degradation was reduced in core and intermediate regions in ES2 ULK1KO spheroids (Figure 3A,B).
Figure 3.
ULK1 and mitochondrial degradation status correlate with mitochondrial ROS. (A) Representative heatmaps generated with SPoRTS from paired mCherry and eGFP images of OVCAR8, HEYA8, and ES2 parental and ULK1KO mitophagy-reporter spheroids at 72 h (from Figure 1A). Per-pixel mCherry/eGFP ratios are displayed on a common color scale (warm colors = higher ratio), providing spatial visualization of mitochondrial delivery to acidic compartments. Images were processed with identical analysis settings; color bars indicate the ratio. Scale bar, 400 µm. (B) Spatial SPoRTS profiles of the mCherry/eGFP ratio plotted as a function of distance from the spheroid core (pixels). Data displayed as mean ± SEM (N = 3, with at least 8 technical replicates per biological replicate); two-way ANOVA followed by Šidák’s multiple comparisons test, * p < 0.05, ** p < 0.01, *** p < 0.001, **** p < 0.0001. (C) Parental and ULK1KO spheroids were cultured for 72 h, then incubated with MitoSOX (mitochondrial superoxide) for 12 h. Dotted line reflects spheroid border. Spatial mitoSOX profiles were quantified using SPoRTs and plotted as a function of distance from the spheroid core (pixels). Black and red symbols reflect parental and ULK1KO spheroids, respectively. Data reflect fluorescence intensity (RFU) and are displayed as mean ± SEM (N = 3, with at least 5 technical replicates per biological replicate). Two-way ANOVA followed by Šidák’s multiple comparisons test, * p < 0.05, ** p < 0.01, *** p < 0.001, **** p < 0.0001. Scale bar, 400 µm. (D) Average mitoSOX intensity in spheroids at 72 h. Data displayed as mean ± SEM (N = 3, with at least 8 technical replicates per biological replicate); Student’s t-test, **** p < 0.0001.
We next examined whether changes in mitochondrial degradation corresponded with alterations in mitochondrial ROS levels using mitoSOX fluorescence measurements. The spatial distribution of mitochondrial ROS showed partial correspondence with mitochondrial degradation patterns among cell line models. OVCAR8 parental and ULK1KO spheroids maintained similar mitochondrial ROS spatial distributions, with elevated levels concentrated in the core relative to the periphery. However, OVCAR8 ULK1KO spheroids exhibited significantly reduced mitochondrial ROS levels across all regions compared to parental spheroid controls. In contrast, both HEYA8 and ES2 parental spheroids demonstrated elevated mitochondrial ROS in core regions, but with distinct ULK1-dependent alterations. HEYA8 ULK1KO spheroids showed elevated mitochondrial ROS levels throughout the entire spheroid, while ES2 ULK1KO spheroids exhibited increased mitochondrial ROS specifically in intermediate regions between the core and periphery (Figure 3C). Overall, OVCAR8 ULK1KO spheroids exhibited significantly lower global mitochondrial ROS than parental cells, whereas HEYA8 and ES2 ULK1KO spheroids showed significantly higher global mitochondrial ROS relative to their respective parental counterparts (Figure 3D). Together, these data show that ULK1-dependent changes in mitochondrial degradation are accompanied by corresponding alterations in mitochondrial ROS, supporting an association between mitochondrial turnover and ROS status.
3.4. ULK1 Regulation of Energy Metabolism
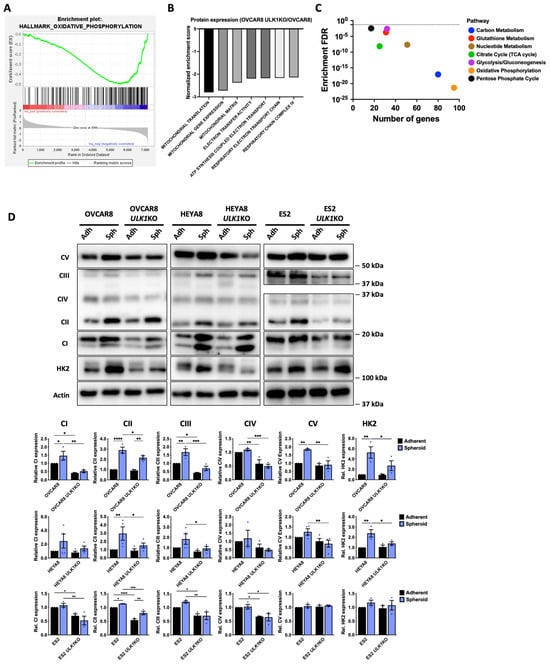
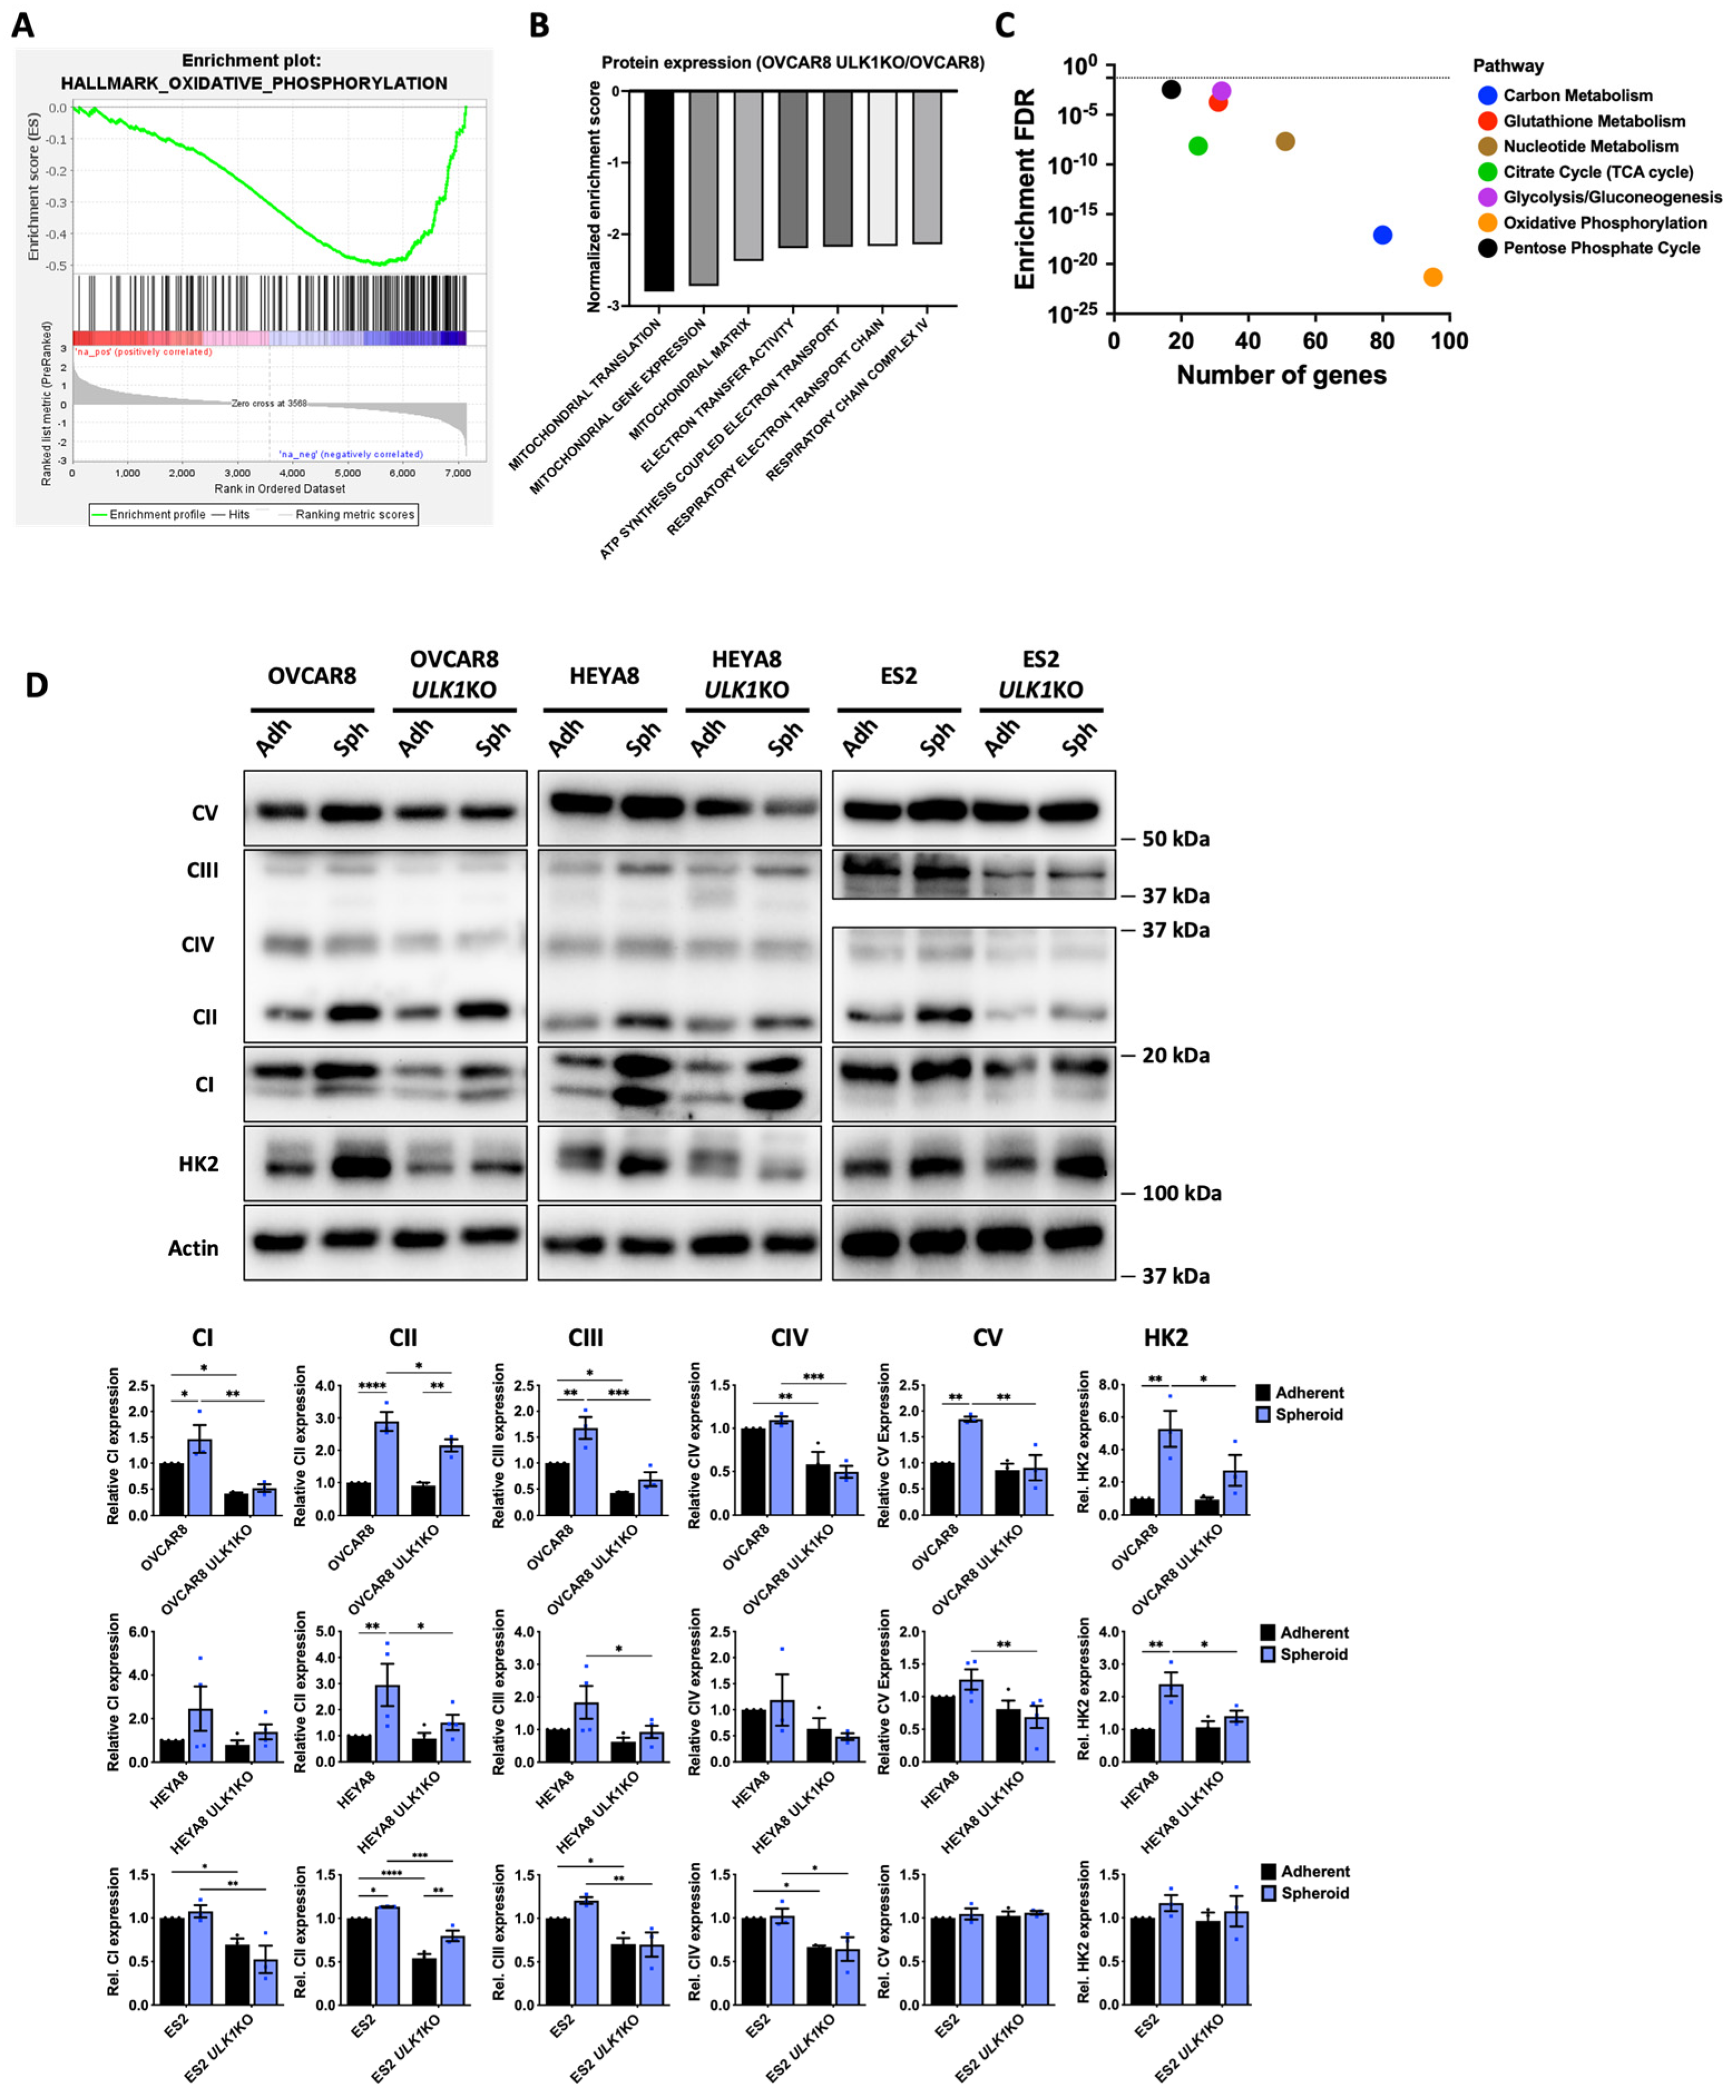
Analysis of previously generated label-free protein mass spectrometry of OVCAR8 and OVCAR8 ULK1KO spheroids [8] revealed striking decreases in signatures related to oxidative phosphorylation (OXPHOS) and numerous mitochondrial and metabolic processes in OVCAR8 ULK1KO spheroids (Figure 4A–C). To validate these findings, and to test whether ULK1 loss carries metabolic consequences, we first assessed the protein abundance of five representative OXPHOS complex subunits by immunoblot. Several OXPHOS complexes were significantly reduced under both adherent and spheroid conditions among all three ULK1KO lines. Notably, complex V (ATP synthase), essential for ATP production [43], was decreased in OVCAR8 and HEYA8 ULK1KO spheroids. Complexes I and IV were reduced in OVCAR8 and ES2 ULK1KO spheroids, while reductions in complexes II and III were observed among all three EOC cell line ULK1KO spheroid conditions. To further assess mitochondrial protein abundance, we examined outer mitochondrial membrane proteins: TOM20 was significantly reduced in OVCAR8 and ES2 ULK1KO spheroids, while VDAC was significantly reduced across all ULK1KO spheroid models (Supplementary Figure S3A,B). Because ULK1 perturbation has been reported to shift cells between glycolysis and OXPHOS in a cell-line-specific manner [24,25], we also examined a subset of representative glycolytic proteins (Figure 4D; Supplementary Figure S4A). Among all three EOC ULK1KO spheroids, hexokinase-2 (HK2), the rate-limiting enzyme of glycolysis, was the only glycolytic enzyme significantly decreased by both immunoblot (Figure 4D; Supplementary Figure S4A) and proteomics (Supplementary Figure S4B), with no consistent changes observed for other glycolysis components.
Figure 4.
ULK1 loss remodels OXPHOS protein expression in EOC spheroids. (A) GSEA Hallmarks, (B) GSEA Biological Processes, and (C) KEGG pathway analysis revealed altered metabolism and mitochondrial processes in EOC ULK1KO spheroids, including oxidative phosphorylation. Dotted line reflects an FDR of 0.05. (D) OVCAR8, HEYA8, and ES2 parental and ULK1KO cells were seeded in adherent and spheroid culture. Protein lysates were harvested 72 h after seeding for Western blot analysis for oxidative phosphorylation complex proteins and glycolysis proteins (HK2). Densitometric analysis of oxidative phosphorylation complex (CV, CIII, CIV, CII, CI) and HK2 relative to expression in parental adherent conditions. Data displayed as mean ± SEM; two-way ANOVA followed by Šidák’s multiple comparisons test (N = 3–4 biological replicates), * p < 0.05, ** p < 0.01, *** p < 0.001, **** p < 0.0001. Original western blots are presented in File S1.
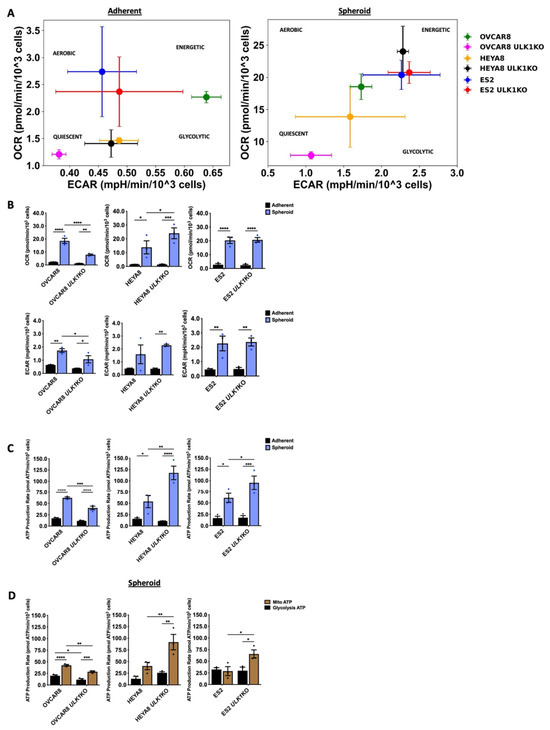
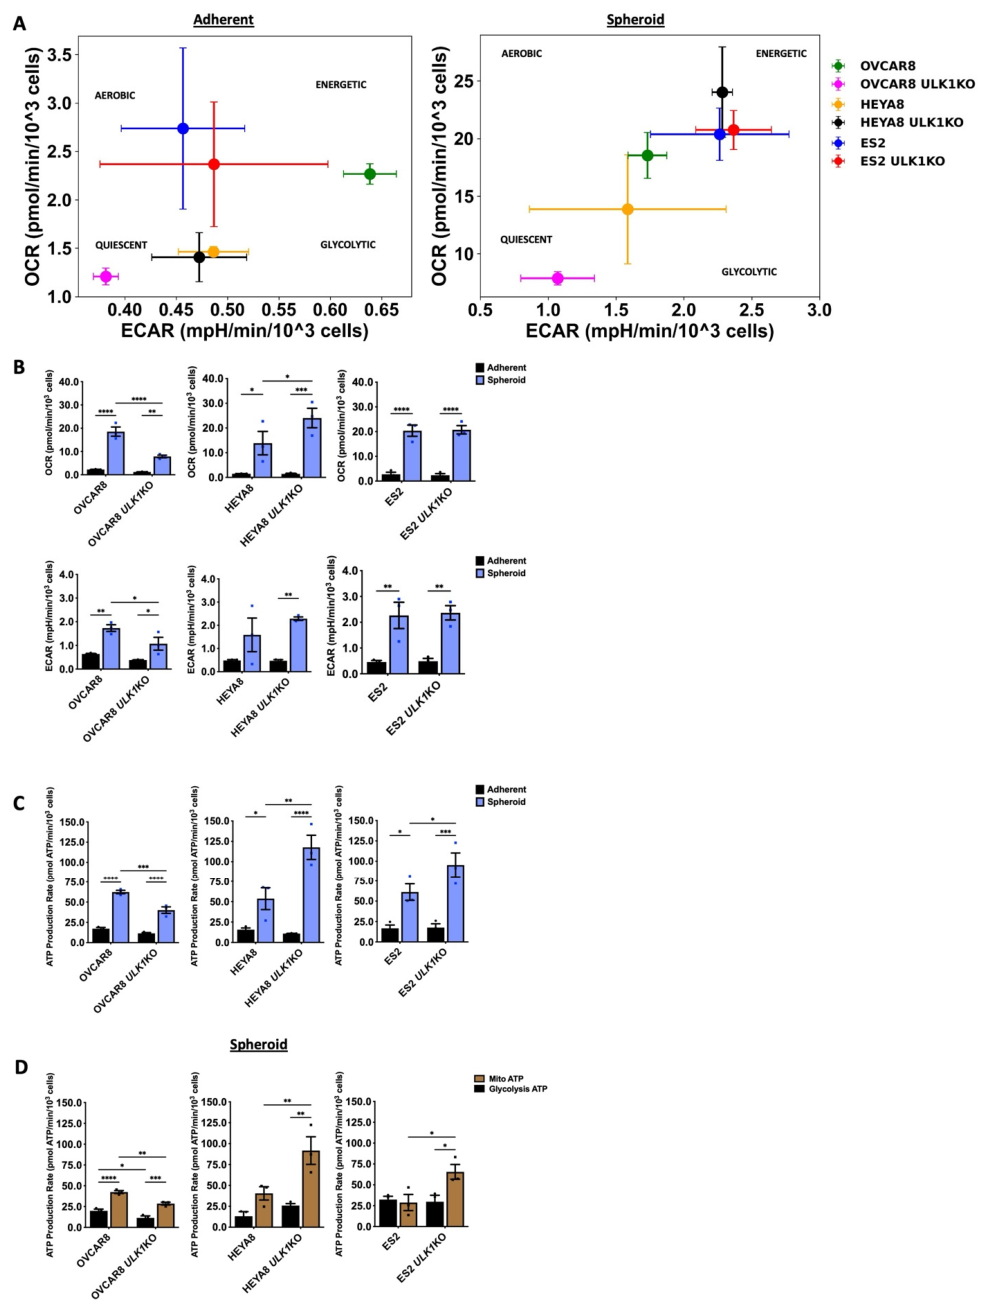
Next, we performed Seahorse ATP Rate Assays to assess ULK1 loss effects on ATP production and net OXPHOS and glycolysis rates. Relative to adherent culture, spheroids showed higher OCR and ECAR overall. OVCAR8 ULK1KO spheroids displayed reduced OCR and ECAR, HEYA8 ULK1KO spheroids showed increased OCR with unchanged ECAR, but ES2 ULK1KO spheroids exhibited no change in both OCR and ECAR (Figure 5A,B). As a net result, ATP production rate was significantly reduced in OVCAR8 ULK1KO spheroids, while this was increased in both HEYA8 and ES2 ULK1KO spheroids (Figure 5C). These changes aligned with mitochondrial-derived ATP production, which was decreased in OVCAR8 ULK1KO yet increased in HEYA8 and ES2 ULK1KO spheroids (Figure 5D). Collectively, ULK1 loss remodels EOC spheroid metabolism, producing broad reductions in OXPHOS complex expression, altered mitochondrial membrane protein marker abundance, and selective loss of HK2. However, the functional consequences of these changes were not uniform, indicating that ULK1 loss reshapes mitochondrial and metabolic homeostasis differently across ovarian cancer spheroid models.
Figure 5.
ULK1 loss rewires bioenergetics in EOC spheroids. (A) OCR–ECAR phenograms for adherent (left) and spheroid (right) cultures. Basal oxygen consumption rate (OCR; pmol/min/103 cells) and extracellular acidification rate (ECAR; mpH/min/103 cells) are plotted as mean ± SEM (error bars) for each line (color-coded legend). Quadrants denote bioenergetic states (Aerobic, Energetic, Glycolytic, Quiescent) as determined by Agilent Seahorse XF Real-Time ATP Rate Assay software (S7888-10012, Agilent Technologies). (B) OCR and ECAR values for EOC cells in adherent vs. spheroid culture. Data displayed as mean ± SEM (N = 3); two-way ANOVA followed by Šidák’s multiple comparisons test, * p < 0.05, ** p < 0.01, *** p < 0.001, **** p < 0.0001. (C) Total ATP production rate (pmol ATP/min/103 cells) in adherent and spheroid conditions was derived using the Agilent Seahorse XF Real-Time ATP Rate Assay Kit. Data displayed as mean ± SEM (N = 3); two-way ANOVA followed by Šidák’s multiple comparisons test, * p < 0.05, ** p < 0.01, *** p < 0.001, **** p < 0.0001. (D) Partitioning of ATP production rate (pmol ATP/min/103 cells) into mitochondrial ATP and glycolytic ATP in spheroid conditions. Data displayed as mean ± SEM (N = 3); two-way ANOVA followed by Šidák’s multiple comparisons test, * p < 0.05, ** p < 0.01, *** p < 0.001, **** p < 0.0001.
3.5. Therapeutic Potential of Targeting ULK1 and OXPHOS in EOC
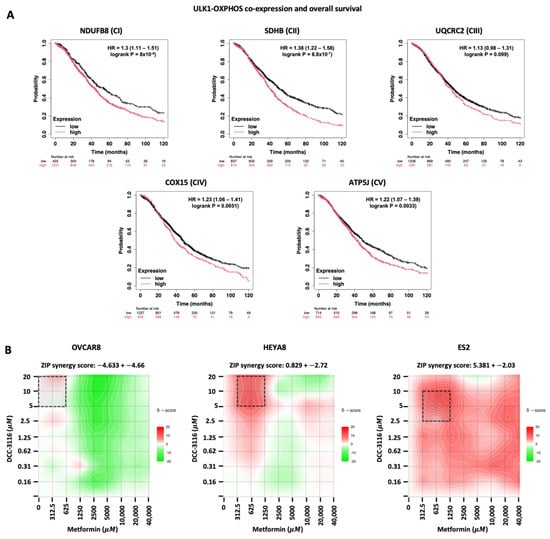
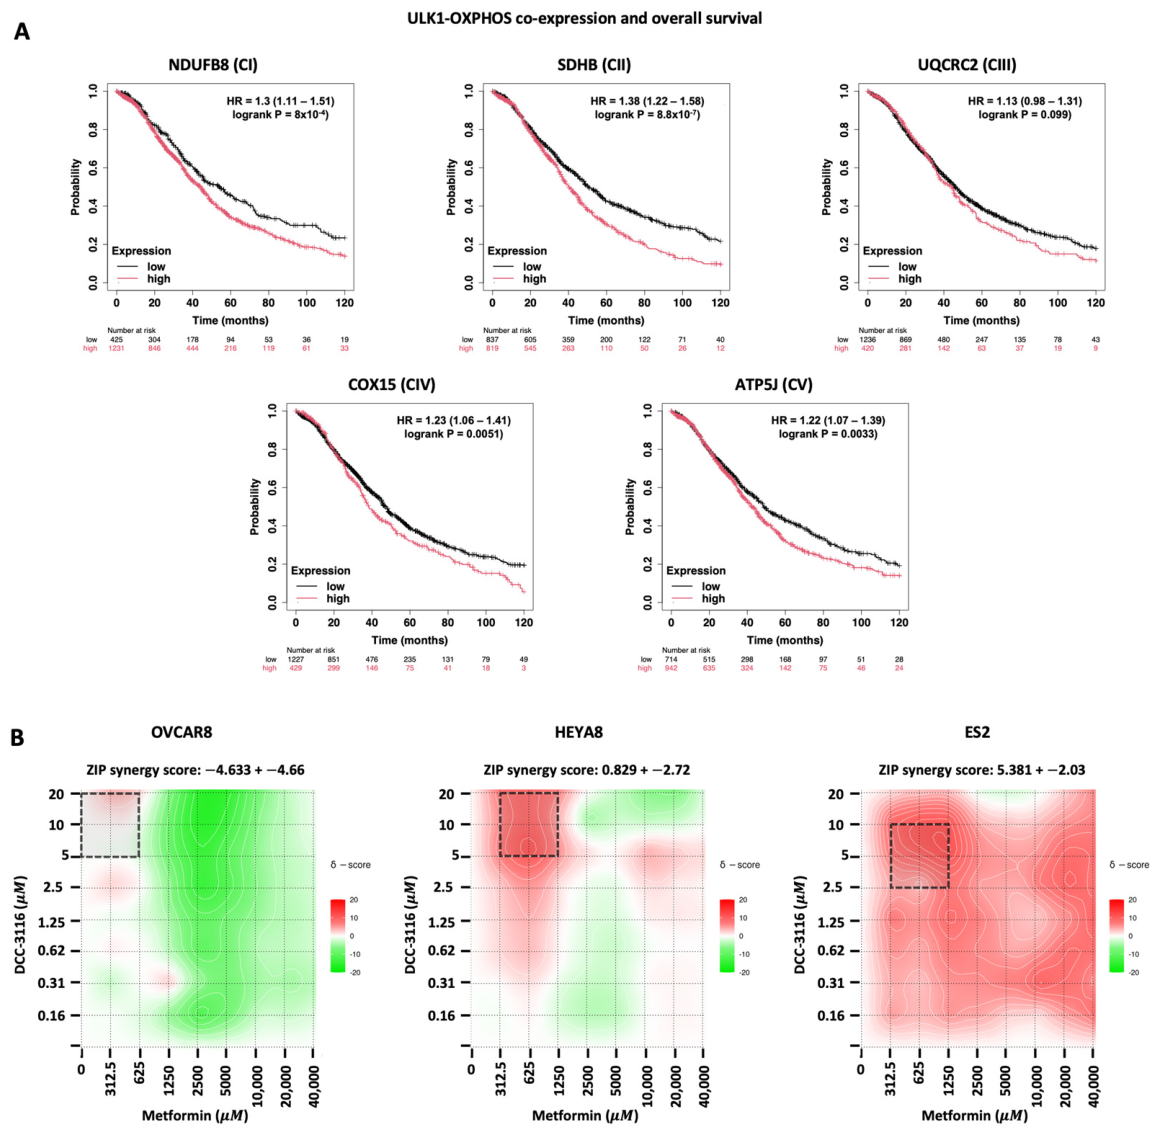
Given the OXPHOS metabolic dependencies we observed using Seahorse analyses, we assessed ULK1 and OXPHOS complex co-expression in publicly available ovarian cancer patient gene expression datasets. Survival analysis revealed that high co-expression of ULK1 with OXPHOS subunit genes–NDUFB8 (Complex I), SDHB (Complex II), UQCRC2 (Complex III), COX15 (Complex IV), and ATP5J (Complex V)–was associated with significantly decreased overall survival (Figure 6A), supporting a pro-tumorigenic ULK1-OXPHOS axis. To assess potential synergism between combined ULK1 and OXPHOS inhibition, we performed drug combination matrix assays, evaluating 96 unique concentration combinations between DCC-3116 (ULK1 inhibitor) and metformin (complex I inhibitor) in spheroid culture of OVCAR8, HEYA8 and ES2 cell lines. Using Synergy Finder, we calculated the Zero Interaction Potency Synergy Score (ZSS) based on multi-dose and multi-drug combination response data [39,40]. When averaged across all 96 drug combinations, the ZSS for OVCAR8, HEYA8, and ES2 spheroids were within the additive range (i.e., −10 < BSS < 10; Figure 6B). However, distinct regions of synergy were observed within the heat maps, uniformly at medium to high concentrations of DCC-3116 combined with low concentrations of metformin among the three cell lines, with increasing levels of combination potency going from OVCAR8 to HEYA8 to ES2 spheroids (Figure 6B). Within these regions, individual combination synergy scores ≥ 10 were identified for HEYA8 and ES2 spheroids (Supplementary Tables S1–S3). Together, these findings nominate the ULK1–OXPHOS axis as a potential therapeutic vulnerability in advanced EOC.
Figure 6.
Therapeutic potential of targeting ULK1 and OXPHOS in EOC. (A) Correlation of high ULK1 and OXPHOS complex subunit gene expression with overall survival (N = 1656) among ovarian cancer patients, regardless of histotype and stage, using TCGA and GEO gene expression microarray datasets from the online tool accessed at www.kmplot.com/ovar (accessed on 10 November 2025). Hazard ratios and log-rank tests indicate a significantly worse prognosis due to high ULK1 and OXPHOS expression in ovarian tumors. (B) ZIP synergy scores (ZSS) are presented as mean ± SEM (N = 3, with 3 technical replicates per biological replicate). Heat maps display the average synergy scores from biological replicates, where red indicates synergistic interaction (ZSS > 10), white represents additive effects (−10 < ZSS < 10), and green indicates antagonism (ZSS < −10). Regions enclosed by dashed-lined boxes represent areas with the greatest degree of synergy. Cells were seeded 24 h prior to 72-h combination treatment with DCC-3116 and metformin, using a matrix of concentrations ranging from 0 to 20 μM and 0 to 40,000 μM, respectively. Cell viability was assessed using Cell Titer-Glo as an indirect measure of viability.
4. Discussion
To the best of our knowledge, we are the first to define non-canonical functions of ULK1 in EOC spheroids, revealing therapeutic vulnerabilities tied to ULK1-mediated mitochondrial homeostasis. These findings extend from prior work on its pro-tumorigenic role in EOC metastasis beyond its established function in autophagy initiation to also govern mitochondrial homeostasis and metabolic adaptation. We show that ULK1 has dichotomous roles in either protecting mitochondria from degradation or promoting their clearance through mechanisms that can be uncoupled from canonical autophagy machinery. Although ULK1 loss broadly suppresses OXPHOS complex proteins and HK2 expression, ATP production differed across EOC spheroid models. Consistent with this, drug combination matrices suggested potential synergy between the ULK1 inhibitor DCC-3116 and low-dose metformin, underscoring a new, targetable ULK1-OXPHOS vulnerability in metastatic EOC.
Beyond its well-characterized role in initiating bulk autophagy under nutrient deprivation, ULK1 is a key regulator of selective autophagy pathways, including mitophagy. Mitophagy is a canonical autophagic process that mediates the recognition and removal of damaged or dysfunctional mitochondria through LC3 conjugation machinery and autophagosome formation, thereby supporting metabolic fitness and stress tolerance [16]. ULK1 regulates mitophagy through both transcriptional and post-translational mechanisms, acting downstream of AMPK and upstream of receptor-mediated mitochondrial engulfment [22,27]. Thus, we initially speculated that ULK1 would be required for mitophagy in EOC spheroids, also since another study demonstrated that ULK1 overexpression enhances mitophagy in ES2 cells, while ULK1 knockdown attenuates this process [23]. Indeed, we found that ULK1 was required for mitochondrial degradation in HEYA8 and ES2 spheroids, yet paradoxically, ULK1 loss in OVCAR8 spheroids enhanced mitochondrial degradation. Most importantly, genetic disruption of core autophagy machinery via ATG5 and ATG7 knockdown revealed that regulation of mitochondrial degradation in EOC spheroids proceeds even when canonical autophagy is impaired. These findings support a model in which ULK1 regulates mitochondrial degradation in a manner that can be uncoupled from ATG5/7-dependent canonical autophagy.
Cancer cells can adapt to impaired mitophagy when core autophagy is compromised, and several lysosome-directed mitochondrial quality-control pathways could potentially explain the phenotypes observed. One alternative is the formation of mitochondria-derived vesicles (MDVs), which transport damaged mitochondrial components to lysosomes independently of LC3 and canonical mitophagic mechanisms [44,45]. Another reported route involves Golgi-derived membranes contributing to autophagosomes that engulf mitochondria, as shown in cardiomyocytes [46]. The enrichment of protein secretion and Golgi-associated vesicle signatures in our OVCAR8 ULK1KO spheroid proteomics suggests that ULK1 loss occurs alongside broader changes in vesicular trafficking biology. ARF1 was strongly represented within the protein secretion signature, which is notable given its role in Golgi-associated vesicle formation and endosomal trafficking [47,48,49,50]. In this context, the ability of BFA to partially phenocopy the enhanced mitochondrial reporter degradation observed in OVCAR8 ULK1KO spheroids supports the possibility that altered membrane trafficking may contribute to mitochondrial delivery to lysosomes. However, because BFA broadly disrupts ARF-GEF/ARF-dependent Golgi and secretory trafficking [42], these findings should not be interpreted as evidence that ARF1 directly mediates mitochondrial degradation. Rather, they suggest that the enhanced lysosome-associated mitochondrial degradation observed in OVCAR8 ULK1KO spheroids occurs in the setting of altered Golgi/secretory trafficking and remains sensitive to perturbation of this pathway.
More broadly, the persistence or enhancement of mitochondrial reporter degradation under ATG5/7-depleted conditions suggests that mitochondrial delivery to acidic compartments in EOC spheroids is not strictly dependent on canonical autophagy machinery. This was particularly evident in OVCAR8 ULK1KO spheroids, where enhanced mitochondrial degradation persisted despite ATG5/7 knockdown and was attenuated by CQ. In HEYA8 and ES2 spheroids, ATG5/7 knockdown also increased mitochondrial reporter degradation, indicating that disruption of canonical autophagy can unmask or enhance alternative mitochondrial degradation responses. Together, these findings suggest that ULK1 can either promote or restrain lysosome-associated mitochondrial degradation in EOC spheroids through mechanisms that can be uncoupled from ATG5/7-dependent canonical autophagy. However, the divergent effects of ULK1 loss and ATG5/7 knockdown across OVCAR8, HEYA8, and ES2 spheroids make it unlikely that a single mechanism explains mitochondrial degradation across all EOC models. Although candidate lysosome-directed trafficking routes, including MDV-, Golgi-, or endosome-associated pathways, may contribute to these phenotypes, the precise mechanisms remain undefined.
While this work supports ULK1 as a regulator of mitochondrial homeostasis and metabolic adaptation in EOC spheroids, a major theme emerging from these studies is that the consequences of ULK1 loss differ across EOC spheroid models, particularly when differentiating OVCAR8 from HEYA8/ES2 spheroids. Baseline mitochondrial degradation also did not clearly predict the response to ULK1 loss, as parental OVCAR8 and ES2 spheroids displayed similar mitochondrial degradation levels despite opposite ULK1KO-associated phenotypes, while HEYA8 spheroids showed higher baseline mitochondrial degradation. Similarly, mitochondrial protein abundance did not directly parallel mitochondrial reporter degradation status. Although HEYA8 and ES2 ULK1KO spheroids showed reduced mitochondrial reporter degradation, VDAC and several OXPHOS complexes were still reduced in ULK1KO spheroids, with TOM20 also reduced in ES2 ULK1KO spheroids. These findings suggest that mitochondrial reporter degradation, mitochondrial protein abundance, and bioenergetic output do not map linearly across EOC spheroid models. Together, these observations suggest that no single mitochondrial readout fully explains why ULK1 loss produces divergent mitochondrial degradation phenotypes. Instead, differences in proliferative capacity, mitochondrial stress state, and spheroid growth behavior may influence whether ULK1 primarily acts to preserve mitochondrial integrity or support bioenergetic adaptation. Indeed, we have shown previously that OVCAR8 parental spheroids do not expand in viable cell number beyond three days in suspension, while viable cell number significantly increases over time in HEYA8 and ES2 spheroids. In fact, ULK1 loss significantly reduces spheroid cell number in all three of these lines, with HEYA8 and ES2 ULK1KO spheroid cells slowly increasing over time as compared with parental lines, whereas OVCAR8 ULK1KO fail to retain viability [8]. These characteristics imply underlying dormant (OVCAR8) versus proliferative (HEYA8 and ES2) phenotypes separating these two spheroid models. This distinction was further supported by our organoid studies, where growth capacity increased from OVCAR8 to HEYA8 to ES2, and ULK1 loss impaired organoid growth in OVCAR8 and HEYA8 but not ES2 [8]. Similarly, in vivo mouse xenograft studies showed that HEYA8 cells produced more aggressive disease than OVCAR8 cells for parental cell lines, as reflected by a significantly shorter experimental endpoint, whereas ULK1 loss had a more pronounced effect in attenuating disease progression in OVCAR8 [8]. Additionally, we have shown that parental OVCAR8 and HEYA8 spheroids possess significantly different levels of autophagy and mitophagy and altered mitochondrial networks: OVCAR8 spheroids have higher autophagy, lower mitophagy, and a higher proportion of fragmented mitochondria relative to HEYA8 spheroids [29]. Given these properties, we speculate that OVCAR8 spheroids adopt a dormancy-like state that prioritizes cell viability over expansion and, upon ULK1 loss, shift toward enhanced mitochondrial degradation, reduced mitochondrial ROS, and reduced ATP production. In contrast, HEYA8 and ES2 spheroids appear to retain a more proliferative and metabolically active state in which ULK1 loss reduces mitochondrial degradation while maintaining or increasing mitochondrial ATP production, potentially at the cost of elevated mitochondrial ROS. Thus, the divergent effects of ULK1 loss on mitochondrial degradation, ROS status, and bioenergetic output may reflect underlying differences in spheroid growth state and mitochondrial stress adaptation, rather than a single shared ULK1-dependent mechanism across EOC models.
Our ROS findings should be interpreted as correlative rather than causal. Increased mitochondrial degradation in OVCAR8 ULK1KO spheroids corresponded with reduced mitochondrial ROS, whereas reduced mitochondrial degradation in HEYA8 and ES2 ULK1KO spheroids corresponded with elevated mitochondrial ROS. This inverse relationship is consistent with the role of mitochondrial quality-control pathways in limiting the persistence of damaged or dysfunctional mitochondria. However, mitochondrial ROS are also strongly influenced by electron transport chain activity, as electrons moving through the ETC can prematurely reduce molecular oxygen to generate superoxide, including at Complexes I and III [51]. Therefore, the ROS phenotypes observed here likely reflect the combined influence of altered mitochondrial degradation and cell line-specific respiratory metabolism. Future studies using ROS scavengers, mitochondrial antioxidants, or targeted modulation of respiratory chain activity will be required to define whether mitochondrial ROS is a cause or consequence of ULK1-dependent mitochondrial turnover, altered metabolism, or both.
Despite the absence of a unified mechanism in mitochondrial degradation, ROS production, and ATP partitioning across EOC models, ablation of ULK1 revealed a shared therapeutic vulnerability. We previously observed reduced ULK1 activity, as measured by decreased p-BECN1 (S30), and reduced EOC spheroid cell viability following treatment with 1 µM DCC-3116 [8]. Here, we show that dual inhibition of ULK1 and mitochondrial Complex I produced reproducible “synergy hotspots” at low concentrations of metformin combined with medium-to-high concentrations of DCC-3116 across EOC spheroids. These findings suggest that, despite cell line-specific metabolic remodeling following ULK1 loss, pharmacological ULK1 inhibition can sensitize EOC spheroids to Complex I inhibition within defined dose windows. Metformin, a widely prescribed biguanide for type II diabetes that inhibits mitochondrial Complex I, has been evaluated in multiple cancer clinical trials, including for ovarian cancer [52,53,54,55]. DCC-3116 is a selective ULK1 inhibitor currently undergoing clinical evaluation (NCT04892017; NCT05957367). Using these two pharmacologic agents together may offer a clinically meaningful combination. Notably, anticancer applications of metformin use are oftentimes limited due to high dose-related toxicities; our observation that lower metformin concentrations are sufficient to achieve reduced EOC spheroid cell viability when paired with DCC-3116 is encouraging [55,56]. Because both agents are orally bioavailable, DCC-3116 has existing clinical PK/PD development, and metformin has a well-established safety profile, this combination is certainly feasible to explore further. However, additional in vitro validation and dose optimization will be required before advancing to in vivo studies.
While bona fide regions of synergy (ZSS ≥ 10) were detected for drug-treated HEYA8 and ES2 spheroids, this same level of synergy was not achieved for OVCAR8 spheroids. Again, this divergence may reflect their underlying differences in proliferative capacity and metabolic state. Perhaps this could guide biomarker-driven stratification strategies where highly proliferative EOC tumors would derive greater benefit from combined ULK1 and OXPHOS inhibition. Because we performed our drug synergy studies using ATP-based readouts that reflect metabolic impairment rather than direct cell death, validation with orthogonal viability assays will be required to determine the durability of this drug combination.
5. Conclusions
In summary, we define non-canonical roles for ULK1 in ovarian cancer spheroids, showing that it can either promote or restrain lysosome-associated mitochondrial degradation independently of core autophagy machinery. ULK1 loss remodels both mitochondrial ATP production and ROS status differently across EOC spheroid models. Finally, DCC-3116 treatment with low-dose metformin suggests that dual ULK1–OXPHOS targeting represents a potential therapeutic vulnerability in advanced EOC that warrants further exploration.
Supplementary Materials
The following supporting information can be downloaded at: https://www.mdpi.com/article/10.3390/cancers18111746/s1, Figure S1: Chloroquine treatment reveals lysosome-dependent regulation of mitoR processing in OVCAR8 parental and ULK1KO spheroids.; Figure S2: Brefeldin A enhances lysosome-associated mitochondrial reporter processing in OVCAR8 spheroids.; Figure S3. ULK1 loss reduces mitochondrial protein abundance in EOC spheroids.; Figure S4. Effects of ULK1 loss on glycolysis protein abundance in EOC cells.; Table S1: ZIP synergy scores matrix for HEYA8 spheroids; Table S2: ZIP synergy scores matrix for ES2 spheroids; Table S3: ZIP synergy scores matrix for OVCAR8 spheroids. File S1. Original western blots.
Author Contributions
Conceptualization, J.D.W. and T.G.S.; methodology, J.D.W., M.J.B. and T.G.S.; software, M.J.B.; validation, J.D.W.; investigation, J.D.W.; resources, M.J.B., Y.R.V. and T.G.S.; data curation, J.D.W. and M.J.B.; writing—original draft preparation, J.D.W. and T.G.S.; writing—review and editing, J.D.W. and T.G.S.; visualization, J.D.W.; supervision, T.G.S.; project administration, Y.R.V. and T.G.S.; funding acquisition, J.D.W. and T.G.S. All authors have read and agreed to the published version of the manuscript.
Funding
J.D.W. was supported by a Queen Elizabeth II Graduate Scholarship in Science and Technology (QEII-GSST) from the Ontario Government. M.J.B. was supported by a Postgraduate Scholarship—Doctoral Award from the Natural Sciences and Engineering Council of Canada. This work was also supported by the Verspeeten Family Cancer Centre Catalyst Research Grants Program with funds provided by the London Run for Ovarian Cancer.
Institutional Review Board Statement
Not applicable.
Informed Consent Statement
Not applicable.
Data Availability Statement
The original contributions presented in this study are included in the article/Supplementary Materials. Further inquiries can be directed to the corresponding author. The raw data supporting the conclusions of this article will be made available by the authors on request.
Acknowledgments
We are very grateful to the many donors to the Mary and John Knight Translational Ovarian Cancer Research Unit through the London Health Sciences Foundation for additional infrastructure funding, including the Bio-Rad Chemidoc and IncuCyte S3 live-cell imaging system used in this study.
Conflicts of Interest
The authors declare no conflicts of interest.
Abbreviations
The following abbreviations are used in this manuscript:
| ADH | Adherent |
| AMPK | AMP-activated protein kinase |
| ARF1 | ADP-ribosylation factor 1 |
| ATG5 | Autophagy related 5 |
| ATG7 | Autophagy related 7 |
| BECN1 | Beclin 1 |
| BFA | Brefeldin A |
| CMV | Cytomegalovirus |
| CQ | Chloroquine |
| DMEM/F12 | Dulbecco’s Modified Eagle Medium/Nutrient Mixture F-12 |
| ECAR | Extracellular acidification rate |
| EGFP | Enhanced green fluorescent protein |
| EOC | Epithelial ovarian cancer |
| FACS | Fluorescence-activated cell sorting |
| GEF | Guanine nucleotide exchange factor |
| GEO | Gene Expression Omnibus |
| GSEA | Gene set enrichment analysis |
| HK2 | Hexokinase 2 |
| HRP | Horseradish peroxidase |
| KEGG | Kyoto Encyclopedia of Genes and Genomes |
| LC3 | Microtubule-associated protein 1 light chain 3 |
| MDVs | Mitochondria-derived vesicles |
| mTORC1 | Mechanistic target of rapamycin complex 1 |
| OCR | Oxygen consumption rate |
| OXPHOS | Oxidative phosphorylation |
| PBS | Phosphate-buffered saline |
| PINK1 | PTEN-induced kinase 1 |
| RFU | Relative fluorescence units |
| RIPA | Radioimmunoprecipitation assay |
| ROS | Reactive oxygen species |
| RPMI-1640 | Roswell Park Memorial Institute 1640 medium |
| SPH | Spheroid |
| siULK1 | Small interfering RNA targeting ULK1 |
| SPoRTS | Spatial Profiling of Ratiometric Trends in Spheroids |
| TCGA | The Cancer Genome Atlas |
| ULA | Ultra-low attachment |
| ULK1 | Unc-51-like kinase 1 |
| ULK1KO | ULK1 knockout |
| VDAC | Voltage-dependent anion channel |
| XF | Extracellular flux |
| ZIP | Zero Interaction Potency |
| ZSS | ZIP synergy score |
References
- Brenner, D.R.; Weir, H.K.; Demers, A.A.; Ellison, L.F.; Louzado, C.; Shaw, A.; Turner, D.; Woods, R.R.; Smith, L.M. Projected estimates of cancer in Canada in 2020. Can. Med. Assoc. J. 2020, 192, E199–E205. [Google Scholar] [CrossRef] [Scilit]
- Bowtell, D.D.; Böhm, S.; Ahmed, A.A.; Aspuria, P.J.; Bast, R.C.; Beral, V.; Berek, J.S.; Birrer, M.J.; Blagden, S.; Bookman, M.A.; et al. Rethinking ovarian cancer II: Reducing mortality from high-grade serous ovarian cancer. Nat. Rev. Cancer 2015, 15, 668–679. [Google Scholar] [CrossRef] [Scilit] [PubMed]
- Lengyel, E.; Burdette, J.E.; Kenny, H.A.; Matei, D.; Pilrose, J.; Haluska, P.; Nephew, K.P.; Hales, D.B.; Stack, M.S. Epithelial ovarian cancer experimental models. Oncogene 2013, 33, 3619–3633. [Google Scholar] [CrossRef] [Scilit]
- Naora, H.; Montell, D.J. Ovarian cancer metastasis: Integrating insights from disparate model organisms. Nat. Rev. Cancer 2005, 5, 355–366. [Google Scholar] [CrossRef] [Scilit]
- Shield, K.; Ackland, M.L.; Ahmed, N.; Rice, G.E. Multicellular spheroids in ovarian cancer metastases: Biology and pathology. Gynecol. Oncol. 2009, 113, 143–148. [Google Scholar] [CrossRef] [Scilit] [PubMed]
- Iwanicki, M.P.; Davidowitz, R.A.; Ng, M.R.; Besser, A.; Muranen, T.; Merritt, M.; Danuser, G.; Ince, T.; Brugge, J.S. Ovarian cancer spheroids use myosin-generated force to clear the mesothelium. Cancer Discov. 2011, 1, 144–157. [Google Scholar] [CrossRef] [Scilit]
- Singha, B.; Laski, J.; Ramos Valdés, Y.; Liu, E.; DiMattia, G.E.; Shepherd, T.G. Inhibiting ULK1 kinase decreases autophagy and cell viability in high-grade serous ovarian cancer spheroids. Am. J. Cancer Res. 2020, 10, 1384–1399. [Google Scholar]
- Webb, J.D.; Buensuceso, A.; Tomas, E.J.; Borrelli, M.J.; Viola, L.; Hovey, O.; Ramos Valdes, Y.; Singha, B.; Li, S.S.-C.; Shepherd, T.G. ULK1 promotes metastatic progression in experimental models of epithelial ovarian cancer. Oncogene 2026, 45, 1111–1127. [Google Scholar] [CrossRef] [Scilit]
- Wirth, M.; Joachim, J.; Tooze, S.A. Autophagosome formation—The role of ULK1 and Beclin1-PI3KC3 complexes in setting the stage. Semin. Cancer Biol. 2013, 23, 301–309. [Google Scholar] [CrossRef] [Scilit]
- Wang, C.; Wang, H.; Zhang, D.; Luo, W.; Liu, R.; Xu, D.; Diao, L.; Liao, L.; Liu, Z. Phosphorylation of ULK1 affects autophagosome fusion and links chaperone-mediated autophagy to macroautophagy. Nat. Commun. 2018, 9, 3492. [Google Scholar] [CrossRef] [Scilit] [PubMed]
- Wong, P.M.; Puente, C.; Ganley, I.G.; Jiang, X. The ULK1 complex sensing nutrient signals for autophagy activation. Autophagy 2013, 9, 124–137. [Google Scholar] [CrossRef] [Scilit]
- Russell, R.C.; Tian, Y.; Yuan, H.; Park, H.W.; Chang, Y.Y.; Kim, J.; Kim, H.; Neufeld, T.P.; Dillin, A.; Guan, K.L. ULK1 induces autophagy by phosphorylating Beclin-1 and activating VPS34 lipid kinase. Nat. Cell Biol. 2013, 15, 741–750. [Google Scholar] [CrossRef] [Scilit]
- Levine, B.; Kroemer, G. Autophagy in the Pathogenesis of Disease. Cell 2008, 132, 27–42. [Google Scholar] [CrossRef] [Scilit] [PubMed]
- Ploumi, C.; Daskalaki, I.; Tavernarakis, N. Mitochondrial biogenesis and clearance: A balancing act. FEBS J. 2017, 284, 183–195. [Google Scholar] [CrossRef] [Scilit] [PubMed]
- Vyas, S.; Zaganjor, E.; Haigis, M.C. Mitochondria and Cancer. Cell 2016, 166, 555–566. [Google Scholar] [CrossRef] [Scilit]
- Palikaras, K.; Lionaki, E.; Tavernarakis, N. Mechanisms of mitophagy in cellular homeostasis, physiology and pathology. Nat. Cell Biol. 2018, 20, 1013–1022. [Google Scholar] [CrossRef] [Scilit]
- Bordi, M.; Nazio, F.; Campello, S. The Close interconnection between mitochondrial dynamics and mitophagy in cancer. Front. Oncol. 2017, 7, 81. [Google Scholar] [CrossRef] [Scilit]
- Ding, W.X.; Yin, X.M. Mitophagy: Mechanisms, pathophysiological roles, and analysis. Biol. Chem. 2012, 393, 547–564. [Google Scholar] [CrossRef] [Scilit]
- Grieco, J.P.; Compton, S.L.E.; Bano, N.; Brookover, L.; Nichenko, A.S.; Drake, J.C.; Schmelz, E.M. Mitochondrial plasticity supports proliferative outgrowth and invasion of ovarian cancer spheroids during adhesion. Front. Oncol. 2023, 19 12, 1043670. [Google Scholar] [CrossRef] [Scilit]
- Joo, J.H.; Dorsey, F.C.; Joshi, A.; Hennessy-Walters, K.M.; Rose, K.L.; McCastlain, K.; Zhang, J.; Iyengar, R.; Jung, C.H.; Suen, D.F.; et al. Hsp90-Cdc37 Chaperone Complex Regulates Ulk1- and Atg13-Mediated Mitophagy. Mol. Cell 2011, 43, 572–585. [Google Scholar] [CrossRef] [Scilit] [PubMed]
- Wu, W.; Tian, W.; Hu, Z.; Chen, G.; Huang, L.; Li, W.; Zhang, X.; Xue, P.; Zhou, C.; Liu, L.; et al. ULK1 translocates to mitochondria and phosphorylates FUNDC1 to regulate mitophagy. EMBO Rep. 2014, 15, 566–575. [Google Scholar] [CrossRef] [Scilit] [PubMed]
- Tian, W.; Li, W.; Chen, Y.; Yan, Z.; Huang, X.; Zhuang, H.; Zhong, W.; Chen, Y.; Wu, W.; Lin, C.; et al. Phosphorylation of ULK1 by AMPK regulates translocation of ULK1 to mitochondria and mitophagy. FEBS Lett. 2015, 589, 1847–1854. [Google Scholar] [CrossRef] [Scilit] [PubMed]
- Wang, J.; Zheng, F.; Wang, D.; Yang, Q. Regulation of ULK1 by WTAP/IGF2BP3 axis enhances mitophagy and progression in epithelial ovarian cancer. Cell Death Dis. 2024, 15, 97. [Google Scholar] [CrossRef] [Scilit]
- Li, T.Y.; Sun, Y.; Liang, Y.; Liu, Q.; Shi, Y.; Zhang, C.S.; Zhang, C.; Song, L.; Zhang, P.; Zhang, X.; et al. ULK1/2 Constitute a Bifurcate Node Controlling Glucose Metabolic Fluxes in Addition to Autophagy. Mol. Cell 2016, 62, 359–370. [Google Scholar] [CrossRef] [Scilit] [PubMed]
- Ianniciello, A.; Zarou, M.M.; Rattigan, K.M.; Scott, M.; Dawson, A.; Dunn, K.; Brabcova, Z.; Kalkman, E.R.; Nixon, C.; Michie, A.M.; et al. ULK1 inhibition promotes oxidative stress–induced differentiation and sensitizes leukemic stem cells to targeted therapy. Sci. Transl. Med. 2021, 13, eabd5016. [Google Scholar] [CrossRef] [Scilit]
- Shen, W.; Zeng, X.; Zeng, X.; Hu, B.; Ren, C.; Lin, Z.; Zhang, L.; Rui, G.; Yasen, M.; Chen, X. Trifluoperazine activates AMPK/mTOR/ULK1 signaling pathway to induce mitophagy in osteosarcoma cells. Chem.-Biol. Interact. 2024, 392, 110904. [Google Scholar] [CrossRef] [Scilit]
- Zhao, J.; Yang, T.; Yi, J.; Hu, H.; Lai, Q.; Nie, L.; Liu, M.; Chu, C.; Yang, J. AP39 through AMPK-ULK1-FUNDC1 pathway regulates mitophagy, inhibits pyroptosis, and improves doxorubicin-induced myocardial fibrosis. iScience 2024, 27, 109321. [Google Scholar] [CrossRef] [Scilit]
- Chen, K.; Chen, J.; Cong, Y.; He, Q.; Liu, C.; Chen, J.; Li, H.; Ju, Y.; Chen, L.; Song, Y.; et al. TTK promotes mitophagy by regulating ULK1 phosphorylation and pre-mRNA splicing to inhibit mitochondrial apoptosis in bladder cancer. Cell Death Differ. 2025, 32, 1691–1706, Correction in Cell Death Differ. 2026, 33, 236–239. https://doi.org/10.1038/s41418-025-01571-y. [Google Scholar] [CrossRef] [Scilit]
- Borrelli Matthew, J. An Examination of Adaptive, Metabolism-Associated Cellular Reprogramming in Epithelial Ovarian Cancer Spheroids. Ph.D. Thesis, Western University Open Repository, London, ON, Canada, 2024. [Google Scholar]
- Frederick, M.I.; Nassef, M.Z.; Borrelli, M.J.; Kuang, S.; Buensuceso, A.; More, T.; Cordes, T.; O’Donoghue, P.; Shepherd, T.G.; Hiller, K.; et al. Metabolic adaptation in epithelial ovarian cancer metastasis. Biochim. Biophys. Acta-Mol. Basis Dis. 2024, 1870, 167312. [Google Scholar] [CrossRef] [Scilit]
- N’Diaye, E.N.; Kajihara, K.K.; Hsieh, I.; Morisaki, H.; Debnath, J.; Brown, E.J. PLIC proteins or ubiquilins regulate autophagy-dependent cell survival during nutrient starvation. EMBO Rep. 2009, 10, 173–179. [Google Scholar] [CrossRef] [Scilit]
- Borrelli, M.J.; Kolendowski, B.; DiMattia, G.E.; Shepherd, T.G. Spatiotemporal analysis of ratiometric biosensors in live multicellular spheroids using SPoRTS. Cell Rep. Methods 2025, 5, 100987. [Google Scholar] [CrossRef] [Scilit] [PubMed]
- Subramanian, A.; Tamayo, P.; Mootha, V.K.; Mukherjee, S.; Ebert, B.L.; Gillette, M.A.; Paulovich, A.; Pomeroy, S.L.; Golub, T.R.; Lander, E.S.; et al. Gene set enrichment analysis: A knowledge-based approach for interpreting genome-wide expression profiles. Proc. Natl. Acad. Sci. USA 2005, 102, 15545–15550. [Google Scholar] [CrossRef] [Scilit]
- Ge, S.X.; Jung, D.; Yao, R. ShinyGO: A graphical gene-set enrichment tool for animals and plants. Bioinformatics 2020, 36, 2628–2629. [Google Scholar] [CrossRef] [Scilit]
- Milacic, M.; Beavers, D.; Conley, P.; Gong, C.; Gillespie, M.; Griss, J.; Haw, R.; Jassal, B.; Matthews, L.; May, B.; et al. The Reactome Pathway Knowledgebase 2024. Nucleic Acids Res. 2024, 52, D672–D678. [Google Scholar] [CrossRef] [Scilit] [PubMed]
- Javed, Z.; Worley, B.L.; Stump, C.; Shimko, S.S.; Crawford, L.C.; Mythreye, K.; Hempel, N. Optimization of Extracellular Flux Assay to Measure Respiration of Anchorage-independent Tumor Cell Spheroids. Bio-Protoc. 2022, 12, e4321. [Google Scholar] [CrossRef] [Scilit]
- Hallas-Potts, A.; Dawson, J.C.; Herrington, C.S. Ovarian cancer cell lines derived from non-serous carcinomas migrate and invade more aggressively than those derived from high-grade serous carcinomas. Sci. Rep. 2019, 9, 5515. [Google Scholar] [CrossRef] [Scilit]
- Haley, J.; Tomar, S.; Pulliam, N.; Xiong, S.; Perkins, S.M.; Karpf, A.R.; Mitra, S.; Nephew, K.P.; Mitra, A.K. Functional characterization of a panel of high-grade serous ovarian cancer cell lines as representative experimental models of the disease. Oncotarget 2016, 7, 32810–32820. [Google Scholar] [CrossRef] [Scilit] [PubMed]
- Ianevski, A.; He, L.; Aittokallio, T.; Tang, J. SynergyFinder: A web application for analyzing drug combination dose-response matrix data. Bioinformatics 2017, 33, 2413–2415. [Google Scholar] [CrossRef] [Scilit]
- Ianevski, A.; Giri, A.K.; Aittokallio, T. SynergyFinder 2.0: Visual analytics of multi-drug combination synergies. Nucleic Acids Res. 2021, 48, W488–W493. [Google Scholar] [CrossRef] [Scilit]
- Rosignol, I.; Villarejo-Zori, B.; Teresak, P.; Sierra-Filardi, E.; Pereiro, X.; Rodríguez-Muela, N.; Vecino, E.; Vieira, H.L.A.; Bell, K.; Boya, P. The mito-QC reporter for quantitative mitophagy assessment in primary retinal ganglion cells and experimental glaucoma models. Int. J. Mol. Sci. 2020, 21, 1882. [Google Scholar] [CrossRef] [Scilit]
- Lippincott-Schwartz, J.; Yuan, L.; Tipper, C.; Amherdt, M.; Orci, L.; Klausner’, R.D. Brefeldin A’s Effects on Endosomes, Lysosomes, and the TGN Suggest a General Mechanism for Regulating Organelle Structure and Membrane Traffic. Cell 1991, 67, 601–616. [Google Scholar] [CrossRef] [Scilit] [PubMed]
- Koopman, W.J.H.; Distelmaier, F.; Smeitink, J.A.M.; Willems, P.H.G.M. OXPHOS mutations and neurodegeneration. EMBO J. 2013, 32, 9–29. [Google Scholar] [CrossRef] [Scilit]
- Poillet-Perez, L.; White, E. MDVs to the rescue: How autophagy-deficient cancer cells adapt to defective mitophagy. Dev. Cell 2021, 56, 2010–2012. [Google Scholar] [CrossRef] [Scilit]
- Uoselis, L.; Nguyen, T.N.; Lazarou, M. Mitochondrial degradation: Mitophagy and beyond. Mol. Cell 2023, 45 83, 3404–3420. [Google Scholar] [CrossRef] [Scilit]
- Saito, T.; Nah, J.; Oka Sichi Mukai, R.; Monden, Y.; Maejima, Y.; Ikeda, Y.; Sciarretta, S.; Liu, T.; Li, H.; Baljinnyam, E.; et al. An alternative mitophagy pathway mediated by Rab9 protects the heart against ischemia. J. Clin. Investig. 2019, 129, 802–819. [Google Scholar] [CrossRef] [Scilit]
- Joo, J.H.; Wang, B.; Frankel, E.; Ge, L.; Xu, L.; Iyengar, R.; Li-Harms, X.J.; Wright, C.; Shaw, T.I.; Lindsten, T.; et al. The Noncanonical Role of ULK/ATG1 in ER-to-Golgi Trafficking Is Essential for Cellular Homeostasis. Mol. Cell 2016, 62, 491–506. [Google Scholar] [CrossRef] [Scilit] [PubMed]
- Walch, L.; Pellier, E.; Leng, W.; Lakisic, G.; Gautreau, A.; Contremoulins, V.; Verbavatz, J.M.; Jackson, C.L. GBF1 and Arf1 interact with Miro and regulate mitochondrial positioning within cells. Sci. Rep. 2018, 8, 17121. [Google Scholar] [CrossRef] [Scilit]
- Rabouille, C. Old dog, new tricks: Arf1 required for mitochondria homeostasis. EMBO J. 2014, 33, 2604–2605. [Google Scholar] [CrossRef] [Scilit]
- Stockhammer, A.; Adarska, P.; Natalia, V.; Heuhsen, A.; Klemt, A.; Bregu, G.; Harel, S.; Rodilla-Ramirez, C.; Spalt, C.; Özsoy, E.; et al. ARF1 compartments direct cargo flow via maturation into recycling endosomes. Nat. Cell Biol. 2024, 26, 1845–1859. [Google Scholar] [CrossRef] [Scilit]
- Raimondi, V.; Ciccarese, F.; Ciminale, V. Oncogenic pathways and the electron transport chain: A dangeROS liaison. Br. J. Cancer 2020, 122, 168–181. [Google Scholar] [CrossRef] [Scilit] [PubMed]
- Brown, J.R.; Chan, D.K.; Shank, J.J.; Griffith, K.A.; Fan, H.; Szulawski, R.; Yang, K.; Reynolds, R.K.; Johnston, C.; McLean, K.; et al. Phase II clinical trial of metformin as a cancer stem cell–targeting agent in ovarian cancer. JCI Insight 2020, 5, e133247. [Google Scholar] [CrossRef] [Scilit] [PubMed]
- Ashton, T.M.; Gillies McKenna, W.; Kunz-Schughart, L.A.; Higgins, G.S. Oxidative phosphorylation as an emerging target in cancer therapy. Clin. Cancer Res. 2018, 24, 2482–2490. [Google Scholar] [CrossRef] [Scilit] [PubMed]
- Gadducci, A.; Biglia, N.; Tana, R.; Cosio, S.; Gallo, M. Metformin use and gynecological cancers: A novel treatment option emerging from drug repositioning. Crit. Rev. Oncol./Hematol. 2016, 105, 73–83. [Google Scholar] [CrossRef] [Scilit] [PubMed]
- Chae, Y.K.; Arya, A.; Malecek, M.-K.; Shin, D.S.; Carneiro, B.; Chandra, S.; Kaplan, J.; Kalyan, A.; Altman, J.K.; Platanias, L.; et al. Repurposing metformin for cancer treatment: Current clinical studies. Oncotarget 2016, 7, 40767–40780. [Google Scholar] [CrossRef] [Scilit]
- Nittayaboon, K.; Leetanaporn, K.; Sangkhathat, S.; Roytrakul, S.; Navakanitworakul, R. Cytotoxic effect of metformin on butyrate-resistant PMF-K014 colorectal cancer spheroid cells. Biomed. Pharmacother. 2022, 151, 113214. [Google Scholar] [CrossRef] [Scilit]
Disclaimer/Publisher’s Note: The statements, opinions and data contained in all publications are solely those of the individual author(s) and contributor(s) and not of MDPI and/or the editor(s). MDPI and/or the editor(s) disclaim responsibility for any injury to people or property resulting from any ideas, methods, instructions or products referred to in the content. |
© 2026 by the authors. Licensee MDPI, Basel, Switzerland. This article is an open access article distributed under the terms and conditions of the Creative Commons Attribution (CC BY) license.