Article

Compartment-Specific CD138 Expression Defines an Aggressive Breast Cancer Phenotype with Distinct Transcriptomic Features

1
Department of Breast Oncology, Saitama Medical University International Medical Center, Hidaka City 350-1298, Japan
2
Department of Clinical Cancer Genomics, Saitama Medical University International Medical Center, Hidaka City 350-1298, Japan
*
Authors to whom correspondence should be addressed.
Cancers 2026, 18(10), 1539; https://doi.org/10.3390/cancers18101539
Submission received: 2 April 2026 / Revised: 25 April 2026 / Accepted: 6 May 2026 / Published: 9 May 2026
(This article belongs to the Special Issue Tumor Microenvironment Biomarkers: Bridging Immunology and Metastasis)

Simple Summary

CD138 (syndecan-1) is a cell-surface molecule involved in cell adhesion and growth factor signaling. Its clinical significance in breast cancer remains unclear, particularly when its expression is assessed separately in the tumor and stromal compartments. We examined compartment-specific CD138 expression in tumor and stromal cells in 111 invasive breast cancers. Tumors with CD138-positive tumor cells and CD138-negative stromal cells were associated with poorer recurrence-free survival and adverse clinicopathological features, including lymph node metastasis and HER2 positivity. All brain metastases occurred in this phenotype, although the number of events was low. RNA-seq analysis showed the upregulation of small nucleolar RNAs and enrichment of pathways related to ribosome biogenesis, RNA processing, and translational regulation. These findings suggest that compartment-specific CD138 expression may help to identify an aggressive breast cancer phenotype with potential prognostic relevance.

Abstract

Background/Objectives: CD138 (syndecan-1) is a cell-surface heparan sulfate proteoglycan involved in cell–matrix interactions and growth factor signaling, and it has been implicated in tumor progression. However, the clinical significance of compartment-specific CD138 expression in breast cancer remains unclear. In this study, we investigated the prognostic and transcriptomic features of compartment-specific CD138 expression in invasive breast cancer. Methods: We performed an integrated analysis of immunohistochemistry and RNA sequencing of 111 invasive ductal carcinoma specimens. Tumors were classified into four groups according to CD138 expression in the tumor and stromal compartments. Clinicopathological data and survival outcomes were obtained from medical records, and transcriptomic profiles were analyzed using RNA sequencing. Results: The tumor-positive/stroma-negative phenotype (Group 1) was associated with poorer recurrence-free survival than the other phenotypes. According to multivariable Cox regression analysis, Group 1 remained an independent prognostic factor after adjustment for age, lymph node status, and Ki-67 index (hazard ratio, 5.493; p = 0.0028). Group 1 was also associated with lymph node metastasis and HER2 expression. All brain metastases occurred in Group 1, although the number of events was low. Transcriptomic profiling identified the upregulation of small nucleolar RNAs in Group 1 tumors, with the enrichment of pathways related to ribosome biogenesis, RNA processing, and translational regulation. Conclusions: Compartment-specific CD138 expression identifies an aggressive breast cancer phenotype with distinct transcriptomic features. This phenotype may have prognostic value and warrants validation using larger, independent cohorts.

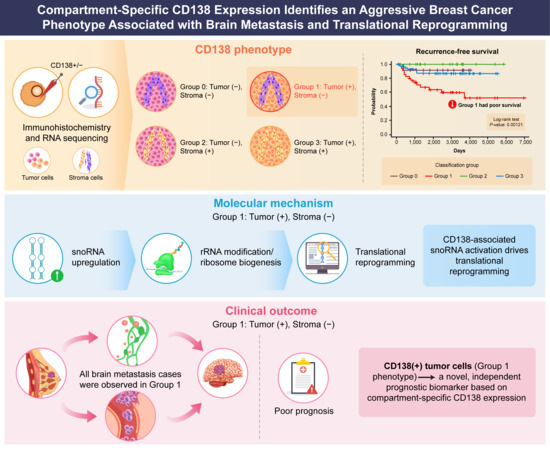
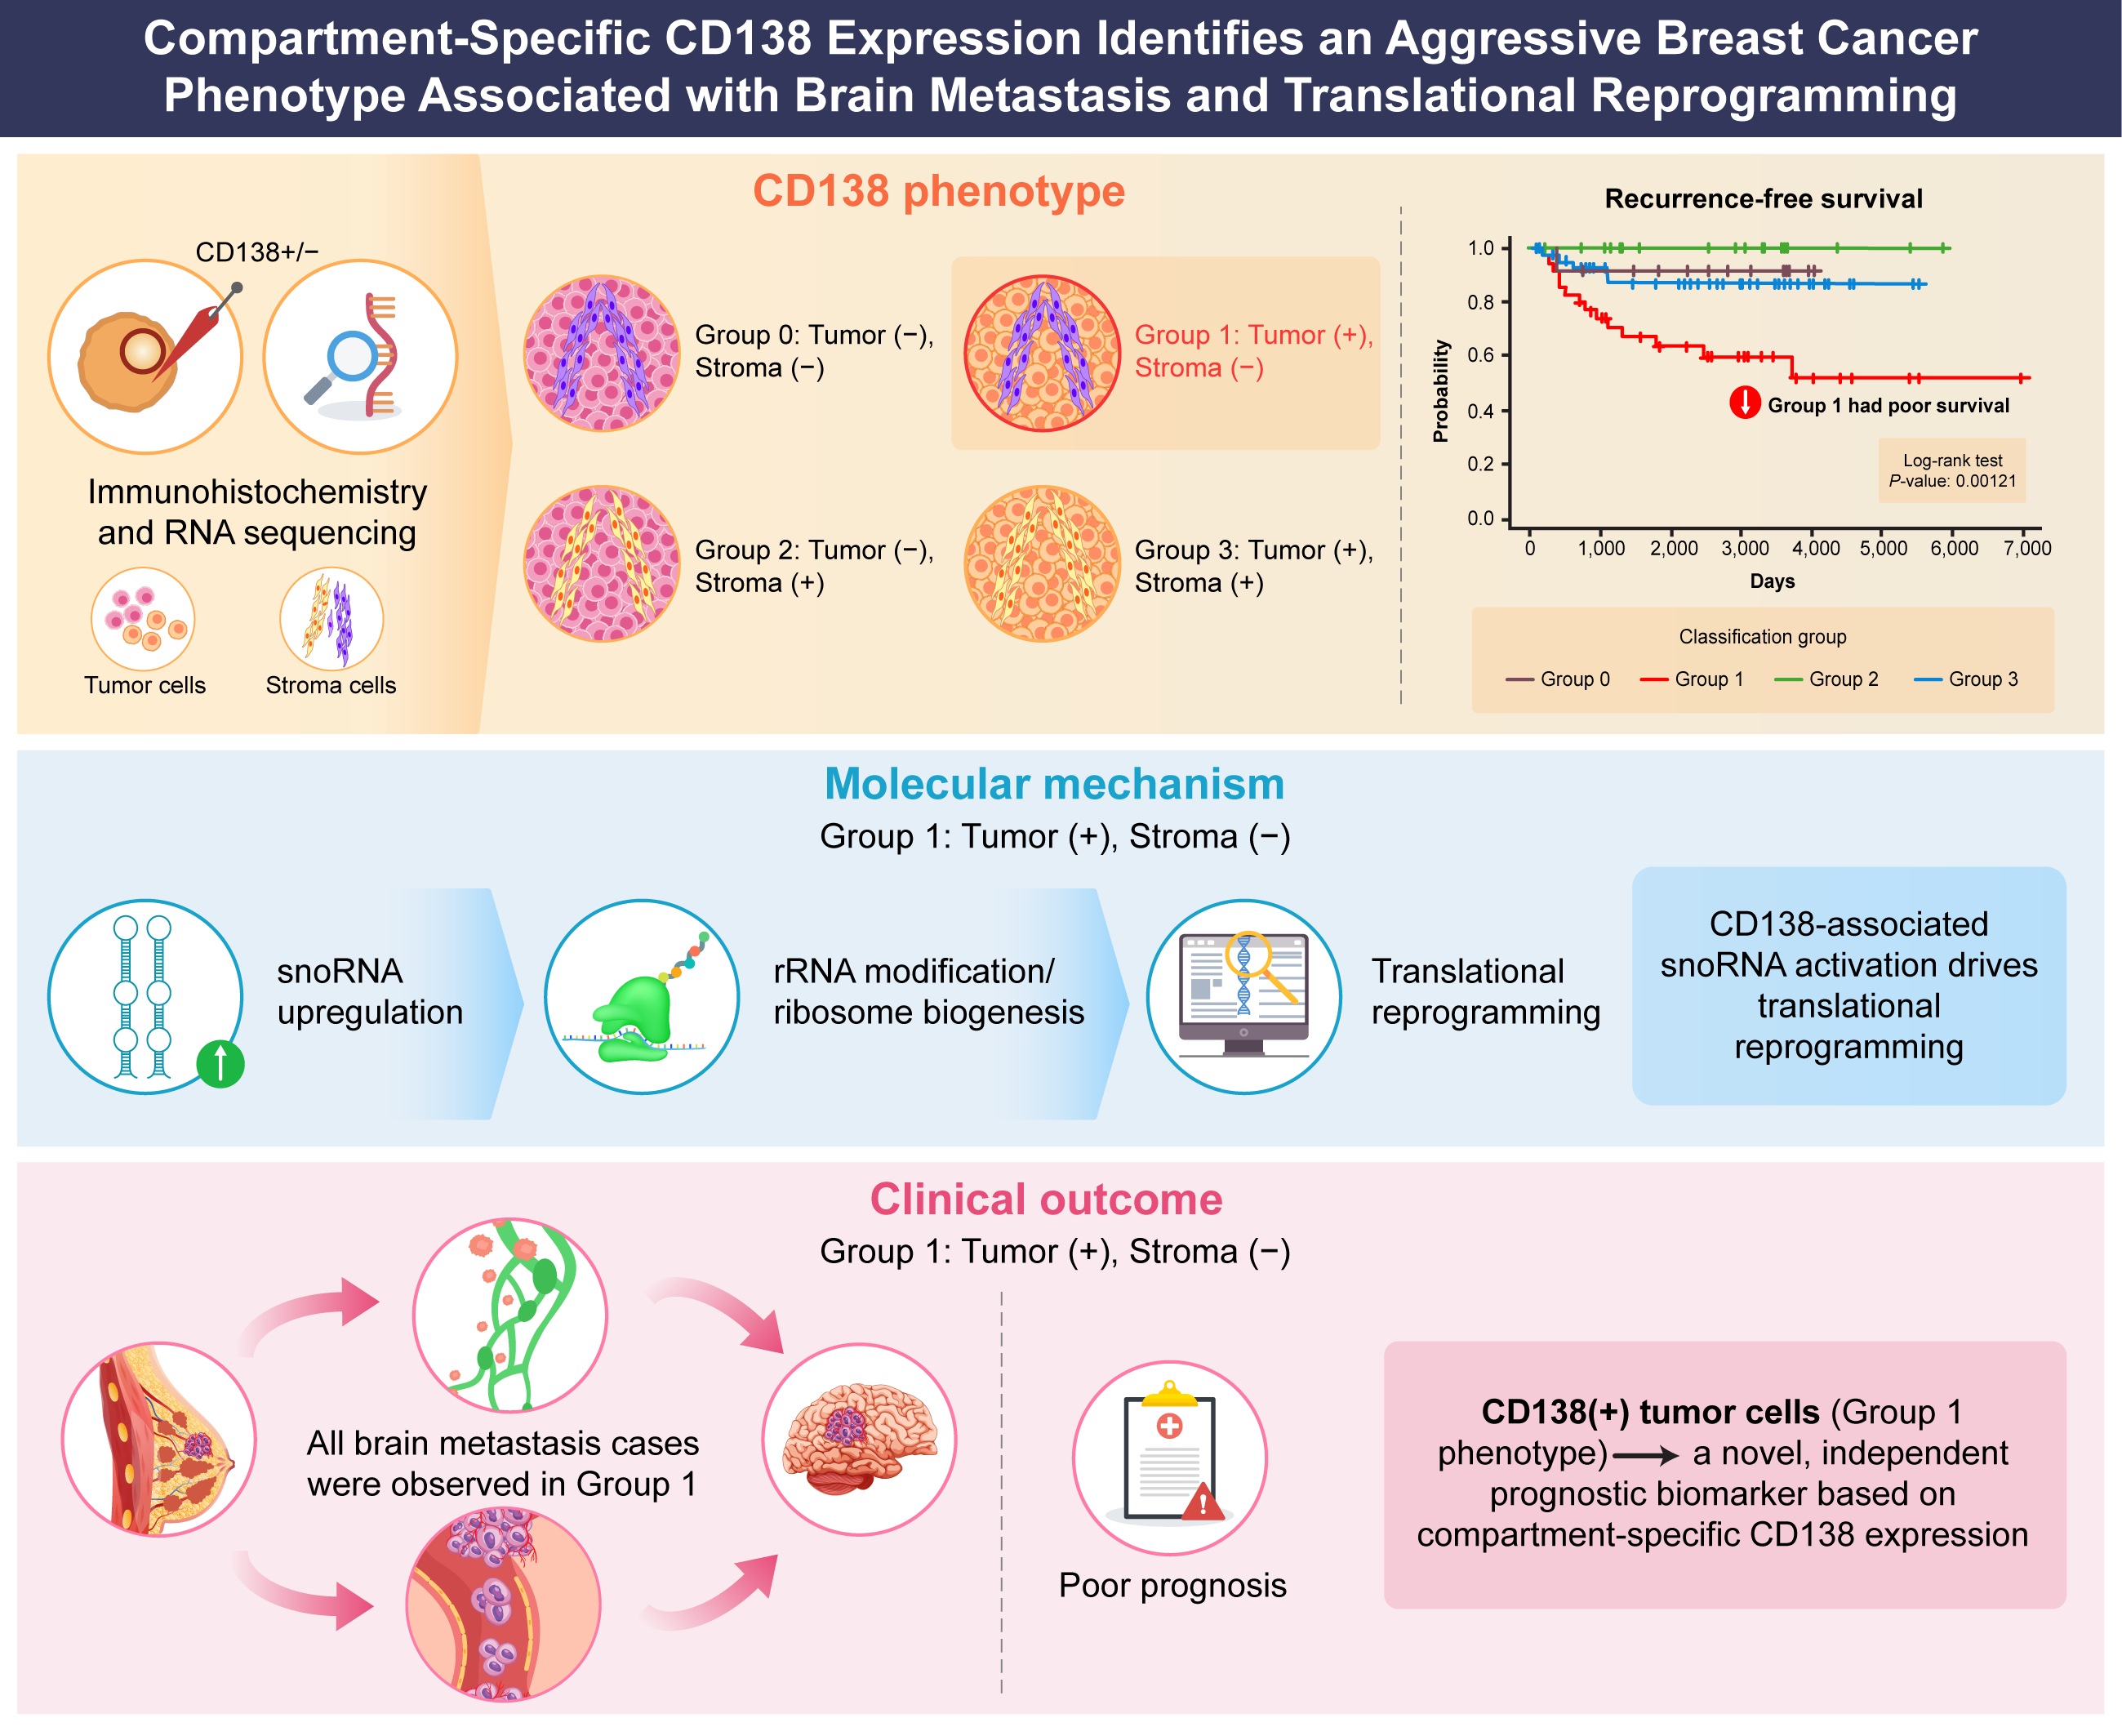
Graphical Abstract

1. Introduction

Breast cancer is a biologically heterogeneous disease characterized by diverse tumor cell-intrinsic programs and dynamic interactions with the tumor microenvironment (TME) [1,2]. Molecular classification based on hormone receptor (HR) and human epidermal growth factor receptor 2 (HER2) status has improved prognostic stratification and therapeutic decision-making in breast cancer. Nevertheless, a considerable proportion of patients still develop recurrence, underscoring the need for additional biomarkers that reflect tumor–stromal crosstalk and post-transcriptional regulatory mechanisms involved in tumor progression.
Several cluster of differentiation (CD) molecules have been implicated in breast cancer progression and tumor heterogeneity. Among them, CD44 and CD24 are well established markers associated with cancer stemness, tumor aggressiveness, and metastatic potential. CD44, a receptor for hyaluronic acid, mediates tumor cell adhesion and migration and has been used for targeted drug delivery in CD44-positive cancer cells [3]. In addition, the CD44/CD24 expression profile has been extensively studied in breast cancer, where CD44-positive/CD24-negative phenotypes are associated with aggressive clinical behavior and poor prognosis [4]. These findings highlight the importance of CD molecule expression patterns in defining biologically distinct tumor subtypes and underscore the relevance of investigating other CD markers, including CD138, in breast cancer progression.
Syndecan-1 (CD138) is a transmembrane heparan sulfate proteoglycan involved in cell–cell and cell–matrix interactions, growth factor signaling, and extracellular matrix (ECM) organization [5,6]. In breast cancer, CD138 expression has been observed in both tumor and stromal cells, particularly cancer-associated fibroblasts [7]. However, studies evaluating the prognostic significance of CD138 expression in breast cancer have yielded inconsistent results; some studies have associated CD138 expression with poor clinical outcomes, whereas others reported more favorable outcomes. These discrepancies may partly reflect differences in evaluation methods, including whether CD138 expression in the tumor and stromal compartments was assessed separately or collectively [8,9].
Recent immunohistochemical studies suggest that compartment-specific CD138 expression may have distinct biological implications. It has been suggested that stromal CD138 expression exerts tumor-modulating effects, whereas CD138 expression restricted to tumor epithelial cells may be associated with a more aggressive phenotype [7,8]. Despite these observations, the molecular basis of compartment-specific CD138 expression patterns remains unclear. In particular, the intracellular regulatory programs associated with CD138 expression, especially those related to gene expression control and protein synthesis, have not been fully elucidated.
RNA sequencing (RNA-seq) enables comprehensive profiling of both coding and non-coding RNAs and has revealed that small nucleolar RNAs (snoRNAs), traditionally regarded as housekeeping molecules involved in ribosomal RNA (rRNA) modification, play broader roles in cancer biology. snoRNAs are broadly classified into the H/ACA box and C/D box families, which guide the pseudouridylation and 2′-O-methylation of rRNA, thereby influencing the ribosome structure and translational fidelity [10,11,12,13,14].
Recent studies have demonstrated that snoRNAs contribute to tumor progression, metastasis, and therapeutic resistance across multiple cancer types, including breast cancer [15,16,17]. Furthermore, alterations in snoRNA expression are often coordinated through their host genes and may reflect broader changes in RNA processing and translational regulatory networks [18].
These findings suggest that post-transcriptional reprogramming mediated by snoRNAs may promote tumor aggressiveness by enabling the selective translation of oncogenic transcripts. However, whether CD138-associated tumor phenotypes are linked to such translational control programs remains largely unexplored.
In this study, we aimed to clarify the clinical significance of compartment-specific CD138 expression in invasive breast cancer and evaluate its potential as a prognostic biomarker. We classified tumors according to the immunohistochemical patterns of CD138 expression in the tumor epithelial and stromal compartments and assessed their associations with clinicopathological features and patient outcomes. To further investigate the biology underlying CD138-associated tumor states, we integrated this immunohistochemical classification with transcriptomic profiling using RNA-seq.
Through this integrative analysis, we identified snoRNAs and host genes associated with CD138-defined tumor states and explored the underlying translational regulatory pathways. This approach provides novel insights into the molecular programs associated with compartment-specific CD138 expression and highlights a potential link between cell-surface signaling and post-transcriptional regulation in breast cancer. Therefore, elucidating the connection between CD138 expression patterns and snoRNA-mediated regulatory networks may provide new insights into the molecular basis of tumor aggressiveness.

2. Materials and Methods

2.1. Patients and Tumor Specimens

A total of 111 invasive ductal carcinoma (IDC) specimens were obtained from patients who underwent surgical resection at our institution between January 2007 and October 2015. Tumors were classified according to the Union for International Cancer Control’s TNM classification system. Resected specimens were fixed in 10% neutral-buffered formalin and processed for routine histopathological examinations.
Estrogen receptor (ER), progesterone receptor (PgR), and human epidermal growth factor receptor 2 (HER2) statuses were determined in accordance with the American Society of Clinical Oncology/College of American Pathologists (ASCO/CAP) guidelines [19,20]. The Ki-67 labeling index was defined as the percentage of invasive tumor cells showing positive nuclear staining among the total number of tumor cells counted using MIB-1 (mouse monoclonal antibody; Dako).
Clinicopathological data, including age, tumor size (T stage), lymph node status (N stage), histological grade (HG), Ki-67 index, HR status, HER2 status, recurrence or metastasis, and adjuvant therapy, were collected from medical records (Table 1).

2.2. Immunohistochemistry

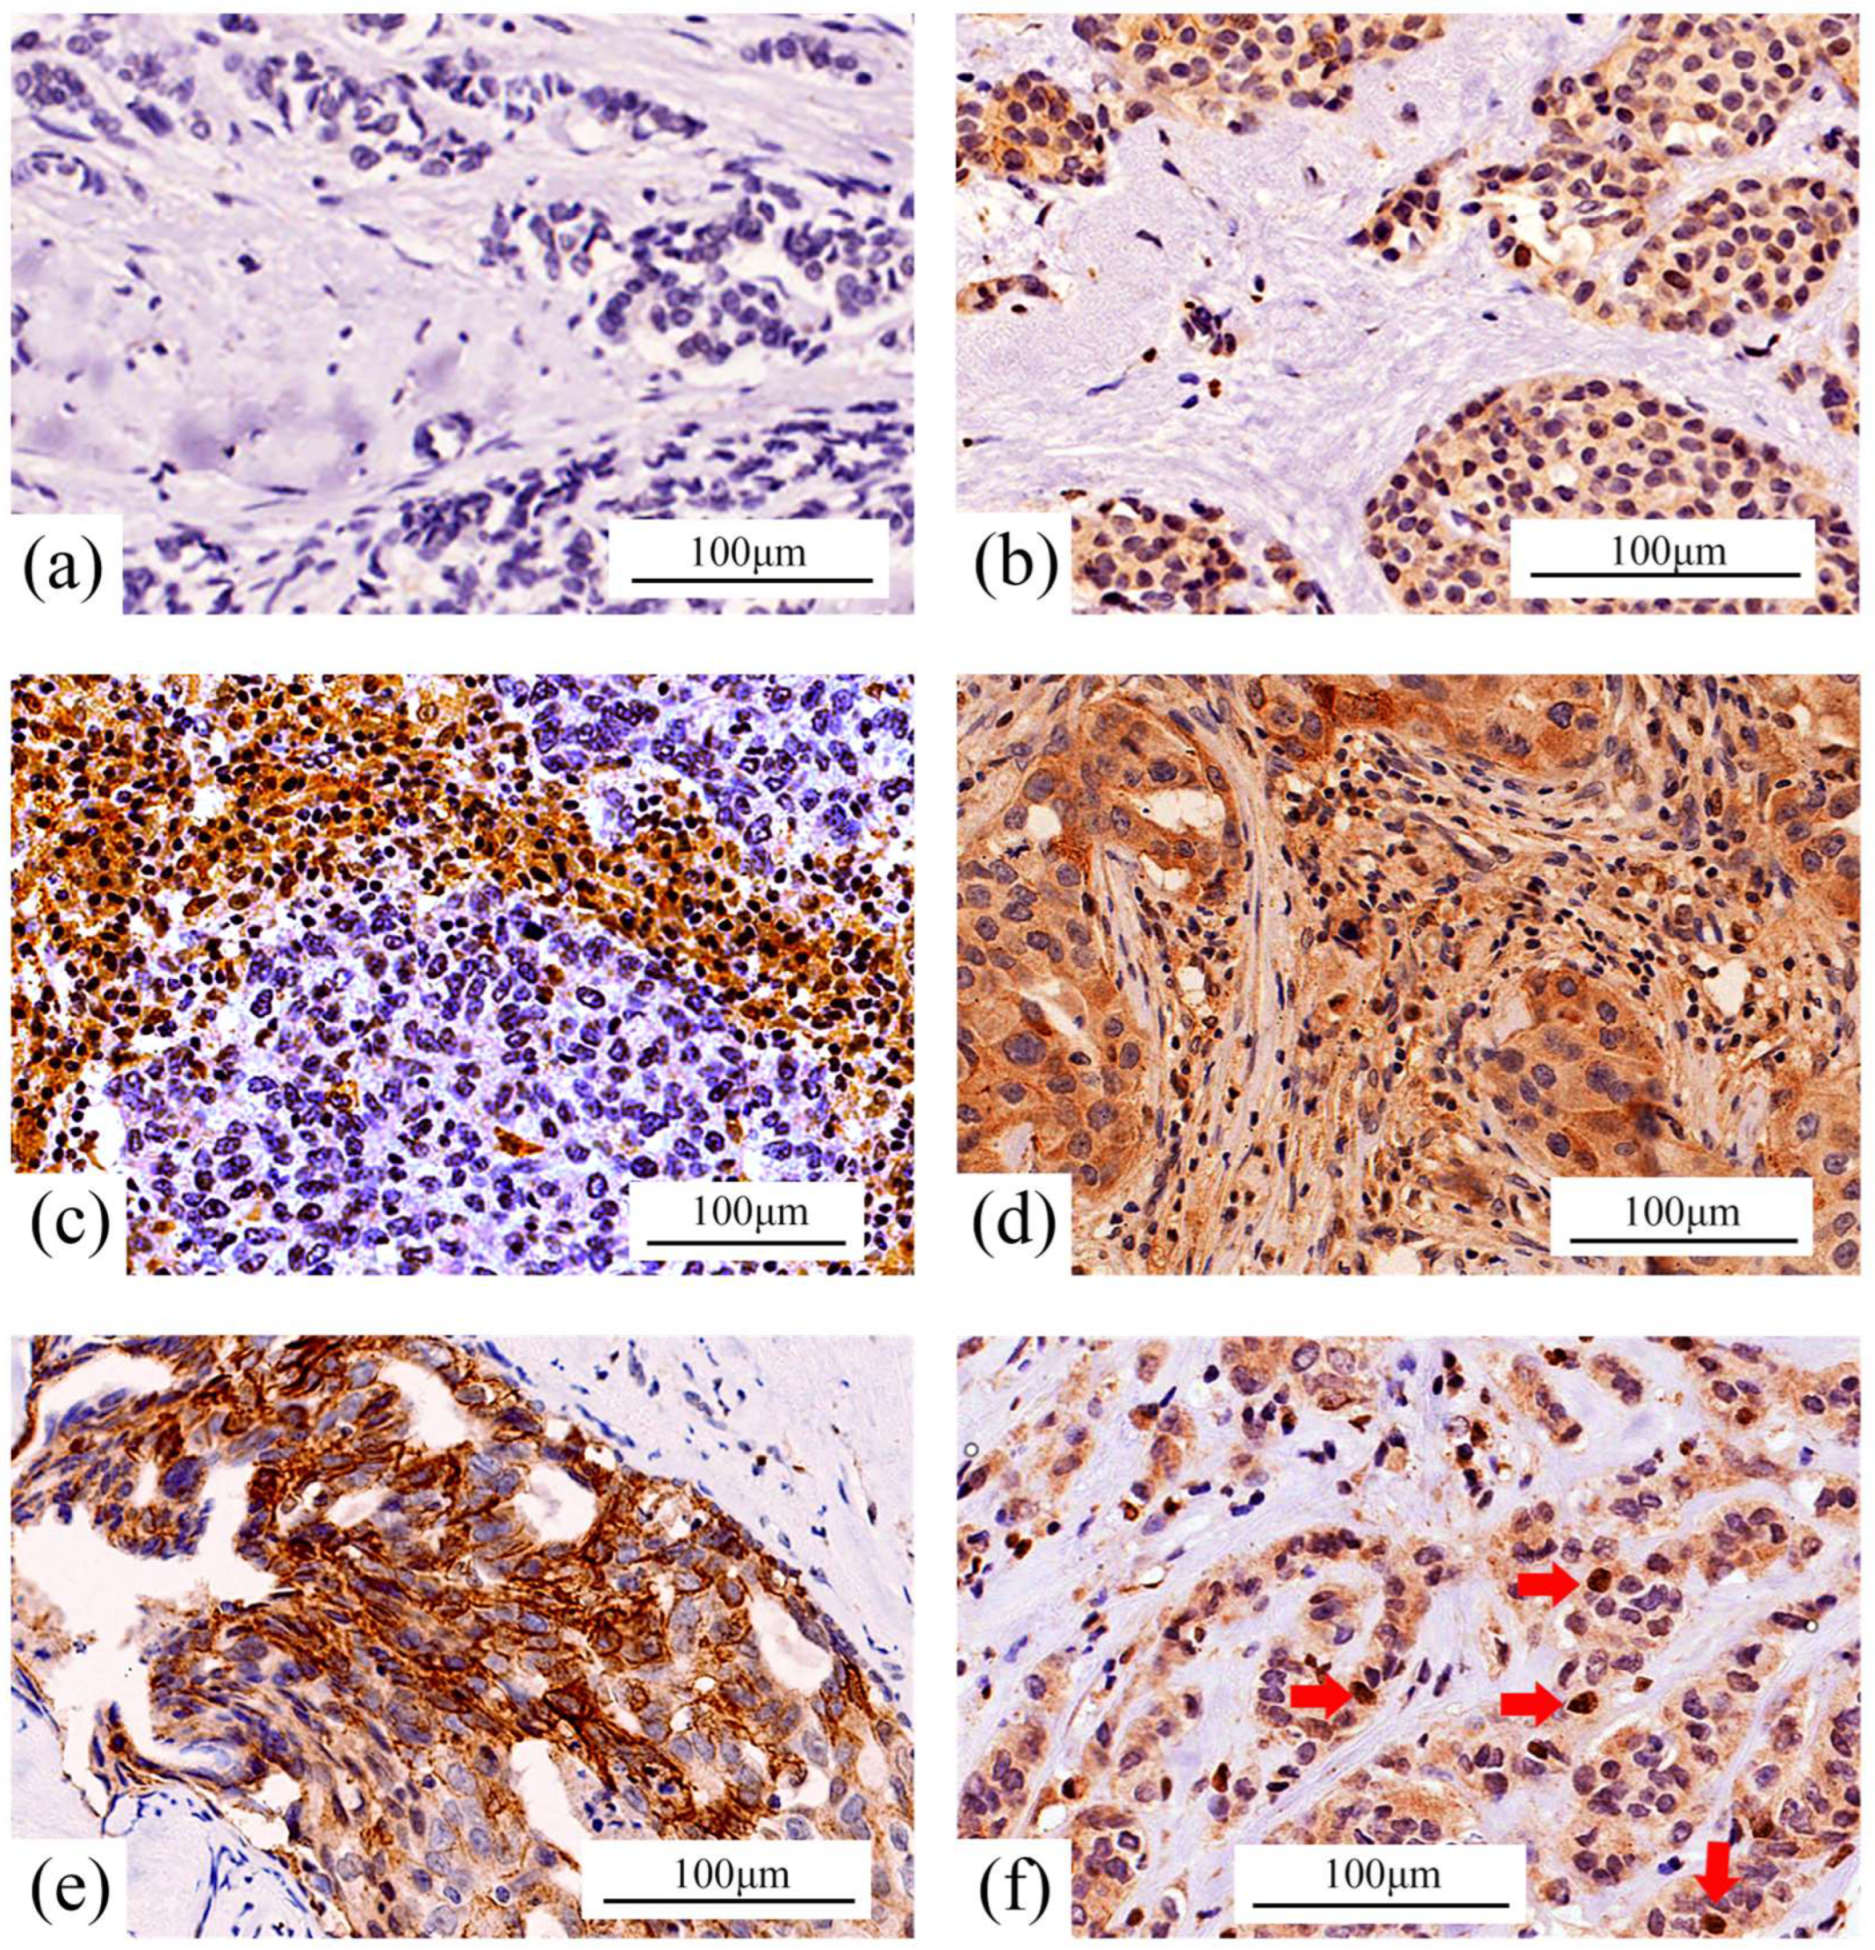
Immunohistochemical (IHC) staining was performed using a rabbit polyclonal anti-CD138 antibody (Proteintech; dilution 1:750), a Dako EnVision+ System-HRP-labeled polymer anti-rabbit secondary antibody, and a Dako Liquid DAB+ Substrate Chromogen System (Figure 1).
IHC staining for CD138 was independently evaluated by two experienced observers blinded to the clinicopathological data. Discrepant cases were jointly reviewed to reach a consensus.
CD138 expression was assessed separately in tumor epithelial cells and the stromal compartments. A semi-quantitative scoring system based on staining intensity and the proportion of positive cells/area was applied according to previously reported methods [21,22] and with reference to a tissue microarray-based scoring approach described by Lennartz et al. [23], with minor modifications.
The staining intensity was categorized as 0 (negative), 1+ (weak), 2+ (moderate), or 3+ (strong), and the proportion of positive tumor cells or the stromal area was recorded as a percentage (0–100%).
To define binary classification, the staining intensity scores were further evaluated using receiver operating characteristic (ROC) curve analysis to determine the optimal cutoff values. Based on this analysis, tumor cell expression was classified as negative (scores 0–1) or positive (scores 2–3), whereas stromal expression was classified as negative (score 0) or positive (scores 1–3). Accordingly, the tumors were categorized into four groups: Group 0 (tumor [−], stroma [−]), Group 1 (tumor [+], stroma [−]), Group 2 (tumor [−], stroma [+]), and Group 3 (tumor [+], stroma [+]).
The detailed criteria for the classification of CD138 expression are provided in Supplementary Table S1.
Based on the staining patterns (Table 2) observed in the tumor epithelial and stromal compartments, the cases were classified into four groups (Table 3).

2.3. RNA-Seq

A total of 111 breast cancer cases were included in the RNA-seq analysis. Of these, 17 cases from project PRJDB37924 were previously analyzed in an earlier study [25]. An additional 78 cases from the same project (PRJDB37924) were analyzed using the same protocol, and 16 newly sequenced cases (PRJDB40174) were included, yielding 111 samples for analysis.
For the 16 newly sequenced cases, total RNA was extracted from formalin-fixed paraffin-embedded (FFPE) tissue using the RNeasy FFPE Kit (QIAGEN, Hilden, Germany). The overall analytical pipeline followed the methodology described previously [25]. Gene expression levels were quantified as transcripts per million (TPM) for downstream analysis.
The gene expression values were log2-transformed as log2(TPM + 1). Genes with an absolute difference in the mean log2(TPM + 1) expression of ≥1 between groups and a p-value < 0.05 were defined as differentially expressed genes (DEGs). Differential expression analysis was performed across the CD138 expression groups defined in Table 3 to identify the CD138-associated RNAs.
Statistical thresholds were defined according to the purpose of each analysis. For the exploratory identification of DEGs, a threshold of p < 0.05 was applied to maintain sensitivity. For downstream analyses, including enrichment analysis, false discovery rate (FDR)-adjusted criteria were used to control for multiple testing.
A volcano plot was generated to visualize the distribution of differentially expressed RNAs, with log2 fold change and statistical significance.
The RNA-seq datasets analyzed in this study are publicly available in the DNA Data Bank of Japan Sequence Read Archive under the accession numbers PRJDB37924 and PRJDB40174.

2.4. Survival Analysis

Recurrence-free survival (RFS) was estimated using the Kaplan–Meier method. Patients were followed up from the date of surgery until the first documented recurrence or the date of their last follow-up. Recurrence or metastasis was defined as an event, whereas patients without recurrence were censored at their last follow-up.
To evaluate the relationship between transcript-level and protein-level CD138 expression, tumors were categorized according to CD138 transcript abundance derived from RNA-seq using TPM values. The cutoff value was determined using ROC analysis, with recurrence status as the classification endpoint. The association between the TPM-based CD138 expression groups and immunohistochemically defined CD138 expression groups was assessed using the chi-square test.

2.5. snoDB 2.0 Annotation and Host Gene Extraction

snoRNAs were annotated using the snoDB 2.0 database [26], and their corresponding host genes were identified. Host gene attributes, including box class (H/ACA or C/D), canonical rRNA modification sites, predicted modification type (pseudouridylation [Ψ] or 2′-O-methylation), and family or single-copy status, were retrieved from snoDB 2.0. Duplicate host genes were removed before enrichment analysis to avoid redundancy in the gene set.

2.6. Functional Enrichment Analysis

Functional enrichment analysis of DEGs was performed using the Database for Annotation, Visualization, and Integrated Discovery (DAVID) to identify enriched Gene Ontology (GO) Biological Process terms and Kyoto Encyclopedia of Genes and Genomes (KEGG) pathways.
Functional enrichment analysis of snoRNA host genes derived from CD138-associated transcriptomic signatures was performed using the clusterProfiler package in R [27]. GO Biological Process terms and KEGG pathways were evaluated using a complete set of human genes as a background reference. Multiple testing correction was performed using the Benjamini–Hochberg method, and an FDR of <0.05 was considered statistically significant.

2.7. CD138 ssGSEA Signature Scoring

A curated gene set representing the CD138-positive expression program was constructed from differentially expressed protein-coding genes identified between CD138-positive and CD138-negative tumors based on immunohistochemical classification. The CD138-positive gene signature comprised S100A7, CD24, and GLYATL2, which were upregulated in tumors with a CD138-positive phenotype. The CD138-negative signature included RERG, SLC39A6, NAT1, SCUBE2, PIP, NPY1R, SLC7A2, GRIA2, FSIP1, PTPRT, and SERPINA3, which were enriched in CD138-negative tumors.
Single-sample gene set enrichment analysis (ssGSEA) was performed using the GSVA package in R [28] on log2(TPM + 1)-transformed expression values derived from the RNA-seq dataset. ssGSEA computes an enrichment score for each sample based on the ranked expression levels of genes within a predefined gene set.
CD138-positive ssGSEA scores were used to estimate the activity of the CD138-associated transcriptional program in each tumor sample. Scores were compared among groups defined based on immunohistochemical CD138 expression patterns, and correlations with S100A7 and CD24 expression were evaluated.

2.8. Derivation of the snoRNA Module Score

snoRNAs significantly enriched in CD138-positive tumors (Group 1, tumor-positive/stroma-negative) were extracted to generate a snoRNA signature set. For each sample, the snoRNA module score was calculated as the mean TPM of all the snoRNAs included in the signature set.

2.9. Statistical Analysis

Differences in ssGSEA scores between groups were evaluated using the Mann–Whitney U test, and correlations between ssGSEA scores and transcript expression levels were assessed using Spearman rank correlation coefficients.
Associations between the CD138 expression groups and clinicopathological variables were evaluated using the chi-square test or the Fisher exact test, as appropriate. The Fisher exact test was applied when the expected cell count was <5. The analyzed variables included age (<40 years), tumor size (T stage), lymph node status (N stage), HG, Ki-67 index, HR status, HER2 status, brain metastasis, and adjuvant therapies (radiotherapy, chemotherapy, endocrine therapy, and anti-HER2 therapy).
RFS was analyzed using the Kaplan–Meier method, and differences between the groups were assessed using the log-rank test. Prognostic factors were evaluated using Cox proportional hazards regression. The multivariable models included age, tumor size (T stage), lymph node status (N stage), HG, Ki-67 index, HR status, HER2 status, CD138 expression group (Group 1), and treatment variables selected on the basis of clinical relevance and univariate results.
Continuous variables, including the ssGSEA and snoRNA module scores, were standardized to z-scores before multivariable modeling. The proportional hazards assumption was assessed using the Schoenfeld residuals. Model performance was evaluated using the concordance index (C-index).
All statistical tests were two-sided, and p-values < 0.05 were considered statistically significant. All analyses were performed using R software (v4.3.2).

3. Results

3.1. CD138 Immunohistochemical Expression Patterns and Clinical Classification

Immunohistochemical staining for CD138 revealed heterogeneous expression across the tumor epithelial and stromal compartments (Figure 1). The evaluation, conducted according to the criteria reported by Kind et al. [21] and Choi et al. [22] (Supplementary Table S1), is summarized in Table 2. When evaluated individually, membranous tumor cell expression, stromal expression, and nuclear tumor cell expression of CD138 were not significantly associated with RFS.
Although previous studies by Kind et al. [21] and Choi et al. [22] focused primarily on membranous and stromal expression, we also observed the nuclear localization of CD138 in a subset of tumor cells. Nuclear CD138 expression in breast cancer has rarely been described previously.
Based on the evaluation frameworks of Kind et al. [21] and Choi et al. [22], we classified the cases using an integrated tumor/stroma CD138 expression system (Table 3). Tumors were categorized into four groups: tumor-negative/stroma-negative (Group 0), tumor-positive/stroma-negative (Group 1), tumor-negative/stroma-positive (Group 2), and tumor-positive/stroma-positive (Group 3).
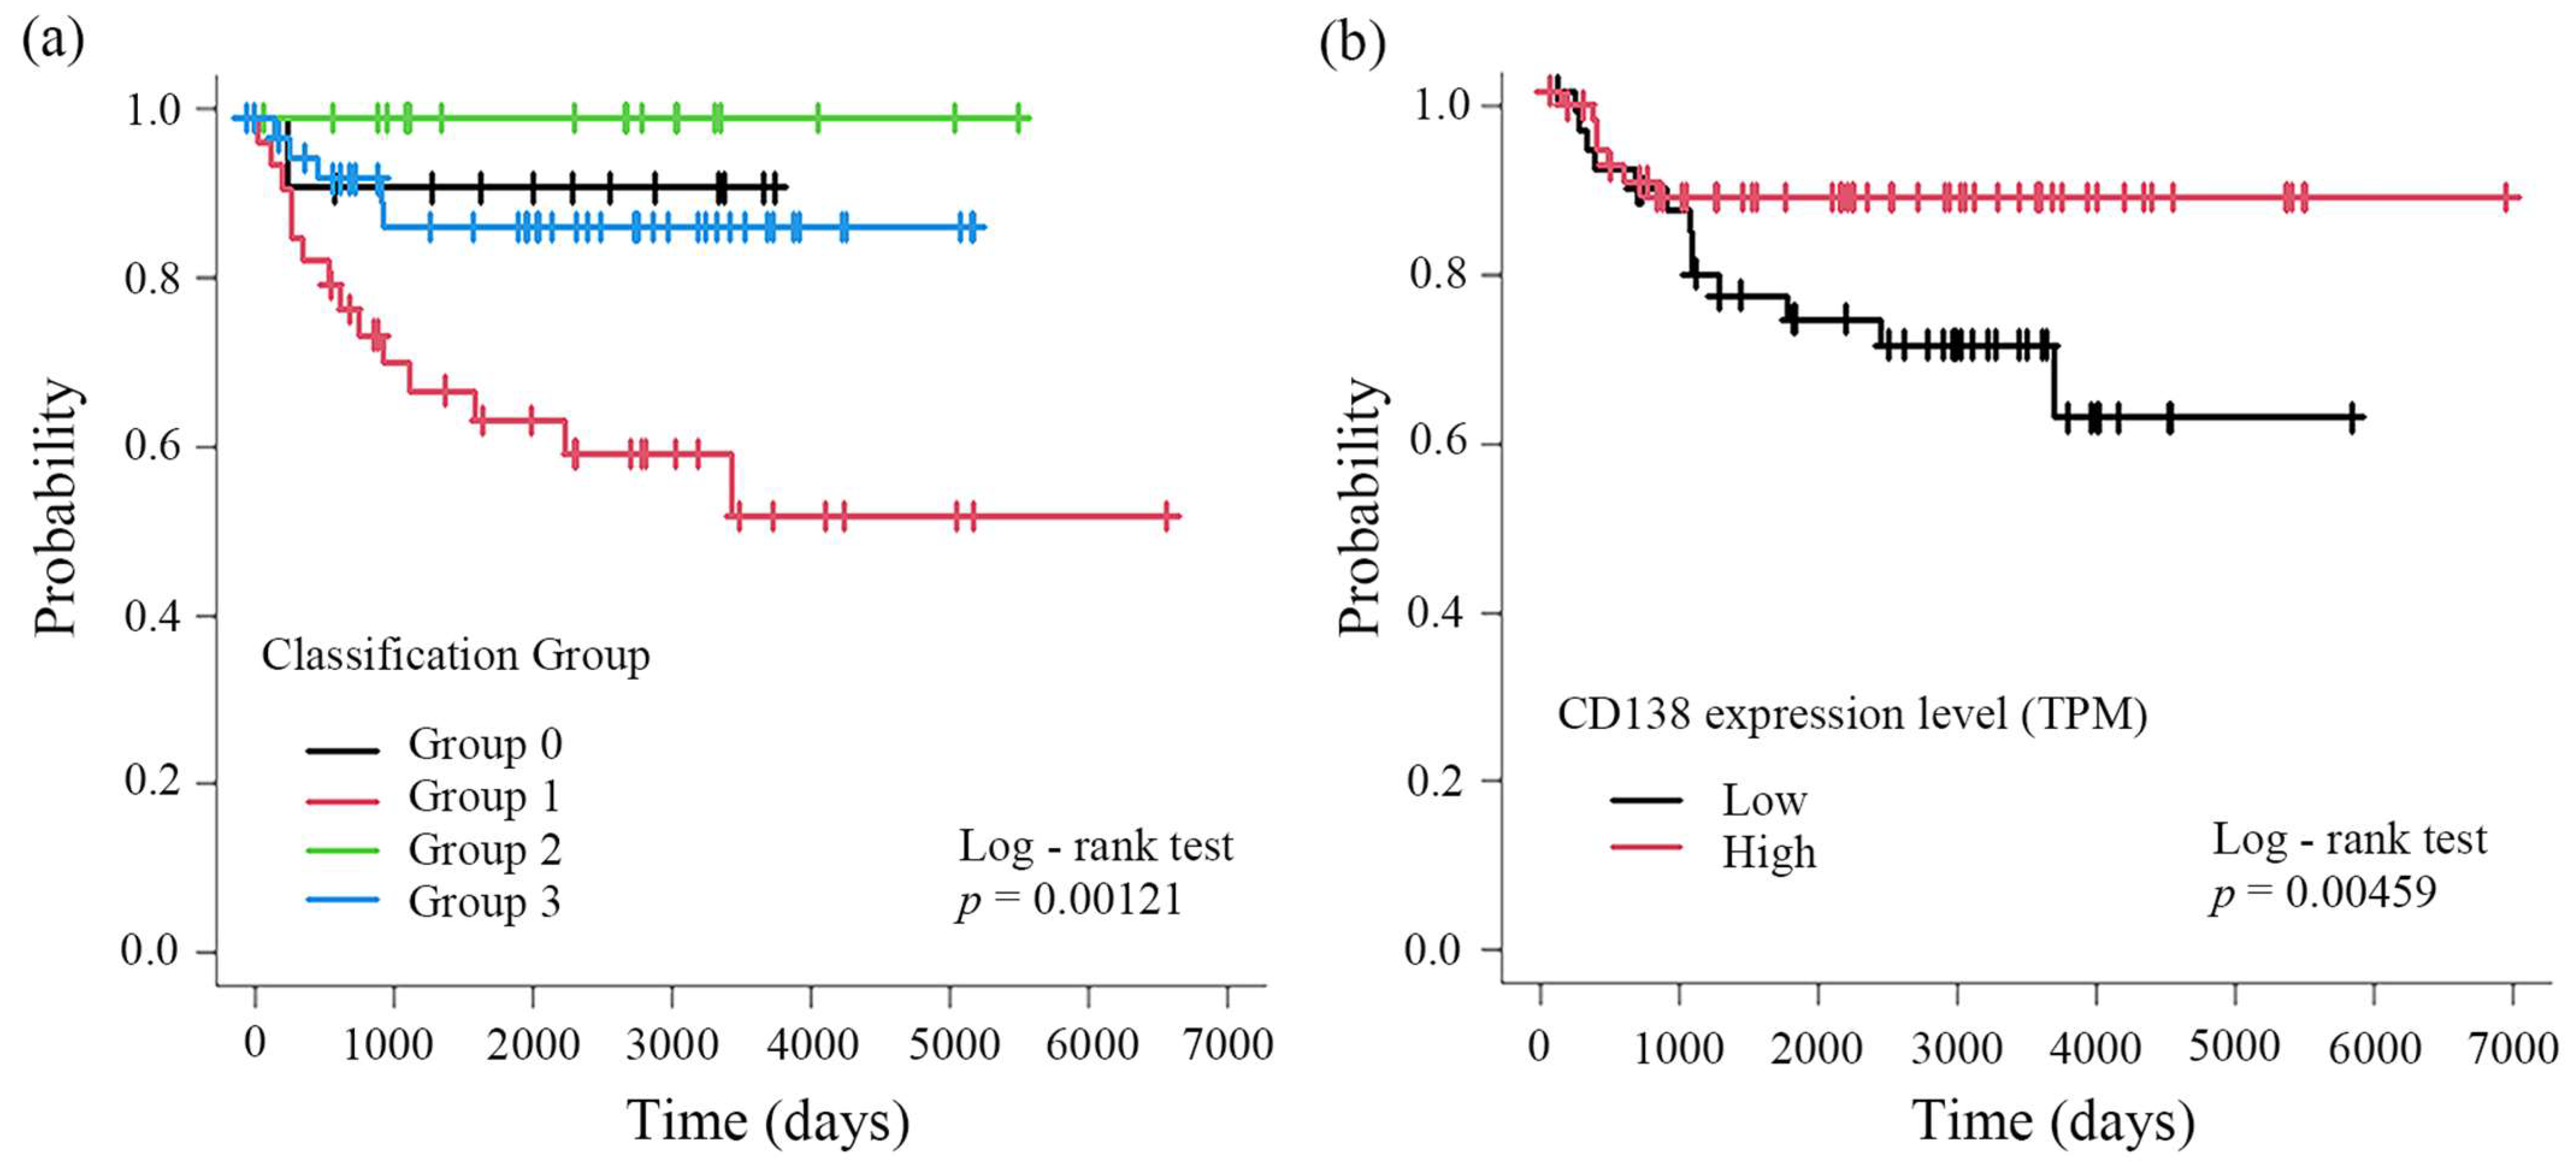
Kaplan–Meier survival analysis showed that Group 1 (tumor-positive/stroma-negative) had significantly poorer RFS than the other groups (Figure 2a). These findings indicate that RFS differs according to the compartment-specific CD138 expression pattern.
In contrast, Kaplan–Meier analysis based on CD138 transcript expression levels derived from RNA-seq [log2(TPM + 1)] showed that tumors with lower overall CD138 expression had significantly worse RFS (Figure 2b).
To evaluate the relationship between the CD138 IHC classification and transcript-level expression, a chi-square test was performed, and no significant association was observed (χ2 = 0.254, df = 3, p = 0.968) (Table 4).
This discrepancy between the immunohistochemical and transcript-level findings may reflect differences in the measurement approach. RNA-seq quantifies CD138 expression across the entire tumor tissue, including stromal components, whereas IHC permits compartment-specific discrimination between tumor epithelial and stromal cells. These results show that the prognostic association of CD138 expression differed according to the compartment in which it was expressed.

3.2. Identification of CD138-Associated Differentially Expressed RNAs

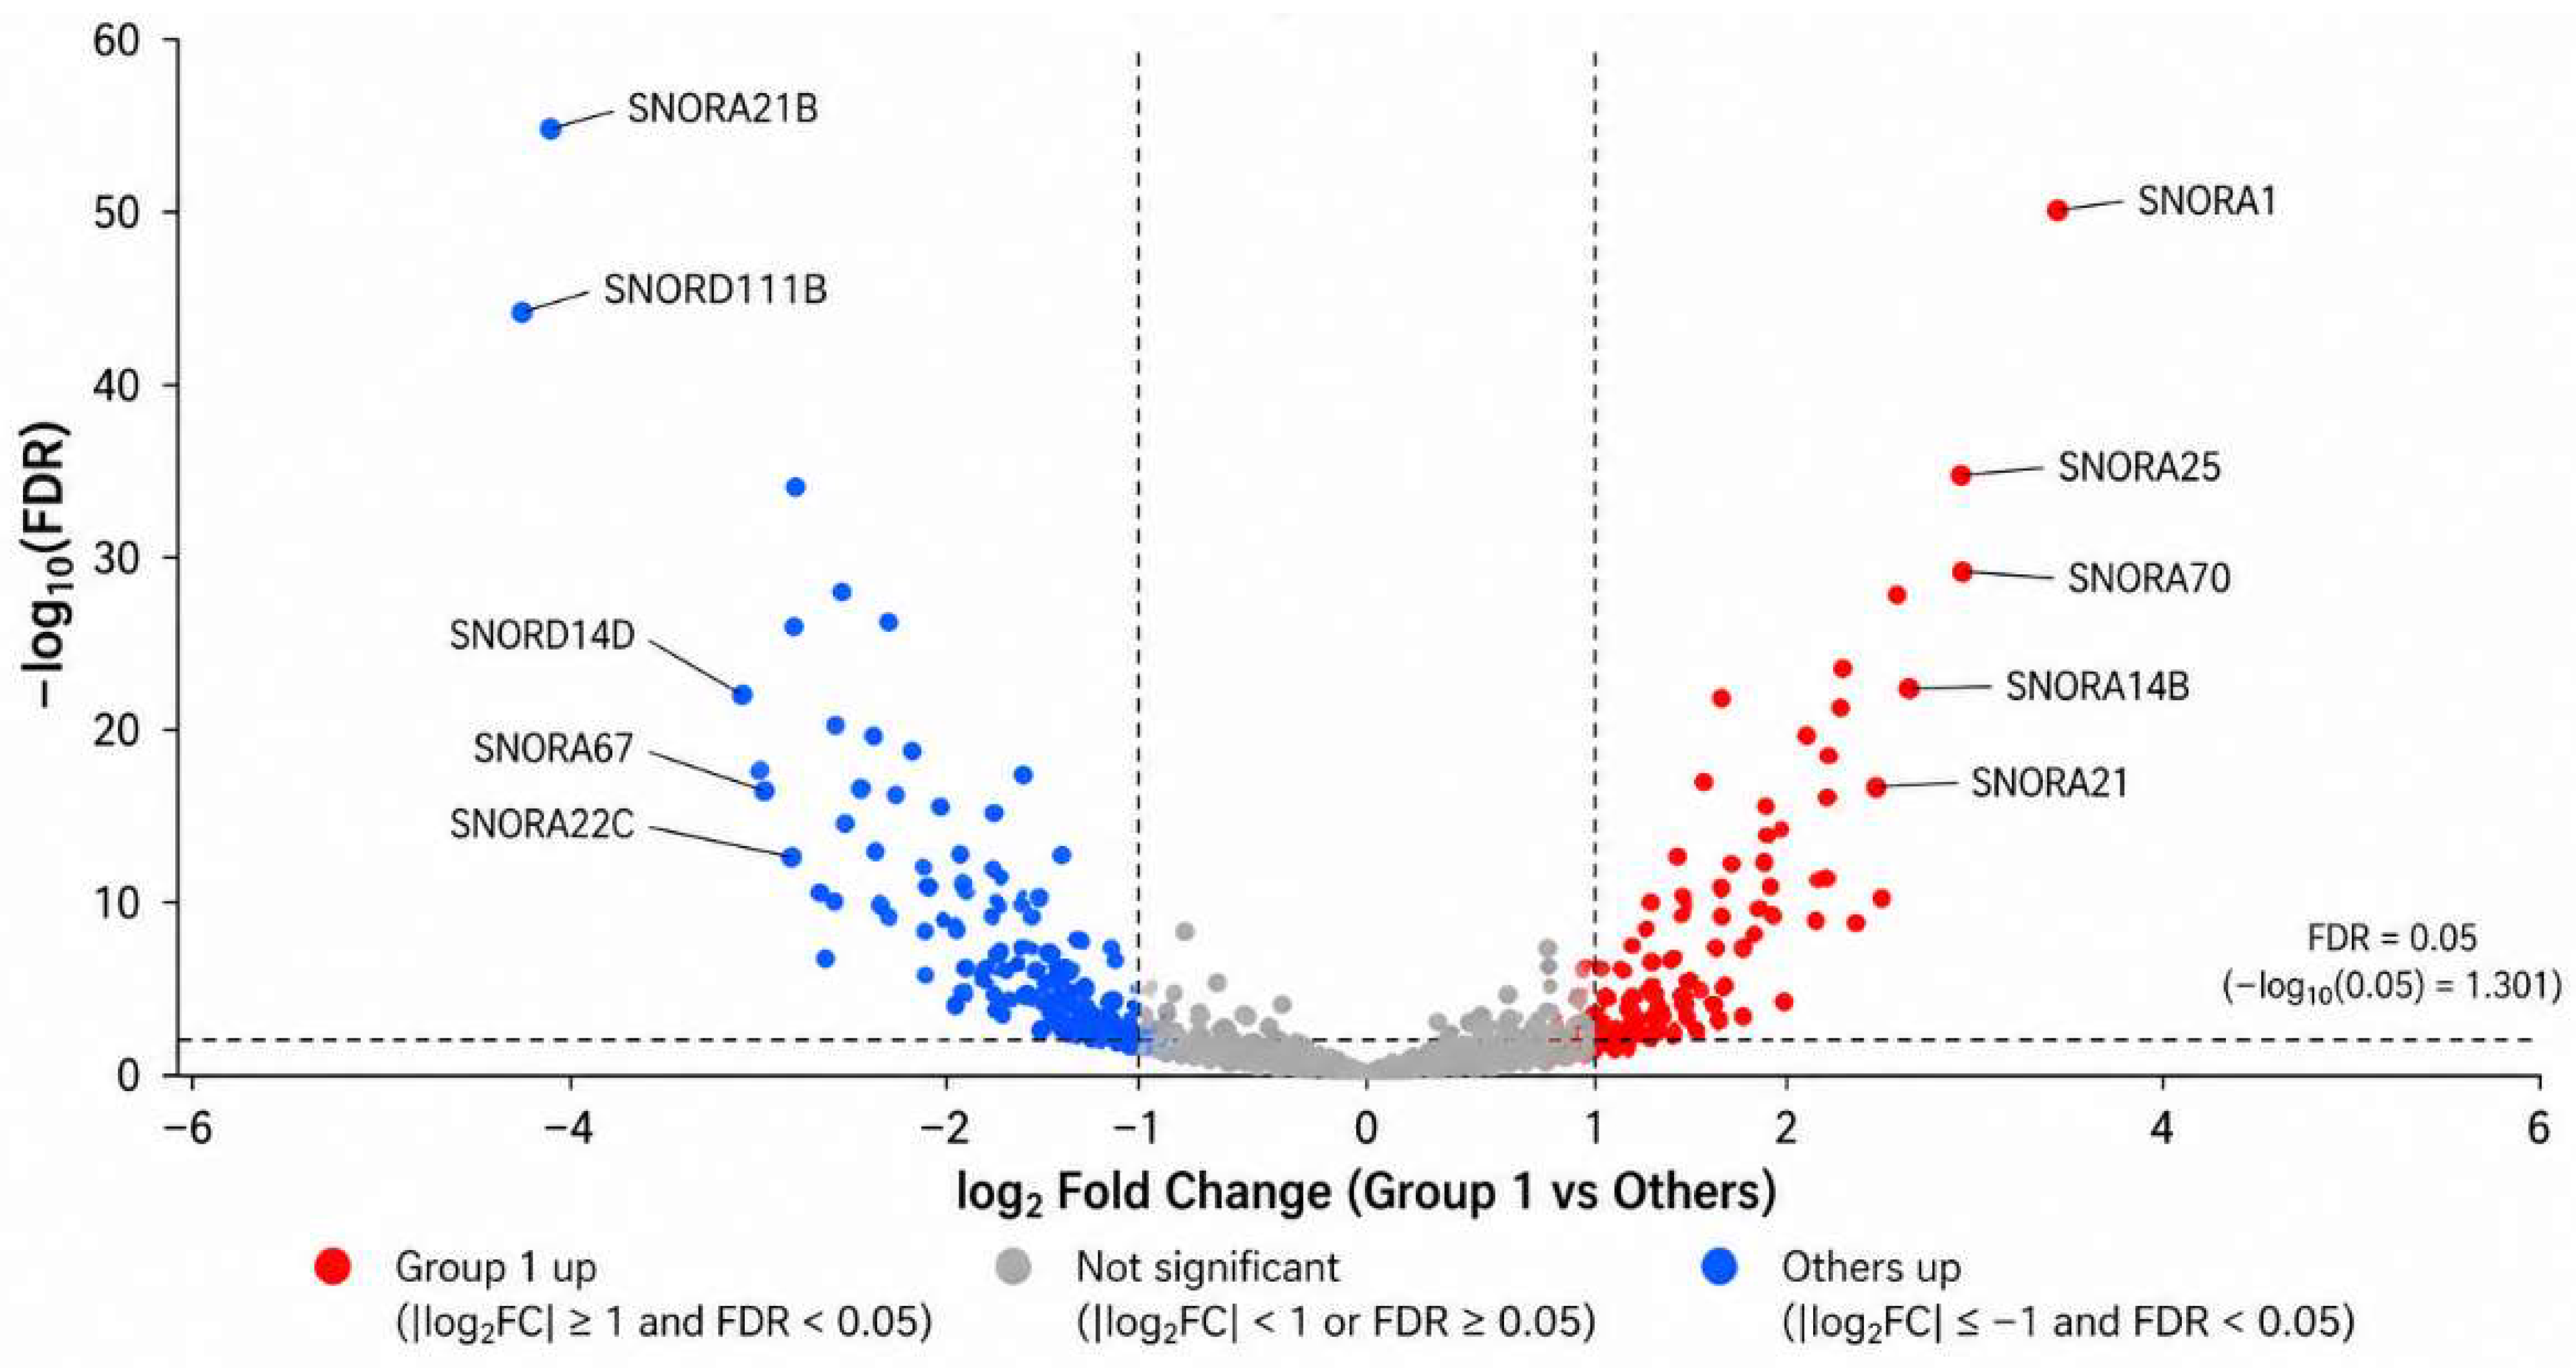
To provide an overview of the differential expression profile associated with CD138-defined tumor states, a volcano plot was generated (Figure 3). The plot illustrates the distribution of RNAs according to log2 fold change and statistical significance. Group 1 tumors exhibited a distinct expression pattern characterized by the upregulation of multiple snoRNAs and downregulation of various non-coding and protein-coding RNAs.
Differential expression analysis of RNA-seq data comparing Group 1 with Groups 0, 2, and 3 identified a set of RNAs associated with the tumor-positive/stroma-negative phenotype (Table 5).
Group 1 tumors showed significant upregulation of multiple snoRNAs, including SNORA21, SNORA1, SNORA25, SNORD14D, SNORA70, SNORA14B, SNORA22C, SNORD111, SNORD111B, SNORA21B, and SNORA67 (Table 5a). Among the protein-coding genes, S100A7, GLYATL2, and CD24 were significantly upregulated in Group 1 tumors (Table 5a). Several ncRNAs were significantly downregulated in Group 1 tumors (Table 5b). These included U3 snoRNA, multiple Y RNAs, and several signal recognition particle-related RNAs (Table 5b). Multiple antisense long non-coding RNAs (lncRNAs), including GATA3-AS1, PDCD4-AS1, and SIAH2-AS1, were also significantly decreased in Group 1 tumors (Table 5b). Among the protein-coding genes, SCUBE2, NAT1, RERG, and PIP showed significantly reduced expression in Group 1 tumors (Table 5b). Overall, the tumor-positive/stroma-negative phenotype was associated with the upregulation of multiple snoRNAs and downregulation of several non-coding and protein-coding RNAs.

3.3. Identification of CD138-Associated snoRNAs

S100A7 and CD24 were among the transcripts upregulated in Group 1 tumors [29,30,31,32]. These results indicate that the tumor-positive/stroma-negative CD138 expression pattern was associated with the differential expression of both protein-coding genes and snoRNAs.

3.4. Functional Annotation of snoRNA Host Genes

Differentially expressed snoRNAs were annotated using the snoDB 2.0 database. The log2 fold change (logFC) and FDR from the differential expression analysis conducted for each snoRNA are shown in Table 6. Annotation using snoDB 2.0 identified the corresponding protein-coding host genes for the differentially expressed snoRNAs. These snoRNAs belong to both the H/ACA box and C/D box subclasses and are associated with diverse rRNA modification targets, including pseudouridylation and 2′-O-methylation sites.
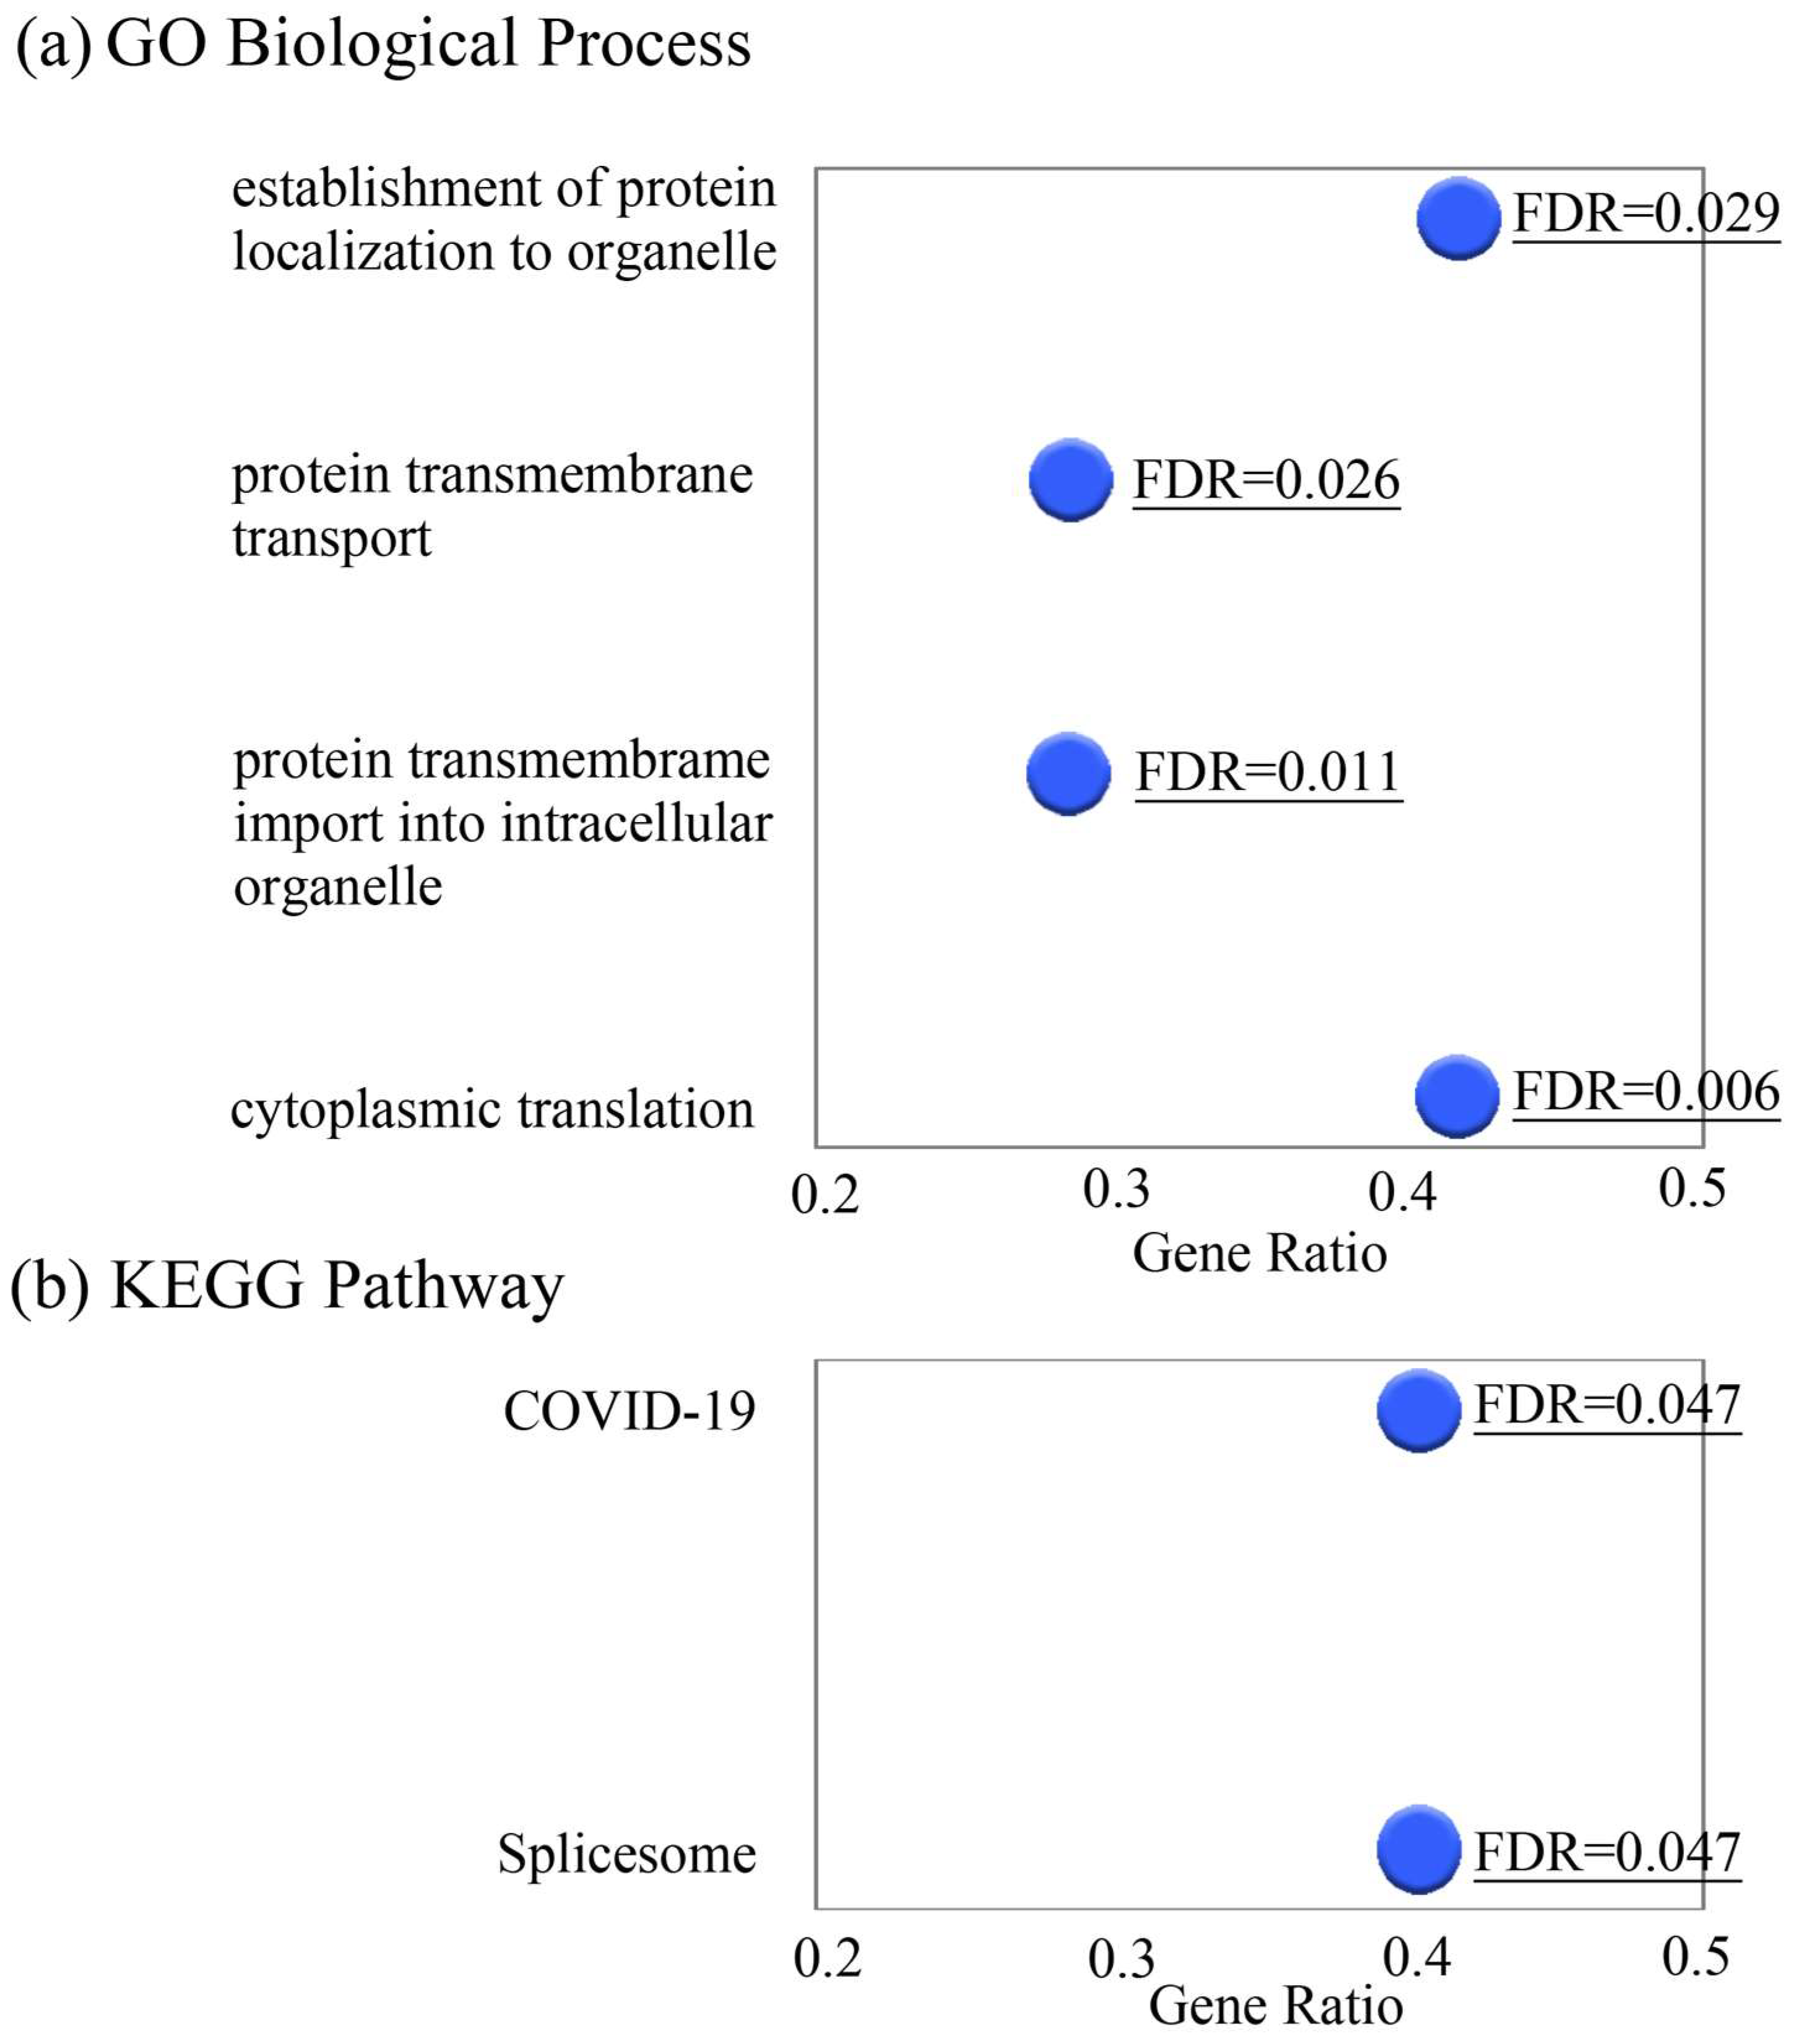
Several snoRNAs belong to paralogous gene families with multiple genomic copies. GO and KEGG pathway enrichment analyses of snoRNA host genes showed significant enrichment of pathways related to ribonucleoprotein complex biogenesis, RNA processing, translational regulation, and spliceosome function (Figure 4).
Overall, Group 1 tumors showed enrichment in snoRNA-associated pathways related to ribosome biogenesis, RNA processing, and translational control. These findings indicate that compartment-specific CD138 expression is associated with a distinct transcriptomic profile.

3.5. Quantification of the CD138-Associated Transcriptional Program

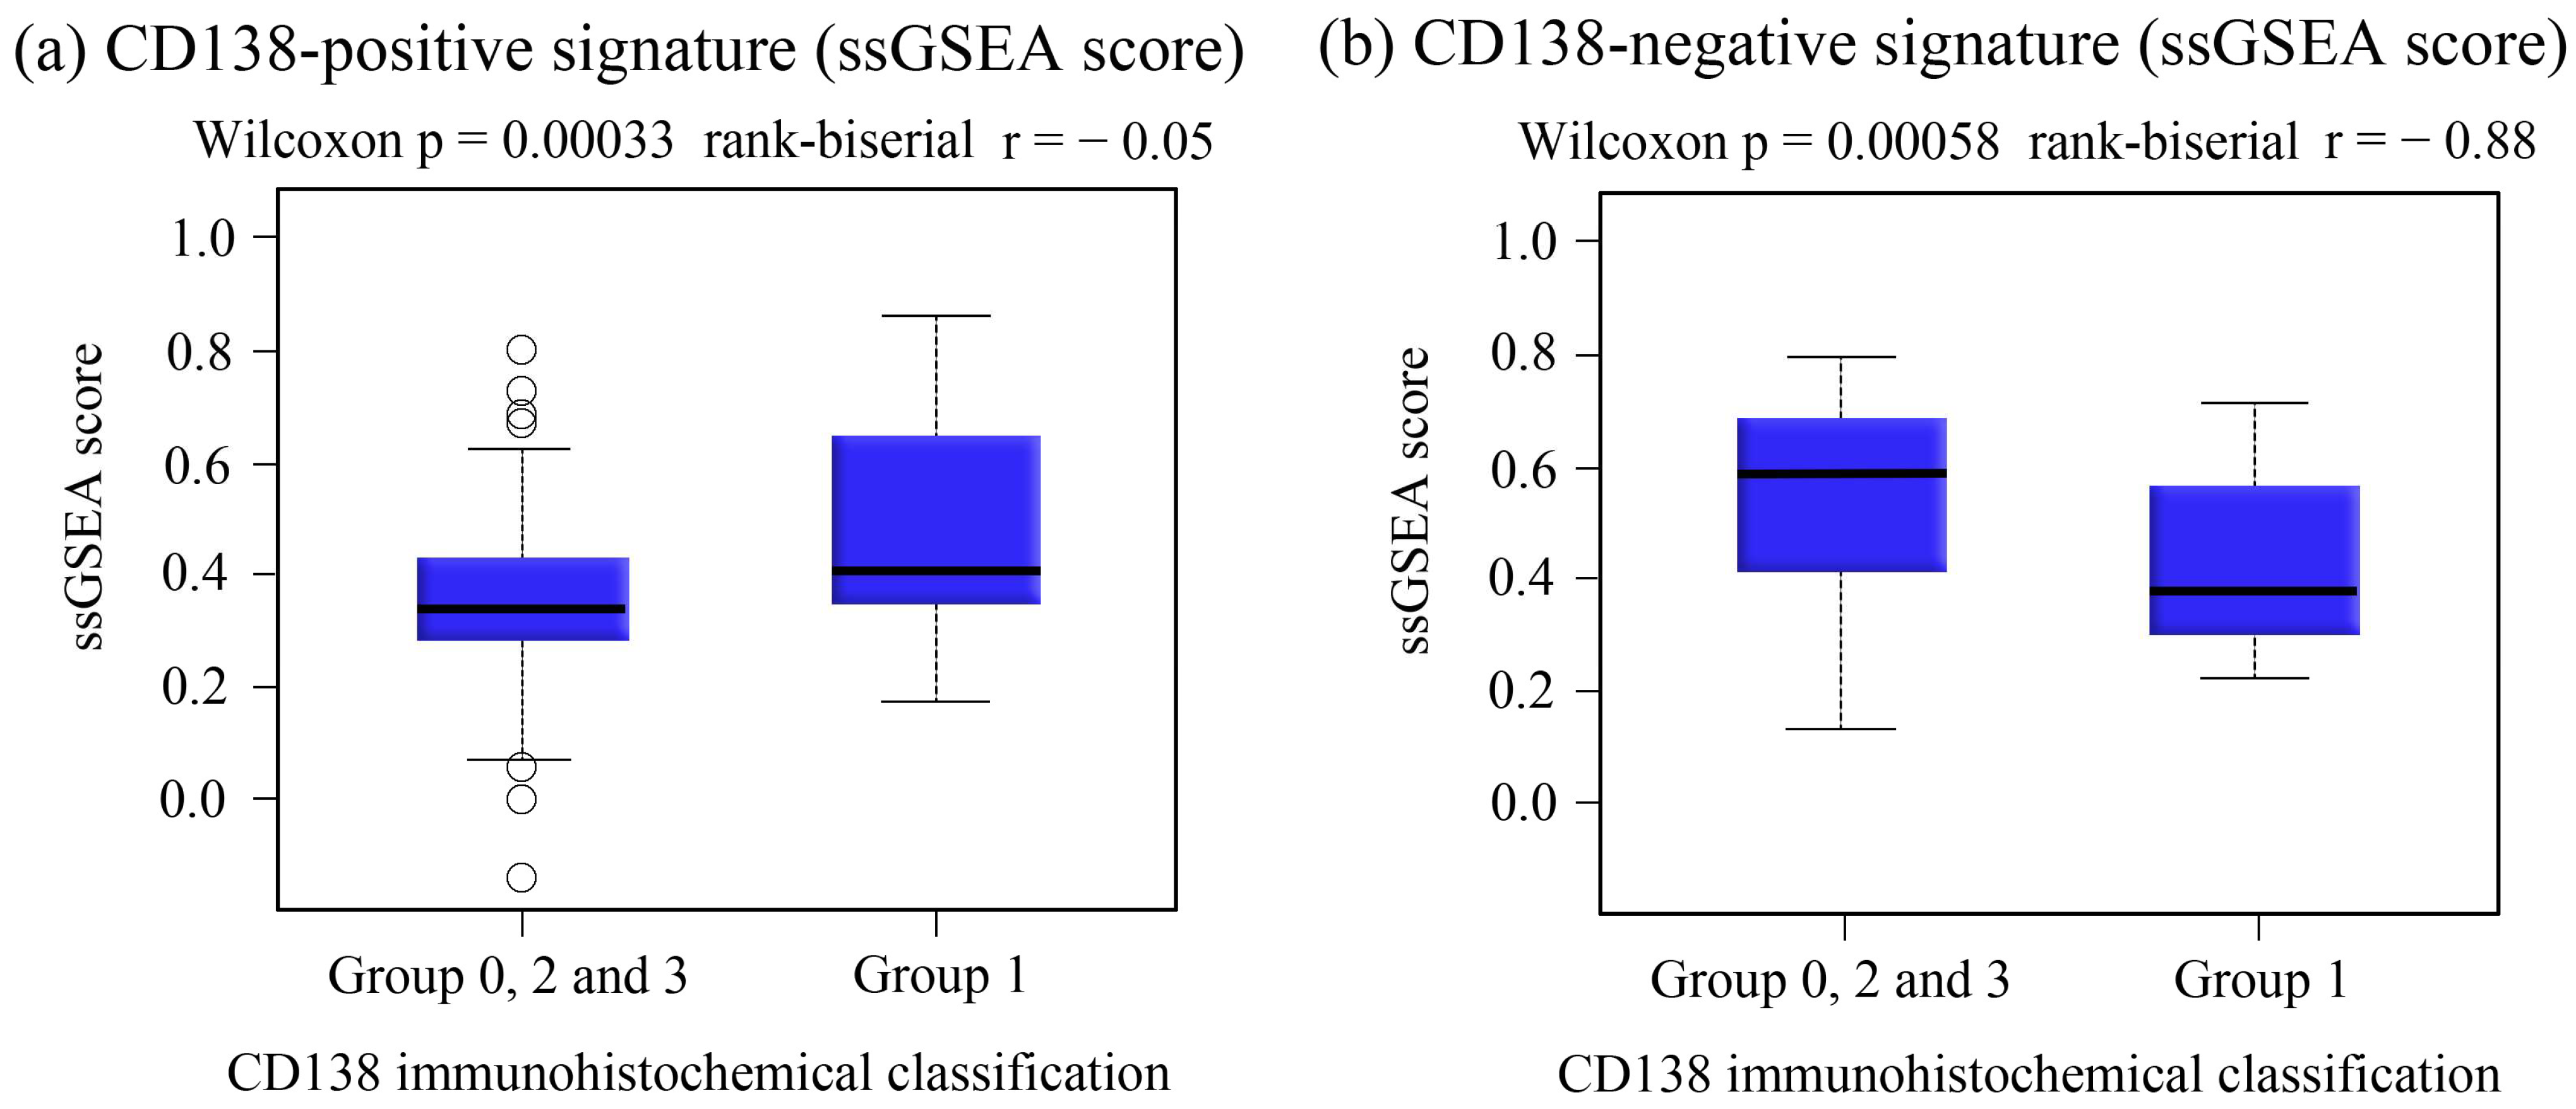
To evaluate the transcriptional state associated with CD138 expression, we calculated an ssGSEA-based CD138 signature from the tumor RNA-seq profiles. The snoRNA module score derived from CD138-associated snoRNAs also differed among the groups and was significantly higher in Group 1 tumors (tumor-positive/stroma-negative) (Figure 5). These results indicate that Group 1 tumors had higher CD138-related transcriptional and snoRNA module scores.

3.6. Association Between the CD138 Signature and Gene Expression Markers

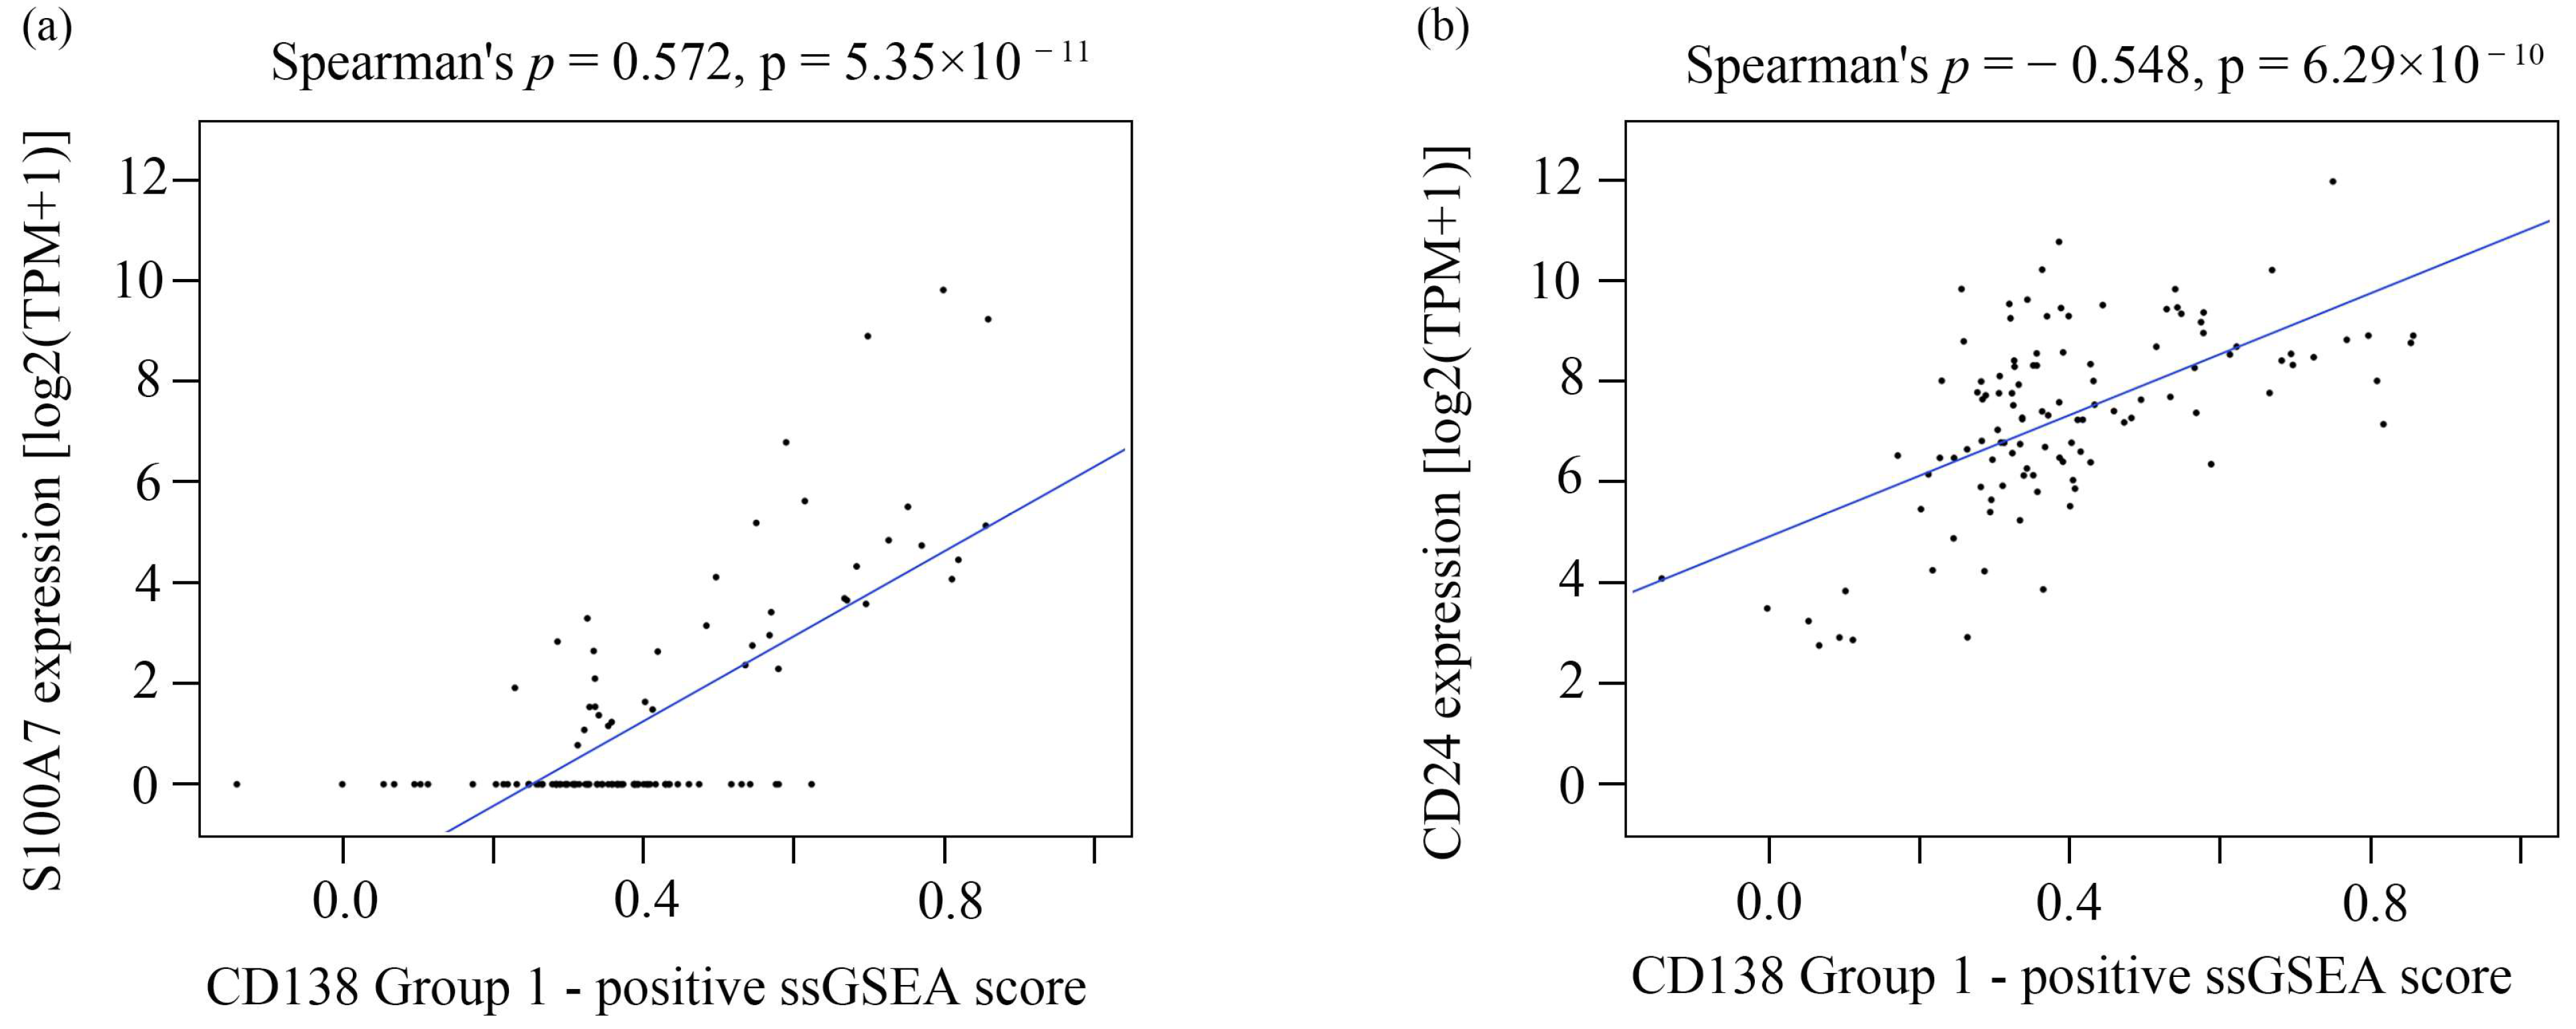
Spearman correlation analysis showed positive correlations between the Group 1 signature score and S100A7 expression (Spearman ρ = 0.572, p = 5.35 × 10⁻¹¹) and between the Group 1 signature score and CD24 expression (Spearman ρ = 0.548, p = 6.29 × 10⁻¹⁰) (Figure 6). These findings indicate that the CD138-positive signature score was positively correlated with S100A7 and CD24 expression.

3.7. Relationship Between CD138 Transcriptional Activity and the snoRNA Program

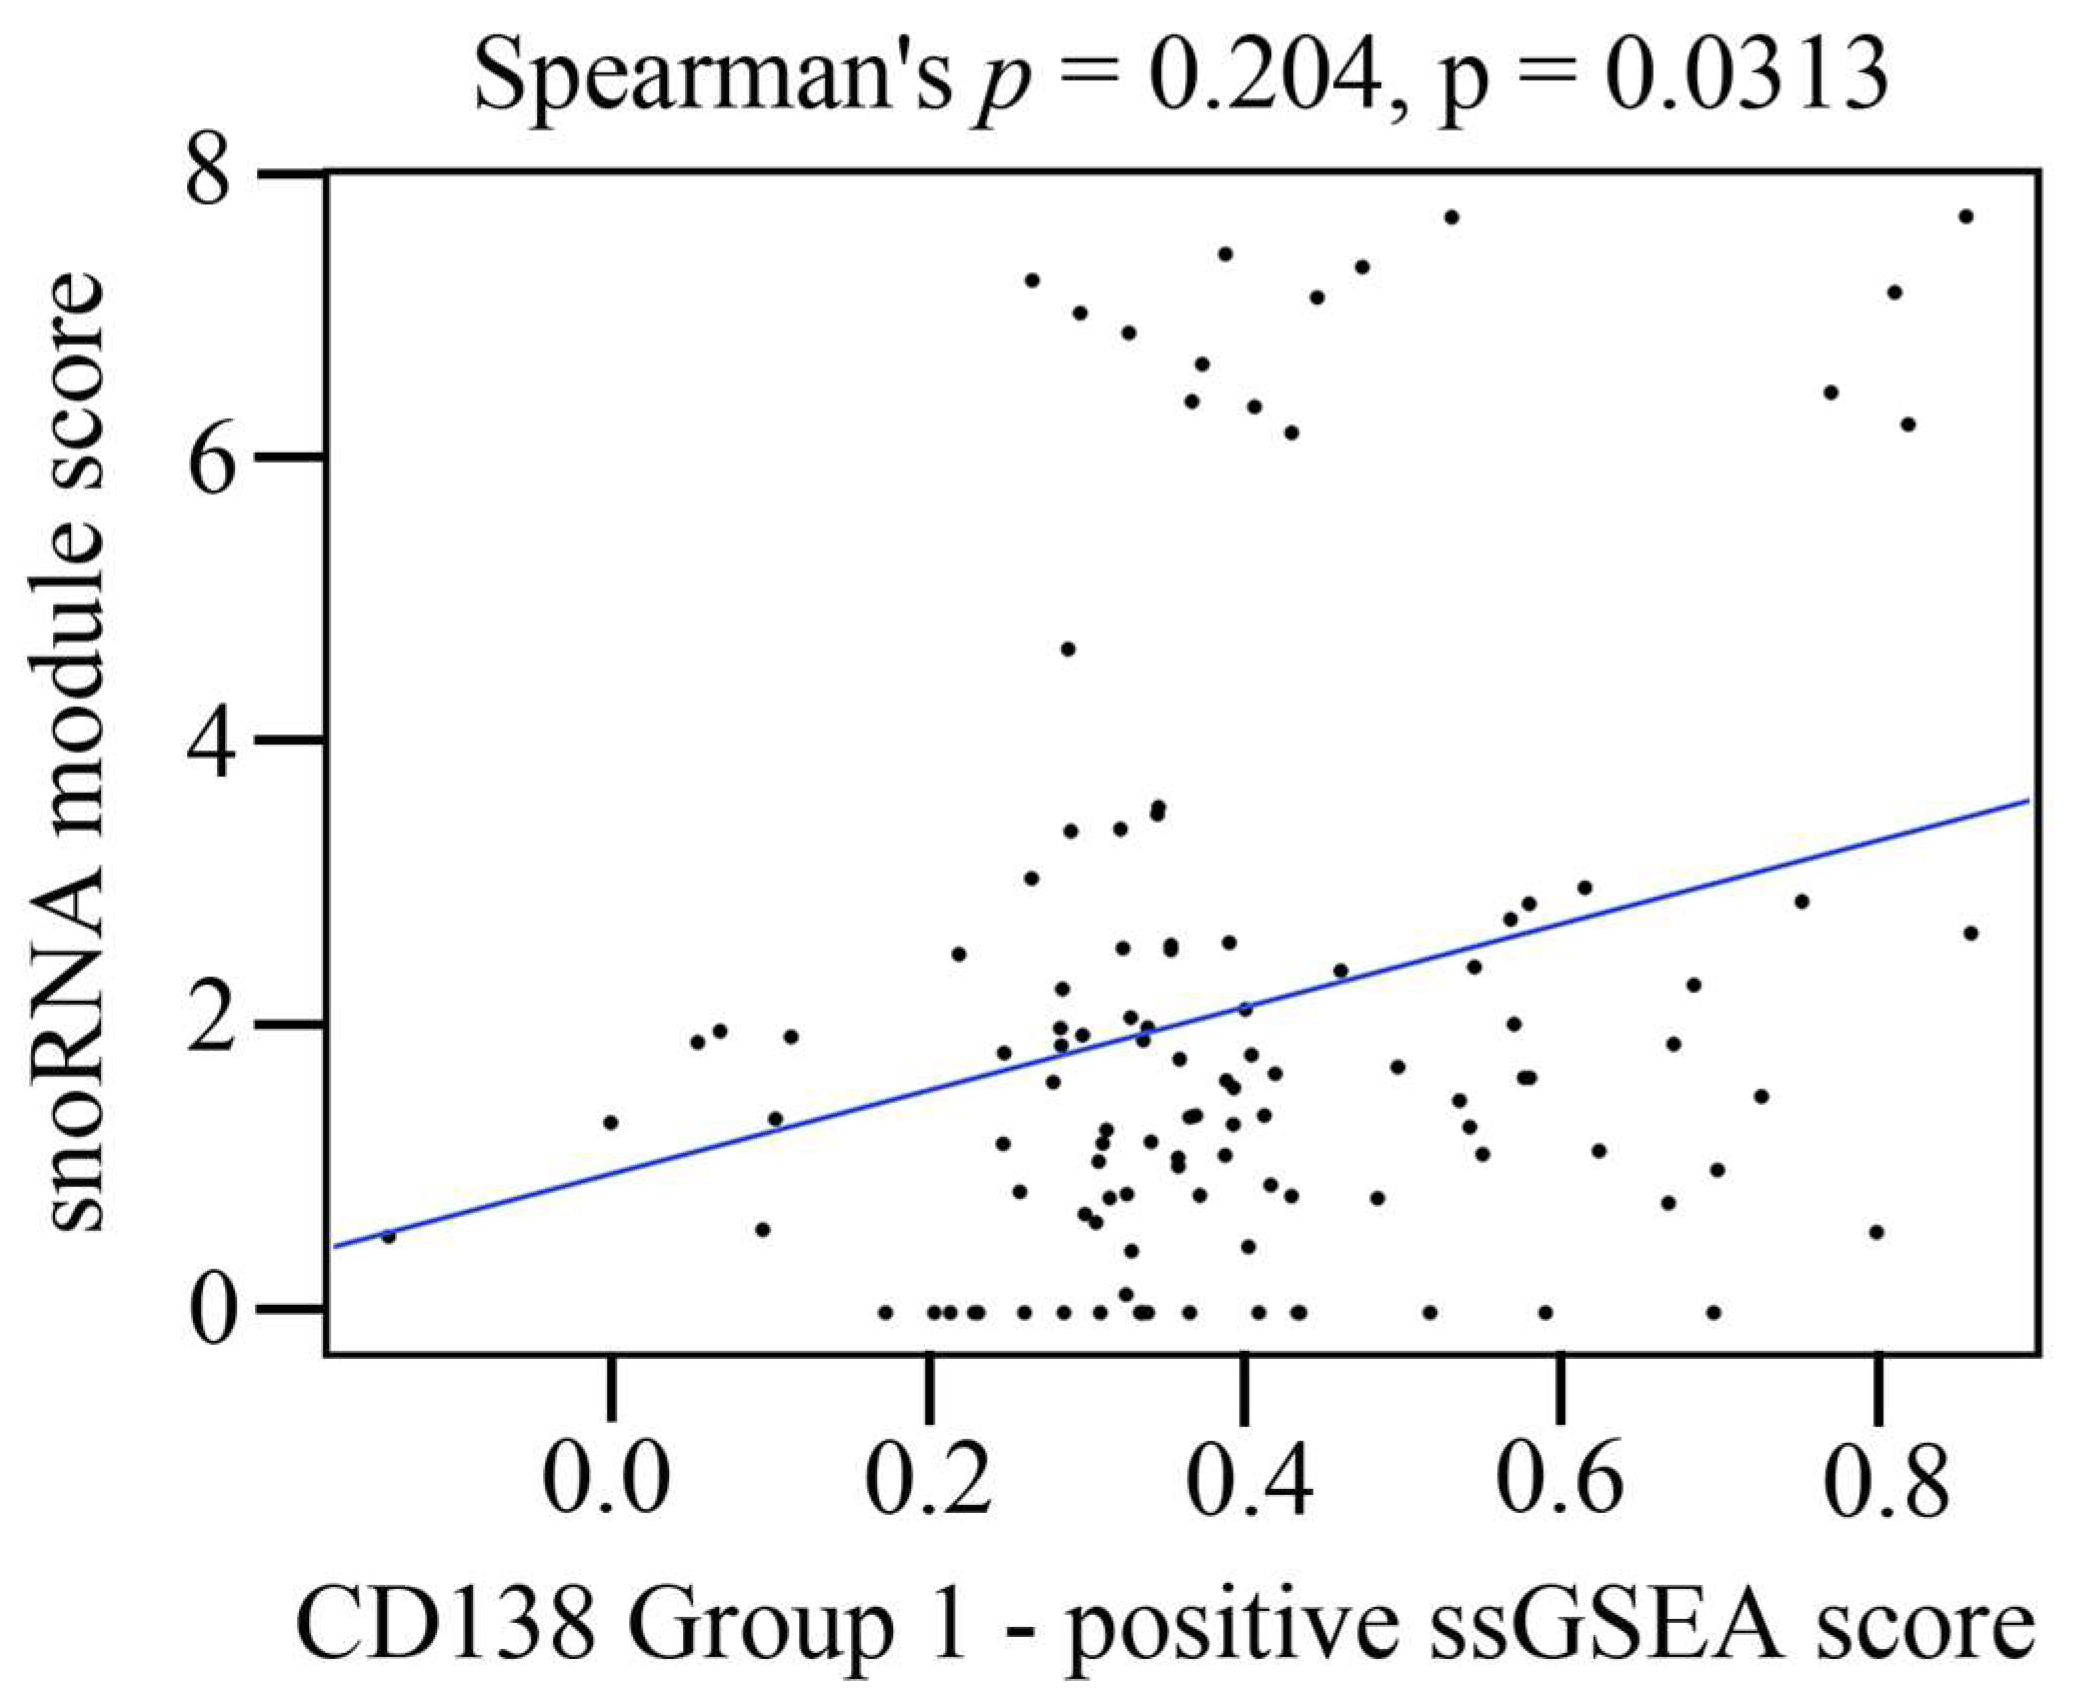
The snoRNA module score was positively correlated with the CD138-positive ssGSEA score (Figure 7). This association indicates that higher CD138 signature scores co-occurred with higher snoRNA module scores.

3.8. Association Between Group 1 CD138 Expression Group and Clinicopathological Factors

Next, we examined the association between Group 1 CD138 expression status and clinicopathological variables (Table 7).
Group 1 was significantly associated with several adverse clinicopathological features. HER2 positivity was more frequently observed in Group 1 than in the other groups (40.0% vs. 13.2%, p = 0.002). Anti-HER2 therapy was administered more frequently in Group 1 than in the other groups (28.6% vs. 7.9%, p = 0.001). Lymph node metastasis was also more common in Group 1 than in the other groups (48.6% vs. 19.7%, p < 0.001).
Among the 111 patients, four developed brain metastases, and all four cases belonged to Group 1. Brain metastases were observed only in Group 1 and were significantly associated with CD138 expression status (11.4% vs. 0%, p = 0.0098; Fisher exact test).
A high HG was more frequent in Group 1 than in the other groups (48.6% vs. 31.6%, p = 0.036), whereas HR positivity was lower (51.4% vs. 71.1%, p = 0.044).
The results for tumor size (T stage), Ki-67 index, transcript-level CD138 expression (TPM), chemotherapy, and radiotherapy did not differ significantly between Group 1 and the other groups.
Overall, Group 1 was associated with HER2 positivity, lymph node metastasis, high HG, low HR positivity, and brain metastases.

3.9. Prognostic Impact of Clinicopathological Factors and CD138 Expression

To evaluate the prognostic factors associated with RFS, univariable and multivariable Cox proportional hazards analyses were performed (Table 8).
In the univariable analysis, younger age (HR = 0.273, 95% CI: 0.099–0.752, p = 0.012), advanced tumor size (T stage) (HR = 3.882, 95% CI: 1.518–9.927, p = 0.0046), lymph node metastasis (N stage) (HR = 4.581, 95% CI: 1.954–10.74, p < 0.001), a high Ki-67 index (HR = 3.025, 95% CI: 1.020–8.969, p = 0.046), and the CD138 tumor-positive/stroma-negative phenotype (Group 1) (HR = 4.877, 95% CI: 1.994–11.93, p < 0.001) were associated with worse RFS. Endocrine therapy was associated with better RFS in the univariable analysis (HR = 0.393, 95% CI: 0.165–0.937, p = 0.035).
In the multivariable analysis, lymph node metastasis (HR = 4.763, 95% CI: 1.717–13.21, p = 0.0027), a high Ki-67 index (HR = 3.789, 95% CI: 1.052–13.65, p = 0.0416), and the CD138 tumor-positive/stroma-negative phenotype (Group 1) (HR = 6.13, 95% CI: 2.081–18.06, p = 0.0010) remained independently associated with worse RFS.
Tumor size, HG, HR status, HER2 status, and treatment variables were not independently associated with RFS in the multivariable model.
The CD138 tumor-positive/stroma-negative phenotype remained independently associated with recurrence after adjusting for lymph node status and Ki-67 index. These findings indicate that compartment-specific CD138 expression is associated with RFS after adjustment for conventional clinicopathological factors.
Overall, the tumor-positive/stroma-negative CD138 phenotype was independently associated with worse RFS in this cohort.

4. Discussion

Breast cancer is a biologically heterogeneous disease shaped by both tumor cell-intrinsic programs and dynamic interactions with the tumor microenvironment [2,33]. In this study, compartment-specific CD138 expression identified a clinically distinct subgroup of invasive breast cancer associated with poor RFS and transcriptomic features related to snoRNA expression, RNA processing, and translational regulation. The tumor-positive/stroma-negative CD138 phenotype (Group 1) remained independently associated with poorer RFS after adjusting for lymph node status and Ki-67 index.
An important observation of this study is that CD138 expression in the tumor and stromal compartments should be interpreted together rather than in isolation. Previous studies have often evaluated CD138 positivity in either tumor cells or stromal cells alone, which may have contributed to the identification of inconsistent prognostic findings. By integrating tumor and stromal CD138 expression into a single classification framework, we identified a subgroup characterized by tumor-positive/stroma-negative expression, which was associated with worse clinical outcomes. These findings raise the possibility that stromal and tumor cell CD138 expression have different biological and prognostic associations. Kind et al. reported associations between combined tumor–stromal CD138 expression and unfavorable clinicopathological features [21]. Our findings further suggest that the spatial distribution of CD138 expression may be more informative than overall positivity.
Transcript-level analysis showed that lower CD138 mRNA expression was associated with a poorer prognosis but did not correlate with the immunohistochemically defined Group 1 phenotype. This discrepancy suggests that transcript-level CD138 expression and spatial protein expression capture different aspects of tumor biology and supports the value of using compartment-specific protein assessment when investigating tumor microenvironment-related biomarkers.
CD138 is a transmembrane heparan sulfate proteoglycan involved in growth factor signaling, ECM organization, and cell–cell communication. In stromal fibroblasts, CD138 contributes to ECM integrity and cell adhesion through interactions with ECM components and may influence tumor cell motility and invasion [34,35]. CD138 has also been reported to regulate focal adhesion dynamics and cell migration through its interactions with ECM ligands and growth factors [35,36]. Reduced stromal CD138 expression may alter the structural and signaling integrity within the tumor microenvironment and potentially facilitate tumor invasion and recurrence [36]. Conversely, persistent CD138 expression in tumor cells may enhance growth factor signaling by retaining ligands such as VEGF fibroblast growth factor (FGF), hepatocyte growth factor (HGF), and vascular endothelial growth factor (VEGF) through heparan sulfate chains, promoting the activation of the MAPK and PI3K/Akt pathways [36].
At the transcriptomic level, Group 1 tumors showed enrichment of multiple snoRNAs belonging to both the H/ACA and C/D box subclasses, linked to diverse rRNA modification sites. These findings are consistent with the alterations in rRNA-related regulatory programs identified in Group 1 tumors. Although snoRNAs were historically viewed as housekeeping factors involved in ribosome biogenesis, accumulating evidence indicates that they also participate in cancer-related translational regulation [11,37,38]. Through rRNA modification, snoRNAs may influence ribosome structure and function, thereby enabling the selective translation of specific transcripts and contributing to ribosome heterogeneity. snoRNAs have also been implicated in cellular stress responses and tumor progression [37,39]. Our findings extend this concept by linking snoRNA-associated transcriptomic changes to a clinically aggressive breast cancer phenotype defined by compartment-specific CD138 expression [40,41]. These observations are more consistent with broader translational regulatory changes than with the effects of any single snoRNA. In addition, the association between CD138 expression and snoRNA-related transcriptomic alterations observed in this study should be interpreted primarily as correlative in nature. Further mechanistic studies are required to establish causality and elucidate the underlying biological pathways linking CD138 expression to translational reprogramming.
Functional enrichment analysis of snoRNA host genes supported this interpretation by showing the enrichment of pathways involved in RNA processing, ribonucleoprotein complex assembly, spliceosome function, and protein translation. Several host genes identified in this study, including RPL23, RPL10, EIF4A1, and TAF1D, are involved in ribosome assembly and translation initiation, processes often upregulated in cancer to support protein synthesis and stress adaptation [42,43,44,45,46]. Additional host genes, such as HSPA8, TOMM20, and CCT6P3, are involved in protein homeostasis, mitochondrial function, and molecular chaperone activity, which may support tumor cell survival and stress adaptation [47,48,49].
In addition to snoRNA upregulation, multiple ncRNAs were downregulated in Group 1 tumors, including U3 snoRNA, Y RNAs, and signal recognition particle-related RNAs. As U3 snoRNA plays an essential role in 18S rRNA processing and ribosome biogenesis, its reduced expression may reflect altered ribosome assembly in Group 1 tumors. Such alterations are consistent with the concept of specialized ribosomes, in which changes in ribosomal composition may influence the selective translation of specific mRNA transcripts. Decreased expression of several antisense lncRNAs, including GATA3-AS1, PDCD4-AS1, and SIAH2-AS1, may also reflect the disruption of differentiation-associated transcriptional programs.
Consistent with this interpretation, several genes associated with ER signaling and luminal differentiation, including SCUBE2, NAT1, RERG, and PIP, were downregulated in Group 1 tumors. These findings suggest that the tumor-positive/stroma-negative CD138 phenotype may be associated with a less differentiated tumor state and a partial loss of luminal differentiation programs.
One possible explanation linking CD138 expression to the observed transcriptomic pattern is growth factor signaling mediated by CD138 expression. CD138 can retain growth factors, such as FGF, HGF, and VEGF, on the cell surface through its heparan sulfate chains, thereby enhancing receptor-mediated signaling. These signals may activate MAPK and PI3K–Akt–mTOR pathways, which regulate translation initiation and ribosome biogenesis. Persistent CD138 expression in tumor cells may contribute to the transcriptomic changes observed in snoRNA expression and ribosome-related pathways.
The CD138-associated transcriptional program included the upregulation of protein-coding genes, such as S100A7 and CD24, which was strongly correlated with the CD138 signature. Both genes have been implicated in tumor invasion, immune evasion, and metastasis [50,51,52,53,54]. These genes have also been associated with brain metastasis and aggressive tumor behavior [11,55,56], consistent with the transcriptomic pattern observed in Group 1 tumors.
Consistent with these molecular findings, the tumor-positive/stroma-negative CD138 phenotype remained independently associated with RFS after adjusting for established clinicopathological factors, including lymph node status and Ki-67 index. This phenotype was associated with HER2 positivity, nodal metastasis, high HG, and brain metastases, although the number of brain metastases was small. Furthermore, we clarified that the observation of brain metastasis exclusively in Group 1 should be interpreted with caution, given the limited number of cases; therefore, these findings must be validated in larger cohorts.
Syndecan-1 has been implicated in tumor invasion and metastatic adaptation through the modulation of growth factor signaling and ECM interactions [56,57].
Furthermore, we expanded our discussion to consider the potential involvement of CD138-mediated signaling pathways, including the PI3K–Akt–mTOR axis. However, this proposed mechanism remains speculative, and further in vitro functional studies are required to validate the causal link and clarify its role in translational reprogramming. Future studies using spatial transcriptomics may provide a more precise understanding of the relationship between compartment-specific CD138 expression and associated transcriptomic alterations, enabling direct spatial linkage between tumor cells, stromal components, and molecular signatures.
In addition, the potential involvement of the immune microenvironment, including tumor-infiltrating lymphocytes, should be considered. The interplay between CD138-defined tumor states and immune cell infiltration may contribute to the observed differences in tumor behavior, warranting further investigation.
One limitation of this study is the relatively modest cohort size used for multi-group biomarker analysis. While the present findings highlight the potential clinical significance of compartment-specific CD138 expression, further validation in larger, independent cohorts is warranted to confirm the robustness, reproducibility, and generalizability of these results.
Taken together, our findings suggest that compartment-specific CD138 expression is associated with a tumor state characterized by alterations in RNA-related pathways and a partial loss of luminal differentiation programs. These molecular alterations may contribute to tumor aggressiveness; however, their relationship with metastasis and treatment response requires further study.


5. Conclusions

In this study, we show that the tumor-positive/stroma-negative CD138 expression pattern is associated with poorer RFS and transcriptomic features related to snoRNA expression and RNA processing in invasive breast cancer.
These findings suggest that compartment-specific CD138 evaluation may have prognostic value, warranting further validation in larger independent cohorts and mechanistic studies.

Supplementary Materials

The following supporting information can be downloaded at https://www.mdpi.com/article/10.3390/cancers18101539/s1. Supplementary Table S1. Immunohistochemical Scoring Criteria for CD138 (Syndecan-1).

Author Contributions

Conceptualization, K.A., T.H. and M.O.; methodology, K.A., T.H., M.O. and M.H.; software, K.A., M.O. and M.H.; validation, K.A., T.H., M.O. and M.H.; formal analysis, K.A.; investigation, K.A., T.H. and M.O.; resources, K.A.; data curation, K.A. and M.O.; writing—original draft preparation, K.A.; writing—review and editing, K.A., T.H., M.O., M.H., K.M., H.I., A.O. and T.S.; visualization, K.A.; supervision, T.H.; project administration, K.A.; funding acquisition, K.A. All authors have read and agreed to the published version of the manuscript.

Funding

This study was supported by the Hidaka Project (2023) [05D107], Saitama Medical University International Medical Center.

Institutional Review Board Statement

This study was conducted in accordance with the Declaration of Helsinki and approved by the Institutional Review Board of the Saitama Medical University International Medical Center (protocol code 2021-116; date of approval: [8 September 2011]).

Informed Consent Statement

This study was conducted as a retrospective, non-interventional analysis using existing clinical specimens and data. Therefore, the need to obtain written informed consent from each participant was waived in accordance with the ethical guidelines for medical and health research involving human subjects in Japan. The study protocol was reviewed and approved by the Institutional Review Board of the Saitama Medical University International Medical Center (approval number: [2021-116]). Instead of obtaining written informed consent, an opt-out approach was used. Information regarding the study, including its purpose and the opportunity to refuse participation, was publicly disclosed on the official website of the Saitama Medical University International Medical Center (2021-116-2.pdf). Patients were given the opportunity to decline participation, and no data from patients who opted out were included in this study. This procedure complied with the ethical standards outlined in the Declaration of Helsinki and the ethical policies of Cancers.

Data Availability Statement

The RNA sequencing data generated in this study are openly available in the DNA Data Bank of Japan (DDBJ) Sequence Read Archive under the BioProject accession numbers PRJDB37924 and PRJDB40174.

Acknowledgments

We would like to thank for its assistance with English language editing and creating the graphical abstract for this paper.

Conflicts of Interest

The authors declare no conflicts of interest.

Abbreviations

The following abbreviations are used in this manuscript.
ASCOAmerican Society of Clinical Oncology
BPBiological Process
CAPCollege of American Pathologists
CD138Cluster of Differentiation 138 (Syndecan-1)
CIConfidence Interval
DAVIDDatabase for Annotation, Visualization and Integrated Discovery
DEGDifferentially Expressed Gene
ECMExtracellular Matrix
EMTEpithelial–Mesenchymal Transition
EREstrogen Receptor
FDRFalse Discovery Rate
FFPEFormalin-Fixed Paraffin-Embedded
FGFFibroblast Growth Factor
GOGene Ontology
GSVAGene Set Variation Analysis
HER2Human Epidermal Growth Factor Receptor 2
HGHistological Grade
HGFHepatocyte Growth Factor
HRHazard Ratio
HR statusHormone Receptor Status
IDCInvasive Ductal Carcinoma
IHCImmunohistochemistry
KEGGKyoto Encyclopedia of Genes and Genomes
lncRNALong Non-Coding RNA
MAPKMitogen-Activated Protein Kinase
ncRNANon-Coding RNA
PgRProgesterone Receptor
PI3KPhosphoinositide 3-Kinase
ROCReceiver Operating Characteristic
RFSRecurrence-Free Survival
RNARibonucleic Acid
RNA-seqRNA Sequencing
rRNARibosomal RNA
snoRNASmall Nucleolar RNA
SRPSignal Recognition Particle
ssGSEASingle-Sample Gene Set Enrichment Analysis
TPMTranscripts Per Million
UICCUnion for International Cancer Control
VEGFVascular Endothelial Growth Factor
ΨPseudouridylation

References

  1. Polyak, K.; Kalluri, R. The role of the microenvironment in mammary gland development and cancer. Cold Spring Harb. Perspect. Biol. 2010, 2, a003244. [Google Scholar] [CrossRef]
  2. Quail, D.F.; Joyce, J.A. Microenvironmental regulation of tumor progression and metastasis. Nat. Med. 2013, 19, 1423–1437. [Google Scholar] [CrossRef]
  3. Pramanik, A.; Xu, Z.; Ingram, N.; Coletta, P.L.; Millner, P.A.; Tyler, A.I.I.; Hughes, T.A. Hyaluronic-acid-tagged cubosomes deliver cytotoxics specifically to CD44-positive cancer cells. Mol. Pharm. 2022, 19, 4601–4611. [Google Scholar] [CrossRef]
  4. Jang, M.H.; Kang, H.J.; Jang, K.S.; Paik, S.S.; Kim, W.S. Clinicopathological analysis of CD44 and CD24 expression in invasive breast cancer. Oncol. Lett. 2016, 12, 2728–2733. [Google Scholar] [CrossRef]
  5. Couchman, J.R. Syndecans: Proteoglycan regulators of cell-surface microdomains? Nat. Rev. Mol. Cell Biol. 2003, 4, 926–937. [Google Scholar] [CrossRef]
  6. Götte, M. Syndecans in inflammation. FASEB J. 2003, 17, 575–591. [Google Scholar] [CrossRef]
  7. Maeda, T.; Desouky, J.; Friedl, A. Syndecan-1 expression by stromal fibroblasts promotes breast carcinoma growth in vivo and stimulates tumor angiogenesis. Oncogene 2006, 25, 1408–1412. [Google Scholar] [CrossRef] [PubMed]
  8. Barbareschi, M.; Maisonneuve, P.; Aldovini, D.; Cangi, M.G.; Pecciarini, L.; Angelo Mauri, F.A.; Veronese, S.; Caffo, O.; Lucenti, A.; Palma, P.D.; et al. High syndecan-1 expression in breast carcinoma is related to an aggressive phenotype and to poorer prognosis. Cancer 2003, 98, 474–483. [Google Scholar] [CrossRef] [PubMed]
  9. Maeda, T.; Alexander, C.M.; Friedl, A. Induction of syndecan-1 expression in stromal fibroblasts promotes proliferation of human breast cancer cells. Cancer Res. 2004, 64, 612–621. [Google Scholar] [CrossRef] [PubMed]
  10. Esteller, M. Non-coding RNAs in human disease. Nat. Rev. Genet. 2011, 12, 861–874. [Google Scholar] [CrossRef]
  11. Williams, G.T.; Farzaneh, F. Are snoRNAs and SnoRNA host genes new players in cancer? Nat. Rev. Cancer 2012, 12, 84–88. [Google Scholar] [CrossRef]
  12. McMahon, M.; Contreras, A.; Holm, M.; Uechi, T.; Forester, C.M.; Pang, X.; Jackson, C.; Calvert, M.E.; Chen, B.; Quigley, D.A.; et al. A single H/ACA small nucleolar RNA mediates tumor suppression downstream of oncogenic RAS. eLife 2019, 8, e48847. [Google Scholar] [CrossRef] [PubMed]
  13. Kiss, T. Small nucleolar RNAs: An abundant group of noncoding RNAs with diverse cellular functions. Cell 2002, 109, 145–148. [Google Scholar] [CrossRef] [PubMed]
  14. Sloan, K.E.; Warda, A.S.; Sharma, S.; Entian, K.D.; Lafontaine, D.L.J.; Bohnsack, M.T. Tuning the ribosome: The influence of rRNA modification on eukaryotic ribosome biogenesis and function. Biochem. Soc. Trans. 2017, 45, 1137–1147. [Google Scholar] [CrossRef] [PubMed]
  15. Martens-Uzunova, E.S.; Olvedy, M.; Jenster, G. Beyond microRNA—Novel RNAs derived from small non-coding RNA and their implication in cancer. Cancer Lett. 2013, 340, 201–211. [Google Scholar] [CrossRef]
  16. Thorenoor, N.; Slaby, O. Small nucleolar RNAs functioning and potential roles in cancer. Tumour Biol. 2015, 36, 41–53. [Google Scholar] [CrossRef]
  17. Siprashvili, Z.; Webster, D.E.; Johnston, D.; Shenoy, R.M.; Ungewickell, A.J.; Bhaduri, A.; Flockhart, R.; Zarnegar, B.J.; Che, Y.; Meschi, F.; et al. The noncoding RNAs SNORD50A and SNORD50B bind K-Ras and are recurrently deleted in human cancer. Nat. Genet. 2016, 48, 53–58. [Google Scholar] [CrossRef]
  18. Dieci, G.; Preti, M.; Montanini, B. Eukaryotic snoRNAs: A paradigm for gene expression flexibility. Genomics 2009, 94, 83–88. [Google Scholar] [CrossRef]
  19. Wolff, A.C.; Hammond, M.E.H.; Allison, K.H.; Harvey, B.E.; Mangu, P.B.; Bartlett, J.M.S.; Bilous, M.; Ellis, I.O.; Fitzgibbons, P.; Hanna, W.; et al. Human epidermal growth factor receptor 2 testing in breast cancer: American Society of Clinical Oncology/College of American Pathologists clinical practice guideline focused update. J. Clin. Oncol. 2018, 36, 2105–2122. [Google Scholar] [CrossRef]
  20. Hammond, M.E.H.; Hayes, D.F.; Dowsett, M.; Allred, D.C.; Hagerty, K.L.; Badve, S.; Fitzgibbons, P.L.; Francis, G.; Goldstein, N.S.; Hayes, M.; et al. American Society of Clinical Oncology/College of American Pathologists guideline recommendations for immunohistochemical testing of estrogen and progesterone receptors in breast cancer. J. Clin. Oncol. 2010, 28, 2784–2795. [Google Scholar] [CrossRef]
  21. Kind, S.; Jaretzke, A.; Büscheck, F.; Möller, K.; Dum, D.; Höflmayer, D.; Hinsch, A.; Weidemann, S.; Fraune, C.; Möller-Koop, C.; et al. A Shift from Membranous and Stromal Syndecan-1 (CD138) Expression to Cytoplasmic CD138 Expression Is Associated with Poor Prognosis in Breast Cancer. Mol. Carcinog. 2019, 58, 2306–2315. [Google Scholar] [CrossRef]
  22. Choi, E.J.; Yun, J.A.; Jeon, E.K.; Won, H.S.; Ko, Y.H.; Kim, S.Y. Prognostic significance of RSPO1, WNT1, P16, WT1, and SDC1 expressions in invasive ductal carcinoma of the breast. World J. Surg. Oncol. 2013, 11, 314. [Google Scholar] [CrossRef]
  23. Wang, H.; Zhang, Y.; Yang, Z.; Jiang, Y.; Wu, L.; Wang, R.; Zhang, Z. Clinical/Prognostic Significance of Syndecan-1 Expression in Invasive Breast Carcinoma with Distant Metastasis and Its Correlation with Tumor Immunity. Pathol. Res. Pract. 2023, 250, 154787. [Google Scholar] [CrossRef]
  24. Lennartz, M.; Gehrig, E.; Weidemann, S.; Gorbokon, N.; Menz, A.; Büscheck, F.; Hube-Magg, C.; Hinsch, A.; Reiswich, V.; Höflmayer, D.; et al. Large-scale tissue microarray evaluation corroborates high specificity of high-level Arginase-1 immunostaining for hepatocellular carcinoma. Diagnostics 2021, 11, 2351. [Google Scholar] [CrossRef]
  25. Ichinose, Y.; Hasebe, T.; Hirasaki, M.; Sakakibara, A.; Yokogawa, H.; Nukui, A.; Hiratsuka, M.; Fujimoto, A.; Iso, C.; Wakui, N.; et al. Vimentin-positive invasive breast carcinoma of no special type: A breast carcinoma with lethal biological characteristics. Pathol. Int. 2023, 73, 413–433. [Google Scholar] [CrossRef]
  26. Bouchard-Bourelle, P.; Desjardins-Henri, C.; Mathurin-St-Pierre, D.; Deschamps-Francoeur, G.; Fafard-Couture, É.; Garant, J.M.; Elela, S.A.; Scott, M.S. snoDB: An interactive database of human snoRNA sequences, abundance and interactions. Nucleic Acids Res. 2020, 48, D220–D225. [Google Scholar] [CrossRef] [PubMed]
  27. Yu, G.; Wang, L.G.; Han, Y.; He, Q.Y. clusterProfiler: An R package for comparing biological themes among gene clusters. Omics 2012, 16, 284–287. [Google Scholar] [CrossRef] [PubMed]
  28. Hänzelmann, S.; Castelo, R.; Guinney, J. GSVA: Gene set variation analysis for microarray and RNA-seq data. BMC Bioinform. 2013, 14, 7. [Google Scholar] [CrossRef]
  29. Nasser, M.W.; Qamri, Z.; Deol, Y.S.; Ravi, J.; Powell, C.A.; Trikha, P.; Schwendener, R.A.; Bai, X.F.; Shilo, K.; Zou, X.; et al. S100A7 enhances mammary tumorigenesis through upregulation of inflammatory pathways. Cancer Res. 2011, 72, 604–615. [Google Scholar] [CrossRef] [PubMed]
  30. Bresnick, A.R.; Weber, D.J.; Zimmer, D.B. S100 proteins in cancer. Nat. Rev. Cancer 2015, 15, 96–109. [Google Scholar] [CrossRef]
  31. Baumann, P.; Cremers, N.; Kroese, F.; Orend, G.; Chiquet-Ehrismann, R.; Uede, T.; Yagita, H.; Sleeman, J.P. CD24 expression causes the acquisition of multiple cellular properties associated with tumor growth and metastasis. Cancer Res. 2005, 65, 10783–10793. [Google Scholar] [CrossRef]
  32. Al-Hajj, M.; Wicha, M.S.; Benito-Hernandez, A.; Morrison, S.J.; Clarke, M.F. Prospective identification of tumorigenic breast cancer cells. Proc. Natl. Acad. Sci. USA 2003, 100, 3983–3988. [Google Scholar] [CrossRef]
  33. Hanahan, D.; Weinberg, R.A. Hallmarks of cancer: The next generation. Cell 2011, 144, 646–674. [Google Scholar] [CrossRef] [PubMed]
  34. Liebersbach, B.F.; Sanderson, R.D. Expression of syndecan-1 inhibits cell invasion into type I collagen. J. Biol. Chem. 1994, 269, 20013–20019. [Google Scholar] [CrossRef] [PubMed]
  35. Altemeier, W.A.; Schlesinger, S.Y.; Buell, C.A.; Brauer, R.; Rapraeger, A.C.; Parks, W.C.; Chen, P. Transmembrane and extracellular domains of syndecan-1 have distinct functions in regulating lung epithelial migration and adhesion. J. Biol. Chem. 2012, 287, 34927–34935. [Google Scholar] [CrossRef]
  36. Couchman, J.R. Syndecan-1 (CD138), carcinomas and EMT. Int. J. Mol. Sci. 2021, 22, 4227. [Google Scholar] [CrossRef] [PubMed]
  37. Zacchini, F.; Barozzi, C.; Venturi, G.; Montanaro, L. How snoRNAs can contribute to cancer at multiple levels. NAR Cancer 2024, 6, zcae005. [Google Scholar] [CrossRef] [PubMed]
  38. Gay, D.M.; Lund, A.H.; Jansson, M.D. Translational control through ribosome heterogeneity and functional specialization. Trends Biochem. Sci. 2022, 47, 66–81. [Google Scholar] [CrossRef]
  39. Gelfo, V.; Venturi, G.; Zacchini, F.; Montanaro, L. Decoding ribosome heterogeneity: A new horizon in cancer therapy. Biomedicines 2024, 12, 155. [Google Scholar] [CrossRef]
  40. Bratkovič, T.; Rogelj, B. Biology and applications of small nucleolar RNAs. Cell. Mol. Life Sci. 2011, 68, 3843–3851. [Google Scholar] [CrossRef]
  41. Dong, X.Y.; Rodriguez, C.; Guo, P.; Sun, X.; Talbot, J.T.; Zhou, W.; Petros, J.; Li, Q.; Vessella, R.L.; Kibel, A.S.; et al. SnoRNA U50 is a candidate tumor-suppressor gene at 6q14.3 with a mutation associated with clinically significant prostate cancer. Hum. Mol. Genet. 2008, 17, 1031–1042. [Google Scholar] [CrossRef] [PubMed]
  42. De Keersmaecker, K.; Sulima, S.O.; Dinman, J.D. Ribosomopathies and the paradox of cellular hypo- to hyperproliferation. Blood 2015, 125, 1377–1382. [Google Scholar] [CrossRef]
  43. Sulima, S.O.; Hofman, I.J.F.; De Keersmaecker, K.; Dinman, J.D. How ribosomes translate cancer. Cancer Discov. 2017, 7, 1069–1087. [Google Scholar] [CrossRef]
  44. Modelska, A.; Turro, E.; Russell, R.; Beaton, J.; Sbarrato, T.; Spriggs, K.; Miller, J.; Gräf, S.; Provenzano, E.; Blows, F.; et al. The malignant phenotype in breast cancer is driven by eIF4A1-mediated changes in the translational landscape. Cell Death Dis. 2015, 6, e1603. [Google Scholar] [CrossRef] [PubMed]
  45. Gorski, J.J.; Pathak, S.; Panov, K.; Kasciukovic, T.; Panova, T.B.; Russell, J.; Zomerdijk, J.C.B.M. A novel TBP-associated factor of SL1 functions in RNA polymerase I transcription. EMBO J. 2007, 26, 1560–1568. [Google Scholar] [CrossRef] [PubMed]
  46. Cretu, C.; Schmitzová, J.; Ponce-Salvatierra, A.; Dybkov, O.; De Laurentiis, E.I.; Sharma, K.; Will, C.L.; Urlaub, H.; Lührmann, R.; Pena, V. Molecular architecture of SF3b and structural consequences of its cancer-related mutations. Mol. Cell 2016, 64, 307–319. [Google Scholar] [CrossRef]
  47. Kampinga, H.H.; Craig, E.A. The HSP70 chaperone machinery: J proteins as drivers of functional specificity. Nat. Rev. Mol. Cell Biol. 2010, 11, 579–592. [Google Scholar] [CrossRef]
  48. Araiso, Y.; Tsutsumi, A.; Qiu, J.; Imai, K.; Shiota, T.; Song, J.; Lindau, C.; Wenz, L.S.; Sakaue, H.; Yunoki, K.; et al. Structure of the mitochondrial import gate reveals distinct preprotein paths. Nature 2019, 575, 395–401. [Google Scholar] [CrossRef]
  49. Yam, A.Y.; Xia, Y.; Lin, H.T.J.; Burlingame, A.; Gerstein, M.; Frydman, J. Defining the triC/CCT interactome links chaperonin function to stabilization of newly made proteins with complex topologies. Nat. Struct. Mol. Biol. 2008, 15, 1255–1262. [Google Scholar] [CrossRef]
  50. Tian, T.; Li, X.; Hua, Z.; Ma, J.; Wu, X.; Liu, Z.; Chen, H.; Cui, Z. S100A7 promotes the migration, invasion and metastasis of human cervical cancer cells through epithelial–mesenchymal transition. Oncotarget 2017, 8, 24964–24977. [Google Scholar] [CrossRef]
  51. Barkal, A.A.; Brewer, R.E.; Markovic, M.; Kowarsky, M.; Barkal, S.A.; Zaro, B.W.; Krishnan, V.; Hatakeyama, J.; Dorigo, O.; Barkal, L.J.; et al. CD24 signalling through macrophage Siglec-10 is a target for cancer immunotherapy. Nature 2019, 572, 392–396. [Google Scholar] [CrossRef]
  52. Ruggero, D. Revisiting the nucleolus: From marker to dynamic integrator of cancer signaling. Sci. Signal. 2012, 5, pe38. [Google Scholar] [CrossRef] [PubMed]
  53. Pelletier, J.; Thomas, G.; Volarević, S. Ribosome biogenesis in cancer: New players and therapeutic avenues. Nat. Rev. Cancer 2018, 18, 51–63. [Google Scholar] [CrossRef]
  54. Emberley, E.D.; Niu, Y.; Njue, C.; Kliewer, E.V.; Murphy, L.C.; Watson, P.H. Psoriasin (S100A7) expression is associated with poor outcome in estrogen receptor-negative invasive breast cancer. Clin. Cancer Res. 2003, 9, 2627–2631. [Google Scholar]
  55. Kristiansen, G.; Winzer, K.-J.; Mayordomo, E.; Bellach, J.; Schlüns, K.; Denkert, C.; Dahl, E.; Pilarsky, C.; Altevogt, P.; Guski, H.; et al. CD24 expression is a new prognostic marker in breast cancer. Clin. Cancer Res. 2003, 9, 4906–4913. [Google Scholar] [PubMed]
  56. Bos, P.D.; Zhang, X.H.-F.; Nadal, C.; Shu, W.; Gomis, R.R.; Nguyen, D.X.; Minn, A.J.; van de Vijver, M.J.; Gerald, W.L.; Foekens, J.A.; et al. Genes that mediate breast cancer metastasis to the brain. Nature 2009, 459, 1005–1009. [Google Scholar] [CrossRef]
  57. Su, G.; Blaine, S.A.; Qiao, D.; Friedl, A. Shedding of syndecan-1 by stromal fibroblasts stimulates human breast cancer cell proliferation via FGF2 activation. J. Biol. Chem. 2007, 282, 14906–14915. [Google Scholar] [CrossRef] [PubMed]
Figure 1. The representative immunohistochemical staining patterns of CD138. Representative CD138 immunohistochemical staining patterns in the tumor epithelial and stromal compartments are shown: (a) Group 0: tumor-negative/stroma-negative; (b) Group 1: tumor-positive/stroma-negative; (c) Group 2: tumor-negative/stroma-positive; (d) Group 3: tumor-positive/stroma-positive; (e) representative membranous CD138 staining in tumor cells; (f) representative nuclear CD138 staining in tumor cells (red arrows).
Cancers 18 01539 g001
Figure 2. Recurrence-free survival according to CD138 expression patterns. (a) Kaplan–Meier curves of recurrence-free survival (RFS) according to CD138 immunohistochemical classification: Group 0, tumor-negative/stroma-negative; Group 1, tumor-positive/stroma-negative; Group 2, tumor-negative/stroma-positive; Group 3, tumor-positive/stroma-positive. Group 1 showed significantly poorer RFS than the other groups (p = 0.00121). (b) Kaplan–Meier curves of RFS stratified by CD138 transcript expression levels (TPM). Patients were dichotomized using a cutoff value of 50.56, determined via receiver operating characteristic (ROC) analysis (p = 0.0459). Abbreviations: RFS, recurrence-free survival; TPM, transcripts per million; ROC, receiver operating characteristic.
Cancers 18 01539 g002
Figure 3. Volcano plot of differentially expressed snoRNAs (Group 1 vs. Others). The x-axis represents log2 fold change (Group 1 vs. Others), and the y-axis represents −log10(FDR). Dashed vertical lines indicate |log2FC| = 1, and the horizontal dashed line indicates FDR = 0.05.
Cancers 18 01539 g003
Figure 4. Functional enrichment analysis of snoRNA host genes. Gene Ontology (GO) Biological Process (BP) and Kyoto Encyclopedia of Genes and Genomes (KEGG) pathway enrichment analyses were performed for the host genes of differentially expressed snoRNAs. The significantly enriched pathways (FDR < 0.05) were mainly related to RNA processing and protein translation. (a) GO BP enrichment of snoRNA host genes. (b) KEGG pathway enrichment analysis of snoRNA host genes. Abbreviations: GO, Gene Ontology; BP, Biological Process; KEGG, Kyoto Encyclopedia of Genes and Genomes; FDR, false discovery rate.
Cancers 18 01539 g004
Figure 5. The association between CD138 immunohistochemical status and transcriptional signatures. Comparison of ssGSEA scores derived from CD138-positive and CD138-negative transcriptional signatures according to CD138 immunohistochemical status. The ssGSEA score represents the enrichment level of the predefined CD138-associated gene set in each tumor sample. The CD138-positive gene signature consisted of S100A7, CD24, and GLYATL2, whereas the CD138-negative signature included RERG, SLC39A6, NAT1, SCUBE2, PIP, NPY1R, SLC7A2, GRIA2, FSIP1, PTPRT, and SERPINA3 genes. (a) Tumors with a CD138-positive immunohistochemical status had significantly higher ssGSEA scores for the CD138-positive signature than CD138-negative tumors. (b) Tumors lacking CD138 expression had significantly higher scores for the CD138-negative signature. Statistical comparisons were performed using the Wilcoxon rank-sum test. Each point represents an individual tumor sample. Boxes indicate the interquartile range (IQR), center lines indicate the median, and whiskers represent values within 1.5 × IQR.
Cancers 18 01539 g005
Figure 6. Correlation between CD138 ssGSEA scores and S100A7/CD24 expression. Scatter plots showing the association between the CD138-positive (Group 1) transcriptional signature score and the expression levels of (a) S100A7 and (b) CD24 [log2(TPM + 1)]. Spearman correlation coefficients and p-values are shown. Abbreviations: ssGSEA, single-sample gene set enrichment analysis; TPM, transcripts per million.
Cancers 18 01539 g006
Figure 7. The relationship between CD138 ssGSEA scores and snoRNA module scores. A scatter plot comparing the CD138-positive (Group 1) ssGSEA score and the snoRNA module score for each patient. A positive correlation was observed between the CD138-positive ssGSEA and snoRNA module scores. Abbreviations: ssGSEA, single-sample gene set enrichment analysis.
Cancers 18 01539 g007
Table 1. The clinicopathological characteristics of the study cohort.
Factorn (%)
Age (year)Median59
Range27–82
<4010 (9.0)
40≤101 (91.0)
TT160 (54.1)
T245 (40.5)
T35 (4.5)
T41 (0.9)
NN082 (73.9)
N118 (16.2)
N26 (5.4)
N35 (4.5)
HGHG134 (30.6)
HG236 (32.4)
HG341 (36.9)
Ki67<2042 (37.8)
20≤69 (62.2)
SubtypeHR+HER2−64 (57.7)
HR+HER2+8 (7.2)
HR−HER2+16 (14.4)
HR−HER2−23 (20.7)
RFSNo metastasis89 (80.2)
Metastasis22 (19.8)
Adjuvant therapyRadiotherapy69 (62.2)
Chemotherapy55 (49.5)
Endocrine therapy62 (55.9)
Anti-HER2 therapy16 (14.4)
The baseline patient and tumor characteristics of the 111 primary breast cancer cases included in this study. The variables included age, tumor size (T stage), lymph node status (N stage), histological grade (HG), Ki-67 index, hormone receptor (HR) status, HER2 status, recurrence events, and postoperative therapies. Abbreviations: HG, histological grade; HR, hormone receptor; HER2, human epidermal growth factor receptor 2; RFS, recurrence-free survival.
Table 2. CD138 immunohistochemical staining patterns.
AreaFactorn (%)
TumorNegative42 (37.8)
Weak17 (15.3)
Moderate12 (10.8)
Strong20 (18)
Tumor membranous76 (68.5)
+35 (31.5)
Tumor cytoplasmic43 (38.7)
+68 (61.3)
Tumor nuclear107 (96.4)
+4 (3.6)
StromaNegative84 (75.7)
Weak5 (4.5)
Moderate3 (2.7)
Strong6 (5.4)
CD138 expression patterns and staining intensity were based on previously reported criteria [21,22], in reference to a semi-quantitative scoring system integrating staining intensity and the proportion of positive cells described by Lennartz et al. [24], with minor modifications. The number of samples corresponding to each staining category is shown.
Table 3. The classification of CD138 immunohistochemical expression patterns.
Classification GroupGroup 0Group 1Group 2Group 3
Tumor++
Stroma++
Numbers45351912
Group 0: tumor-negative/stroma-negative; Group 1: tumor-positive/stroma-negative; Group 2: tumor-negative/stroma-positive; Group 3: tumor-positive/stroma-positive.
Table 4. The association between CD138 classification groups and CD138 transcript expression levels (TPM).
TPMGroup 0Group 1Group 2Group 3
Low615819
High6201126
The cutoff value for TPM expression was determined using receiver operating characteristic (ROC) curve analysis with recurrence-free survival (RFS) as the endpoint. No significant association was observed between the TPM expression and CD138 classification groups (chi-square test, χ2 = 0.254, df = 3, p = 0.968). Abbreviations: TPM, transcripts per million.
Table 5. Differentially expressed RNAs identified based on CD138 immunohistochemical expression patterns. (a) RNAs were significantly upregulated in Group 1 (tumor-positive/stroma-negative). (b) RNAs were significantly downregulated in Group 1 (tumor-positive/stroma-negative group).
(a)
Rownames (Data)Gene NameGene Typep-Value
ENSG00000199293SNORA21snoRNA0.0415115
ENSG00000206834SNORA1snoRNA0.043876146
ENSG00000207112SNORA25snoRNA0.045203849
ENSG00000207118SNORD14DsnoRNA0.012961092
ENSG00000207165SNORA70snoRNA0.009010414
ENSG00000207181SNORA14BsnoRNA0.007170734
ENSG00000207344SNORA22CsnoRNA0.048681431
ENSG00000221066SNORD111snoRNA0.045965701
ENSG00000221514SNORD111BsnoRNA0.012779495
ENSG00000252699SNORA21BsnoRNA0.001568441
ENSG00000277985SNORA67snoRNA0.040745568
ENSG00000252906SCARNA3scaRNA0.01370412
ENSG00000200537RNY4P6misc_RNA0.034323474
ENSG00000252355RN7SKP287misc_RNA0.000379685
ENSG000002582320lncRNA0.011300409
ENSG000002721140lncRNA0.005735046
ENSG00000207029RNU6-43PsnRNA0.024349242
ENSG00000223336RNU2-6PsnRNA0.039879665
ENSG00000143556S100A7protein_coding0.035694481
ENSG00000156689GLYATL2protein_coding3.27328 × 10−5
ENSG00000272398CD24protein_coding1.88457 × 10−5
(b)
Rownames (Data)Gene NameGene Typep-Value
ENSG00000212195U3snoRNA0.007025747
ENSG00000271817U3snoRNA0.000177356
ENSG00000278249SCARNA2scaRNA0.00041631
ENSG00000200065Y_RNAmisc_RNA0.004822455
ENSG00000200090Y_RNAmisc_RNA0.001984721
ENSG00000200502Y_RNAmisc_RNA0.029705185
ENSG00000201496RN7SKP275misc_RNA0.001974826
ENSG00000202417Y_RNAmisc_RNA0.018438651
ENSG00000202522Y_RNAmisc_RNA0.047206429
ENSG00000203286Metazoa_SRPmisc_RNA0.032145978
ENSG00000238324RN7SKP198misc_RNA0.005390875
ENSG00000239942RN7SL394Pmisc_RNA0.000624811
ENSG00000244218RN7SL81Pmisc_RNA0.001850411
ENSG00000252621Y_RNAmisc_RNA0.038943206
ENSG00000272197RN7SL803Pmisc_RNA0.000998156
ENSG000002739740misc_RNA0.031202327
ENSG00000274963RN7SL600Pmisc_RNA0.00780226
ENSG000002760890misc_RNA0.026045989
ENSG00000276096Metazoa_SRPmisc_RNA0.009464143
ENSG00000175746LINC02915lncRNA0.029813027
ENSG00000197308GATA3-AS1lncRNA0.005752834
ENSG00000203497PDCD4-AS1lncRNA0.000147504
ENSG00000213904LIPE-AS1lncRNA0.003981315
ENSG00000224559LINC01087lncRNA0.018170724
ENSG00000227392HPN-AS1lncRNA0.000102862
ENSG000002281130lncRNA0.002414605
ENSG00000228606DCAF8-DTlncRNA0.001413829
ENSG00000230184SMYD3-IT1lncRNA0.005751595
ENSG000002320850lncRNA0.030106957
ENSG000002325360lncRNA0.001484405
ENSG000002341600lncRNA0.025132205
ENSG00000244265SIAH2-AS1lncRNA0.001578035
ENSG000002444910lncRNA0.002462311
ENSG000002483350lncRNA0.01796676
ENSG000002487790lncRNA0.003054656
ENSG00000249306LINC01411lncRNA0.000321652
ENSG00000251141MRPS30-DTlncRNA1.84835 × 10−5
ENSG000002546760lncRNA0.002004225
ENSG00000254815LMNTD2-AS1lncRNA0.001293679
ENSG000002563640lncRNA0.045775399
ENSG000002573860lncRNA0.029069361
ENSG000002591750lncRNA1.03738 × 10−5
ENSG000002592690lncRNA0.045791785
ENSG000002593450lncRNA0.012564516
ENSG000002594470lncRNA0.008978821
ENSG00000259642ST20-AS1lncRNA6.45763 × 10−5
ENSG00000260372AQP4-AS1lncRNA0.041262915
ENSG000002615050lncRNA0.000536122
ENSG000002621190lncRNA0.002303181
ENSG000002636180lncRNA0.002146189
ENSG000002636770lncRNA2.12098 × 10−5
ENSG000002639240lncRNA0.043806185
ENSG00000265369PCAT18lncRNA8.53622 × 10−8
ENSG00000267395DM1-ASlncRNA0.000483251
ENSG000002723350lncRNA1.31311 × 10−8
ENSG000002726610lncRNA0.009683057
ENSG00000274259SYNGAP1-AS1lncRNA0.002058406
ENSG000002758940lncRNA0.00512729
ENSG00000003989SLC7A2protein_coding0.001272185
ENSG00000120251GRIA2protein_coding0.025925214
ENSG00000134533RERGprotein_coding0.000121022
ENSG00000141424SLC39A6protein_coding2.22126 × 10−6
ENSG00000150667FSIP1protein_coding0.0406572
ENSG00000153002CPB1protein_coding6.03791 × 10−8
ENSG00000154099DNAAF1protein_coding0.006580799
ENSG00000159763PIPprotein_coding0.003116937
ENSG00000162078ZG16Bprotein_coding0.004422205
ENSG00000164128NPY1Rprotein_coding0.04102273
ENSG00000168993CPLX1protein_coding0.000792682
ENSG00000171428NAT1protein_coding0.000448024
ENSG00000173917HOXB2protein_coding0.004842339
ENSG00000175356SCUBE2protein_coding0.00768095
ENSG00000188001TPRG1protein_coding5.08394 × 10−6
ENSG00000196090PTPRTprotein_coding0.012968594
ENSG00000196136SERPINA3protein_coding0.003046807
ENSG00000198077CYP2A7protein_coding1.90032 × 10−5
ENSG00000198650TATprotein_coding1.5222 × 10−9
ENSG00000203697CAPN8protein_coding0.003348308
ENSG00000206013IFITM5protein_coding0.000464115
ENSG00000215910C1orf167protein_coding0.049644545
The expression values are shown as log2(TPM + 1). Abbreviations: TPM, transcripts per million.
Table 6. The annotation of snoRNAs identified in Group 1 (tumor-positive/stroma-negative).
Gene SymbolHost GeneBox Type
(H/ACA, C/D)
Target rRNA and Nucleotide PositionModification Type
(Ψ or 2′-O-Methylation)
Family Status
SNORA21/21BRPL23Box H/ACA28S: 4401, 4470Ψfamily
SNORA1TAF1DBox H/ACA28S: 4441Ψsingle
SNORA25TAF1DBox H/ACA28S: 801, 814Ψsingle
SNORD14DHSPA8Box C/D18S: 4622′-O-Mesingle
SNORA70RPL10Box H/ACA18S: 1232, 1692Ψsingle
SNORA14BTOMM20Box H/ACA18S: 681, 966Ψsingle
SNORA22CCCT6P3Box H/ACA18S: 918Ψsingle
SNORD111/111BSF3B3Box C/D28S: 38232′-O-Mefamily
SNORA67EIF4A1Box H/ACA18S: 1445Ψsingle
The table summarizes snoRNAs that were significantly upregulated in Group 1 based on the CD138 immunohistochemical classification. For each snoRNA, the corresponding host gene, box class (H/ACA or C/D), target rRNA and nucleotide position, modification type (pseudouridylation [Ψ] or 2′-O-methylation), and family status are shown. Family status indicates whether a snoRNA belongs to a paralogous gene family or exists as a single-copy gene family. rRNA targets and nucleotide positions are based on canonical human rRNA annotation (18S or 28S).
Table 7. A comparison of clinicopathological characteristics between the CD138 tumor-positive/stroma-negative group (Group 1) and all other groups.
VariableGroup 1Othersp-Value
Age (<40)640.0749
T (T23)16350.951
N (N123)17150.00064
HG (HG3)17240.036
Ki67 (10%≤)21480.804
HR+18540.0437
HER2+14100.00218
Brain meta400.0098 *
Radiotherapy21480.804
Chemotherapy19360.444
Endocrine therapy15470.077
Anti-HER2 therapy1060.00116
TPM (CD138: high)20430.974
Group differences were evaluated using the chi-square or the Fisher exact test, as appropriate. * indicates that Fisher’s exact test was used. Underlined values indicate p < 0.05.
Table 8. The association between the CD138 expression group (Group 1), clinicopathological factors, and prognostic analysis.
(a)
FactorUnivariateMultivariate
HR95% CIp-ValueHR95% CIp-Value
Lower LimitUpper LimitLower LimitUpper Limit
Age0.27320.09920.75220.012040.20140.052440.77350.0196
T3.8821.5189.9270.0046391.9420.60526.230.2645
N4.5811.95410.740.00046184.7631.71713.210.002711
HG2.1230.91654.9180.078990.93240.23813.650.9199
Ki673.0251.028.9690.045883.7891.05213.650.04164
HR0.4930.21341.1390.097940.86870.16654.5320.8674
HER21.1430.4213.1020.79331.0630.24294.6540.9351
CD1384.8771.99411.930.00051576.132.08118.060.001005
Radiotherapy0.68270.29481.5810.37290.97150.34622.7260.9563
Chemotherapy1.1240.48442.6070.78580.46870.15861.3850.1705
Endocrine therapy0.39310.16480.93740.035230.94970.19154.7090.9496
Anti-HER2 therapy0.56590.1322.4270.44340.13250.014921.1760.0696
(b)
Factorrhop-Value
Age−0.0120.901
N0.3220.000578
Ki67−0.1130.24
(a) Univariate and multivariate Cox proportional hazards regression analyses were performed to evaluate the prognostic factors for recurrence-free survival (RFS). Hazard ratios (HRs), 95% confidence intervals (CIs), and p-values were estimated using the Cox proportional hazards regression. The analysis included 111 patients, among whom 22 experienced recurrence events during the follow-up period. The variables were defined as follows: age, <40 years; T stage, T2–T3; N stage, N1–N3; HG, histological grade 3; Ki-67, high expression ≥ 20%; HR, hormone receptor-positive; HER2, HER2 positive; CD138, tumor-positive/stroma-negative phenotype. Brain metastases were not included in the multivariate model because all brain metastases occurred in the CD138 tumor-positive/stroma-negative group. Statistical significance was set at p < 0.05. Underlined values indicate p < 0.05 (b) The correlation between Group 1 CD138 expression and clinicopathological factors. Spearman rank correlation coefficient was used to evaluate associations between Group 1 CD138 classification and clinicopathological factors that were significant in multivariable Cox regression analysis (Table 8b), including age, lymph node status (N stage), and Ki-67 index. A weak correlation was observed between CD138 classification and lymph node status, whereas no significant correlations were observed between age or Ki-67 index. Underlined values indicate p < 0.05.
Disclaimer/Publisher’s Note: The statements, opinions and data contained in all publications are solely those of the individual author(s) and contributor(s) and not of MDPI and/or the editor(s). MDPI and/or the editor(s) disclaim responsibility for any injury to people or property resulting from any ideas, methods, instructions or products referred to in the content.