Article

Comparing the Prognostic Value of Quantitative Response Assessment Tools and LIRADS Treatment Response Algorithm in Patients with Hepatocellular Carcinoma Following Interstitial High-Dose-Rate Brachytherapy and Conventional Transarterial Chemoembolization

1
Department of Radiology, Corporate Member of Freie Universität Berlin and Humboldt-Universität zu Berlin, Charité-Universitätsmedizin Berlin, Augustenburger Platz 1, 13353 Berlin, Germany
2
Experimental Clinical Research Center (ECRC) at Charité-Universitätsmedizin Berlin and Max-Delbrück-Centrum für Molekulare Medizin (MDC), Robert-Rössle-Straße 10, 13125 Berlin, Germany
3
Berlin Institute of Health at Charité-Universitätsmedizin Berlin, Charitéplatz 1, 10117 Berlin, Germany
*
Author to whom correspondence should be addressed.
Cancers 2025, 17(8), 1275; https://doi.org/10.3390/cancers17081275
Submission received: 15 February 2025 / Revised: 3 April 2025 / Accepted: 7 April 2025 / Published: 9 April 2025
(This article belongs to the Special Issue Novel Approaches and Advances in Interventional Oncology)

Simple Summary

The majority of patients with hepatocellular carcinoma are suitable candidates for minimally invasive locoregional therapies. While these liver-directed and tumor-orientated guideline-approved therapies are widely distributed, a standardized assessment of treatment response is lacking in cases of interstitial irradiation using high-dose-rate brachytherapy and combinations of brachytherapy with prior transarterial chemoembolization for the treatment of large, hypervascularized, and therefore potentially more aggressive tumors. While evaluating the most common treatment response measurement tools, this study found that size-based criteria had a lower prognostic value compared to enhancement-based tools. Our findings suggest that, besides the utilized tools, the appropriate time of response measurement will reliably distinguish good from poor responses, which may improve personalized surveillance strategies and may improve prognostication.

Abstract

Background/Objectives: The aim of this study was to investigate the prognostic value of established response assessment tools for hepatocellular carcinoma (HCC) treated with high-dose-rate interstitial brachytherapy (iBT) alone or with transarterial chemoembolization (cTACE). Methods: (Non-)responders were categorized using size-based RECIST 1.1 and WHO criteria, enhancement-based mRECIST and EASL criteria, and the LI-RADS Treatment Response Algorithm (LR-TRA). The outcomes were the overall survival (OS), progression-free survival (PFS), and time to progression (TTP). The statistics used included Fisher’s exact test, a t-test, the Mann–Whitney-U test, and a Kaplan–Meier analysis. The median OS, PFS, and TTP were higher in patients following iBT (26.3, 9.1, and 13.0 months) than following cTACE/iBT (23.3, 7.6, and 9.2 months). Results: The enhancement-based criteria identified more responders and predicted PFS and TTP better compared to the size-based criteria. At two months, the cTACE/iBT responders showed improved PFS (mRECIST and EASL: 11.3 vs. 2.3 and 11.0 vs. 2.3, p < 0.01) and TTP (mRECIST and EASL: 11.9 vs. 2.4 months, p < 0.01) by the enhancement-based criteria. An EASL assessment at five months predicted improved survival following both cTACE/iBT (PFS: 11.9 vs. 5.1 months, p = 0.03; TTP: 12.4 vs. 5.0, p < 0.01) and iBT (11.1 vs. 5.1 months, p = 0.04; 13.0 vs. 5.3, p < 0.01). The LR-TRA showed OS benefits at five months for cTACE/iBT responders. Size-based criteria were not prognostic. Conclusions: Extending follow-up post-iBT or post-iBT/cTACE may improve responder stratification and prognostication.

1. Introduction

Hepatocellular carcinoma (HCC) is the sixth most common cancer worldwide and the third leading cause of cancer-related death worldwide [1]. In patients with unresectable HCC, locoregional therapies (LRTs) are the guideline-approved standard of care, including ablation and embolization therapies for early- and intermediate-stage disease [2,3]. Recommendations by the European Society of Medical Oncology (ESMO)’s treatment guidelines for HCC as well as growing evidence suggests that CT-guided interstitial high-dose-rate brachytherapy (iBT) can be used interchangeably compared to thermal-energy-based ablation techniques such as microwave (MWA) or radiofrequency ablation (RFA) with the added benefits of treating larger lesions while avoiding injury to adjacent bile ducts and blood vessels [4,5]. iBT comprises interstitial radiation via the application of a beta-emitting iridium-192 source through a CT-guided catheter placement. Due to precise 3D radiation planning and the rapid dose drop outside the target tissue, brachytherapy allows for the ‘inside-out’ application of a very high radiation dose to the target volume in a single fraction (>100 gray in central tumor parts). Moreover, iBT can be combined with conventional transarterial chemoembolization (cTACE), particularly in patients with larger liver tumors up to 5 cm, for which thermal ablation alone might be insufficient to achieve complete treatment, and thus may result in higher rates of local recurrence [6].
While iBT induces gradual tumor necrosis, fibrotic scars, and the subsequent shrinkage of the tumor over time, the cTACE-induced effects are exhibited more immediately. Following the occlusion of the tumor-feeding arteries by the injection of ethiodized oil, chemotherapeutic agents, and embolic beads or foam, the tumor is devascularized, causing an early onset of necrosis via cytotoxic and ischemic effects.
Thus, therapeutic effects on postinterventional imaging may vary among different types of ablation and embolization therapies [7]. To evaluate tumor response with computed tomography (CT) or magnetic resonance (MR) imaging, uni- or bidimensional measurements are widely accepted and validated assessment tools. Size-based techniques such as the unidimensional Response Evaluation Criteria in Solid Tumors (RECIST) and the bidimensional World Health Organization (WHO) criteria measure the alteration in the largest axial diameter or area of target lesions, respectively. In contrast, enhancement-based techniques such as the unidimensional modified (m)RECIST and bidimensional European Association for the Study of the Liver (EASL) criteria were designed to quantify changes in the largest enhancing tumor diameter or area, respectively, particularly in hypervascularized tumors following LRT [8]. Moreover, the Liver Imaging Reporting and Data System (LI-RADS) Treatment Response Algorithm (LR-TRA) was introduced to overcome those linear definitions of (m)RECIST, the WHO, and the EASL while defining postinterventional tumor viability as a more complex pattern beyond alterations in size and enhancement [9]. In the latest update from early 2024, the 2018 version of the LR-TRA’s definition of tumor viability was expanded according to the respective LRT-induced mechanisms by including two separate algorithms for radiation- and non-radiation-based LRT [10].
Due to overall heterogeneity in tumor responses following LRTs, there is a significant clinical need for guidelines on response criteria for each treatment modality. While experts agree that response to cTACE should be measured using enhancement-based tools, the role of the LR-TRA in this context remains unclear, although some studies reveal potentially increased sensitivity in detecting viable tumor masses post-cTACE [11]. Additionally, interpreting the effects of ablation combined with prior embolization via cTACE is challenging [12]. Albeit the LR-TRA radiation core includes major irradiation-based therapies, there are still no recommendations for assessing tumor response for patients with HCC following iBT. Therefore, this study aims to compare established quantitative response assessment techniques and evaluate their prognostic value for survival in patients with HCC following iBT, both as a single treatment and in combination with prior cTACE.

2. Materials and Methods

2.1. Study Cohort, Design, and Endpoints

This retrospective observational single-center study was approved by the local institutional review board of ‘Charité-Universitätsmedizin Berlin’. Informed consent was waived due to the retrospective study design. The study protocol conforms to the ethical guidelines of the Declaration of Helsinki, as reflected in the prior approval by the institution’s human research committee. In total, 95 patients with a primary diagnosis of unresectable HCC who received either iBT (n = 48) or iBT in combination with cTACE one day prior to iBT (n = 47) between 01/2016 and 12/2017 were included in this study, allowing for an adequate follow-up period. Decisions on iBT alone or combined iBT ablation with cTACE as definitive treatment concepts were made by the institutional multidisciplinary tumor board (MTB) and at the discretion of the interventional radiologist. While iBT is considered to be the institute’s standard local ablation technique for the treatment of liver malignancies, combined iBT ablation with prior cTACE was considered in very large and highly vascularized lesions with the intent of increased treatment efficacy. All lesions were treatment-naïve to minimally invasive therapies. The primary HCC diagnosis was confirmed according to LI-RADS catalog or according to histopathology following a core needle biopsy.
The primary study endpoint was the comparison of patients’ survival when they were stratified as responders vs. non-responders according to RECIST, mRECIST, the WHO, the EASL, and LI-TRA radiation core assessed two and five months post-LRT. Parts of the study’s cohort have been included in analyses from original research published elsewhere [13].

2.2. Imaging and Clinical Data Retrieval

Baseline contrast-enhanced MR scans were obtained within 30 days prior to therapy and follow-up MR scans were acquired two months post-LRT, then every three months for the first year and every six months for the following years. Briefly, the MR protocol amongst T2-weighted sequences and diffusion weighted imaging included breath-hold unenhanced and contrast-enhanced T1-weighted imaging (VIBE and in-phase/opposed-phase FLASH) using a hepatocyte-specific contrast agent (Primovist, Bayer, Germany) including arterial, portal venous, venous, and hepatobiliary phases (15, 50, 90 s, and 20 min after contrast administration). MRI scans were either acquired by 1.5-Tesla scanners (Avanto and Aera) or a 3-Tesla scanner (Skyra, all Siemens, Erlangen, Germany) using an eight-channel body phased-array coil. Standard sequences were acquired in the axial plane covering the entire liver with 60–72 slices and with an adjusted field of view of 255–300 mm × 340–400 mm × z-axis. Images were evaluated with Visage PACS client version 7 (Visage Imaging). Additionally, medical records were reviewed using the oncologic database “Giessener Tumordokumentationssystem” to calculate the survival measures and progression patterns.

2.3. Response Assessment Measurements

Tumor response was assessed according to RECIST 1.1, mRECIST, the WHO, the EASL, and LR-TRA v2018 and v2024 radiation core criteria as they are described in detail elsewhere. Briefly, RECIST 1.1. and WHO were assessed using venous- and/or hepatobiliary-phase T1-weighted sequences and measurements that included the largest uni- and bidimensional diameter of viable tumors or post-therapeutic necrotic masses. mRECIST and the EASL were assessed using arterial-phase T1-weighted sequences and measurements that included the largest uni- and bidimensional diameter of enhancing viable tumors or post-therapeutic enhancing masses. Response assessment according to LI-TRA included evaluation on contrast-enhanced T1-weighted sequences as well as T2-weighted and diffusion weighted imaging regarding LI-TRA equivocal or non-progressing categories. Measurements were qualitatively performed [8,9,10]. Images were analyzed by two radiologists with four and nine years of experience in abdominal imaging, who did not allocate or perform the LRT and who were blinded to the respective survival outcomes. Patients were then stratified into responders (complete response, partial response, and LR-TRA non-viable) vs. non-responders (stable disease, progressive disease, LR-TRA viable, LR-TRA equivocal, and LR-TRA non-progressing, respectively). In this study, LR-TRA equivocal and non-progressing were categorized as analogous to stable disease and thus non-responders to simplify statistical analyses.

2.4. CT-Guided High-Dose-Rate Brachytherapy (iBT)

The detailed brachytherapy procedure is described elsewhere [14,15,16]. Briefly, patients obtained iBT under conscious sedation (midazolam and fentanyl) and with local anesthesia (lidocaine). Under CT-fluoroscopic guidance, a 6F angiographic sheath was inserted into the lesion, followed by a closed-end 6F brachytherapy catheter (Primed, Halberstadt, Germany) which was put through the sheath. The catheter arrow was depicted in relation to the tumor on a contrast-enhanced CT scan with primary slice thickness of 1 mm and reconstructed slice thickness of 5 mm. Further treatment planning was performed on a 3D radiation planning workstation (Brachyvision, Varian Medical Systems, Palo Alto, CA, USA) with the clinical target volume being manually drawn on planning scans. Intentionally, each lesion is thought to be ablated with a tumor-enclosing target dose of 20 gray (Gy) using an iridium-192 source (Gammamed 12, Varian Medical Systems). Adjacent structures at risk (e.g., stomach or duodenum) were manually marked, and their dosages were calculated as well. When necessary, overall dosage was modified according to Collettini et al. [6]. After treatment completion, the catheter was retracted and the puncture channels were sealed with resorbable thrombogenic material (Gelfoam, Pfizer Inc., New York, NY, USA).

2.5. Conventional Transarterial Chemoembolization (cTACE)

cTACE was performed under conscious sedation as previously described [17]. Intraarterial access was established through the common femoral artery. The tumor-feeding arteries were catheterized using a microcatheter and a microcatheter with guidewires. Once tumor blush confirmed the segmental or sub-segmental catheter placement, an emulsion comprising 5 cc of chemotherapy (50 mg doxorubicin in 2.5 cc and 1 mg of mitomycin-C in 2.5 cc) and 10 cc of ethiodized oil (Lipiodol; Guerbet, Villepinte, France) mixed in a ratio of 1:2 was slowly injected into the tumor site. Under digital subtraction angiographic control, the amounts of the mixture administered were titrated to the tumor burden followed by injection of Gelfoam (Pfizer Inc., New York, NY, USA) until blood flow stasis as the angiographic endpoint. Furthermore, pre- and post-procedural cone beam CT scans were frequently performed to assess tumor vascularization and Lipiodol distribution [18].

2.6. Completed Treatment Cycles

Sequential treatment cycles were routinely performed in patients with multifocal or large lesions at baseline with the intent to avoid adverse effects from tumor lysis or to reduce cumulative puncture risk. Finally, a treatment cycle was considered completed when all target lesions determined at baseline had been completely irradiated with the target dose of 20 Gy by iBT and/or when the Lipiodol following cTACE was homogenously distributed within the whole tumor mass.

2.7. Survival and Tumor Progression Measures

Overall survival (OS) was defined at the patient level as the time between completed treatment cycle and the date of death. Patients were censored in the event of eventual orthotopic liver transplantation (OLT), if they received additional LRT on the target lesion, or if they were alive at the end of follow-up.
Progression-free survival (PFS) was defined at the patient level as the time between a completed treatment cycle and death or the occurrence of tumor progression. Patients were censored at the respective time point in the event of OLT, if they received additional LRT on the target lesion, or if they were alive at the end of follow-up.
Time to progression (TTP) was defined at the tumor level as the time between completed treatment cycle and the occurrence of tumor progression. Patients were censored in the event of OLT, if they received additional LRT on the target lesion, or if they were alive at the end of follow-up.
In addition to overall PFS and TTP, two subtypes of progression patterns were analyzed. Local tumor progression (LTP) subtype was defined as an increase in the target lesion at any time after therapy, and intrahepatic distant recurrence (IDR) considered the occurrence of any new intrahepatic lesion that was not spatially associated with the primary target lesion.
New intrahepatic lesions that were not present at baseline but appeared during follow-up were considered tumor progression in the calculation of PFS (patient level). However, treatments of these new lesions were considered for the calculation of TTP (tumor level) as separate completed treatment cycles [19].

2.8. Statistics

The last follow-up data were collected on 23 December 2024. Descriptive statistics were reported as mean ± standard deviation (SD) or median and interquartile range (IQR), respectively. Statistical analysis included Fisher’s exact test, normality test, t-test, Mann–Whitney U test for comparing grouped patient and disease characteristics, Kaplan–Meier analysis, and log-rank test for the analysis of survival measures in regards to the treatment response criteria. Cox proportional hazard models of selected baseline patient, tumor, and disease characteristics and laboratory values were performed with OS, PFS, and TTP as dependent variables. Statistical significance was defined as a p-value < 0.05 for any analysis and <0.1 for regression analysis. Statistical analysis was performed using GraphPad Prism V9.0.0 (GraphPad Software Inc., La Jolla, CA, USA).

3. Results

3.1. Patient and Disease Characteristics
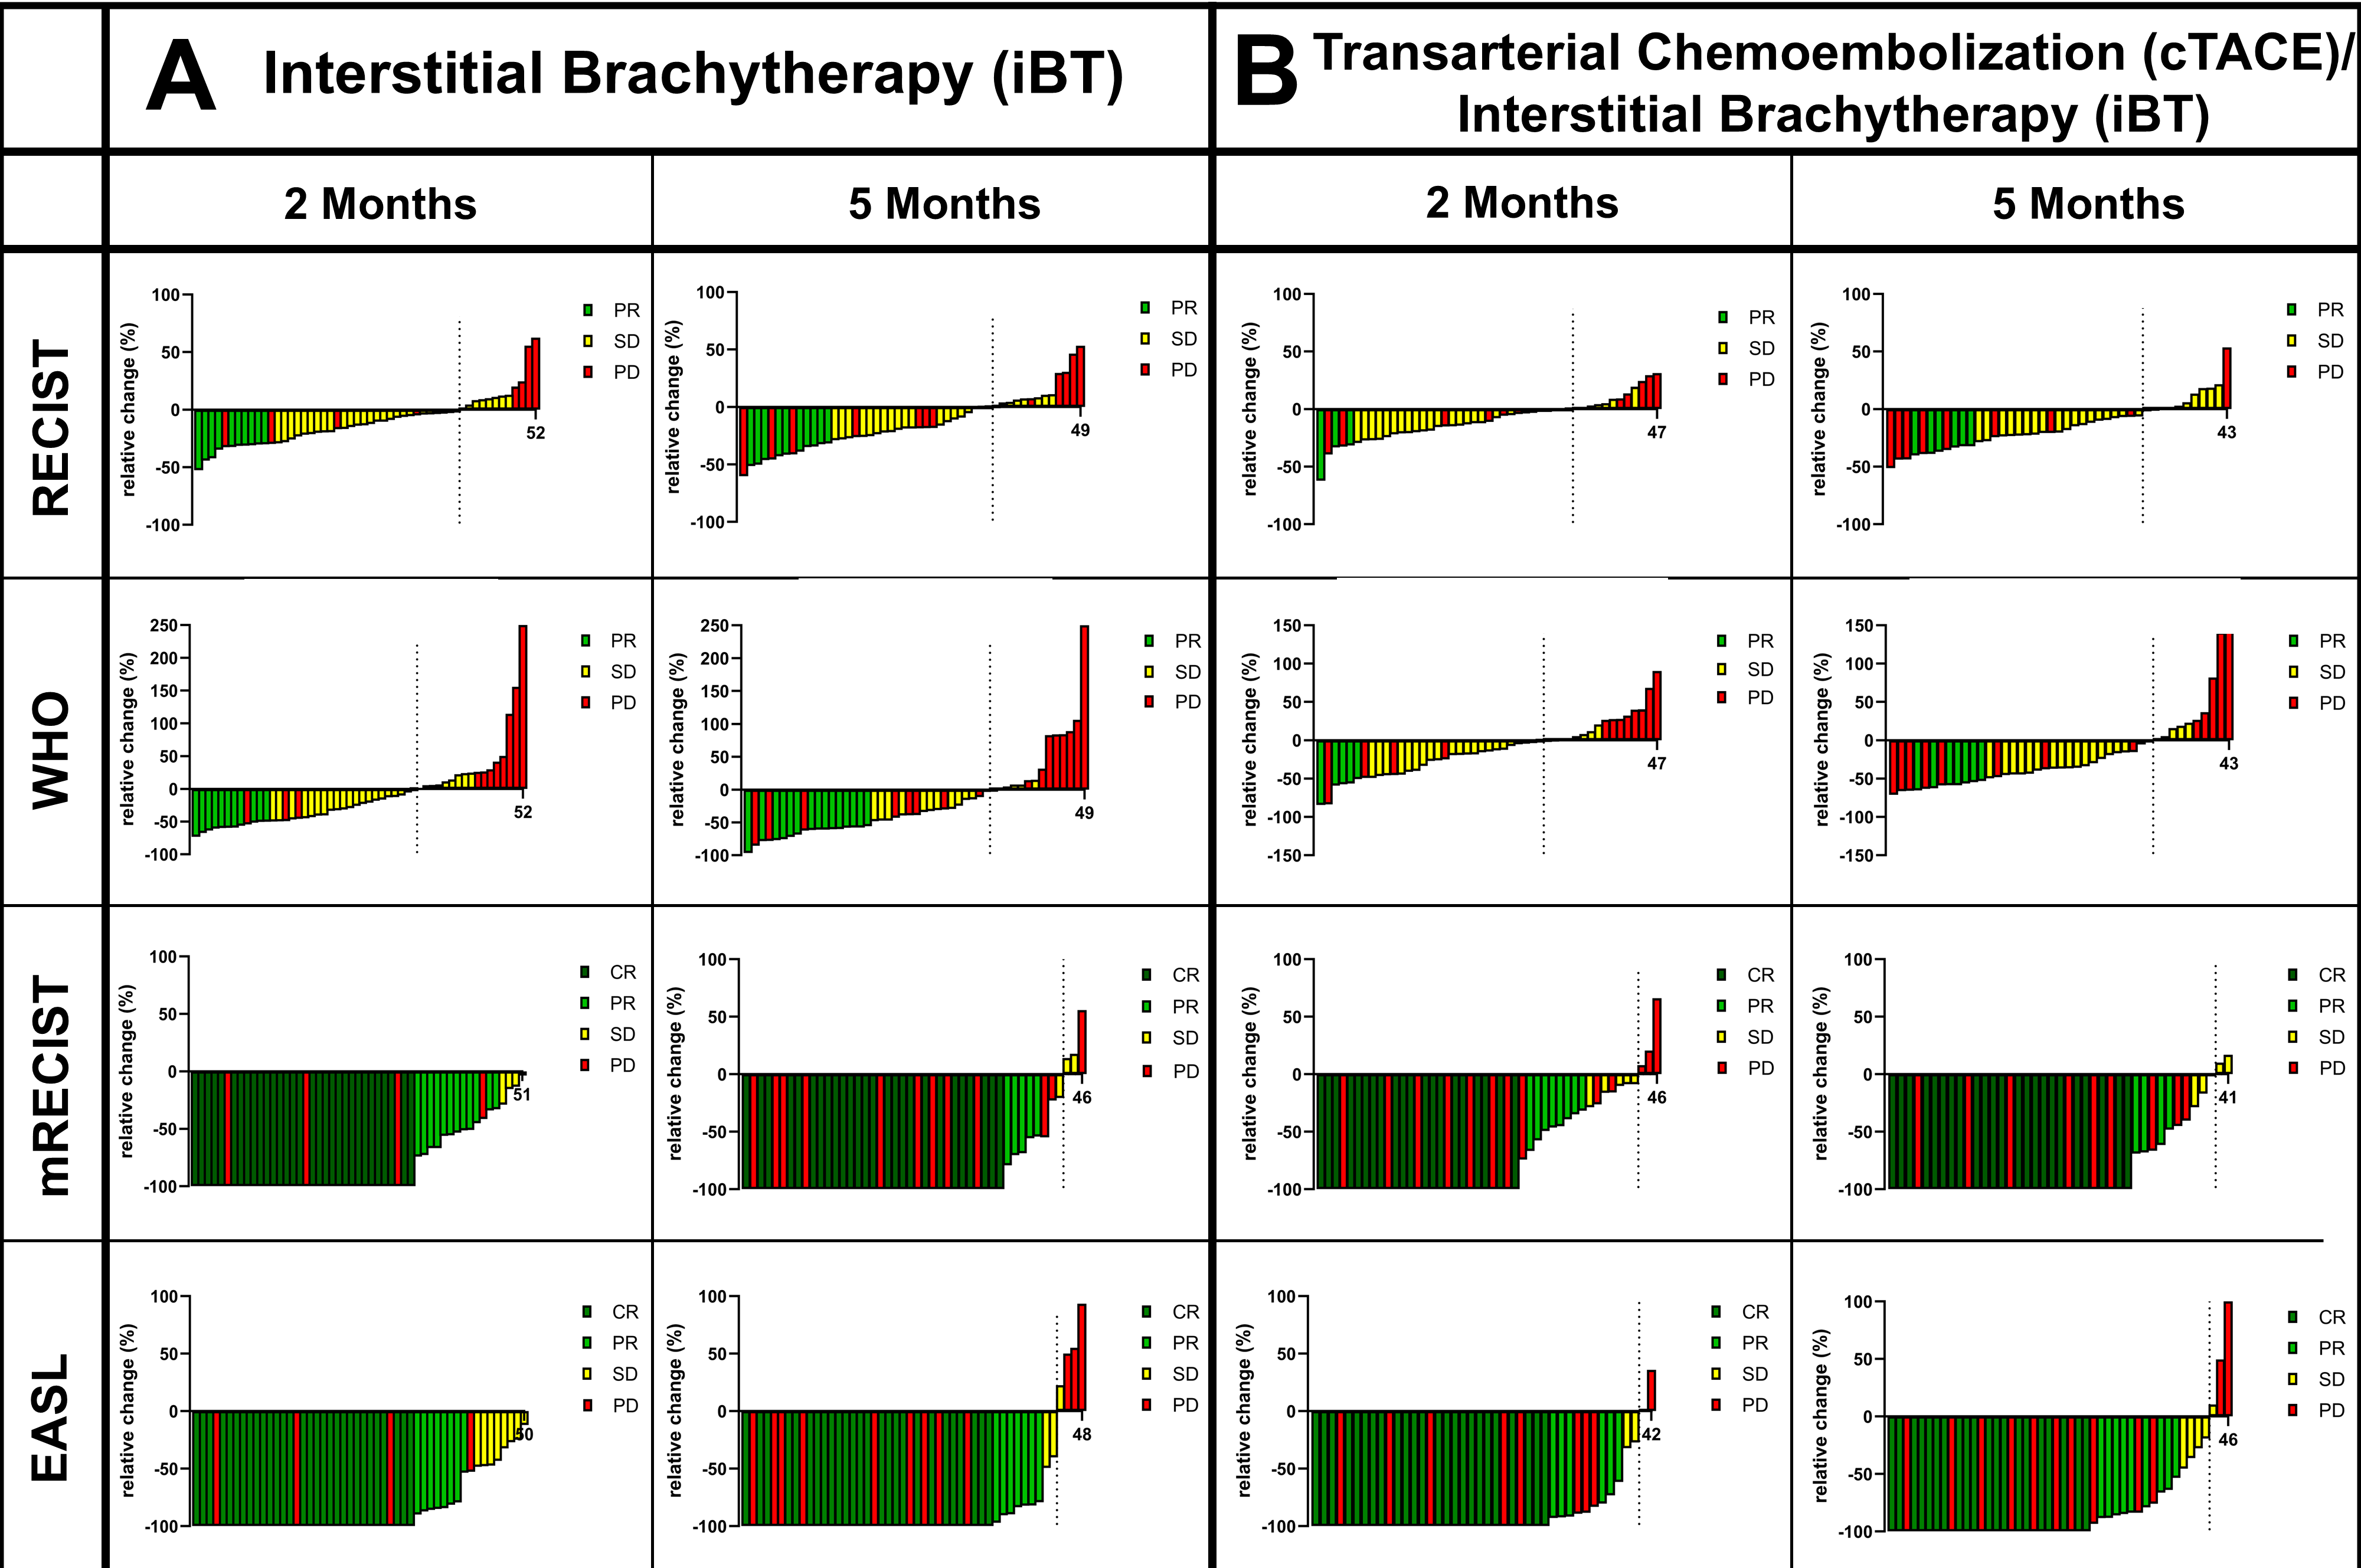
In total, 48 patients with 89 target tumors underwent iBT including 60 completed therapy cycles, while 47 patients with 70 target tumors received combined cTACE and iBT, including 51 completed therapy cycles. The mean age was 70.6 ± 9.3 and 70.3 ± 9.5 years in patients following iBT and cTACE/iBT (p = 0.84), and 79.2% vs. 76.6% were male (p = 0.81), respectively. Patients undergoing iBT had 1.4 ± 0.7 lesions (uni- vs. multifocal: 41 vs. 19) at baseline with a mean index lesion diameter of 26.5 ± 10.6 mm, and patients treated with cTACE/iBT had 1.5 ± 0.9 lesions (uni- vs. multifocal: 38 vs. 13, p = 0.53) with a mean index lesion diameter of 44.3 ± 20.4 mm (p < 0.01), respectively. Patients, tumor, and disease characteristics and laboratory values are summarized in Table 1.

3.2. Tumor Response

Tumor response assessments via follow-up imaging were feasible for 99 completed treatment cycles (89.2%) two months post-LRT (median [IQR]: 2.3 [2.0, 2.8] months) as well as for 92 completed treatment cycles (82.9%) five months post-LRT (median [IQR]: 5.3 [4.8, 6.2] months) mainly to due deviating from imaging protocols or events like OLT or death during follow-up. The survival measure times for non-responders vs. responders following both iBT and cTACE/iBT, respectively, as well as the log-rank test’s p-values are reported in detail in Supplementary Table S1 (iBT), Supplementary Table S2 (cTACE/iBT), and Table 2 (log-rank test’s p-values).
The size-based criteria identified significantly less responders than non-responders at two months post-iBT (RECIST: 19.2% vs. 80.8%, p < 0.01, and WHO: 21.2% vs. 78.8%, p < 0.01) and at five months post-iBT (RECIST: 20.4% vs. 79.6%, p = 0.01, WHO: 30.6% vs. 69.4%, p = 0.01) as well as at two months post-cTACE/iBT (RECIST: 6.4% vs. 93.6%, and WHO 10.6% vs. 89.4%, p < 0.01) and at five months post-cTACE/iBT (RECIST: 13.9% vs. 86.1%, and WHO: 16.3% vs. 83.7%, p < 0.01).
In contrast, the enhancement-based criteria identified more responders than non-responders at two months post-iBT (mRECIST: 84.3% vs. 15.7%, p < 0.01, EASL: 76.5% vs. 23.5%, p = 0.01) and at five months post-iBT (mRECIST: 66.7% vs. 33.3%, p = 0.02, EASL: 70.8% vs. 28.8%, p = 0.01) as well as at two months post-cTACE/iBT for mRECIST (61.7% vs. 38.3%, p = 0.03), but not for the EASL at two months (53.2% vs. 46.8%, p = 0.67) or at five months post-cTACE/iBT (mRECIST: 66.7% vs. 33.3%, p = 0.01, EASL: 71.4% vs. 38.6%, p < 0.01, Figure 1).
The LR-TRA v2018 and v2024 radiation core identified more responders than non-responders at two months post-iBT (responders vs. non-responders, LR-TRA v2018: 67.3% vs. 32.7%, p = 0.02, LR-TRA v2024: 74.6% vs. 25.4%, p < 0.01) and at five months post-iBT (LR-TRA v2018: 71.4% vs. 28.6%, p = 0.01, LR-TRA v2024: 65.9% vs. 34.1%, p = 0.03) as well as at two months post-cTACE/iBT (LR-TRA v2018: 68.7% vs. 31.3%, p = 0.02, LR-TRA v2024: 71.0% vs. 29.0%, p < 0.01) and at five months post-cTACE/iBT for the LR-TRA v2024 (71.8% vs. 28.2%, p < 0.01) but not for the LR-TRA v2018 (64.1% vs. 35.9%, p = 0.06; Figure 2).

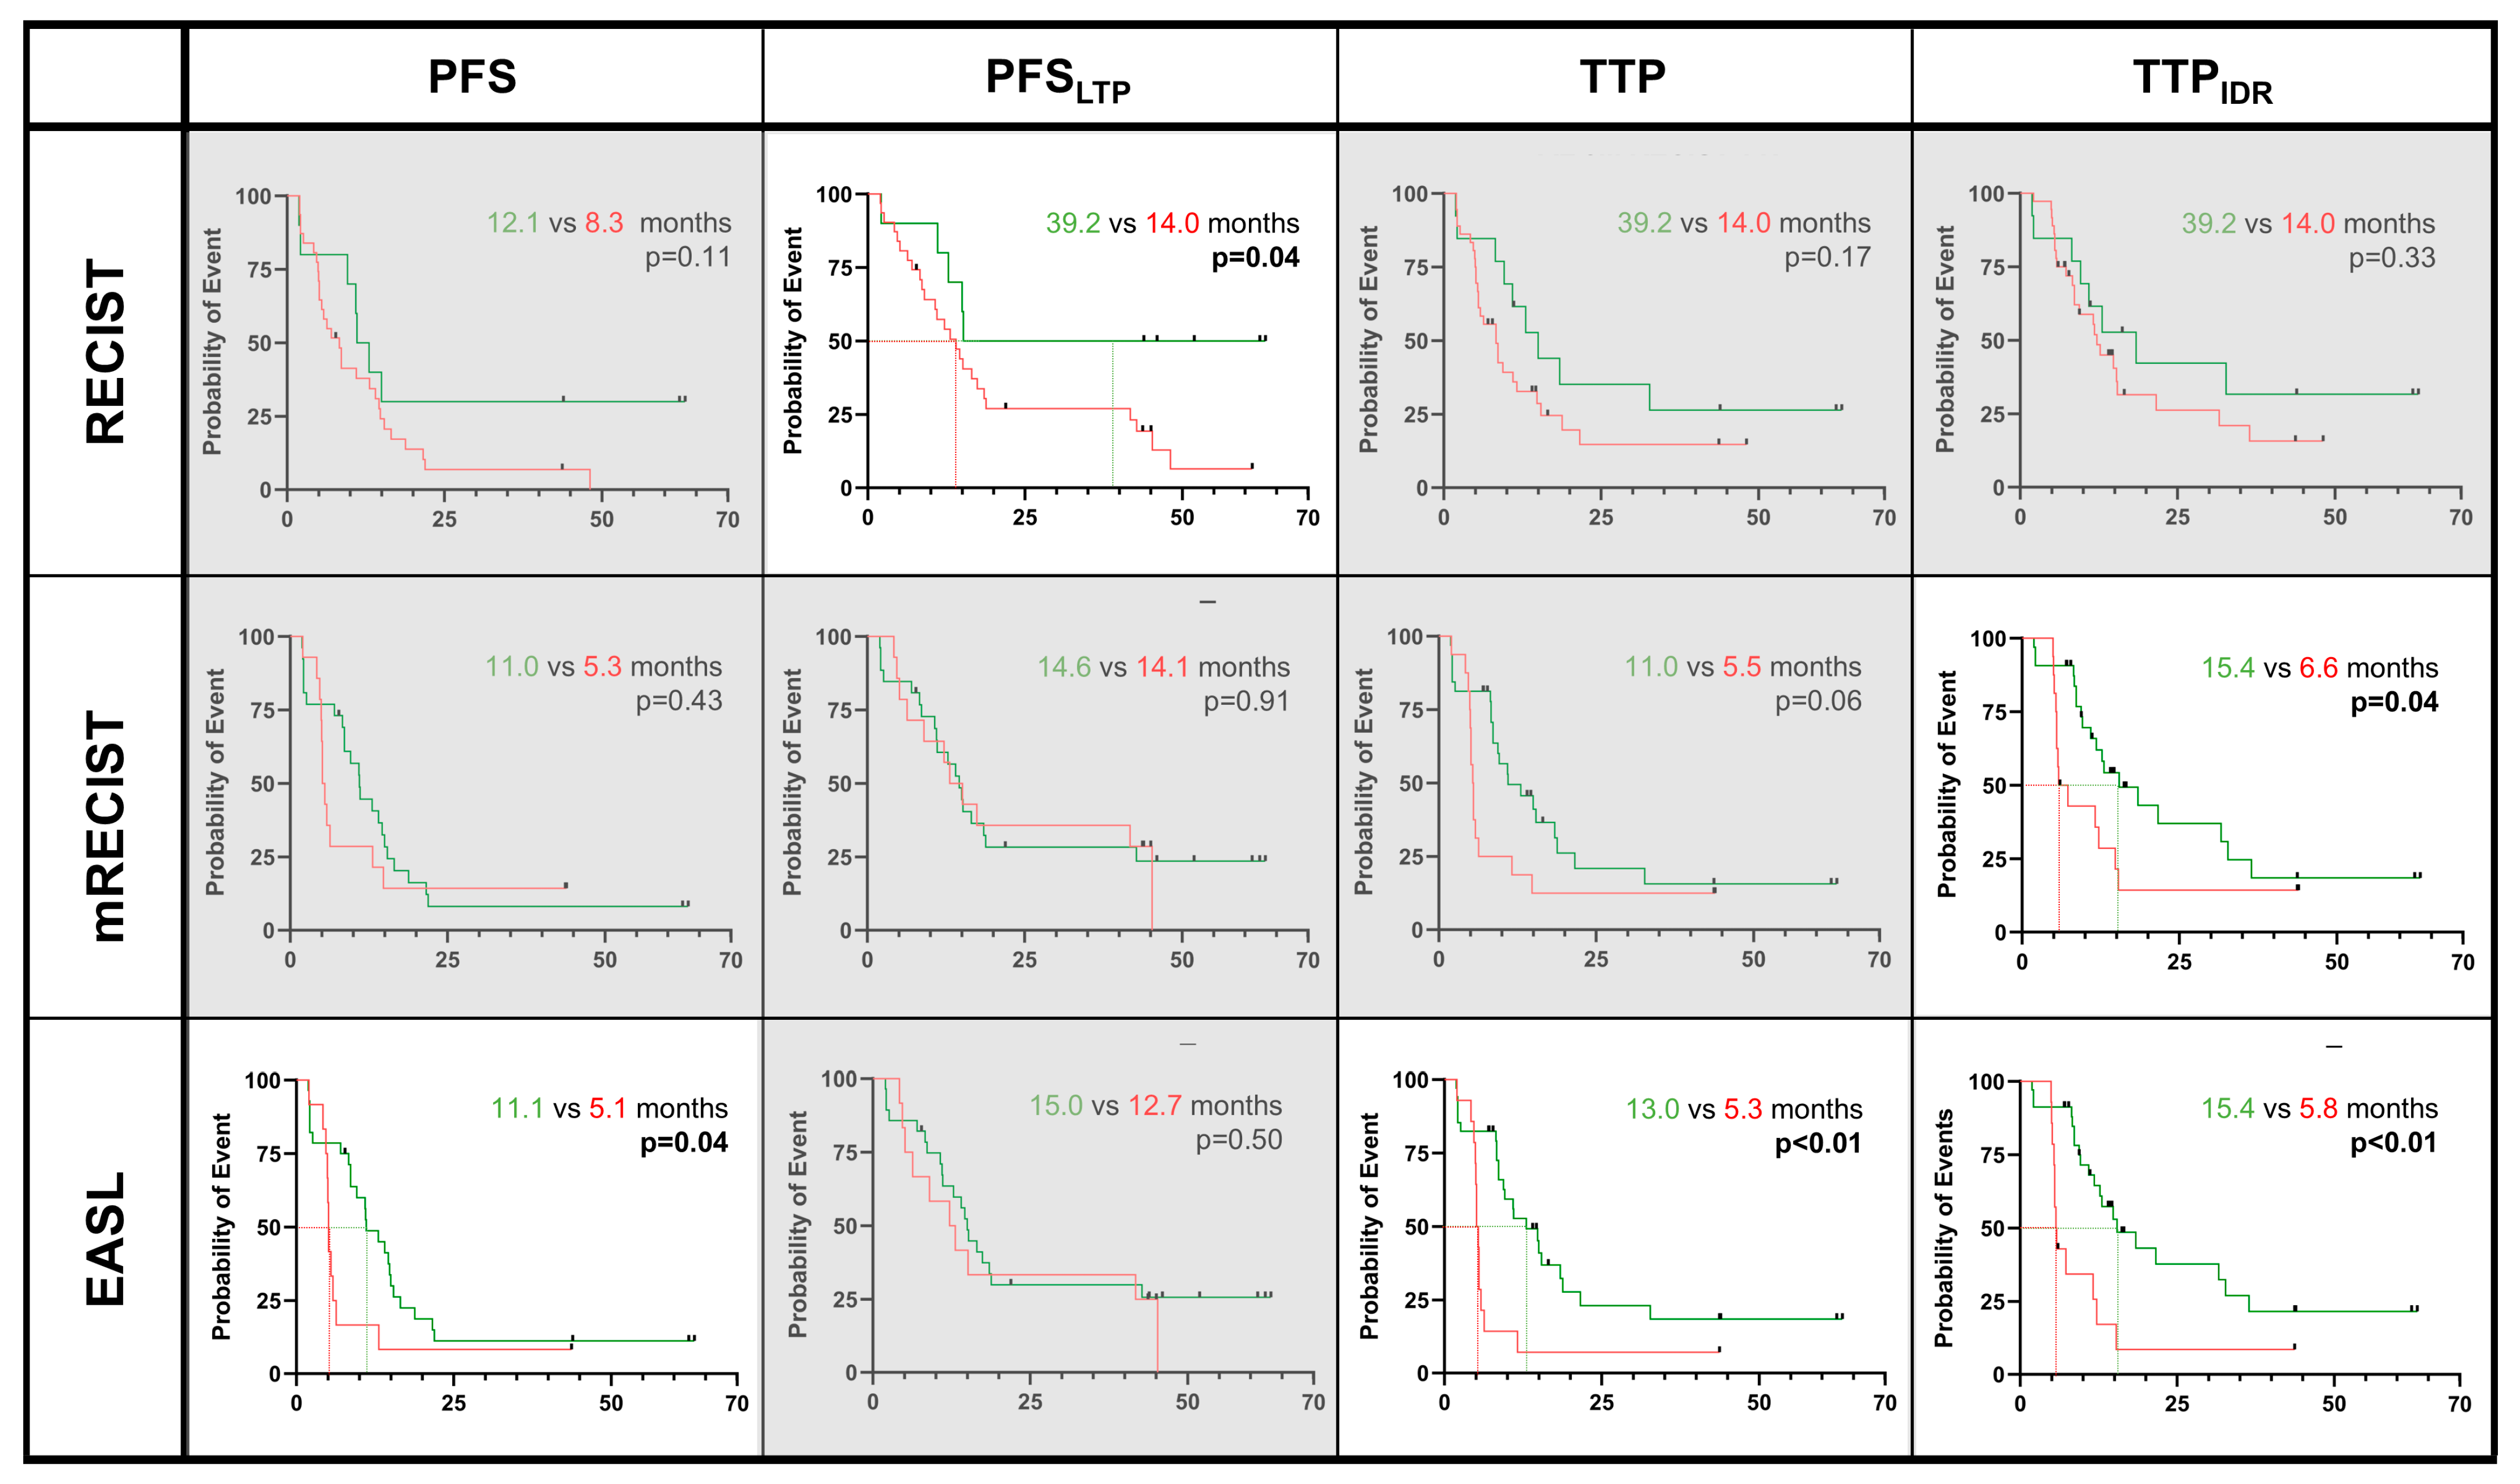
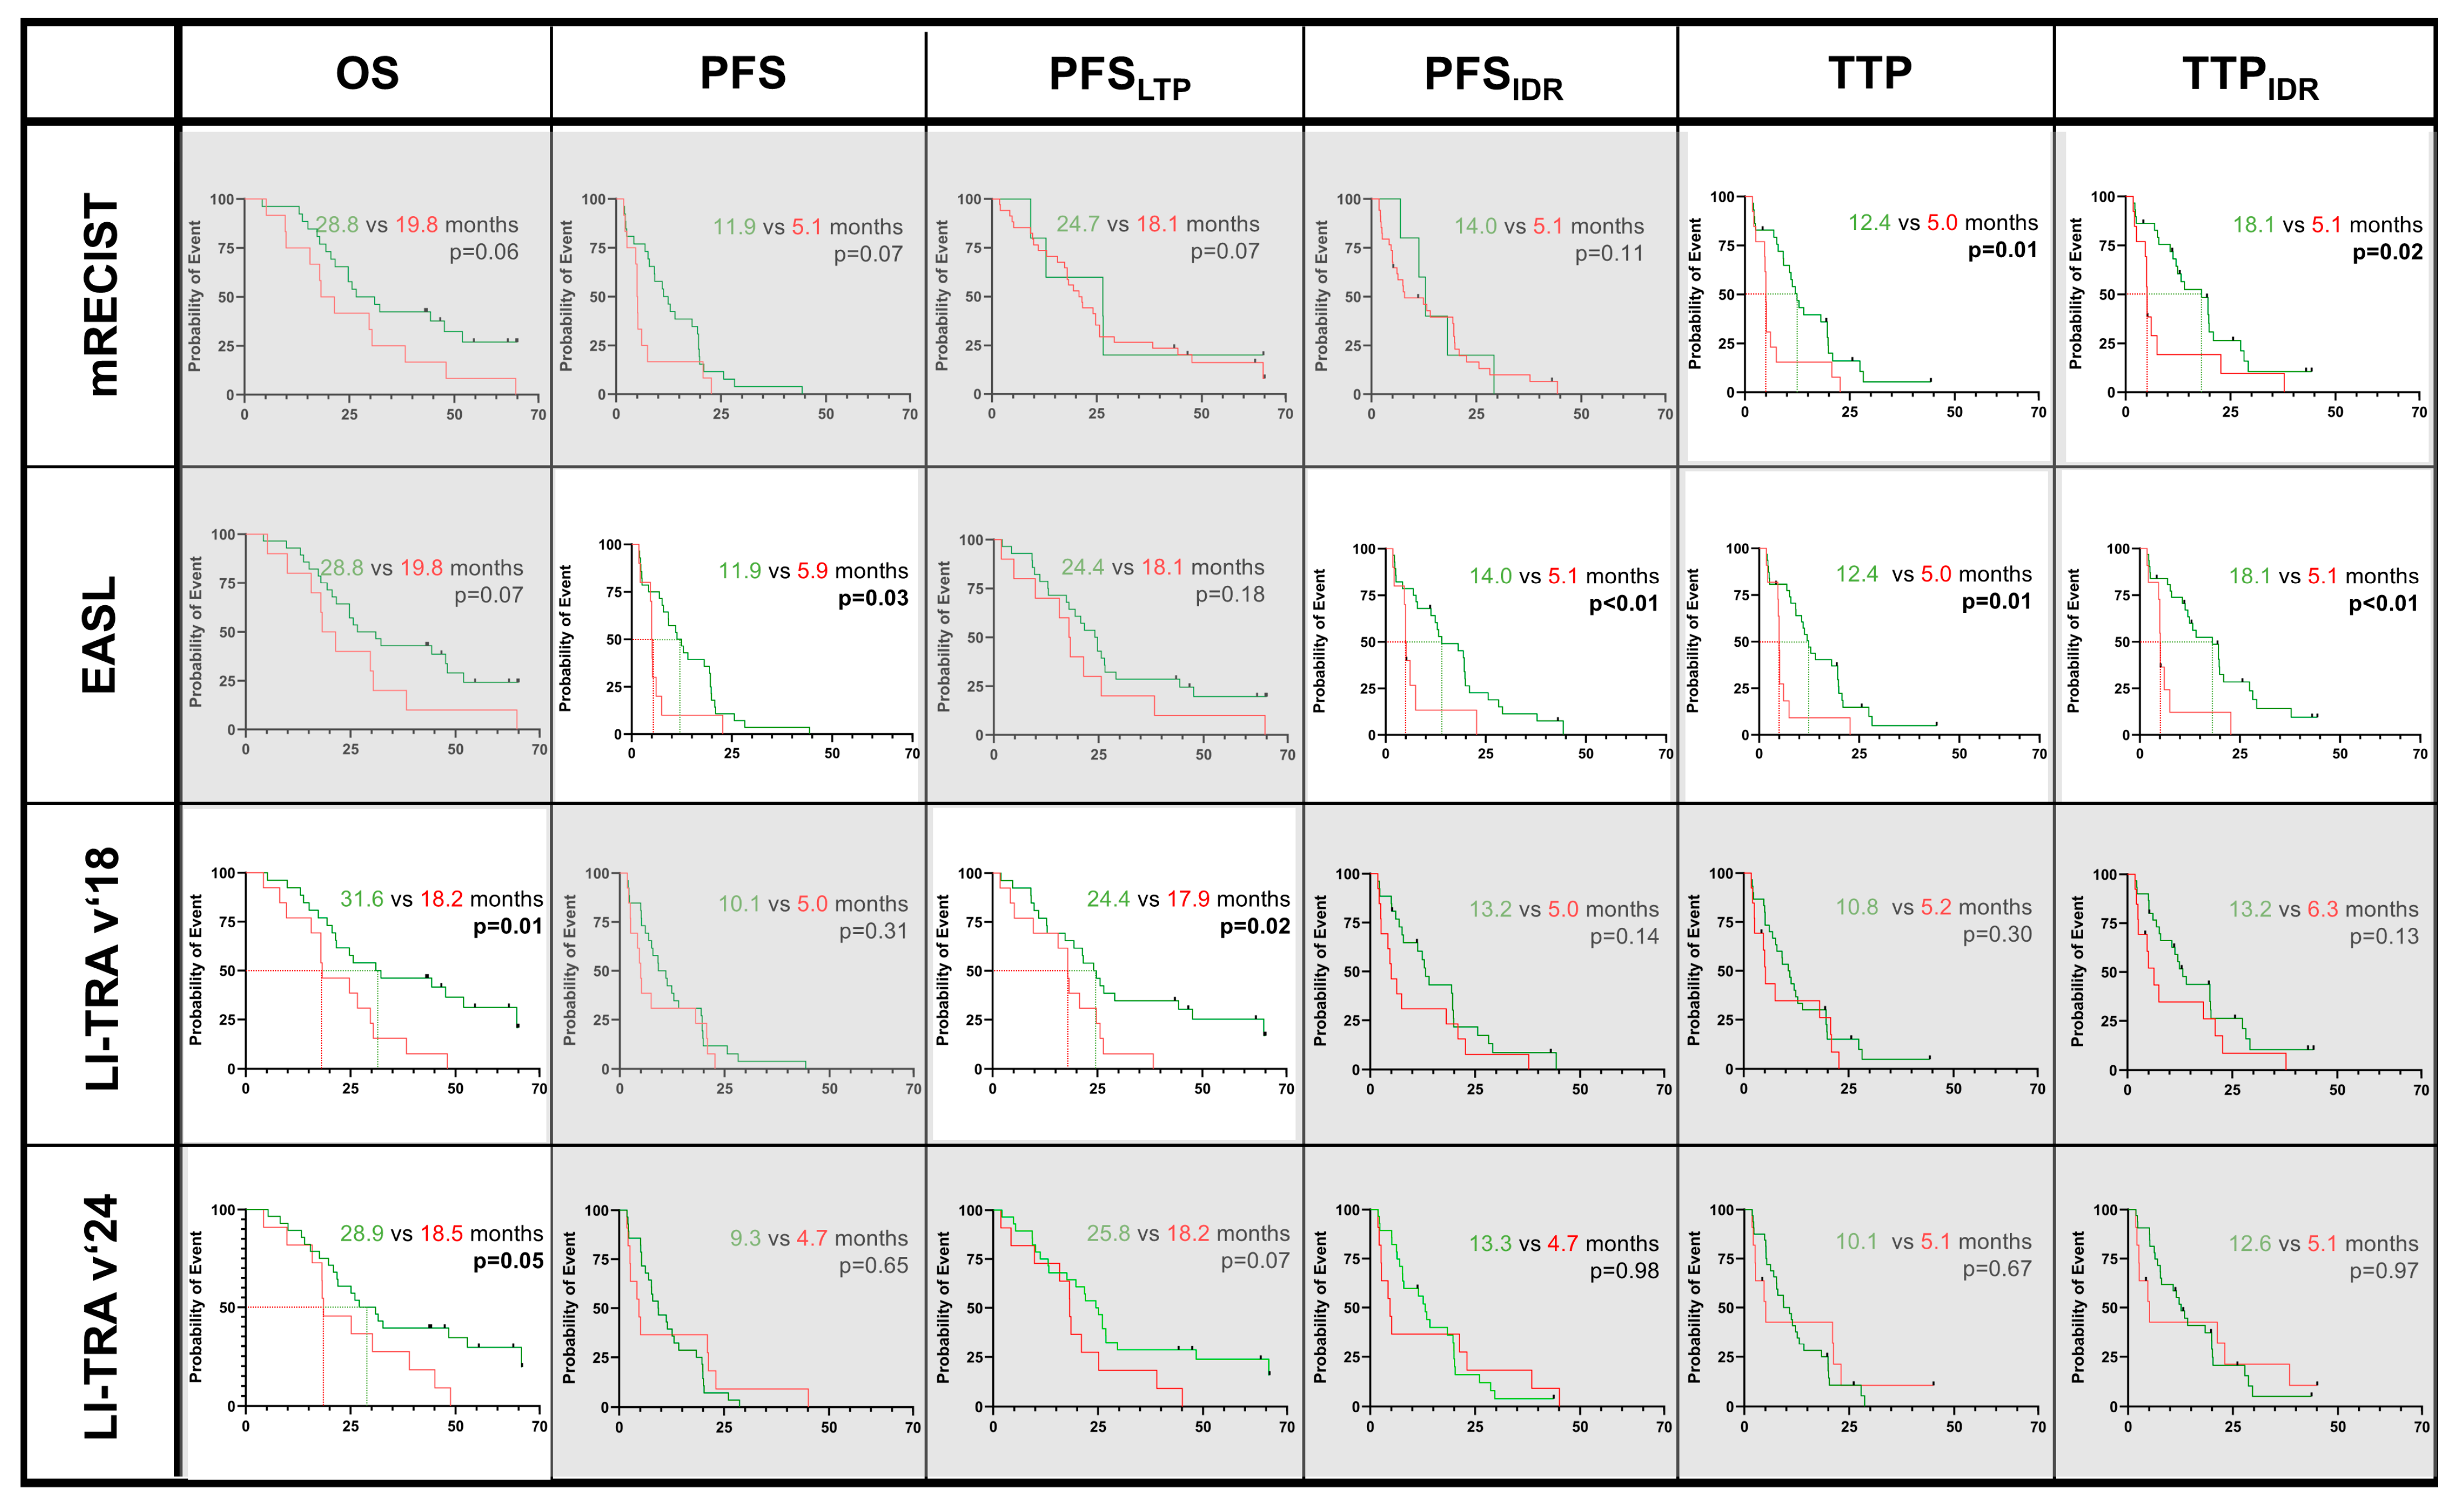
3.3. Predicting OS, PFS, and TTP Regarding Response Criteria

The median OS and PFS did not differ between patients following iBT or cTACE/iBT (iBT vs. cTACE/iBT, median OS [IQR]: 26.3 [14.4, 45.3] months vs. 23.3 [13.8, 47.6] months, p = 0.71, and median PFS [IQR]: 9.1 [4.7, 15.4] months vs. 7.6 [2.6, 19.4] months, p = 0.39). However, TTP was significantly longer in the iBT group compared to the cTACE/iBT group (median [IQR]: 13.0 [5.8, 43.7] months vs. 9.2 [4.7, 19.6] months, p = 0.04) (Supplementary Figure S1).
iBT patients: In patients undergoing iBT, stratification according to the size-base criteria as early as two months post-iBT did not yield significant differences in patient survival. However, at five months post-iBT, the responders showed prolonged PFSLTP times compared to non-responders by RECIST (responders vs. non-responders, median [IQR]: 11.0 [4.7, 18.8] months vs. 0.8 [0.4, 11.1] months, p < 0.01).
As for the enhancement-based criteria that were assessed as early as two months of follow-up, no significant differences in patients’ survival were observed. However, at five months post-iBT, responders showed a prolonged TTPIDR subtype according to mRECIST (median [IQR]: 15.4 [9.4, 32.7] months vs. 6.6 [5.4, 14.8] months, p = 0.05), while responders showed a prolonged PFS time according to the EASL (median [IQR]: 11.1 [7.0, 16.50] months vs. 5.1 [4.7, 5.8] months, p = 0.04), TTP (median [IQR]: 13.0 [8.3, 21.6] months vs. 5.3 [4.9, 5.9] months p < 0.01) and TTPIDR subtype (median [IQR]: 15.4 [9.4, 36.4] months vs. 5.8 [5.4, 12.2] months, p < 0.01) compared to non-responders (Figure 3).
The LR-TRA v2018 criteria and v2024 radiation core revealed no significant trends in patients’ survival at any follow-up time point post-iBT.
cTACE/iBT patients: In patients following combined cTACE and iBT, the size-base criteria did not show significant predictions for any survival measure that was assessed two or five months post-cTACE/iBT.
However, regarding the enhancement-based criteria, mRECIST significantly separated the survival curves of responders and non-responders at two months post-cTACE/iBT for the PFS and PFSIDR subtypes and for the TTP and TTPIDR subtypes and at five months post-cTACE/iBT for the TTP and TTPIDR subtypes, while responders showed better PFS and PFSIDR subtypes according to the EASL as well as the TTP and TTPIDR subtypes at both two and five months post-cTACE/iBT.
Notably, responders according to the EASL predicted prolonged PFS assessed as early as after two months (median [IQR]: 11.0 [5.2, 19.6] months vs. 2.3 [1.9, 5.2] months, p < 0.01) and after five months post-cTACE/iBT (median [IQR]: 11.9 [4.2, 19.6] months vs. 5.1 [4.7, 6.1] months, p = 0.03), PFSIDR after two months (median [IQR]: 13.2 [7.5, 19.9] months vs. 2.3 [1.9, 6.3] months, p < 0.01) and after five months post-cTACE/iBT (median [IQR]: 14.0 [6.9, 20.9] months vs. 5.1 [4.7, 7.5] months, p = 0.01), TTP after two months (median [IQR]: 11.9 [6.1, 19.8] months vs. 2.4 [1.9, 5.2] months, p < 0.01) and after five months post-cTACE/iBT (median [IQR]: 12.4 [7.6, 19.9] months vs. 5.0 [4.7, 6.1] months, p < 0.01), and TTPIDR after two months (median [IQR]: 18.1 [7.6, 28.2] months vs. 2.4 [1.9, 6.3] months, p < 0.01) and after five months post-cTACE/iBT (median [IQR]: 18.1 [7.9, 27.4] months vs. 5.1 [4.7, 6.1] months, p < 0.01), respectively (Figure 4).
Additionally, the LR-TRA criteria measured as late as five months post-cTACE/iBT revealed prolonged OS for responders (LR-TRA v2018: median OS [IQR]: 31.6 [19.4, 64.6] months vs. 18.2 [15.6, 29.7] months, p < 0.01 and LR-TRA v2024: median OS [IQR]: 29.0 [17.5, 65.7] months vs. 18.5 [15.8, 38.9] months, p = 0.05) as well as prolonged PFSLTP (LR-TRA v2018: median PFSLTP [IQR]: 24.4 [12.9, 64.6] months vs. 17.9 [9.7, 24.7] months, p = 0.05, but not for the LR-TRA v2024 radiation core: median PFSLTP [IQR]: 24.8 [11.2, 48.4] months vs. 18.2 [9.8, 21.0] months, p = 0.07). However, LR-TRA did not reveal any significant trends in patient survival stratified by response criteria at two months post-cTACE/iBT.

3.4. Confounders of OS, PFS, and TTP

The univariate Cox proportional hazard models revealed age (p = 0.07), sum of lesion diameter (p = 0.02), BCLC stage C (p = 0.09), and ALBI score (p < 0.01) as significant predictors of OS. Moreover, sum of lesion diameter (p = 0.08) and ALBI score (p<0.01) were confirmed as such in a subsequent multivariate analysis. Regarding PFS and TTP, only the ALBI score was significantly associated (p = 0.09) with PFS and BCLC stage C (p = 0.09) with TTP (Supplementary Table S3). Hereby, a consecutive multivariate analysis was obsolete.

4. Discussion

This study revealed the superiority of enhancement-based response criteria (mRECIST, EASL, and LR-TRA) over size-based criteria (RECIST 1.1 and WHO) in predicting outcomes in patients with HCC following both iBT and cTACE/iBT. Specifically, responders identified by mRECIST and the EASL showed significantly better PFS and TTP. The overall favorable response following iBT was measurable later than that following the combination of iBT with prior cTACE. While the LR-TRA did not predict tumor progression, it identified responders with better OS and PFS related to local tumor progression (PFSLTP) compared to non-responders.
Size-based criteria, particularly RECIST 1.1, remain widely used for assessing treatment response in solid tumors due to their simplicity and established prognostic potential [20,21]. However, RECIST was originally designed to evaluate morphological changes in tumor size following conventional chemotherapies. Thus, it may underestimate treatment responses induced by LRT, which often result in necrosis and fibrosis without immediate tumor shrinkage. In contrast, mRECIST and EASL criteria, which consider tumor devascularization and necrosis as response patterns, are more suitable for evaluating LRT, especially embolotherapies [22,23]. Accordingly, this study demonstrated higher numbers of responders according to mRECIST and the EASL and poorer PFS and TTP values for non-responders following both iBT and combined cTACE/iBT. Hence, these findings suggest that besides treatment modality, the tumor’s imaging appearance and characteristics (e.g., hypervascularization) should be considered when defining response patterns.
While both mRECIST and the EASL were equally applicable and prognostic for patients post-cTACE/iBT, the EASL proved more reliable post-iBT, highlighting the superior prognostic value of bidimensional measurements in this context. Unidimensional assessments may not adequately assess atypical necrosis patterns or may overestimate post-therapeutic perifocal hyperemia as viable tumor tissue [24].
Unlike thermal ablation techniques, iBT induces gradual necrosis without immediate tumor shrinkage, which explains the lower initial numbers of responders given by the size-based criteria. Additionally, the study revealed that more responders were detected at five months of follow-up compared to eight weeks using enhancement-based tools, suggesting that follow-up visits should not be scheduled too early to prevent unnecessary additional therapies and to reduce clinical healthcare costs due to over-surveillance.
Despite their prognostic value, size- and enhancement-based uni- and bidimensional measures are criticized for their simplicity, potentially failing to capture the complexity of tumor heterogeneity and resilience mechanisms, particularly in heterogeneous tumors like HCC that develop in cirrhotic livers [25]. Advanced tools such as three-dimensional (3D) quantitative (q)EASL promise more accurate tumor response assessments, but their implementation in clinical practice is hindered by their labor-intensive complexity and the difficulties encountered in terms of software distribution and user friendliness [24,26].
In comparison, LR-TRA criteria were developed as a semantic feature-based algorithm to facilitate treatment response assessment in HCC lesions [9,12]. The updated LR-TRA v2024 catalog includes two separate algorithms for non-radiation and radiation-based therapies [10] replacing the nowadays obsolete v2018 catalog. However, in this study, both the old and new LR-TRA radiation core algorithms were included to evaluate their advantages. This study found the LR-TRA to have a prognostic value for OS (both v2018 and v2024) and for PFS related to local tumor progression (PFSLTP for LR-TRA v2018 only), possibly due to its comprehensive approach considering major criteria like size and enhancement changes, as well as the recently added criteria of T2-weighted and diffusion-weighted imaging, indicating tumor viability or necrosis patterns. However, in this study, the LR-TRA v2024 radiation core did not show superiority compared to the standard LR-TRA v2018 core at predicting survival measures post-LRT. The LR-TRA may in fact better reflect local post-therapeutic alterations indicating local tumor recurrence and poorer patient survival by including various imaging features; however, these alterations are heterogeneous and may vary among patients since they might be affected by the underlying liver disease and tumor subtype. Moreover, higher inter-reader variability could limit the LR-TRA’s prognostic efficacy [27]. Therefore, commonly cited radiomics could expand the promising approach of incorporating ancillary imaging findings into diagnostic algorithms that reveal mutual image information and may better reflect tumor heterogeneity at baseline as well as in follow-up imaging post-LRT. This could possibly help to design personal treatment strategies and support early follow-up prognostics [28]. Similarly, mutual tumor burden biomarkers are currently being investigated (e.g., circulating tumor DNA (ctDNA)), showing promise in predicting early tumor responses for various cancer types following surgical, local ablative, and systemic treatments [29]. Overall, categorizing treatment response following iBT remains challenging since it is classically considered a radiation-based modality and could potentially be evaluated similarly to non-radiation-based RFA and MWA due to its ablative nature.
Given its retrospective single-center design, this study has some limitations. A limited number of patients were included in each treatment group. While patients in both groups shared similar age and gender distributions, they differed in terms of tumor size, lesion count, and some baseline lab values. However, the comparison of both groups was not the focus of this study, and the results from both treatments were evaluated separately. Moreover, they did not differ regarding OS or PFS, but patients receiving monotherapy via iBT alone had better TTP compared to patients with combined cTACE/iBT since the treatments were allocated by the MTB depending on the disease stage and tumor extent. Usually, patients that were suitable for cTACE/iBT combination therapy had larger lesions and therefore a probable more severe underlying liver disease, which is favorable for a consecutive event of IDR. Although underlying liver disease and tumor characteristics are known prognostic markers for the outcome of patients with HCC, this study focused on the prognostic value of the tested response criteria to support their potential for clinical implementation in a real-life setting. The reproducibility of the study’s findings may rely on the MRI scanner and protocol as well as the contrast agent. Lastly, the follow-up imaging time points were defined by the routine clinical schedule of our tertiary care center. Future studies are needed to identify the exact onset of measurable therapy-induced alterations following LRT.

5. Conclusions

In conclusion, the enhancement-based criteria proved to be more reliable tools compared to the size-based criteria in determining treatment response in patients with HCC following ablation via iBT alone or iBT combined with prior cTACE. While prior embolotherapy resulted in measurable tumor necrosis as early as eight weeks post-LRT, response to iBT mostly became measurable after five months of follow-up. These findings highlight the importance of considering tumor biology and imaging characteristics in response assessments. Efficient monitoring strategies should be tailored to the treatment modality and the timing to obtain a measurable response to avoid unnecessary additional treatments.

Supplementary Materials

The following supporting information can be downloaded at: https://www.mdpi.com/article/10.3390/cancers17081275/s1, Table S1: Survival measures comparing patients stratified as non-responders vs. responders following interstitial brachytherapy (iBT); Table S2: Survival measures comparing patients stratified as non-responders vs. responders following conventional chemoembolization (cTACE)/interstitial brachytherapy (iBT); Table S3: Uni- and multivariate cox proportional hazard model results; Figure S1: Overall survival (OS), progression-free survival (PFS) and time to progression (TTP) in patients following interstitial brachytherapy (iBT) alone or with a combined 38 prior conventional transarterial chemoembolization (cTACE/iBT).

Author Contributions

Conceptualization: R.S., C.A.H., B.G. and L.J.S.; Data Curation: R.S., L.N., R.R., T.P. and L.J.S.; Formal analysis: R.S., R.R., S.A.A. and L.J.S.; Funding Acquisition: not applicable; Investigation: R.S., C.R., H.X., Y.H., E.Y.Y., L.H., O.S., Y.L., L.N., F.H., R.R., S.A.A., C.A.H., T.P. and L.J.S.; Methodology: R.S., C.A.H. and L.J.S.; Project Administration: B.G. and L.J.S.; Resources: B.G. and L.J.S.; Software: R.S., L.N., R.R. and L.J.S.; Supervision: B.G. and L.J.S.; Validation: R.S., R.R., C.A.H. and L.J.S.; Visualization: R.S., C.R., L.H., O.S., L.N., R.R. and L.J.S.; Writing—Original Draft: R.S., C.R., H.X., R.R., C.A.H. and L.J.S.; Writing—Review and Editing: R.S., C.R., H.X., Y.H., E.Y.Y., L.H., O.S., Y.L., L.N., F.H., R.R., S.A.A., C.A.H., T.P., B.G. and L.J.S. All authors have read and agreed to the published version of the manuscript.

Funding

This research received no external funding.

Institutional Review Board Statement

Institutional Review Board approval was obtained (approval code EA4/089/17, approval date: 24 May 2017).

Informed Consent Statement

Informed consent was waived due to the retrospective study design.

Data Availability Statement

Additional data are available to readers upon reasonable request to the corresponding author.

Acknowledgments

Parts of this work were presented at the SIO Annual Meeting 2022, ECR Overture 2022, CIRSE 2022, and RSNA 2022, respectively. The authors would like to thank Bernd Hamm for his guidance and supervision in regards to the submitted work.

Conflicts of Interest

The authors do not declare any conflicts of interest. Outside the submitted work, L.J.S. received funding from the German Research Foundation (Deutsche Forschungsgemeinschaft, DFG): CRC 1340 “Matrix in vision”—Project-ID 372486779; research unit FOR5628 “Onco-MRE”. L.J.S. received research grants from the Berliner Krebsgesellschaft e.V., Charité 3R, and research grants and honoraria from Guerbet. F.H., C.A.H. and L.J.S. are fellows of the BIH (Junior Digital) Clinician Scientist Program funded by the Charité–Universitätsmedizin Berlin and the Berlin Institute of Health. Y.H. received stipends from the Chinese Scholar Council. E.Y.Y. received a stipend from the Fuldt Stiftung. T.P. receives funding from Berlin Institute of Health (Advanced Clinician Scientist Grant, Platform Grant), Ministry of Education and Research (BMBF, 01KX2021 (RACOON), 01KX2121 (XNUM 2.0′, RACOON), 68GX21001A, 01ZZ2315D), German Research Foundation (DFG, SFB 1340/2), European Union (H2020, CHAIMELEON: 952172, DIGITAL, EUCAIM: 101100633) and reports research agreements (no personal payments, outside of submitted work) with AGO, Aprea AB, ARCAGY-GINECO, Astellas Pharma Global Inc. (APGD), Astra Zeneca, Clovis Oncology, Inc., Holaira, Incyte Corporation, Karyopharm, Lion Biotechnologies, Inc., MedImmune, Merck Sharp & Dohme Corp, Millennium Pharmaceuticals, Inc., Morphotec Inc., NovoCure Ltd., PharmaMar S.A. and PharmaMar USA, Inc., Roche, Siemens Healthineers, and TESARO Inc., and fees for a book translation (Elsevier B.V.). B.G. receives payment for lectures from Parexel/Calyx, C. R. Bard/BD, Sirtex Medical, St. Jude Medical, Cook, AngioDynamics, Pharmcept, Guerbet, Ewimed, Boston Scientific, Terumo, Roche,Merck, 3M, Beacon Bioscience/ICON, Ipsen, Bayer, Pfizer, Eisai, MSD, Inari, and Siemens/Varian.

Abbreviations

The following abbreviations are used in this manuscript:
ALBI scoreAlbumin–bilirubin score
iBTInterstitial (high-dose-rate) brachytherapy
CTComputer tomography
EASLEuropean Association for the Study of the Liver
ESMOEuropean Society of Medical Oncology
HCCHepatocellular carcinoma
IDRIntrahepatic distant recurrence
IQRInterquartile range
MRIMagnetic resonance imaging
MTBMultidisciplinary Tumor Board
MWAMicrowave ablation
LI-RADSLiver Imaging and Reporting and Data System
LR-TRALIRADS Treatment Response Algorithm
LRTLocoregional therapy
LTPLocal tumor progression
OSOverall survival
PFSProgression-free survival
(m)RECIST(Modified) Response Evaluation Criteria in Solid Tumors
RFARadiofrequency ablation
SDStandard deviation
cTACEConventional transarterial chemoembolization
TTPTime to progression
WHOWorld Health Organization

References

  1. Bray, F.; Laversanne, M.; Sung, H.; Ferlay, J.; Siegel, R.L.; Soerjomataram, I.; Jemal, A. Global cancer statistics 2022: GLOBOCAN estimates of incidence and mortality worldwide for 36 cancers in 185 countries. CA Cancer J. Clin. 2024, 74, 229–263. [Google Scholar] [CrossRef] [PubMed]
  2. Reig, M.; Forner, A.; Rimola, J.; Ferrer-Fàbrega, J.; Burrel, M.; Garcia-Criado, Á.; Kelley, R.K.; Galle, P.R.; Mazzaferro, V.; Salem, R.; et al. BCLC strategy for prognosis prediction and treatment recommendation: The 2022 update. J. Hepatol. 2022, 76, 681–693. [Google Scholar] [CrossRef] [PubMed]
  3. Galle, P.R.; Forner, A.; Llovet, J.M.; Mazzaferro, V.; Piscaglia, F.; Raoul, J.L.; Vilgrain, V. EASL Clinical Practice Guidelines: Management of hepatocellular carcinoma. J. Hepatol. 2018, 69, 182–236. [Google Scholar] [CrossRef] [PubMed]
  4. Schnapauff, D.; Tegel, B.R.; Powerski, M.J.; Colletini, F.; Hamm, B.; Gebauer, B. Interstitial Brachytherapy in Combination with Previous Transarterial Embolization in Patients with Unresectable Hepatocellular Carcinoma. Anticancer. Res. 2019, 39, 1329–1336. [Google Scholar] [CrossRef]
  5. Vogel, A.; Cervantes, A.; Chau, I.; Daniele, B.; Llovet, J.M.; Meyer, T.; Nault, J.-C.; Neumann, U.; Ricke, J.; Sangro, B.; et al. Hepatocellular carcinoma: ESMO Clinical Practice Guidelines for diagnosis, treatment and follow-up. Ann. Oncol. 2018, 29 (Suppl. S4), iv238–iv255. [Google Scholar] [CrossRef]
  6. Collettini, F.; Schnapauff, D.; Poellinger, A.; Denecke, T.; Schott, E.; Berg, T.; Wust, P.; Hamm, B.; Gebauer, B. Hepatocellular carcinoma: Computed-tomography-guided high-dose-rate brachytherapy (CT-HDRBT) ablation of large (5–7 cm) and very large (>7 cm) tumours. Eur. Radiol. 2012, 22, 1101–1109. [Google Scholar] [CrossRef]
  7. Makary, M.S.; Ramsell, S.; Miller, E.; Beal, E.W.; Dowell, J.D. Hepatocellular carcinoma locoregional therapies: Outcomes and future horizons. World J. Gastroenterol. 2021, 27, 7462–7479. [Google Scholar] [CrossRef]
  8. Yaghmai, V.; Besa, C.; Kim, E.; Gatlin, J.L.; Siddiqui, N.A.; Taouli, B. Imaging assessment of hepatocellular carcinoma response to locoregional and systemic therapy. AJR Am. J. Roentgenol. 2013, 201, 80–96. [Google Scholar] [CrossRef]
  9. Chaudhry, M.; McGinty, K.A.; Mervak, B.; Lerebours, R.; Li, C.; Shropshire, E.; Ronald, J.; Commander, L.; Hertel, J.; Luo, S.; et al. The LI-RADS Version 2018 MRI Treatment Response Algorithm: Evaluation of Ablated Hepatocellular Carcinoma. Radiology 2020, 294, 320–326. [Google Scholar] [CrossRef]
  10. Harmath, C.; Fung, A.; Aslam, A.; Kamath, A.; Lall, C.; Surabhi, V.; Borhani, A.A.; Mendiratta-Lala, M.; Do, R. LI-RADS radiation-based treatment response algorithm for HCC: What to know and how to use it. Abdom. Radiol. 2024. [Google Scholar] [CrossRef]
  11. Wang, D.; Zhang, Y.; Lyu, R.; Jia, K.; Xu, P.-J. LI-RADS version 2018 treatment response algorithm on extracellular contrast-enhanced MRI in patients treated with transarterial chemoembolization for hepatocellular carcinoma: Diagnostic performance and the added value of ancillary features. Abdom. Radiol. 2024, 49, 3045–3055. [Google Scholar] [CrossRef] [PubMed]
  12. Kielar, A.; Fowler, K.J.; Lewis, S.; Yaghmai, V.; Miller, F.H.; Yarmohammadi, H.; Kim, C.; Chernyak, V.; Yokoo, T.; Meyer, J.; et al. Locoregional therapies for hepatocellular carcinoma and the new LI-RADS treatment response algorithm. Abdom. Radiol. 2018, 43, 218–230. [Google Scholar] [CrossRef] [PubMed]
  13. Xu, H.; Schmidt, R.; Hamm, C.A.; Schobert, I.T.; He, Y.; Böning, G.; Jonczyk, M.; Hamm, B.; Gebauer, B.; Savic, L.J. Comparison of intrahepatic progression patterns of hepatocellular carcinoma and colorectal liver metastases following CT-guided high dose-rate brachytherapy. Ther. Adv. Med. Oncol. 2021, 13, 17588359211042304. [Google Scholar] [CrossRef] [PubMed]
  14. Ricke, J.; Wust, P.; Stohlmann, A.; Beck, A.; Cho, C.H.; Pech, M.; Felix, R. CT-guided interstitial brachytherapy of liver malignancies alone or in combination with thermal ablation: Phase I–II results of a novel technique. Int. J. Radiat. Oncol. Biol. Phys. 2004, 58, 1496–1505. [Google Scholar] [CrossRef]
  15. Mohnike, K.; Wieners, G.; Schwartz, F.; Seidensticker, M.; Pech, M.; Ruehl, R.; Ricke, J. Computed tomography-guided high-dose-rate brachytherapy in hepatocellular carcinoma: Safety, efficacy, and effect on survival. Int. J. Radiat. Oncol. Biol. Phys. 2010, 78, 172–179. [Google Scholar] [CrossRef]
  16. Bretschneider, T.; Ricke, J.; Gebauer, B.; Streitparth, F. Image-guided high-dose-rate brachytherapy of malignancies in various inner organs—Technique, indications, and perspectives. J. Contemp. Brachyther. 2016, 8, 251–261. [Google Scholar] [CrossRef]
  17. Savic, L.J.; Chen, E.; Nezami, N.; Murali, N.; Hamm, C.A.; Wang, C.; Lin, M.; Schlachter, T.; Hong, K.; Georgiades, C.; et al. Conventional vs. Drug-Eluting Beads Transarterial Chemoembolization for Unresectable Hepatocellular Carcinoma-A Propensity Score Weighted Comparison of Efficacy and Safety. Cancers 2022, 14, 5847. [Google Scholar] [CrossRef]
  18. Lencioni, R.; Petruzzi, P.; Crocetti, L. Chemoembolization of hepatocellular carcinoma. Semin. Intervent Radiol. 2013, 30, 3–11. [Google Scholar] [CrossRef]
  19. Puijk, R.S.; Ahmed, M.; Adam, A.; Arai, Y.; Arellano, R.; de Baère, T.; Bale, R.; Bellera, C.; Binkert, C.A.; Brace, C.L.; et al. Consensus Guidelines for the Definition of Time-to-Event End Points in Image-guided Tumor Ablation: Results of the SIO and DATECAN Initiative. Radiology 2021, 301, 533–540. [Google Scholar] [CrossRef]
  20. Tirkes, T.; Hollar, M.A.; Tann, M.; Kohli, M.D.; Akisik, F.; Sandrasegaran, K. Response criteria in oncologic imaging: Review of traditional and new criteria. Radiographics 2013, 33, 1323–1341. [Google Scholar] [CrossRef]
  21. Eisenhauer, E.A.; Therasse, P.; Bogaerts, J.; Schwartz, L.H.; Sargent, D.; Ford, R.; Dancey, J.; Arbuck, S.; Gwyther, S.; Mooney, M.; et al. New response evaluation criteria in solid tumours: Revised RECIST guideline (version 1.1). Eur. J. Cancer 2009, 45, 228–247. [Google Scholar] [CrossRef] [PubMed]
  22. Lencioni, R.; Llovet, J.M. Modified RECIST (mRECIST) assessment for hepatocellular carcinoma. Semin. Liver Dis. 2010, 30, 52–60. [Google Scholar] [CrossRef] [PubMed]
  23. Bruix, J.; Sherman, M.; Llovet, J.M.; Beaugrand, M.; Lencioni, R.; Burroughs, A.K.; Christensen, E.; Pagliaro, L.; Colombo, M.; Rodés, J. Clinical management of hepatocellular carcinoma. Conclusions of the Barcelona-2000 EASL conference. European Association for the Study of the Liver. J. Hepatol. 2001, 35, 421–430. [Google Scholar] [CrossRef]
  24. Zhao, Y.; Duran, R.; Bai, W.; Sahu, S.; Wang, W.; Kabus, S.; Lin, M.; Han, G.; Geschwind, J.-F. Which Criteria Applied in Multi-Phasic CT Can Predict Early Tumor Response in Patients with Hepatocellular Carcinoma Treated Using Conventional TACE: RECIST, mRECIST, EASL or qEASL? Cardiovasc. Intervent Radiol. 2018, 41, 433–442. [Google Scholar] [CrossRef] [PubMed]
  25. Llovet, J.M.; Lencioni, R. mRECIST for HCC: Performance and novel refinements. J. Hepatol. 2020, 72, 288–306. [Google Scholar] [CrossRef]
  26. Lin, M.; Pellerin, O.; Bhagat, N.; Rao, P.P.; Loffroy, R.; Ardon, R.; Mory, B.; Reyes, D.K.; Geschwind, J.-F. Quantitative and volumetric European Association for the Study of the Liver and Response Evaluation Criteria in Solid Tumors measurements: Feasibility of a semiautomated software method to assess tumor response after transcatheter arterial chemoembolization. J. Vasc. Interv. Radiol. 2012, 23, 1629–1637. [Google Scholar]
  27. Shropshire, E.L.; Chaudhry, M.; Miller, C.M.; Allen, B.C.; Bozdogan, E.; Cardona, D.M.; King, L.Y.; Janas, G.L.; Do, R.K.; Kim, C.Y.; et al. LI-RADS Treatment Response Algorithm: Performance and Diagnostic Accuracy. Radiology 2019, 292, 226–234. [Google Scholar] [CrossRef]
  28. Moussa, A.M.; Ziv, E. Radiogenomics in Interventional Oncology. Curr. Oncol. Rep. 2021, 23, 9. [Google Scholar] [CrossRef]
  29. Wehrle, C.J.; Hong, H.; Kamath, S.; Schlegel, A.; Fujiki, M.; Hashimoto, K.; Aucejo, F. Tumor Mutational Burden from Circulating Tumor DNA Predicts Recurrence of Hepatocellular Carcinoma After Resection: An Emerging Biomarker for Surveillance. Ann. Surg. 2024, 280, 504–513. [Google Scholar] [CrossRef]
Figure 1. Waterfall plots illustrating the relative tumoral change within completed treatment cycles according to the respective response criteria of RECIST, WHO, mRECIST, and EASL at two and five months of follow-up for (A) patients following interstitial brachytherapy (iBT) and (B) following conventional transarterial chemoembolization (cTACE)/iBT. Response categories include complete response (CR), partial response (PR), stable disease (SD), and progressive disease (PD).
Cancers 17 01275 g001
Figure 2. Donut plots illustrate the distribution of tumor response according to the response categories of LIRADS Treatment Response Algorithm (LR-TRA) v2018 and v2024 radiation core at two and five months of follow-up for (A) patients following interstitial brachytherapy (iBT) and (B) following conventional transarterial chemoembolization (cTACE)/iBT.
Cancers 17 01275 g002
Figure 3. Survival measures in patients following interstitial brachytherapy (iBT) alone. Green lines indicate responders vs. non-responders (red lines) according to the respective response criteria at five months of follow-up. Significant results were found for RECIST, mRECIST, and EASL and are highlighted next to grayed-out boxes. Survival times are reported in Supplementary Table S1.
Cancers 17 01275 g003
Figure 4. Survival measures in patients following conventional transarterial chemoembolization (cTACE) prior to interstitial brachytherapy (iBT). Green lines indicate responders vs. non-responders (red lines) according to the respective response criteria at five months of follow-up. Significant results were found for mRECIST, EASL, and both LI-TRA criteria and are highlighted next to grayed-out boxes. Survival times are reported in Supplementary Table S2.
Cancers 17 01275 g004
Table 1. Baseline patient, tumor, and disease characteristics.
DemographicsiBT PatientscTACE/iBT Patientsp-Value
Patient characteristics
 Number of patients4847-
 Age, mean ± SD70.6 ± 9.3 years70.3 ± 9.5 years0.84
 Male:Female, n38:1036:110.81
Tumor characteristics
 Lesions, n8970-
 Sum of lesion diameter, mean ± SD26.5 ± 10.6 mm44.3 ± 20.4 mm<0.01
 Unifocal:Multifocal, n41:1938:130.53
 Completed treatment cycles, n6051-
 HCC diagnosis, n (biopsy vs. imaging)43:1724:27-
 HCC grading, n (%)
  GX28 (65.1%)6 (25.0%)-
  G11 (2.3%)2 (8.3%)-
  G27 (16.3%)13 (54.2%)-
  G37 (16.3%)3 (12.5%)-
Disease characteristics
 Cirrhosis, n (%)41 (85.4%)43 (91.5%)0.52
 Etiology of cirrhosis, n (%)
  Viral hepatitis (Hepatitis B/C)12 (29.3%)11 (23.2%)0.98
  Alcoholic steatohepatitis11 (26.8%)18 (41.9%)0.17
  Metabolic-dysfunction associated steatohepatitis13 (31.7%)14 (32.6%)0.99
 Others *5 (12.2%)0 (0.0%)0.02
 Child Pugh class, n (%)
  A34 (82.9%)41 (97.7%)0.09
  B7 (17.1%)2 (2.3%)0.09
 Barcelona Clinic Liver Cancer stage, n (%)
  A41 (85.4%)22 (46.8%)<0.01
  B6 (12.5%)17 (36.2%)0.01
  C1 (2.1%)8 (17.0%)0.02
Laboratory values of liver function, mean ± SD or median [IQR]
 Alpha-fetoprotein (AFP) (U/mL)8.0 [5.4, 46.2]13.1 [5.2, 69.8]0.46
 Albumine (g/L)39.7 [35.3, 42.9]39.0 [37.3, 40.5]0.96
 Bilirubin (mg/dL)0.6 [0.4, 1.1]0.7 [0.5, 1.1]0.23
 ALBI dcore−2.56 ± 0.37−2.56 ± 0.600.96
 AST/ALT tatio1.3 [1.0, 1.5]1.2 [1.1, 1.5]0.67
 γ-GT (U/L)119 [56, 218]152 [105, 240]0.24
 AP (U/L)3.4 [0.9, 5.6]4.4 [2.4, 6.7]0.73
iBT interstitial high-dose-rate brachytherapy, cTACE conventional transarterial chemoembolization, ALT alanine aminotransferase, AST aspartate aminotransferase, γ-GT gamma-glutamyl transferase. Bold p-values indicate statistical significance (Fisher’s exact test, unpaired t-test, and Mann–Whitney U test, respectively). * Other etiologies of cirrhosis comprise hereditary diseases like PSC or hemochromatosis and medication- or toxin-related causes.
Table 2. Log-rank test’s p-values for OS, PFS, TTP, and PFS/TTP subtypes according to response assessment criteria for patients at two and five months following iBT and iBT/cTACE.
iBTcTACE/iBT
CriterionOSPFSPFSPFSTTPTTPTTPOSPFSPFSPFSTTPTTPTTP
LTPIDRLTPIDR LTPIDR LTPIDR
2 MonthsRECIST0.520.960.800.790.830.780.770.830.860.720.640.560.530.54
WHO0.240.180.260.080.630.610.280.210.130.310.090.930.990.67
mRECIST0.520.150.330.980.650.200.320.99<0.010.9<0.01<0.010.77<0.01
EASL0.910.800.820.590.190.240.080.81<0.010.86<0.01<0.010.72<0.01
LI-TRA v20180.870.670.480.500.930.340.080.130.420.240.880.600.310.95
LI-TRA v20240.610.980.320.730.980.220.930.060.810.010.290.270.210.18
5 MonthsRECIST0.120.110.040.130.170.260.330.170.830.650.910.800.440.62
WHO0.860.430.140.910.750.170.720.550.870.750.710.610.640.92
mRECIST0.900.430.910.500.060.610.040.060.070.070.110.010.620.02
EASL0.820.040.500.08<0.010.62<0.010.070.030.18<0.010.010.93<0.01
LI-TRA v20180.400.720.920.680.570.260.570.010.310.020.140.30.180.13
LI-TRA v20240.650.910.980.760.770.310.910.050.650.070.980.670.640.97
Legend: iBT interstitial high-dose-rate brachytherapy, cTACE conventional transarterial chemoembolization, OS overall survival, PFS progression-free survival, TTP time to progression, LTP local tumor progression, IDR intrahepatic distant recurrence. p-values indicate differences in the log-rank test between responders and non-responders according to the respective response criteria. The red-green color gradient indicates the strength of the p-value. Significant p-values are bold printed. Survival times are reported in Supplementary Tables S1 and S2.
Disclaimer/Publisher’s Note: The statements, opinions and data contained in all publications are solely those of the individual author(s) and contributor(s) and not of MDPI and/or the editor(s). MDPI and/or the editor(s) disclaim responsibility for any injury to people or property resulting from any ideas, methods, instructions or products referred to in the content.

