Lymphovascular Invasion (LVI) Correlates with Systemic Immune-Inflammation Index (SII) in Adenocarcinoma of the Gastroesophageal Junction (AEG): Implications for Prognostic Stratification
Simple Summary
Abstract
1. Introduction
2. Materials and Methods
2.1. Immunohistochemistry
2.2. Statistical Analysis
3. Results
3.1. Descriptive Statistics
3.2. Association Between SII and LVI
3.3. Cox Regression Models
3.3.1. Models with SII and LVI
3.3.2. Other Univariate Models
3.3.3. Model Selection with Additional Variables
3.4. Survival Analysis
4. Discussion
5. Limitations
6. Conclusions
Author Contributions
Funding
Institutional Review Board Statement
Informed Consent Statement
Data Availability Statement
Conflicts of Interest
Abbreviations
| AEG | Adenocarcinoma of the Gastroesophageal Junction |
| AIC | Akaike Information Criterion |
| ASA | American Society of Anesthesiologists |
| CT | Computed Tomography |
| ECOG | Eastern Cooperative Oncology Group |
| GPS | Glasgow Prognostic Score |
| HR | Hazard Ratio |
| IBS | Integrated Brier Score |
| LVI | Lymphovascular Invasion |
| NLR | Neutrophil-to-Lymphocyte Ratio |
| NT | Neoadjuvant Therapy |
| PLR | Platelet-to-Lymphocyte Ratio |
| R2 | Pseudo-R-squared (Cox & Snell) |
| SE | Standard error |
| SII | Systemic Immune-Inflammation Index |
| SII_pre_NT | Pre-treatment Systemic Immune-Inflammation Index |
| TRG | Tumor Regression Grade |
| UICC | Union for International Cancer Control |
Appendix A
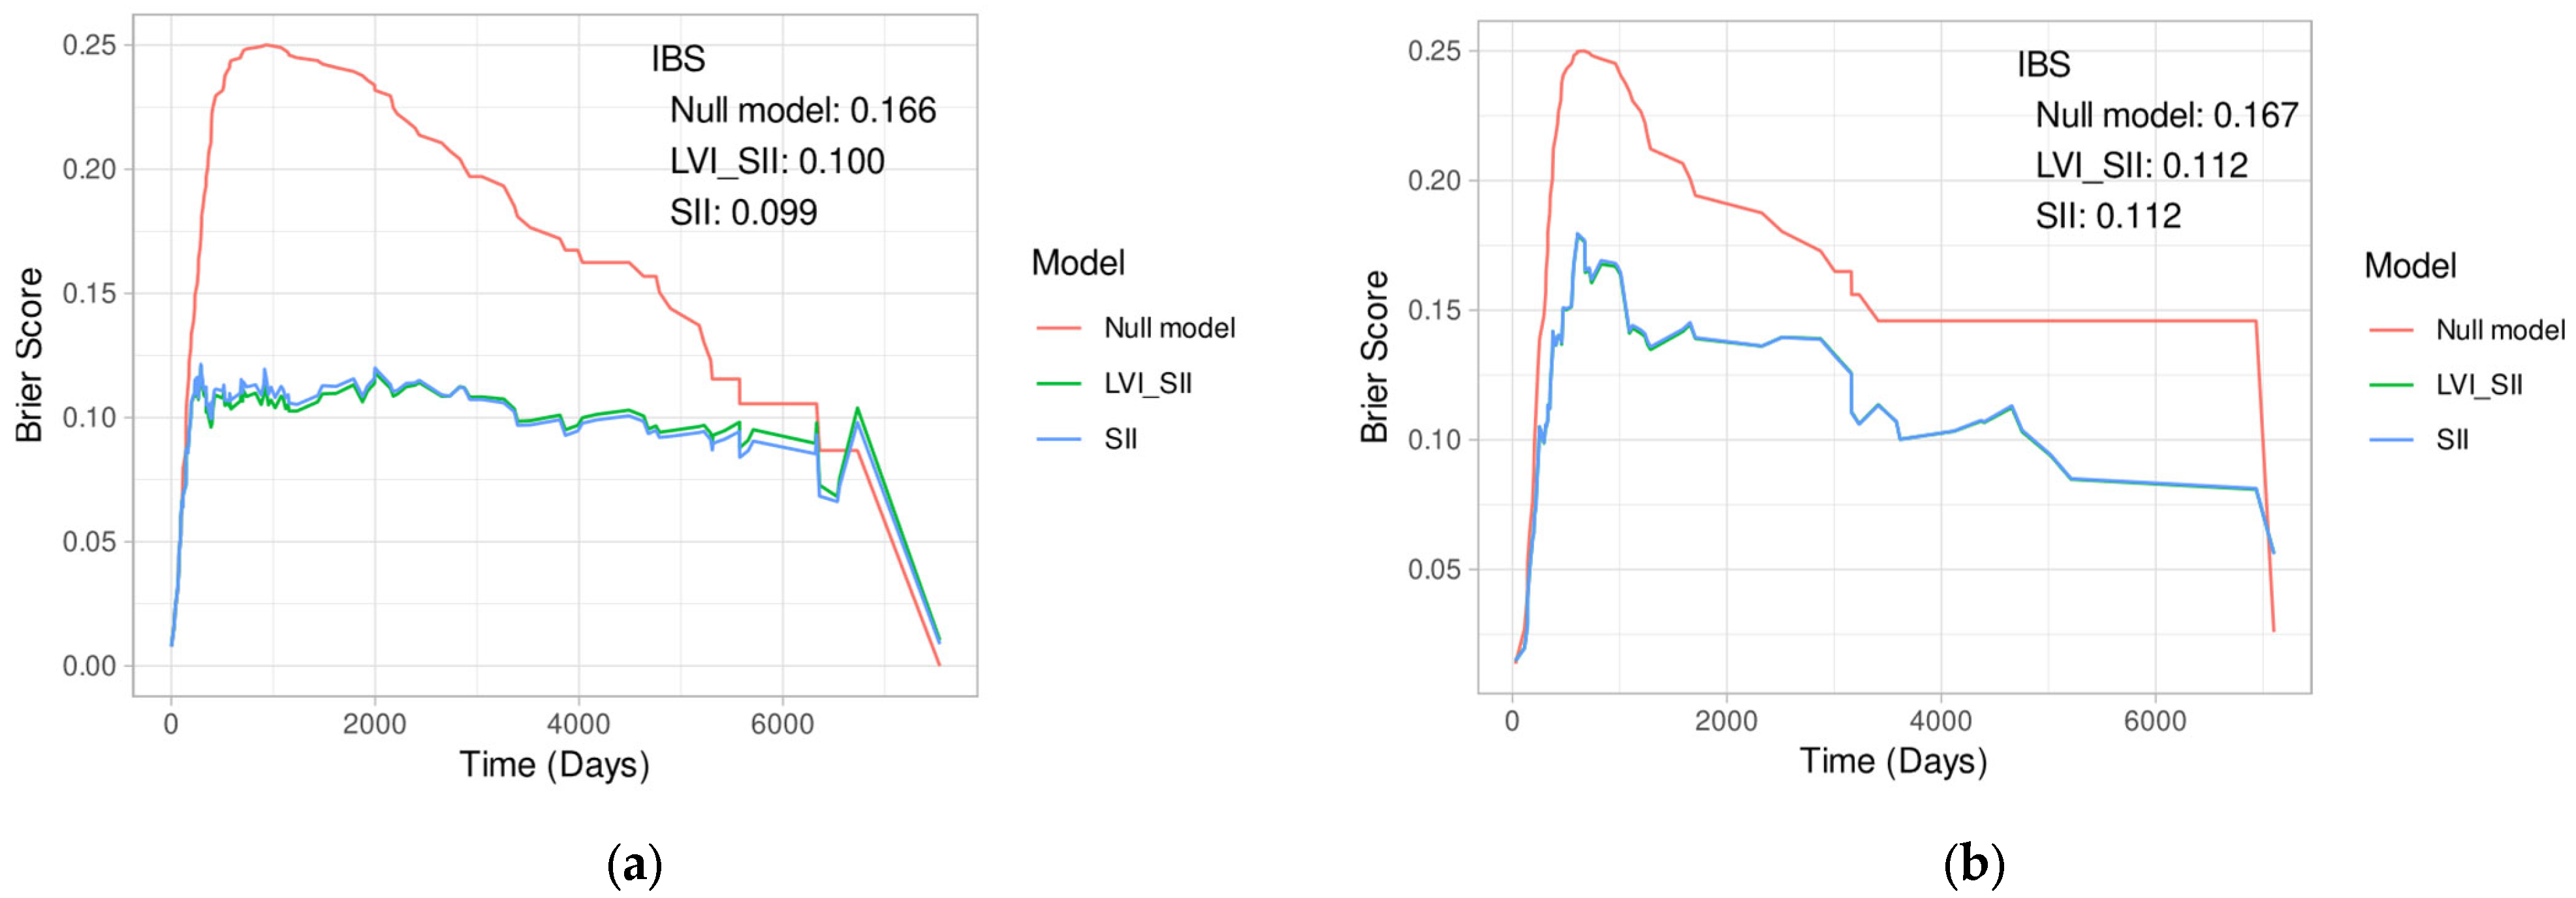
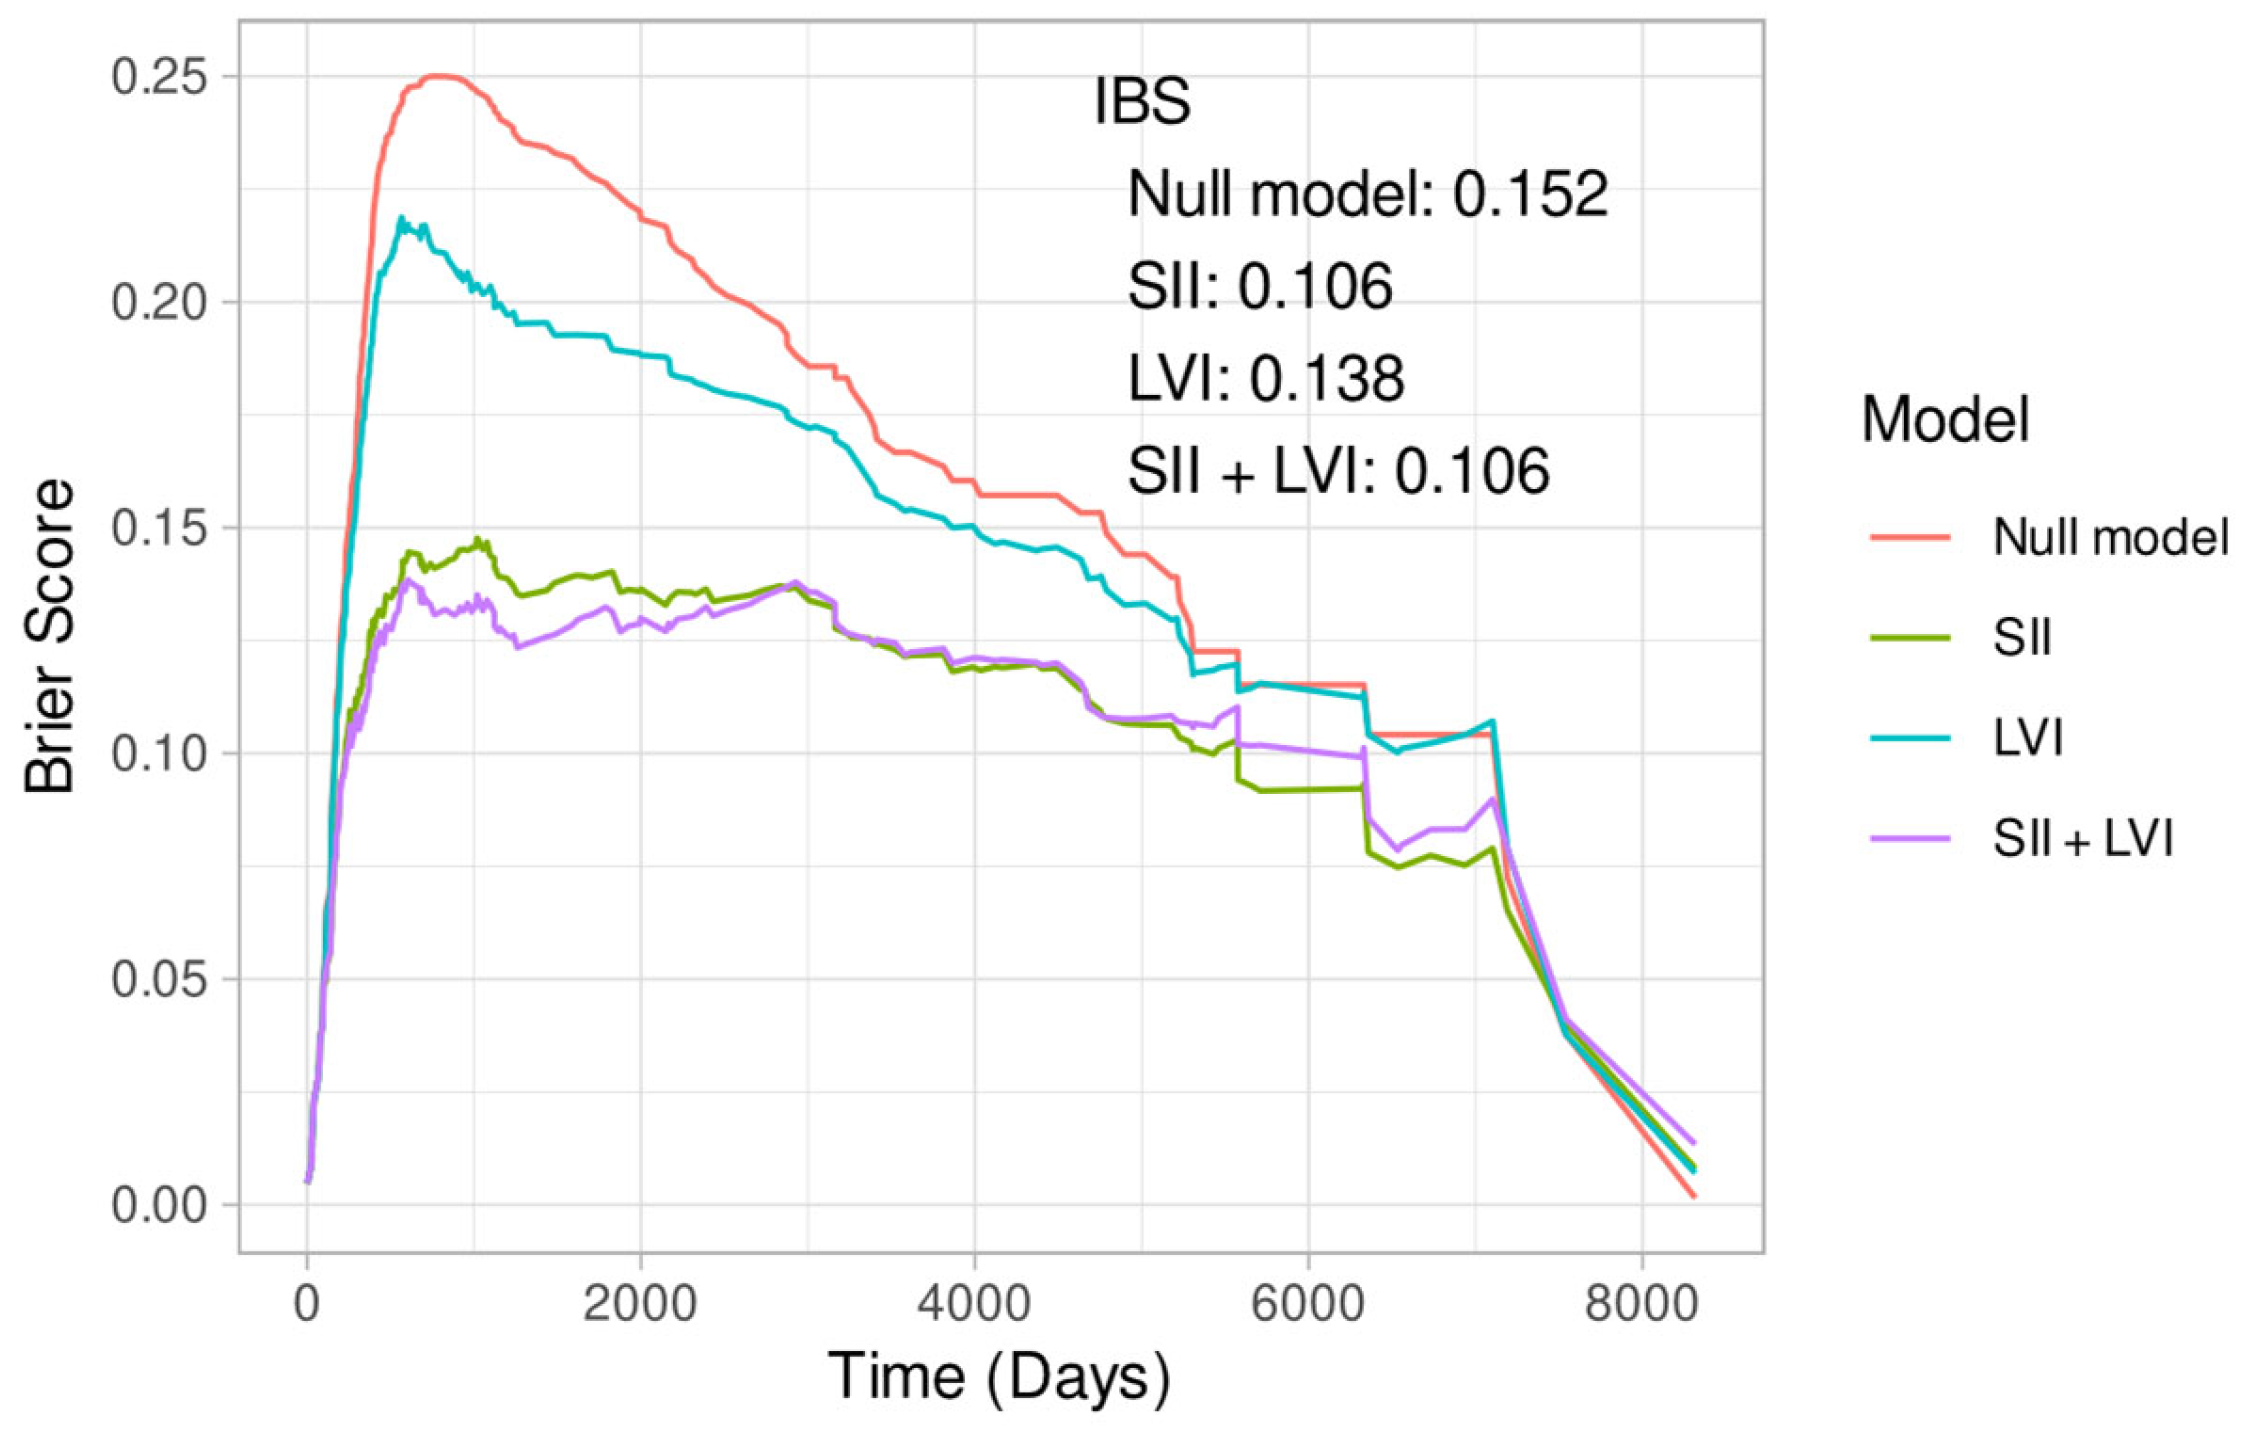

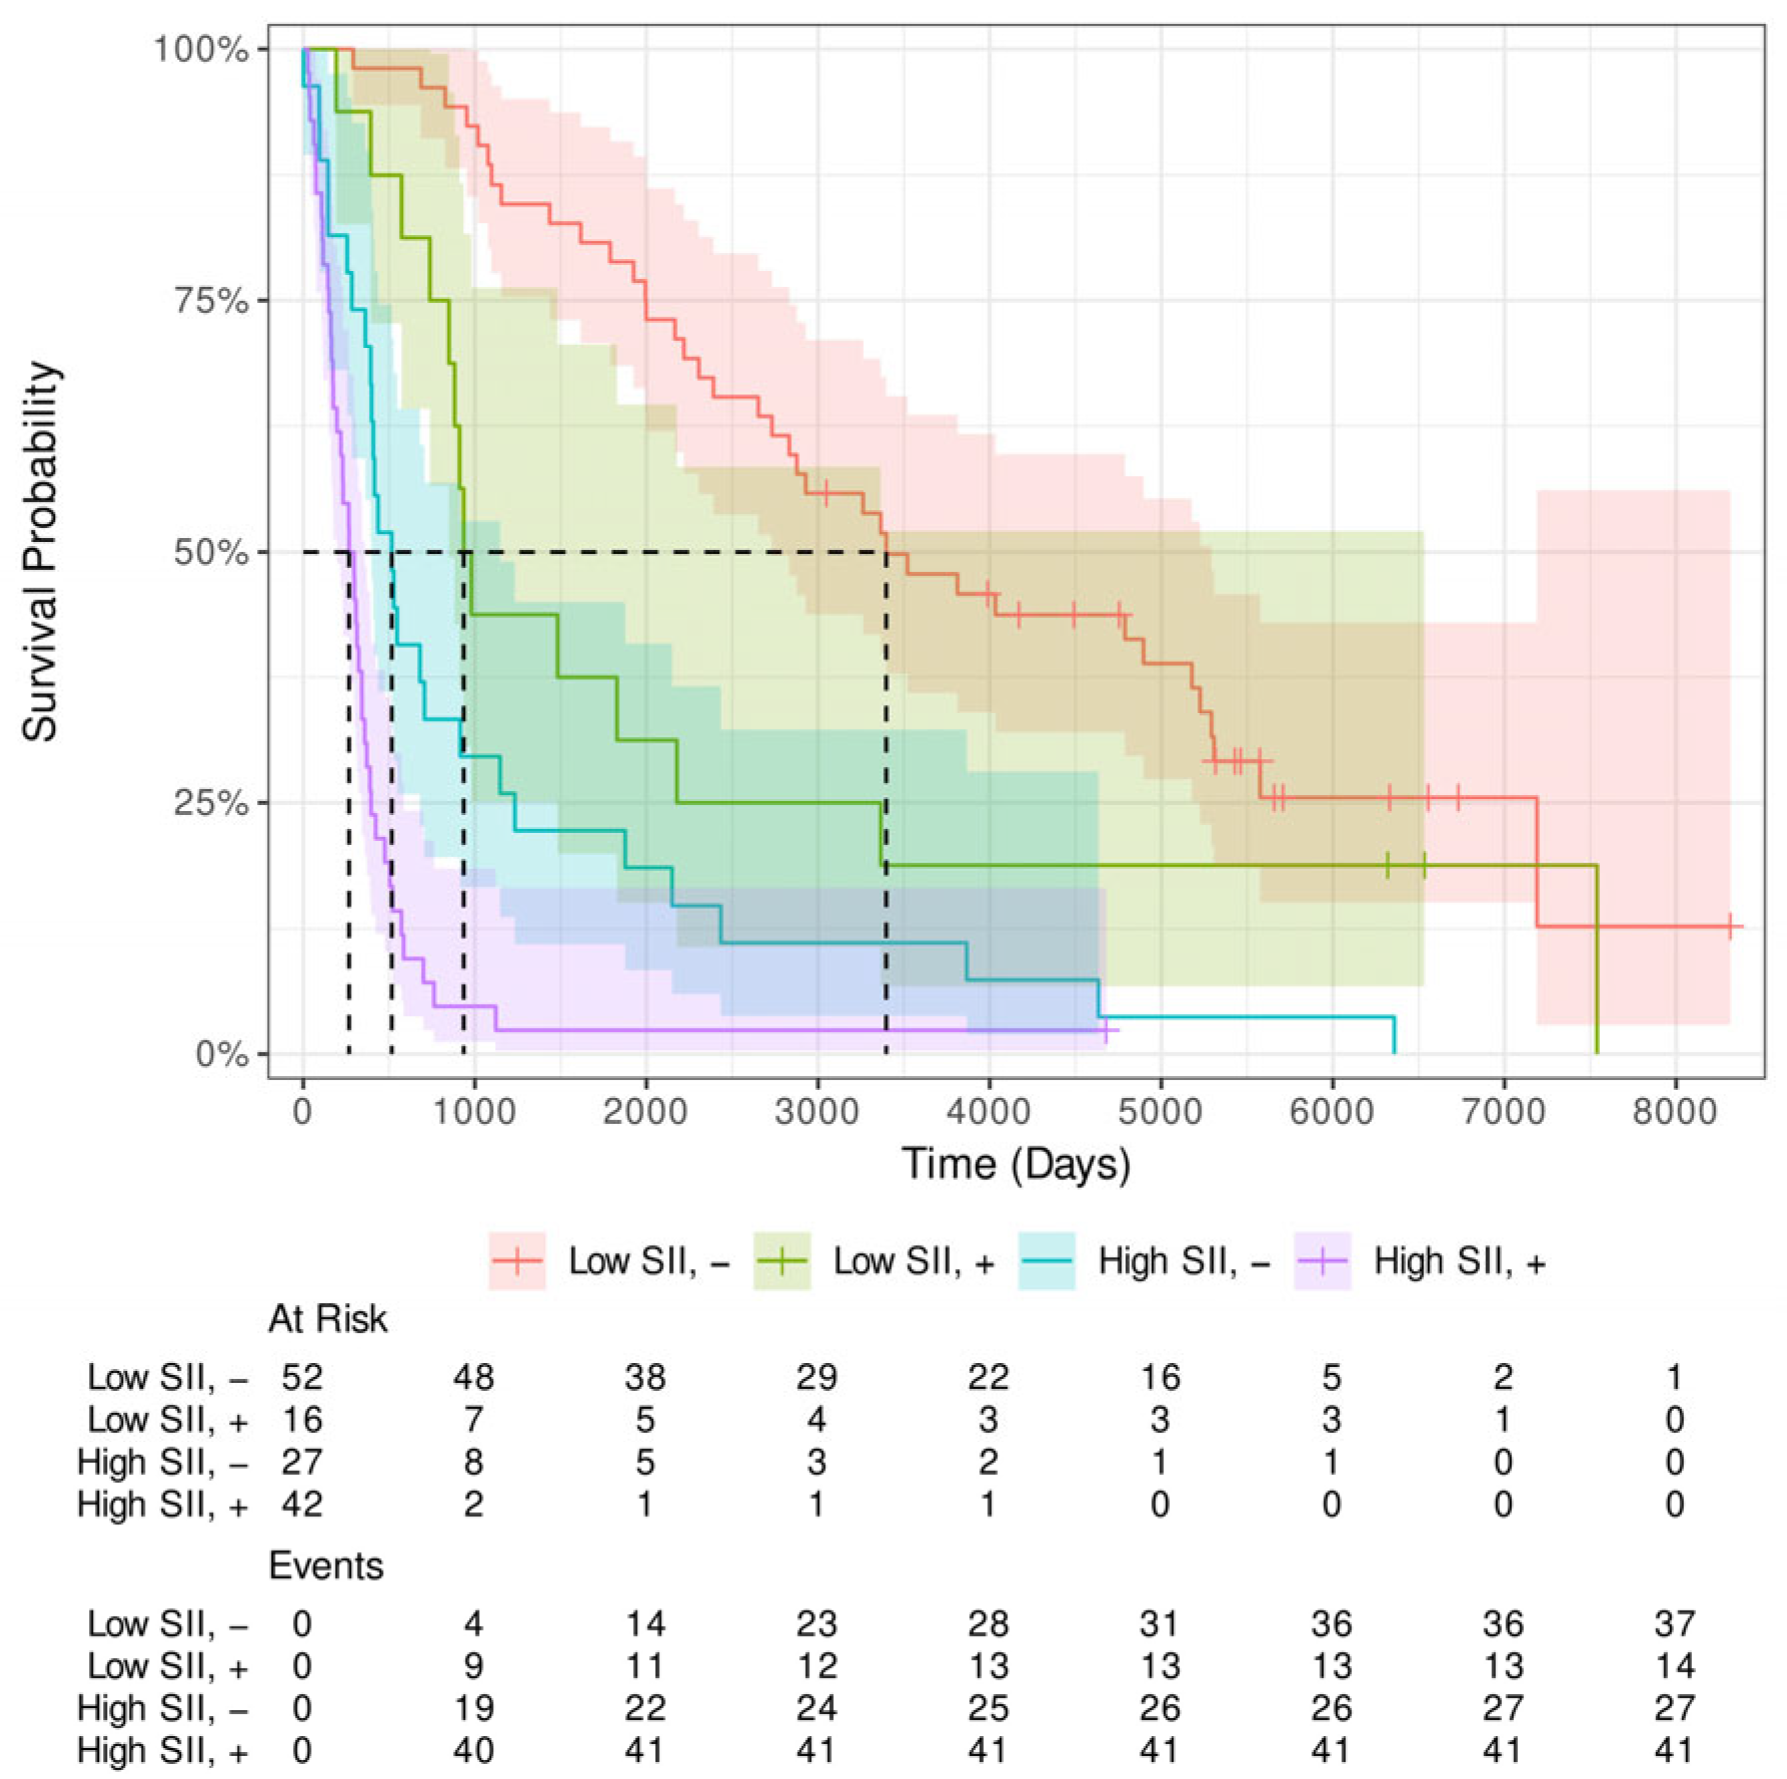

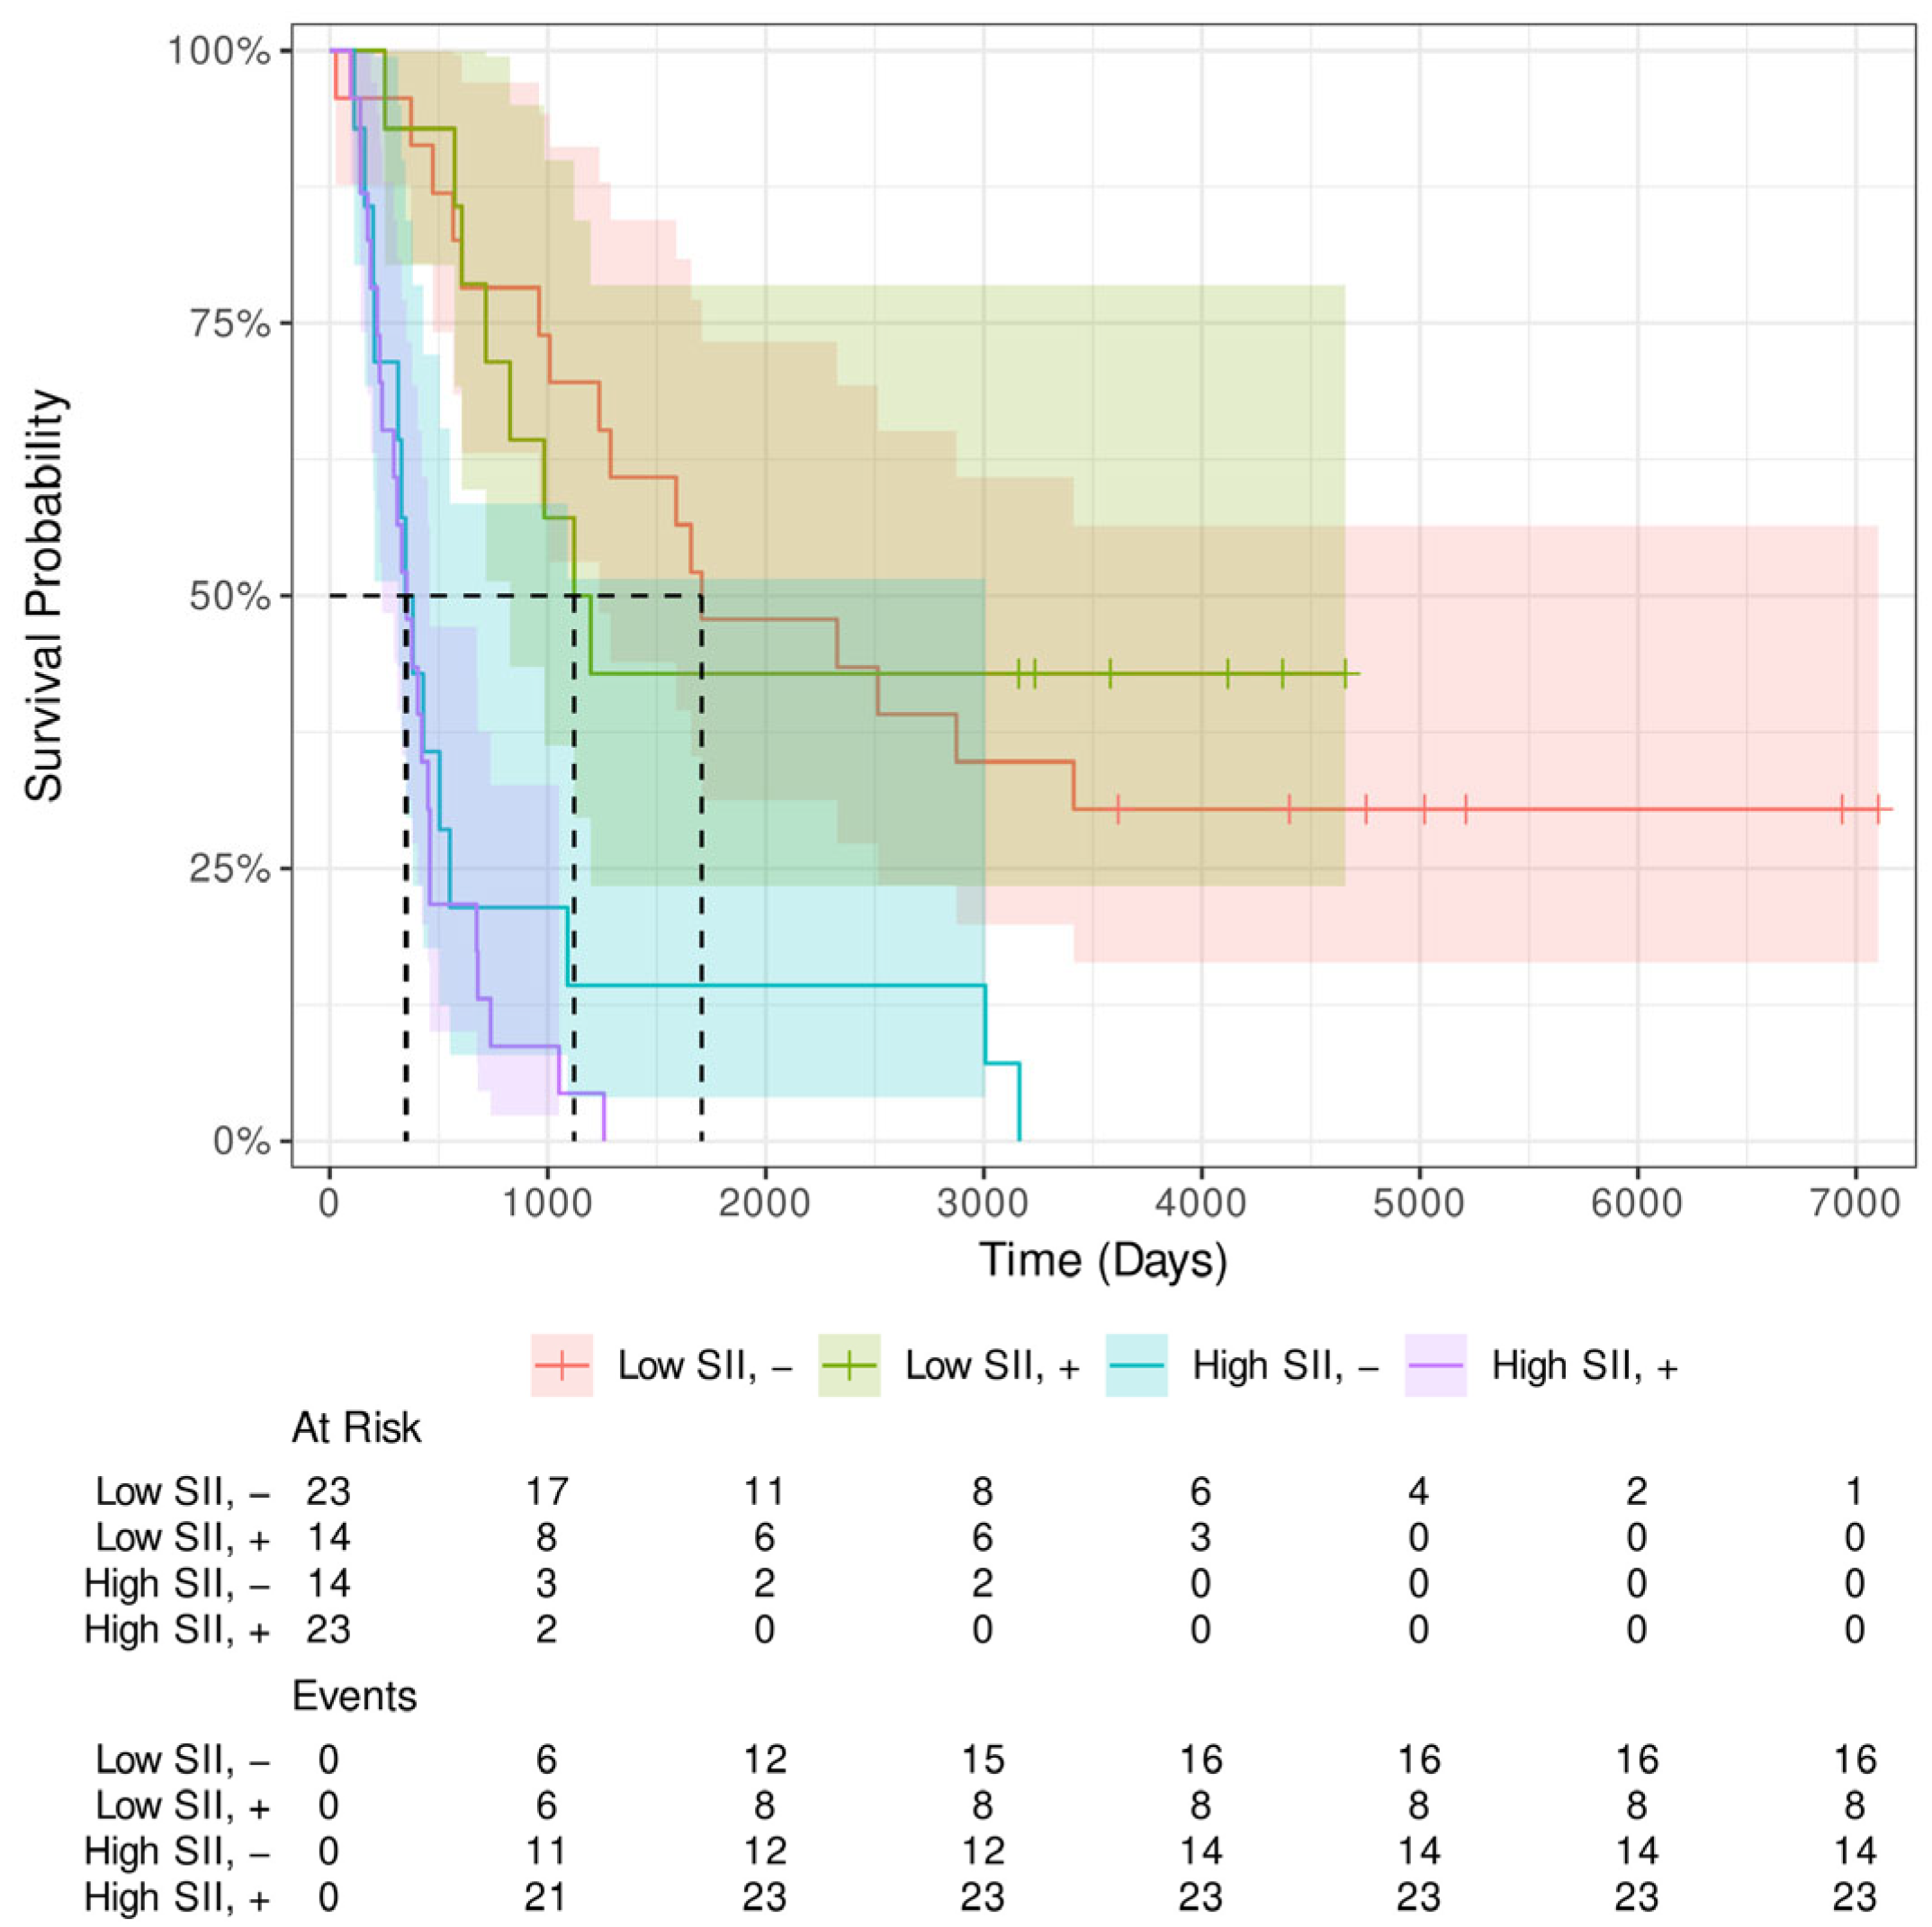
Appendix B
| Neoadjuvant Therapy | |||||
|---|---|---|---|---|---|
| No | Yes | ||||
| Variables | LVI− | LVI+ | LVI− | LVI+ | |
| SII | Mean | 624 | 1001 | 712 | 851 |
| SD | 343 | 420 | 368 | 256 | |
| mean Age * (SD) | 65 | 67 | 64 | 60 | |
| Sex, n (%) | |||||
| Male | 65 (82%) | 46 (79%) | 31 (84%) | 30 (81%) | |
| Female | 14 (18%) | 12 (21%) | 6 (16%) | 7 (19%) | |
| (y)pT | |||||
| 0 | 1 (2.7%) | ||||
| 1 | 29 (37%) | 3 (5.2%) | 5 (14%) | 1 (2.7%) | |
| 2 | 33 (42%) | 16 (28%) | 14 (38%) | 6 (16%) | |
| 3 | 15 (19%) | 35 (60%) | 16 (43%) | 27 (73%) | |
| 4 | 2 (2.5%) | 4 (6.9%) | 2 (5.4%) | 2 (5.4%) | |
| (y)pN | |||||
| 0 | 46 (58%) | 10 (17%) | 16 (43%) | 10 (27%) | |
| 1 | 27 (34%) | 26 (45%) | 17 (46%) | 20 (54%) | |
| 2 | 2 (2.5%) | 16 (28%) | 4 (11%) | 3 (8.1%) | |
| 3 | 4 (5.1%) | 6 (10%) | 0 (0%) | 4 (11%) | |
| 4 | - | - | - | - | |
| UICC postOP | |||||
| I | 41 (52%) | 2 (3.4%) | 10 (27%) | 3 (8.1%) | |
| II | 19 (24%) | 18 (31%) | 12 (32%) | 11 (30%) | |
| III | 16 (20%) | 34 (59%) | 15 (41%) | 23 (62%) | |
| IV | 3 (3.8%) | 4 (6.9%) | |||
| G, n (%) | |||||
| 1 | 4 (5.1%) | 1 (1.7%) | 1 (2.7%) | 0 (0%) | |
| 2 | 44 (56%) | 15 (26%) | 17 (46%) | 13 (35%) | |
| 3 | 31 (39%) | 42 (72%) | 19 (51%) | 24 (65%) | |
| Lymphnode ratio | |||||
| Mean | 0.11 | 0.35 | 0.13 | 0.28 | |
| SD | 0.17 | 0.29 | 0.22 | 0.26 | |
| unknown | 1 | 2 | |||
| Tumor type, n (%) | |||||
| AEG I | 40 (51%) | 20 (34%) | 27 (73%) | 28 (76%) | |
| AEG II | 34 (43%) | 37 (64%) | 6 (16%) | 6 (16%) | |
| AEG III | 5 (6.3%) | 1 (1.7%) | 4 (11%) | 3 (8.1%) | |
| Surgery technique | |||||
| One-cavity | 35 (44%) | 35 (60%) | 5 (14%) | 10 (27%) | |
| Two-cavity | 44 (56%) | 23 (40%) | 32 (86%) | 27 (73%) | |
| ASA | |||||
| 1 | 9 (11%) | 9 (16%) | 13 (35%) | 14 (38%) | |
| 2 | 63 (80%) | 39 (67%) | 16 (43%) | 21 (57%) | |
| 3 | 6 (7.6%) | 9 (16%) | 7 (19%) | 2 (5.4%) | |
| 4 | 1 (1.3%) | 1 (1.7%) | 1 (2.7%) | 0 (0%) | |
| ECOG | |||||
| 0 | 33 (43%) | 22 (42%) | 15 (41%) | 16 (46%) | |
| 1 | 37 (49%) | 20 (38%) | 16 (43%) | 17 (49%) | |
| 2 | 6 (7.9%) | 9 (17%) | 4 (11%) | 2 (5.7%) | |
| 3 | 0 (0%) | 2 (3.8%) | 2 (5.4%) | 0 (0%) | |
| Mandard response | |||||
| 2 | - | - | 3 (8.1%) | 2 (5.4%) | |
| 3 | - | - | 12 (32%) | 4 (11%) | |
| 4 | - | - | 15 (41%) | 15 (41%) | |
| 5 | - | - | 7 (19%) | 16 (43%) | |
| Chemotherapy regimen | |||||
| A | - | - | 27 (73%) | 25 (68%) | |
| B | - | - | 9 (24%) | 9 (24%) | |
| C | - | - | 1 (2.7%) | 3 (8.1%) | |
| none | - | - | |||
| Variables | Primarily Resected | Neoadjuvant Therapy | |||||
|---|---|---|---|---|---|---|---|
| HR | 95% CI | p-Value | HR | 95% CI | p-Value | ||
| Age (years) | 1.01 | 0.99–1.03 | 0.302 | 1.00 | 0.98–1.02 | 0.998 | |
| SEX (ref. male) | 0.93 | 0.59–1.47 | 0.756 | 1.49 | 0.73–3.043 | 0.271 | |
| G (ref. G3) | - | - | - | - | - | - | |
| 2 | 1.17 | 0.42–3.24 | 0.769 | 0.20 | 0.03–1.56 | 0.125 | |
| 3 | 2.53 | 0.92–6.98 | 0.073 | 0.28 | 0.04–2.13 | 0.219 | |
| UICC_postOP | |||||||
| I | - | - | - | - | |||
| II | 3.10 | 1.86–5.16 | <0.001 | 1.19 | 0.56–2.56 | 0.649 | |
| III | 4.93 | 2.99–8.12 | <0.001 | 1.23 | 0.60–2.51 | 0.568 | |
| IV | 3.27 | 1.41–7.60 | 0.006 | - | - | - | |
| (y)pT | 1.90 | 1.53–2.37 | <0.001 | 1.35 | 0.94–1.95 | 0.107 | |
| (y)pN | 1.96 | 1.61–2.38 | <0.001 | 1.23 | 0.87–1.76 | 0.243 | |
| Mandard response | |||||||
| 2 | - | - | - | - | - | - | |
| 3 | - | - | 0.78 | 0.25–2.42 | 0.665 | ||
| 4 | 0.99 | 0.34–2.87 | 0.985 | ||||
| 5 | 1.43 | 0.49–4.20 | 0.516 | ||||
| Lymph node ratio | 22.4 | 10.2–48.9 | <0.001 | 3.71 | 1.52–9.10 | 0.004 | |
| Mandard response | - | - | - | 1.222 | 0.916–1.630 | 0.167 | |
| Tumor type | |||||||
| AEG I | - | ||||||
| AEG II | 1.27 | 0.87–3.25 | 0.769 | 0.20 | 0.03–1.56 | 0.125 | |
| AEG III | 2.53 | 0.92–6.98 | 0.073 | 0.28 | 0.04–2.13 | 0.219 | |
| ASA_preOP | 1.18 | 0.84–1.67 | 0.324 | 1.03 | 0.71–1.49 | 0.891 | |
| ECOG_preOP | 1.23 | 092–1.64 | 0.170 | 1.27 | 0.93–1.74 | 0.132 | |
References
- Smyth, E.C.; Nilsson, M.; Grabsch, H.I.; van Grieken, N.C.; Lordick, F. Gastric cancer. Lancet 2020, 396, 635–648. [Google Scholar] [CrossRef] [PubMed]
- Sung, H.; Ferlay, J.; Siegel, R.L.; Laversanne, M.; Soerjomataram, I.; Jemal, A.; Bray, F. Global Cancer Statistics 2020: GLOBOCAN Estimates of Incidence and Mortality Worldwide for 36 Cancers in 185 Countries. CA A Cancer J. Clin. 2021, 71, 209–249. [Google Scholar] [CrossRef] [PubMed]
- Arnold, M.; Soerjomataram, I.; Ferlay, J.; Forman, D. Global incidence of oesophageal cancer by histological subtype in 2012. Gut 2015, 64, 381–387. [Google Scholar] [CrossRef] [PubMed]
- Morgan, E.; Arnold, M.; Rutherford, M.J.; Bardot, A.; Ferlay, J.; Moller, H.; Bray, F.; Soerjomataram, I.; Allemani, C.; Johnson, C.J.; et al. International trends in oesophageal cancer survival by histological subtype between 1995 and 2014. Gut 2021, 70, 234–242. [Google Scholar] [CrossRef]
- Dhakras, P.; Uboha, N.; Horner, V.; Reinig, E.; Matkowskyj, K.A. Gastrointestinal cancers: Current biomarkers in esophageal and gastric adenocarcinoma. Transl. Gastroenterol. Hepatol. 2020, 5, 55. [Google Scholar] [CrossRef]
- Stotz, M.; Pichler, M.; Absenger, G.; Szkandera, J.; Arminger, F.; Schaberl-Moser, R.; Krenn-Pilko, S.; Gerger, A.; Kornprat, P.; Ressler, S.; et al. Increased neutrophil-lymphocyte ratio is a poor prognostic factor in patients with primary operable and inoperable pancreatic cancer. Br. J. Cancer 2013, 109, 416–421. [Google Scholar] [CrossRef]
- Szkandera, J.; Pichler, M.; Stotz, M.; Absenger, G.; Arminger, F.; Weissmueller, M.; Alidzanovic, L.; Kornprat, P.; Stojakovic, T.; Gerger, A.; et al. Elevated preoperative neutrophil/lymphocyte ratio is associated with poor prognosis in soft-tissue sarcoma patients. Br. J. Cancer 2013, 108, 1677–1683. [Google Scholar] [CrossRef]
- Jomrich, G.; Paireder, M.; Gleiss, A.; Kristo, I.; Harpain, L.; Schoppmann, S.F. Comparison of Inflammation-Based Prognostic Scores in a Cohort of Patients with Resectable Esophageal Cancer. Gastroenterol. Res. Pract. 2017, 2017, 1678584. [Google Scholar] [CrossRef]
- Jomrich, G.; Paireder, M.; Gleiss, A.; Kristo, I.; Harpain, L.; Schoppmann, S.F. The modified Glasgow prognostic score is an independent prognostic indicator in neoadjuvantly treated adenocarcinoma of the esophagogastric junction. Oncotarget 2018, 9, 6968–6976. [Google Scholar] [CrossRef]
- Jomrich, G.; Yan, W.; Kollmann, D.; Kristo, I.; Winkler, D.; Puhr, H.; Lhan-Mutlu, A.; Hollenstein, M.; Asari, R.; Schoppmann, S.F. Elevated fibrinogen-albumin ratio is an adverse prognostic factor for patients with primarily resected gastroesophageal adenocarcinoma. J. Cancer Res. Clin. Oncol. 2024, 150, 459. [Google Scholar] [CrossRef]
- Jomrich, G.; Hollenstein, M.; John, A.; Harpain, L.; Kristo, I.; Schoppmann, S.F. High Systemic Immune-Inflammation Index is an Adverse Prognostic Factor for Patients With Gastroesophageal Adenocarcinoma. Ann. Surg. 2021, 273, 532–541. [Google Scholar] [CrossRef] [PubMed]
- Salazar-Valdivia, F.E.; Ávila-Aguero, M.L.; Gil-Torres, J.; Santos, A.; Agüero, D.; Nitsch-Velásquez, L. Systemic Immune-Inflammation Index and Mortality in Testicular Cancer: A Systematic Review and Meta-Analysis. Diagnostics 2023, 13, 843. [Google Scholar] [CrossRef] [PubMed]
- Islam, M.M.; Satici, M.O.; Eroglu, S.E. Unraveling the clinical significance and prognostic value of the neutrophil-to-lymphocyte ratio, platelet-to-lymphocyte ratio, systemic immune-inflammation index, systemic inflammation response index, and delta neutrophil index: An extensive literature review. Turk. J. Emerg. Med. 2024, 24, 8–19. [Google Scholar] [CrossRef] [PubMed]
- Hu, B.; Yang, X.R.; Xu, Y.; Sun, Y.F.; Sun, C.; Guo, W.; Zhang, X.; Wang, Y.; Qiu, S.J.; Shi, J.; et al. Systemic Immune-Inflammation Index Predicts Prognosis of Patients after Curative Resection for Hepatocellular Carcinoma. Clin. Cancer Res. 2014, 20, 6212–6222. [Google Scholar] [CrossRef]
- Jomrich, G.; Gruber, E.S.; Winkler, D.; Hollenstein, M.; Gasser, R.; Szkandera, J.; Kornprat, P.; Weissmueller, M.; Schoppmann, S.F.; Stotz, M.; et al. Systemic Immune-Inflammation Index (SII) Predicts Poor Survival in Pancreatic Cancer Patients Undergoing Resection. J. Gastrointest. Surg. 2020, 24, 610–618. [Google Scholar] [CrossRef]
- Ji, Y.; Wang, H. Prognostic prediction of systemic immune-inflammation index for patients with gynecological and breast cancers: A meta-analysis. World J. Surg. Oncol. 2020, 18, 197. [Google Scholar] [CrossRef]
- Alitalo, K.; Carmeliet, P. Molecular mechanisms of lymphangiogenesis in health and disease. Cancer Cell 2002, 1, 219–227. [Google Scholar] [CrossRef]
- Sleeman, J.P.; Thiele, W. Tumor metastasis and the lymphatic vasculature. Int. J. Cancer 2009, 125, 2747–2756. [Google Scholar] [CrossRef]
- Van Trappen, P.O.; Pepper, M.S. Lymphatic dissemination of tumour cells and the formation of micrometastases. Lancet Oncol. 2002, 3, 44–52. [Google Scholar] [CrossRef]
- Stacker, S.A.; Williams, S.P.; Karnezis, T.; Shayan, R.; Fox, S.B.; Achen, M.G. Lymphangiogenesis and lymphatic vessel remodelling in cancer. Nat. Rev. Cancer 2014, 14, 159–172. [Google Scholar] [CrossRef]
- Schoppmann, S.F.; Jesch, B.; Zacherl, J.; Riegler, M.F.; Friedrich, J.; Birner, P. Lymphangiogenesis and lymphovascular invasion diminishes prognosis in esophageal cancer. Surgery 2013, 153, 526–534. [Google Scholar] [CrossRef] [PubMed]
- Zheng, C.; Cui, M.; Liu, J.; Zhang, Q.; Zhao, G.; Li, Y. Lymphovascular Invasion as a Prognostic Factor in Non-Metastatic Adenocarcinoma of Esophagogastric Junction After Radical Surgery. Cancer Manag. Res. 2020, 12, 12791–12799. [Google Scholar] [CrossRef] [PubMed]
- Rice, T.W.; Patil, D.T.; Blackstone, E.H. 8th edition AJCC/UICC staging of cancers of the esophagus and esophagogastric junction: Application to clinical practice. Ann. Cardiothorac. Surg. 2017, 6, 119–130. [Google Scholar] [CrossRef] [PubMed]
- Mandard, A.M.; Dalibard, F.; Mandard, J.C.; Marnay, J.; Henry-Amar, M.; Petiot, J.F.; Roussel, A.; Jacob, J.H.; Segol, P.; Samama, G. Pathologic assessment of tumor regression after preoperative chemoradiotherapy of esophageal carcinoma. Clinicopathologic correlations. Cancer 1994, 73, 2680–2686. [Google Scholar] [CrossRef]
- Siewert, J.R.; Stein, H.J. Classification of adenocarcinoma of the oesophagogastric junction. Br. J. Surg. 1998, 85, 1457–1459. [Google Scholar] [CrossRef]
- Ichhpuniani, S.; Jamal, M.; Deeb, A.P.; Khan, T.; Gahagan, J.; Kim, D.; Aragon-Ching, J.B.; Shah, N.; Catenacci, D.V.T.; Margolis, C.A.; et al. Lymph Node Ratio as a Predictor of Survival for Colon Cancer: A Systematic Review and Meta-Analysis. Am. Surg. 2024, 90, 840–850. [Google Scholar] [CrossRef]
- Hav, M.; Libbrecht, L.; Ferdinande, L.; Geboes, K.; Pattyn, P.; Cuvelier, C.A. Pathologic Assessment of Rectal Carcinoma after Neoadjuvant Radio(chemo)therapy: Prognostic Implications. Biomed Res. Int. 2015, 2015, 574540. [Google Scholar] [CrossRef]
- Thompson, N.; Storr, S.; Zhang, S.; Martin, S. Lymphovascular invasion: Assessment and prognostic impact in melanoma and breast cancer. Histol. Histopathol. 2015, 30, 1001–1009. [Google Scholar] [CrossRef] [PubMed]
- Tamura, N.; Hasebe, T.; Okada, N.; Houjoh, T.; Akashi-Tanaka, S.; Shimizu, C.; Shibata, T.; Sasajima, Y.; Iwasaki, M.; Kinoshita, T. Tumor histology in lymph vessels and lymph nodes for the accurate prediction of outcome among breast cancer patients treated with neoadjuvant chemotherapy. Cancer Sci. 2009, 100, 1823–1833. [Google Scholar] [CrossRef] [PubMed] [PubMed Central]
- Langer, R.; Becker, K. Tumor regression grading of gastrointestinal cancers after neoadjuvant therapy. Virchows Arch. 2018, 472, 175–186. [Google Scholar] [CrossRef] [PubMed]
- Zhou, J.; Yang, Y.; Zhang, H.; Luan, S.; Xiao, X.; Li, X.; Fang, P.; Gu, Y.; Chen, L.; Zeng, X.; et al. Lymphovascular and Perineural Invasion After Neoadjuvant Therapy in Esophageal Squamous Carcinoma. Ann. Thorac. Surg. 2023, 115, 1386–1394. [Google Scholar] [CrossRef] [PubMed]
- Thies, S.; Langer, R. Tumor regression grading of gastrointestinal carcinomas after neoadjuvant treatment. Front Oncol. 2013, 3, 262. [Google Scholar] [CrossRef] [PubMed] [PubMed Central]
- Zhang, Y.; Xiao, G.; Wang, R. Clinical significance of systemic immune-inflammation index (SII) and C-reactive protein-to-albumin ratio (CAR) in patients with esophageal cancer: A meta-analysis. Cancer Manag. Res. 2019, 11, 4185–4200. [Google Scholar] [CrossRef] [PubMed] [PubMed Central]
- Wang, A.; Tan, Y.; Geng, X.; Chen, X.; Wang, S. Lymphovascular invasion as a poor prognostic indicator in thoracic esophageal carcinoma: A systematic review and meta-analysis. Dis. Esophagus 2019, 32, doy083. [Google Scholar] [CrossRef] [PubMed]

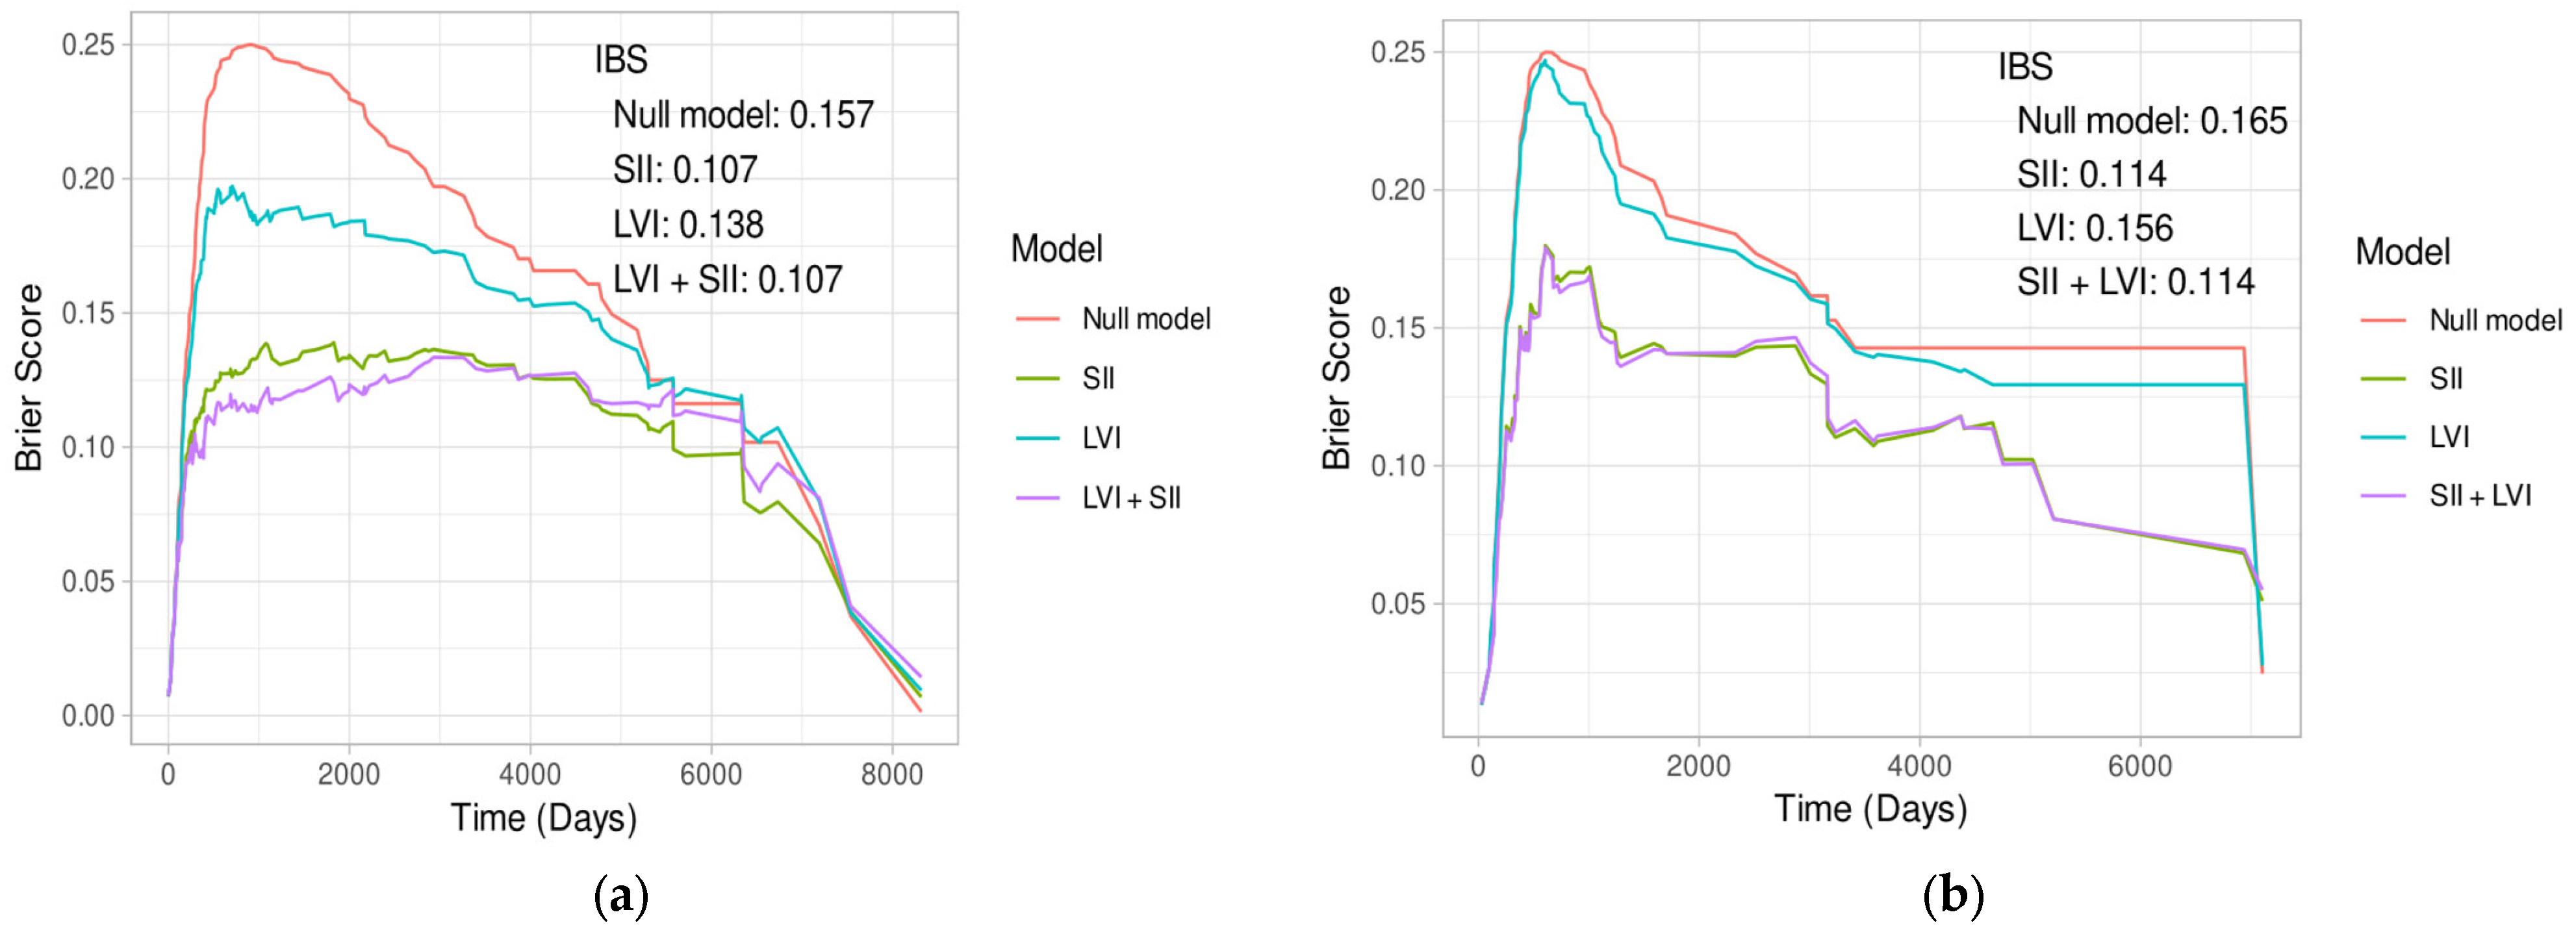
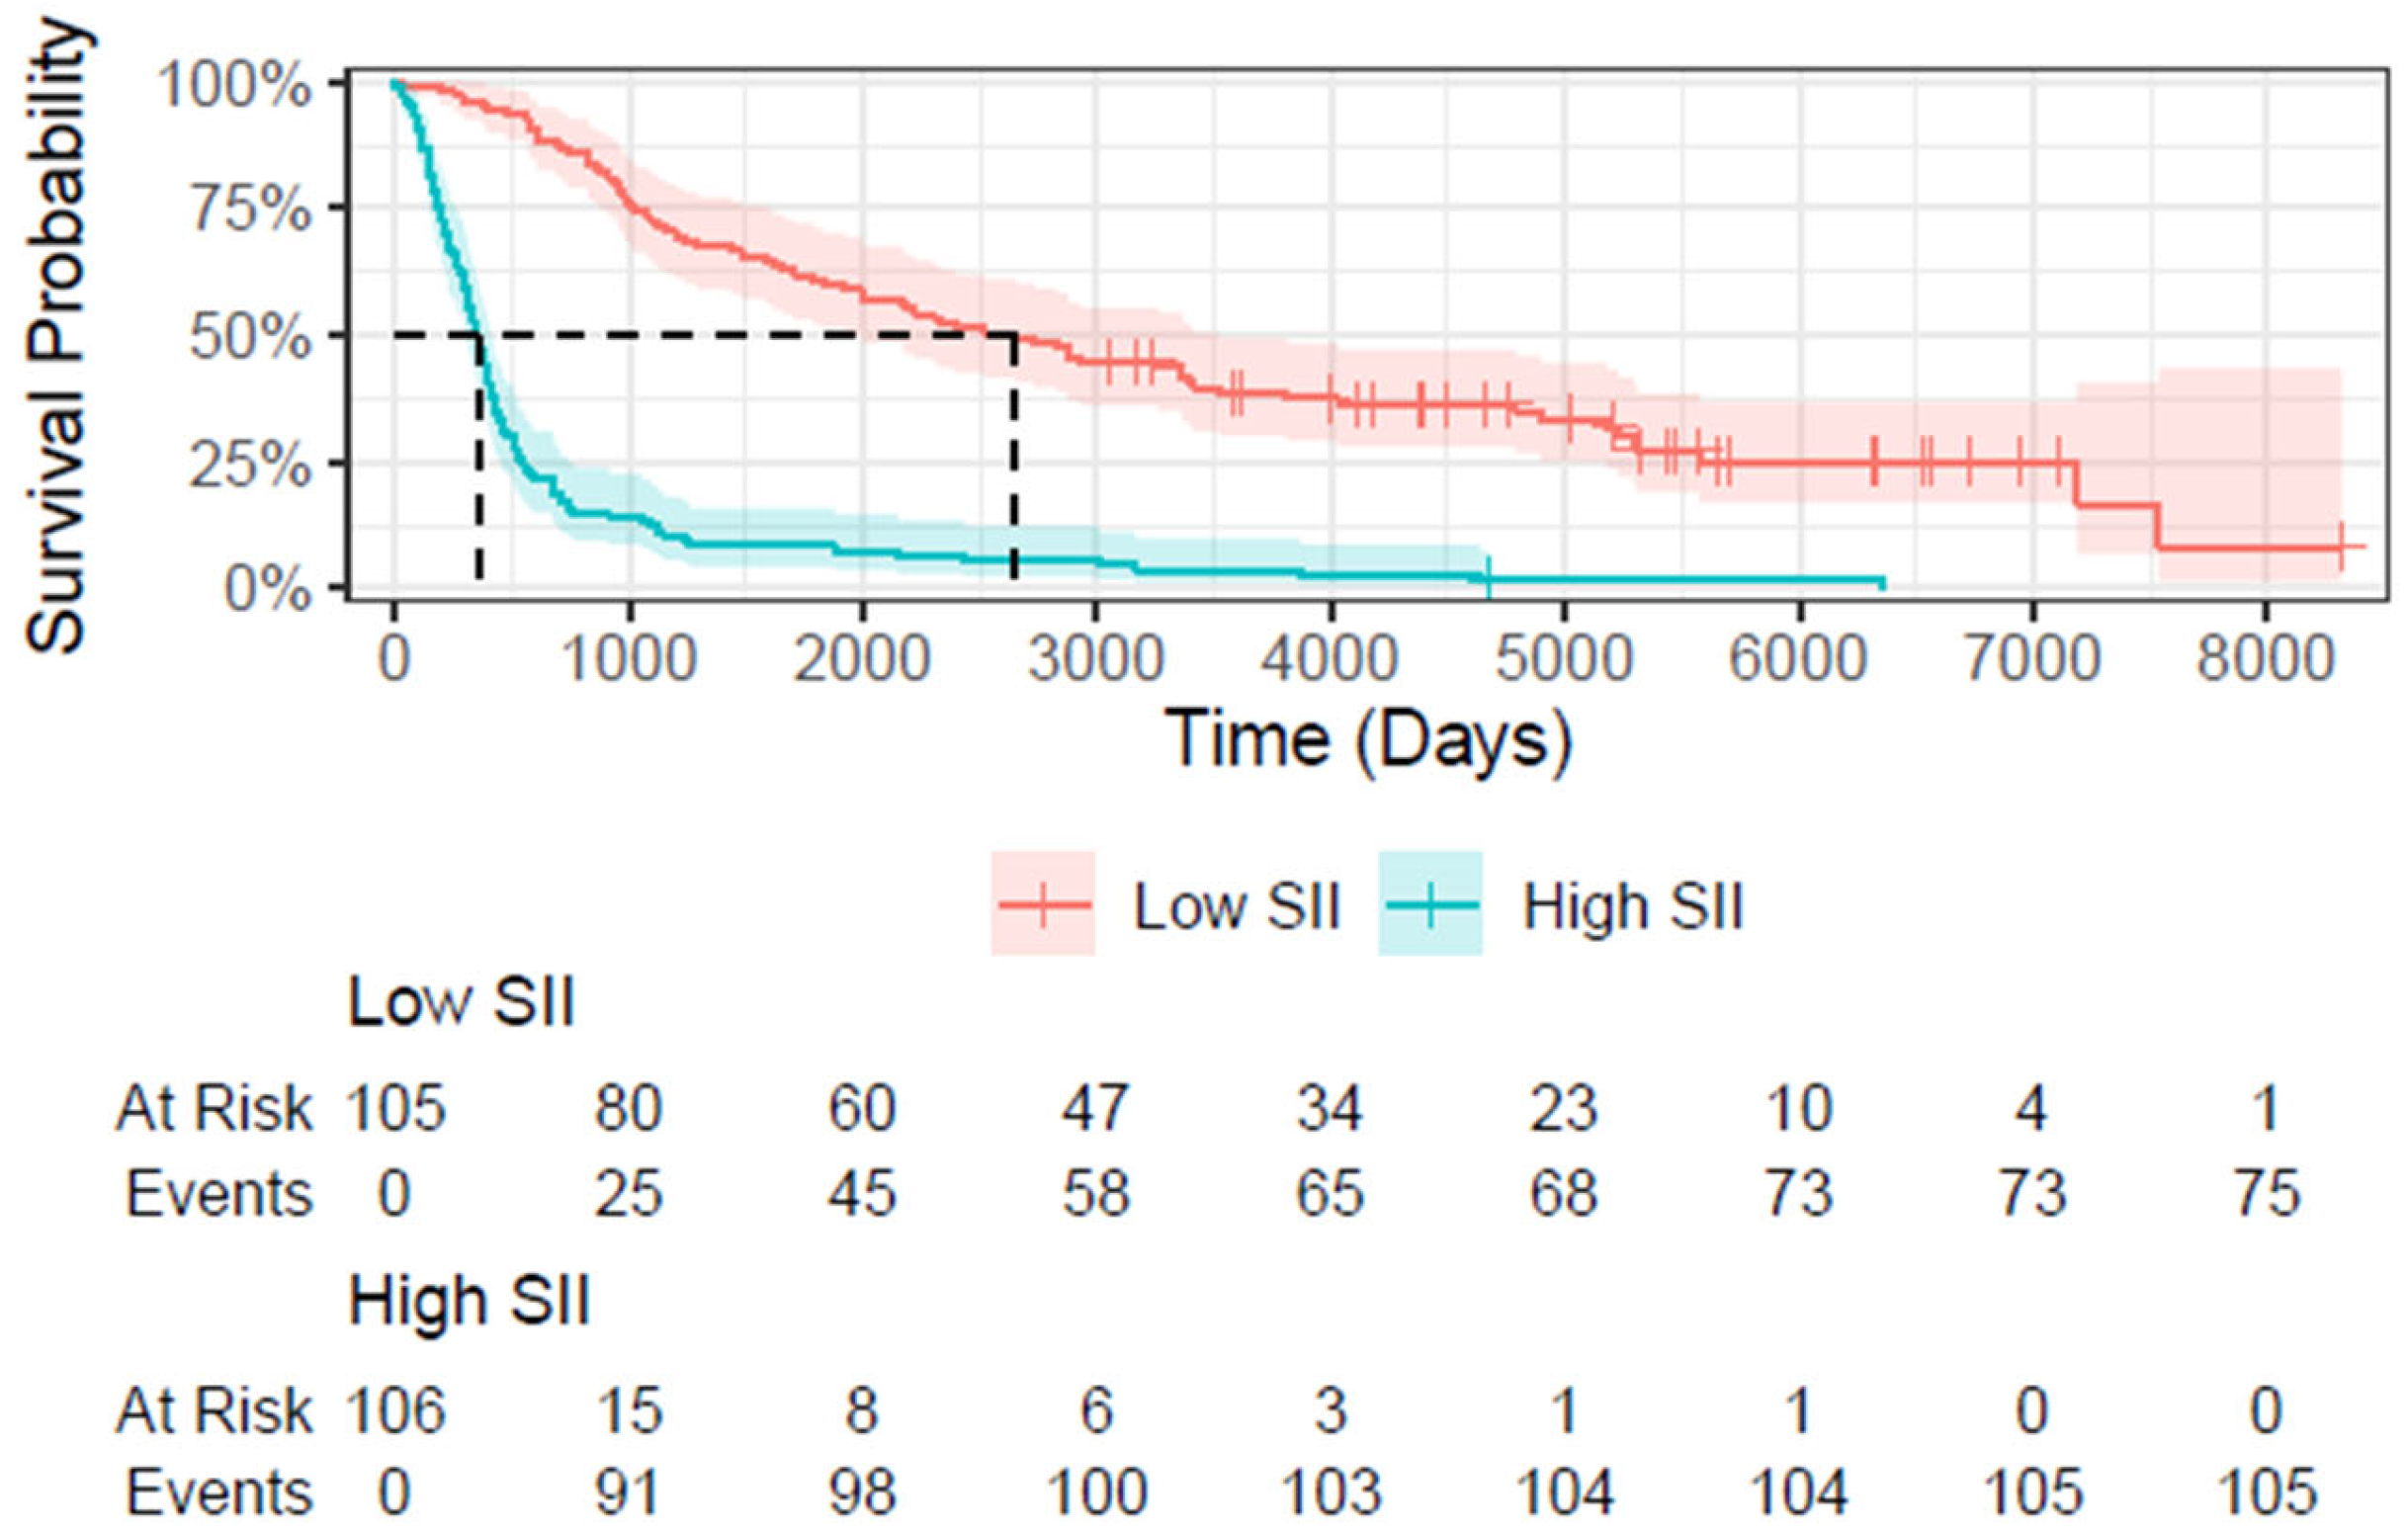

| Characteristic | All Patients | Neoadjuvant Therapy | ||
|---|---|---|---|---|
| Overall (n = 211) | No (n = 137) | Yes (n = 74) | ||
| SII | ||||
| Mean | 783 | 784 | 781 | |
| SD * | 388 | 420 | 323 | |
| LVI, n (%) | ||||
| - | 116 (55%) | 79 (58%) | 37 (50%) | |
| + | 95 (45%) | 58 (42%) | 37 (50%) | |
| Age at surgery | ||||
| Mean | 65 | 66 | 62 | |
| SD | 11 | 11 | 10 | |
| Sex | ||||
| Female | 39 (18%) | 26 (19%) | 13 (18%) | |
| male | 172 (82%) | 111 (81%) | 61 (82%) | |
| (y)pT **, n (%) | ||||
| 0 | 1 (0.5%) | 0 (0%) | 1 (1.4%) | |
| 1 | 38 (18%) | 32 (23%) | 6 (8.1%) | |
| 2 | 69 (33%) | 49 (36%) | 20 (27%) | |
| 3 | 93 (44%) | 50 (36%) | 43 (58%) | |
| 4 | 10 (4.7%) | 6 (4.4%) | 4 (5.4%) | |
| (y)pN, n (%) | ||||
| 0 | 82 (39%) | 56 (41%) | 26 (35%) | |
| 1 | 90 (43%) | 53 (39%) | 37 (50%) | |
| 2 | 25 (12%) | 18 (13%) | 7 (9.5%) | |
| 3 | 14 (6.6%) | 10 (7.3%) | 4 (5.4%) | |
| LK_ratio | ||||
| Mean | 0.21 | 0.21 | 0.20 | |
| SD | 0.26 | 0.26 | 0.25 | |
| Unknown | 3 | 3 | 0 | |
| G, n (%) *** | ||||
| 1 | 6 (2.8%) | 5 (3.6%) | 1 (1.4%) | |
| 2 | 89 (42%) | 59 (43%) | 30 (41%) | |
| 3 | 116 (55%) | 73 (53%) | 43 (58%) | |
| Tumor type, n (%) | ||||
| AEG I | 115 (55%) | 60 (44%) | 55 (74%) | |
| AEG II | 83 (39%) | 71 (52%) | 12 (16%) | |
| AEG III | 13 (6.2%) | 6 (4.4%) | 7 (9.5%) | |
| Surgery technique | ||||
| Single-cavity | 85 (40%) | 70 (51%) | 15 (20%) | |
| Two-cavity | 126 (60%) | 67 (49%) | 59 (80%) | |
| ASA preOP **** | ||||
| 1 | 45 (21%) | 18 (13%) | 27 (36%) | |
| 2 | 139 (66%) | 102 (74%) | 37 (50%) | |
| 3 | 24 (11%) | 15 (11%) | 9 (12%) | |
| 4 | 3 (1.4%) | 2 (1.5%) | 1 (1.4%) | |
| ECOG preOp ***** | ||||
| 0 | 86 (43%) | 55 (43%) | 31 (43%) | |
| 1 | 90 (45%) | 57 (44%) | 33 (46%) | |
| 2 | 21 (10%) | 15 (12%) | 6 (8.3%) | |
| 3 | 4 (2.0%) | 2 (1.6%) | 2 (2.8%) | |
| Unknown | 10 | 8 | 2 | |
| UICC postOP | ||||
| I | 56 (27%) | 43 (31%) | 13 (18%) | |
| II | 60 (28%) | 37 (27%) | 23 (31%) | |
| III | 88 (42%) | 50 (36%) | 38 (51%) | |
| IV | 7 (3.3%) | 7 (5.1%) | 0 (0%) | |
| NT, n (%) | 74 (35%) | |||
| Mandard response | ||||
| 1 | - | 137 (100%) | 0 (0%) | |
| 2 | - | 0 (0%) | 5 (6.8%) | |
| 3 | - | 0 (0%) | 16 (22%) | |
| 4 | - | 0 (0%) | 30 (41%) | |
| 5 | - | 0 (0%) | 23 (31%) | |
| Chemotherapy regimen, n (%) | ||||
| A | 52 (25%) | 0 (0%) | 52 (70%) | |
| B | 18 (8.5%) | 0 (0%) | 18 (24%) | |
| C | 4 (1.9%) | 0 (0%) | 4 (5.4%) | |
| none | 137 (65%) | 137 (100%) | 0 (0%) | |
| LVI | |||||
|---|---|---|---|---|---|
| Group | n | − 1 | + 1 | p-Value 2 | p-Superiority 3 |
| SII (overall) | 211 | 556 (367, 874) | 924 (695, 1165) | <0.001 | 0.27 (0.21, 0.34) |
| SII (NT) | 74 | 631 (399, 993) | 816 (702, 1005) | 0.021 | 0.34 (0.24, 0.47) |
| SII (no NT) | 137 | 496 (339, 824) | 1.013 (689, 1226) | <0.001 | 0.23 (0.17, 0.31) |
| Model Coefficients | |||||
|---|---|---|---|---|---|
| Covariate | Estimate | HR 1 | SE 2 | z-Value | p-Value |
| LVI (R2 = 0.128) | |||||
| LVI+ | 0.840 | 2.317 | 0.154 | 5.465 | <0.001 |
| SII (R2 = 0.441) | |||||
| SII | 0.231 | 1.259 | 0.018 | 12.485 | <0.001 |
| SII + LVI (R2 = 0.485) | |||||
| SII | 0.288 | 1.257 | 0.019 | 11.946 | <0.001 |
| LVI+ | 0.680 | 1.973 | 0.161 | 4.233 | <0.001 |
| Model Coefficients | |||||
|---|---|---|---|---|---|
| Covariate | Estimate | HR 1 | SE 2 | z-Value | p-Value |
| LVI (R2 = 0.192) | |||||
| LVI+ | 1.065 | 2.902 | 0.192 | 5.557 | <0.001 |
| SII (R2 = 0.451) | |||||
| SII | 0.231 | 1.237 | 0.021 | 10.254 | <0.001 |
| SII + LVI (R2 = 0.524) | |||||
| SII | 0.209 | 1.232 | 0.022 | 9.617 | <0.001 |
| LVI+ | 0.918 | 2.504 | 0.204 | 4.504 | <0.001 |
| Model Coefficients | |||||
|---|---|---|---|---|---|
| Covariate | Estimate | HR 1 | SE 2 | z-Value | p-Value |
| LVI (R2 = 0.030) | |||||
| LVI+ | 0.387 | 1.473 | 0.259 | 1.495 | 0.135 |
| SII (R2 = 0.432) | |||||
| SII | 0.335 | 1.398 | 0.052 | 6.421 | <0.001 |
| SII + LVI (R2 = 0.438) | |||||
| SII | 0.337 | 1.401 | 0.053 | 6.330 | <0.001 |
| LVI+ | 0.233 | 1.262 | 0.2644 | 0.884 | 0.3771 |
| AIC | Used Parameters |
|---|---|
| LVI_SII | |
| 785 | SII, LVI, pT, pN, surgery_technique |
| 786 | SII, LVI, SEX, pT, pN, surgery_technique |
| 786 | SII, LVI, SEX, pT, pN, G, surgery_technique |
| SII | |
| 785 | SII, pT, pN, surgery_technique |
| 785 | SII, SEX, pT, pN, surgery_technique |
| 785 | SII, SEX, pT, pN, G, surgery_technique |
| AIC | Used Parameters |
|---|---|
| LVI_SII | |
| 393 | SII, LVI, age_at_OP, ECOG_pre_OP |
| 394 | SII, LVI, age_at_OP, pN, ECOG_pre_OP |
| 394 | SII, LVI, age_at_OP, pUICC, ECOG_pre_OP |
| SII | |
| 391 | SII, age_at_OP, ECOG_pre_OP |
| 391 | SII, age_at_OP, pN, ECOG_pre_OP |
| 392 | SII, age_at_OP, pUICC, ECOG_pre_OP |
| Model Coefficients | |||||
|---|---|---|---|---|---|
| Covariate | Estimate | HR | SE | z-Value | p-Value |
| LVI_SII | |||||
| SII | 0.223 | 1.250 | 0.025 | 8.955 | <0.001 |
| LVI+ | 0.250 | 1.284 | 0.244 | 1.024 | 0.30 |
| pT | 0.402 | 1.494 | 0.141 | 2.849 | 0.004 |
| pN | 0.474 | 1.607 | 0.126 | 3.754 | <0.001 |
| Surgery_technique two-cavity | −0.404 | 0.668 | 0.201 | −2.009 | 0.0456 |
| SII | |||||
| SII | 0.227 | 1.258 | 0.024 | 9.254 | <0.001 |
| pT | 0.454 | 1.575 | 0.132 | 3.453 | <0.001 |
| pN | 0.475 | 1.608 | 0.126 | 3.771 | <0.001 |
| Surgery_technique two-cavity | −0.440 | 0.644 | 0.198 | −2.227 | 0.026 |
| Model Coefficients | |||||
|---|---|---|---|---|---|
| Covariate | Estimate | HR | SE | z-Value | p-Value |
| LVI_SII | |||||
| SII | 0.373 | 1.453 | 0.058 | 6.385 | <0.001 |
| LVI+ | 0.051 | 1.053 | 0.276 | 0.186 | 0.852 |
| Age_at-OP | −0.026 | 0.974 | 0.014 | −1.896 | 0.058 |
| ECOG_pre_OP | 0.497 | 1.644 | 0.202 | 2.465 | 0.014 |
| SII | |||||
| SII | 0.375 | 1.455 | 0.058 | 6.463 | <0.001 |
| Age_at-OP | −0.027 | 0.974 | 0.013 | −1.980 | 0.048 |
| ECOG_pre_OP | 0.501 | 1.650 | 0.200 | 2.499 | 0.012 |
Disclaimer/Publisher’s Note: The statements, opinions and data contained in all publications are solely those of the individual author(s) and contributor(s) and not of MDPI and/or the editor(s). MDPI and/or the editor(s) disclaim responsibility for any injury to people or property resulting from any ideas, methods, instructions or products referred to in the content. |
© 2025 by the authors. Licensee MDPI, Basel, Switzerland. This article is an open access article distributed under the terms and conditions of the Creative Commons Attribution (CC BY) license (https://creativecommons.org/licenses/by/4.0/).
Share and Cite
Jomrich, G.; Yan, W.; Kollmann, D.; Kristo, I.; Fallmann, B.; Puhr, H.; Ilhan-Mutlu, A.; Hollenstein, M.; Asari, R.; Sebesta, C.; et al. Lymphovascular Invasion (LVI) Correlates with Systemic Immune-Inflammation Index (SII) in Adenocarcinoma of the Gastroesophageal Junction (AEG): Implications for Prognostic Stratification. Cancers 2025, 17, 2604. https://doi.org/10.3390/cancers17162604
Jomrich G, Yan W, Kollmann D, Kristo I, Fallmann B, Puhr H, Ilhan-Mutlu A, Hollenstein M, Asari R, Sebesta C, et al. Lymphovascular Invasion (LVI) Correlates with Systemic Immune-Inflammation Index (SII) in Adenocarcinoma of the Gastroesophageal Junction (AEG): Implications for Prognostic Stratification. Cancers. 2025; 17(16):2604. https://doi.org/10.3390/cancers17162604
Chicago/Turabian StyleJomrich, Gerd, Winny Yan, Dagmar Kollmann, Ivan Kristo, Benjamin Fallmann, Hannah Puhr, Aysegül Ilhan-Mutlu, Marlene Hollenstein, Reza Asari, Christian Sebesta, and et al. 2025. "Lymphovascular Invasion (LVI) Correlates with Systemic Immune-Inflammation Index (SII) in Adenocarcinoma of the Gastroesophageal Junction (AEG): Implications for Prognostic Stratification" Cancers 17, no. 16: 2604. https://doi.org/10.3390/cancers17162604
APA StyleJomrich, G., Yan, W., Kollmann, D., Kristo, I., Fallmann, B., Puhr, H., Ilhan-Mutlu, A., Hollenstein, M., Asari, R., Sebesta, C., & Schoppmann, S. F. (2025). Lymphovascular Invasion (LVI) Correlates with Systemic Immune-Inflammation Index (SII) in Adenocarcinoma of the Gastroesophageal Junction (AEG): Implications for Prognostic Stratification. Cancers, 17(16), 2604. https://doi.org/10.3390/cancers17162604


