


Error in Figure 2
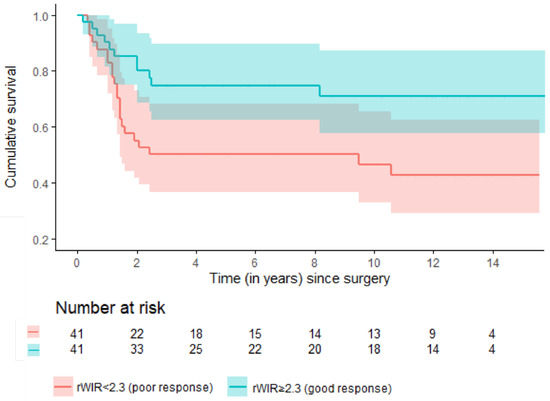
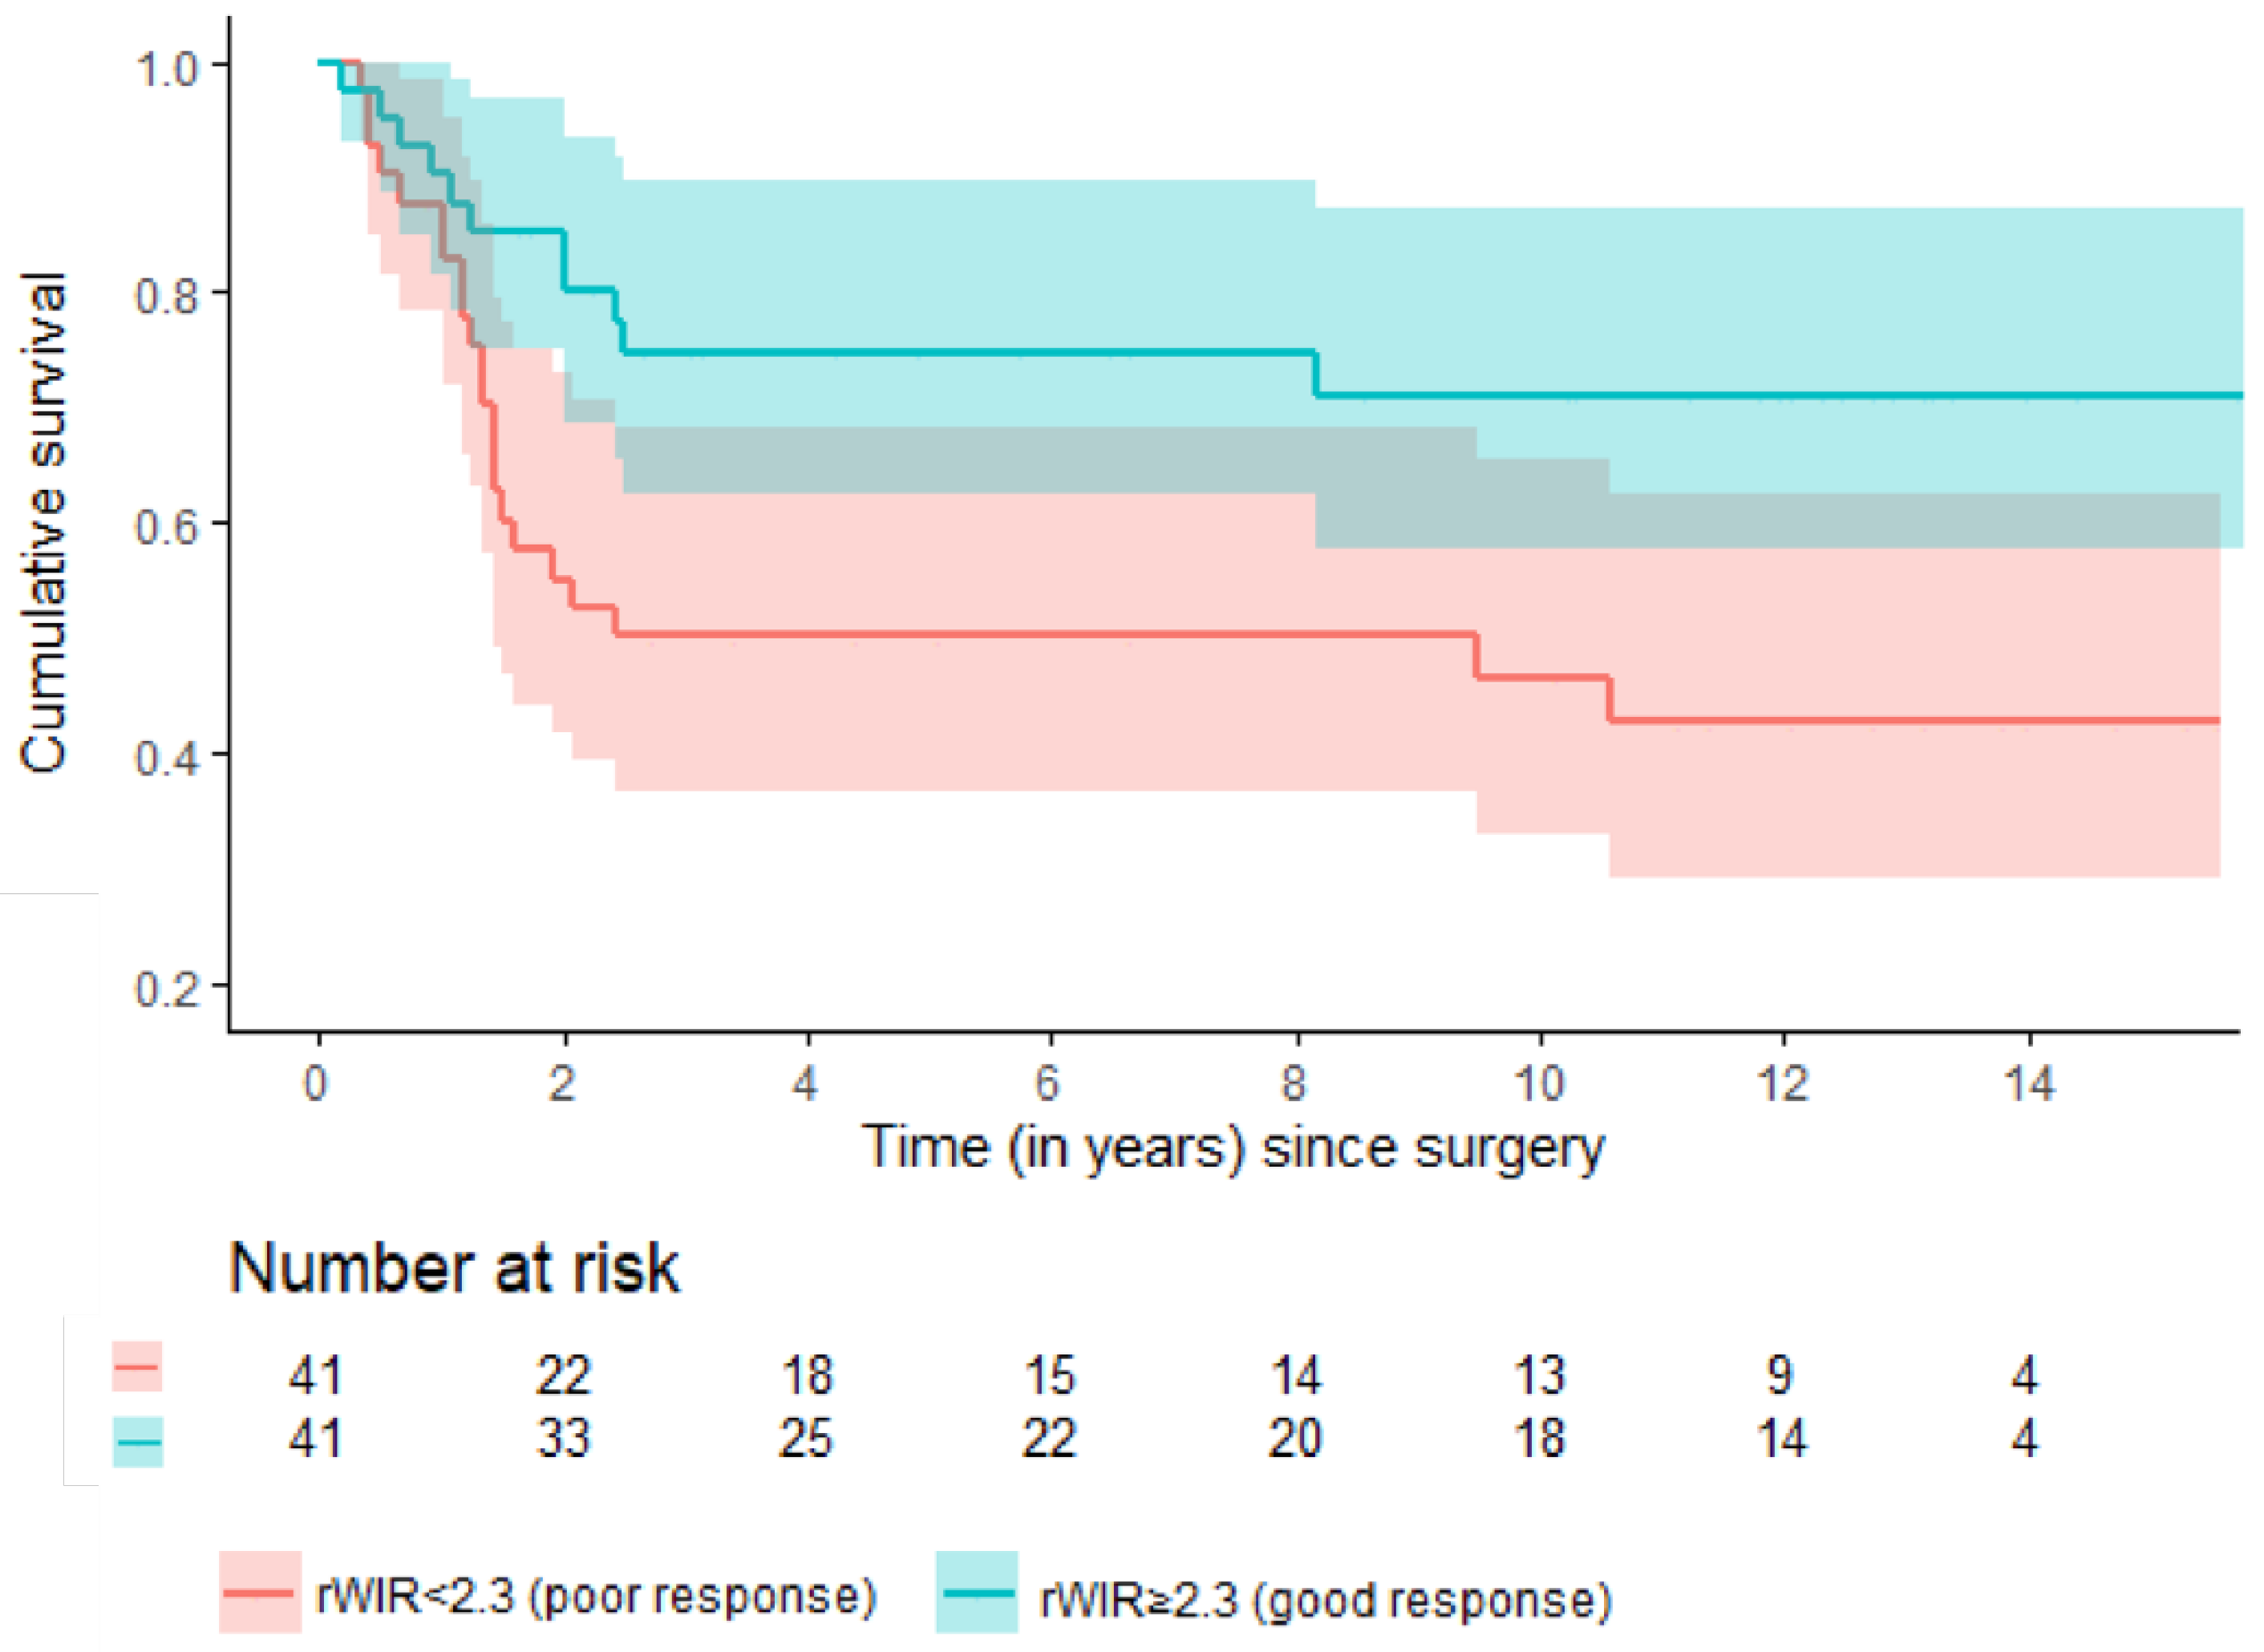
In the original publication [1], there was a mistake in the legend of Figure 2 as published. In the original version the legend wrongly states the red line accounts for patients with ‘rWIR ≥ 2.3 (good response),’ whereas it actually accounts for patients with poor response. The corrected Figure 2 appears below.
Figure 2.
Estimated event-free survival among good and poor responders based on the rWIR with a cut-off of 2.3.
Error in Figure 3
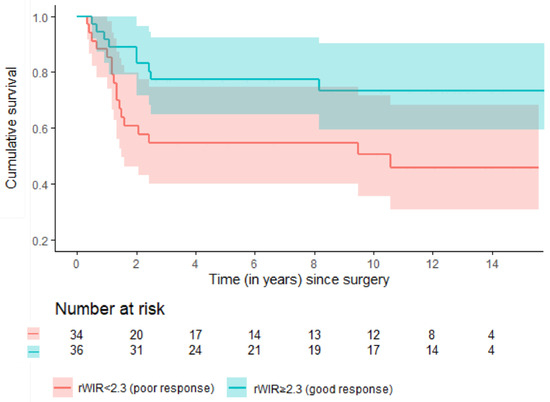
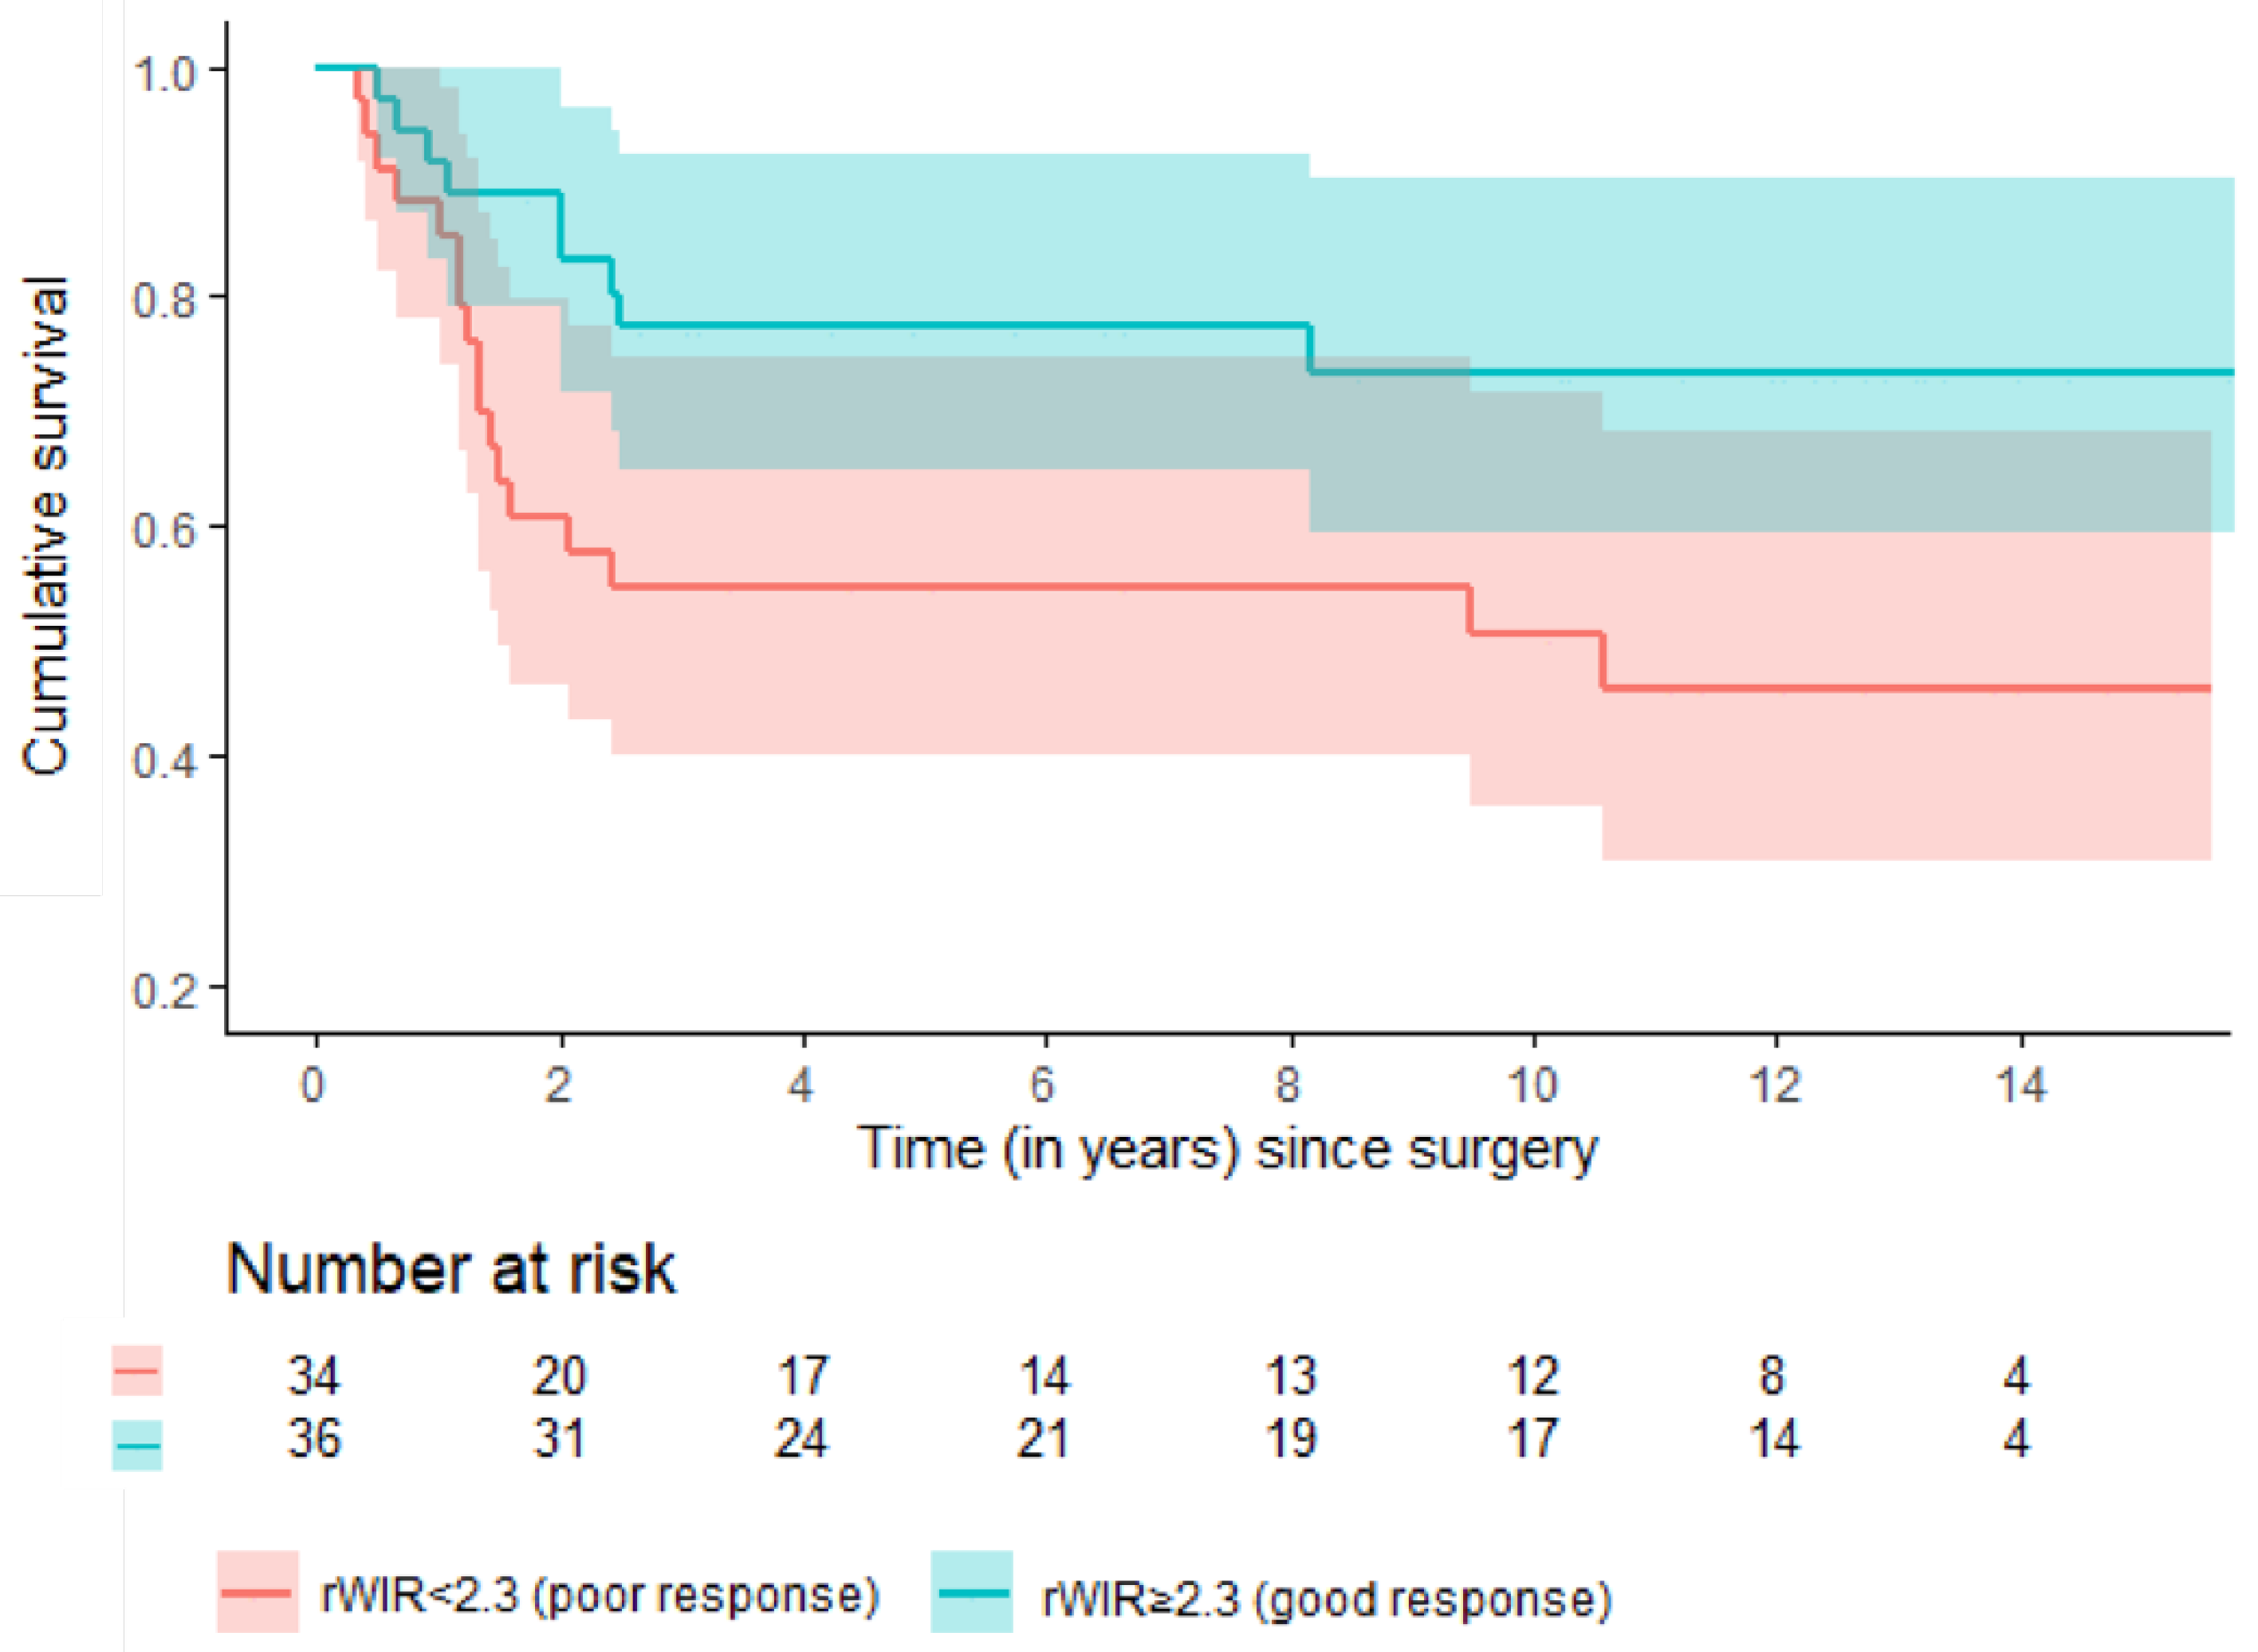
In the original publication, there was a mistake in the legend of Figure 3 as published. In the original version the legend wrongly states the red line accounts for patients with ‘rWIR ≥ 2.3 (good response),’ whereas it actually accounts for patients with poor response. The corrected Figure 3 appears below.
Figure 3.
Estimated event-free survival among good and poor responders based on the rWIR with a cut-off of 2.3 in a subpopulation of 70 patients without metastases at presentation.
Error in Table 2
In the original publication, there was a mistake in Table 2 as published. The fourth column of the original table wrongly defines good and poor radiological responders. rWIR < 2.3 should define poor response and rWIR ≥ 2.3 should define good response. The corrected Table 2 appears below.
Table 2.
Hazard ratios (HRs) along with the 95% confidence intervals using multivariate Cox regression models for EFS in a study population (n = 82), with prognostic factors including histological response (left), rWIR as a binary variable (middle), and rWIR as a continuous variable (right) as the prognostic factors.
Error in Table 3
In the original publication, there was a mistake in Table 3 as published. The fourth column of the original table wrongly defines good and poor radiological responders. rWIR < 2.3 should define poor response and rWIR ≥ 2.3 should define good response. The corrected Table 3 appears below.
Table 3.
Hazard ratios (HRs) along with the 95% confidence intervals using multivariate Cox regression models for EFS with prognostic factors including histological response (left), rWIR as a binary variable (middle), and rWIR as a continuous variable (right) as the prognostic factors in a subpopulation of 70 patients without metastases at presentation.
The authors state that the scientific conclusions are unaffected. This correction was approved by the Academic Editor. The original publication has also been updated.
Reference
- Kalisvaart, G.M.; Evenhuis, R.E.; Grootjans, W.; Van Den Berghe, T.; Callens, M.; Bovée, J.V.M.G.; Creytens, D.; Gelderblom, H.; Speetjens, F.M.; Lapeire, L.; et al. Relative Wash-In Rate in Dynamic Contrast-Enhanced Magnetic Resonance Imaging as a New Prognostic Biomarker for Event-Free Survival in 82 Patients with Osteosarcoma: A Multicenter Study. Cancers 2024, 16, 1954. [Google Scholar] [CrossRef] [Scilit] [PubMed]

Disclaimer/Publisher’s Note: The statements, opinions and data contained in all publications are solely those of the individual author(s) and contributor(s) and not of MDPI and/or the editor(s). MDPI and/or the editor(s) disclaim responsibility for any injury to people or property resulting from any ideas, methods, instructions or products referred to in the content. |
© 2025 by the authors. Licensee MDPI, Basel, Switzerland. This article is an open access article distributed under the terms and conditions of the Creative Commons Attribution (CC BY) license (https://creativecommons.org/licenses/by/4.0/).