Loss of Heterozygosity in Pediatric Acute Lymphoblastic Leukemia and Its Prognostic Impact: A Retrospective Study

 ,
,  ,
,
Simple Summary
Abstract
1. Introduction
2. Materials and Methods
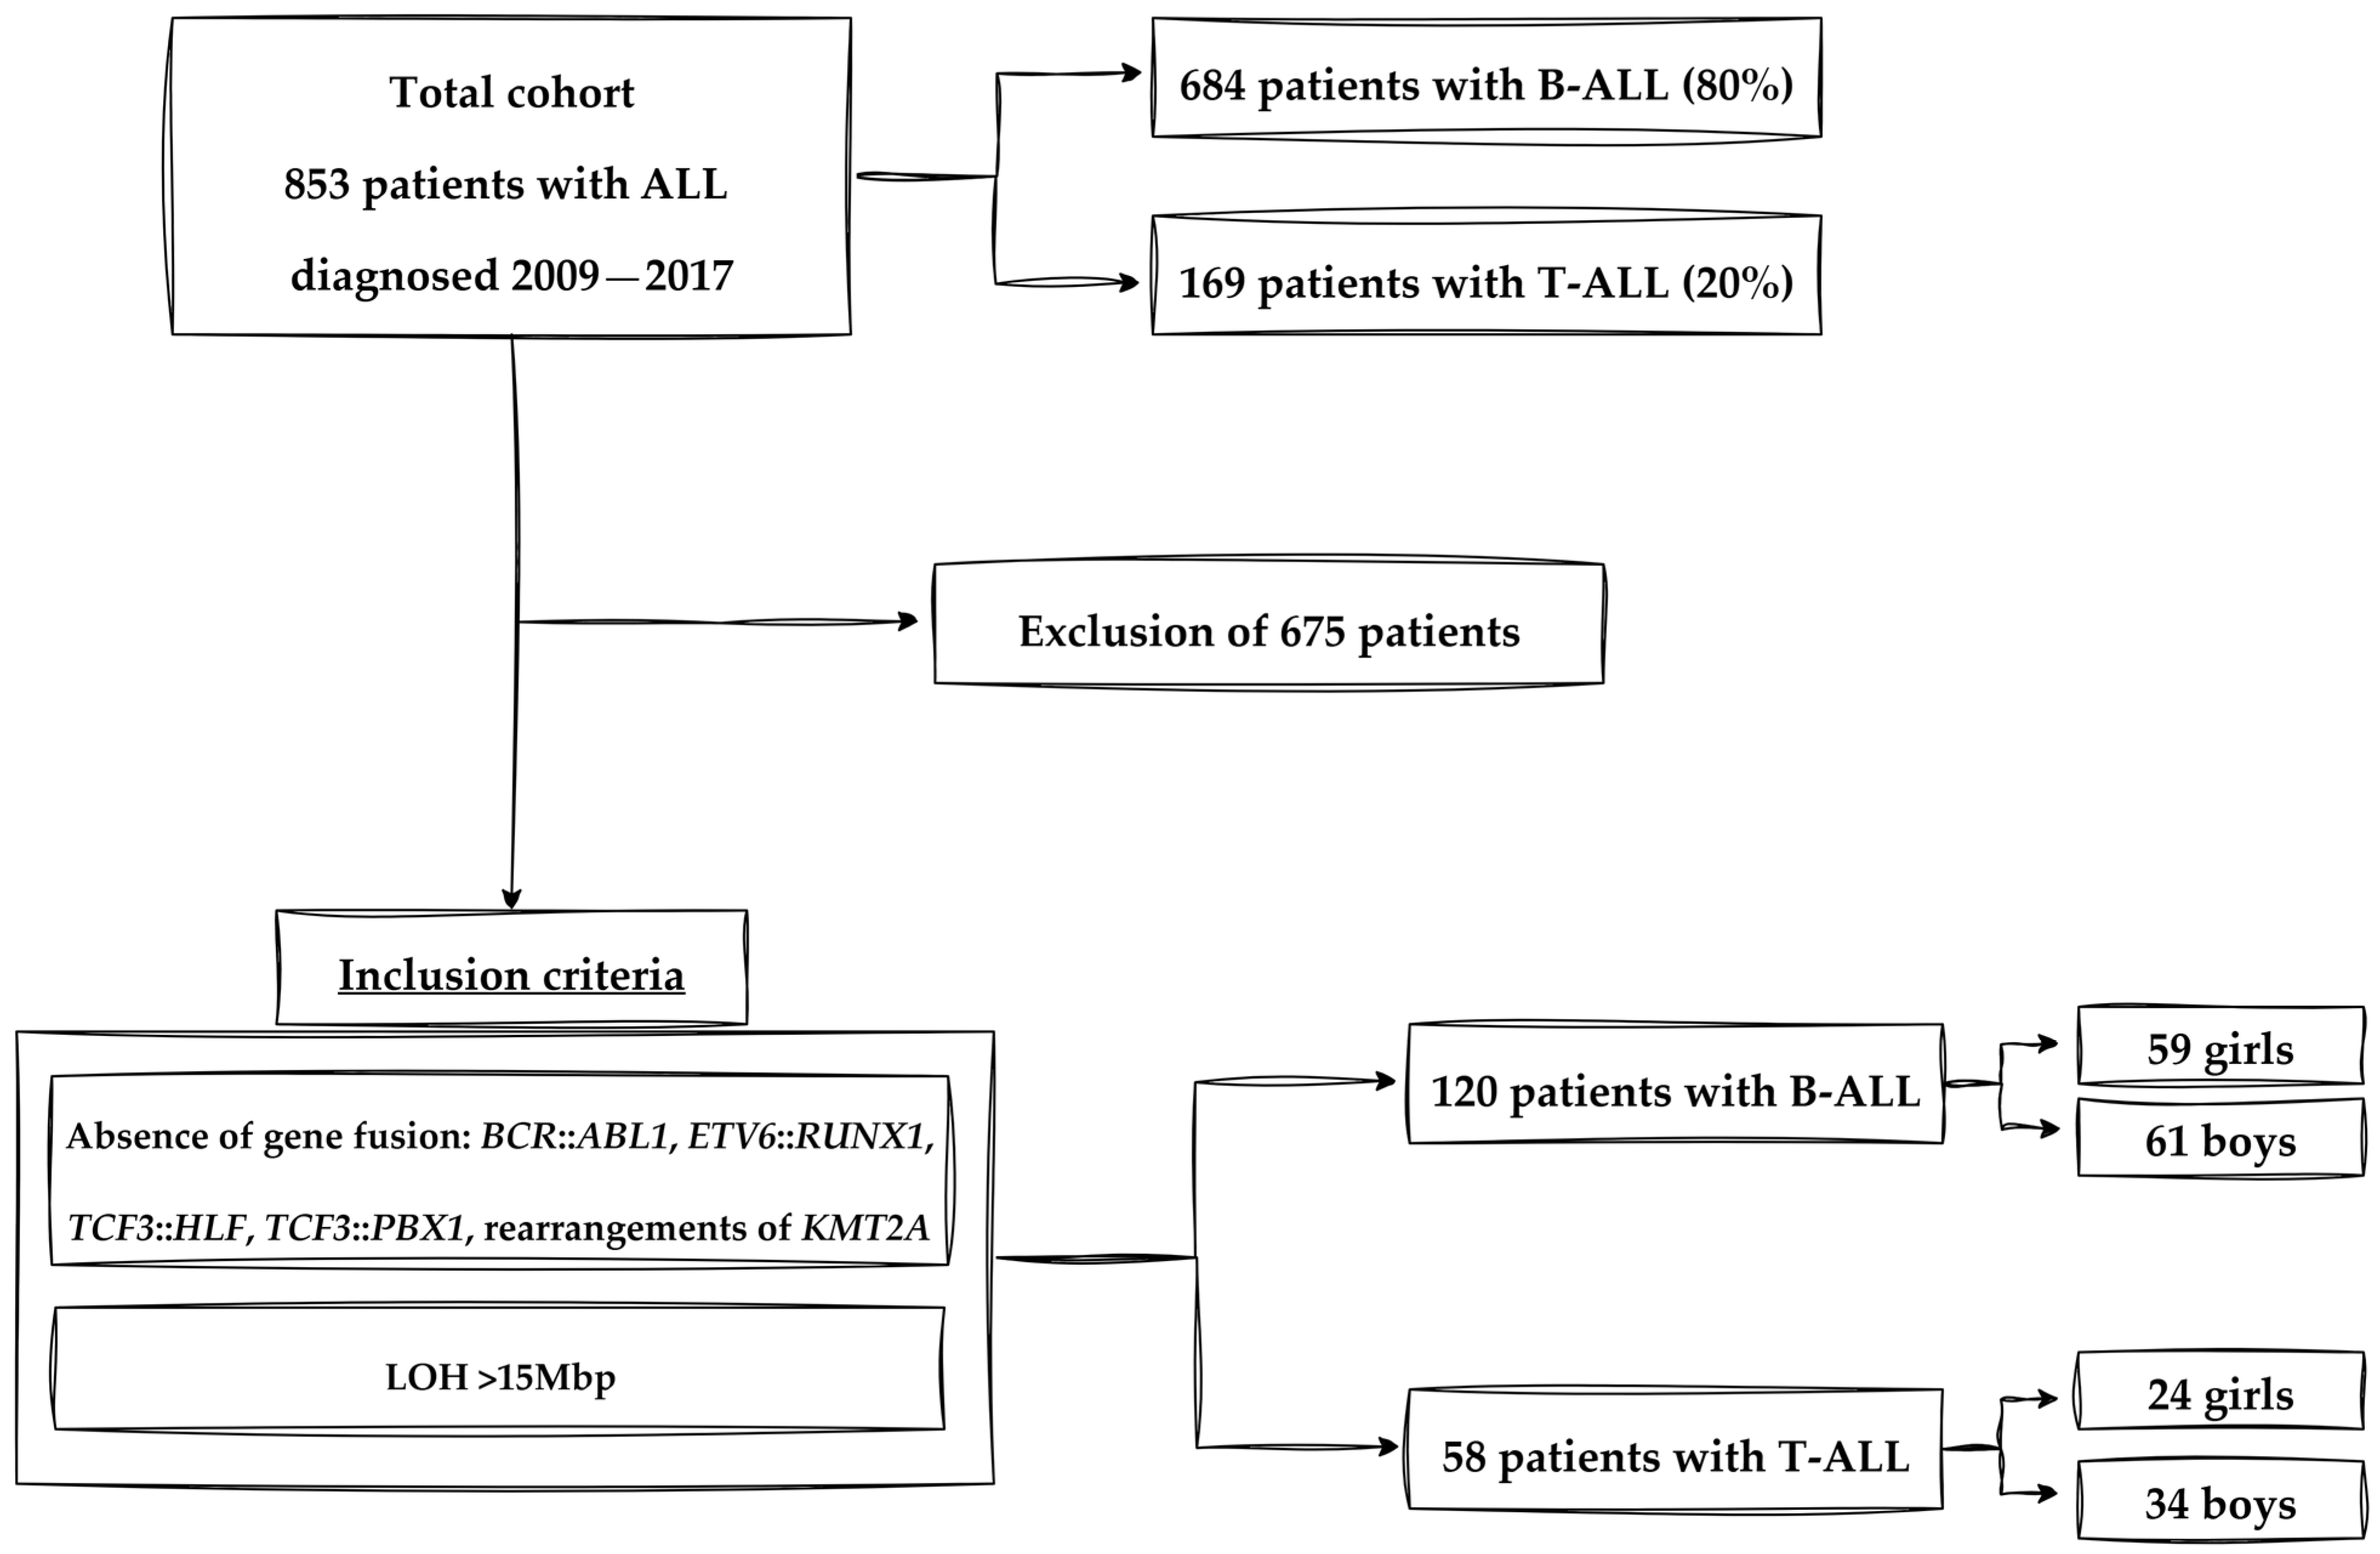
2.1. Participants and Study Design
2.2. Microarray Analysis
2.3. Experimental Design
2.4. Criteria of Experimental Group
2.5. Statistical Analysis
2.5.1. Significance Level and Selection of Analytical Methods
2.5.2. Patient Clustering
2.5.3. Role and Interpretation of Clusters and Dimensions
2.5.4. Analysis Objective and Input Variables
2.5.5. Clustering Results: B-ALL and T-ALL Cohorts
3. Results
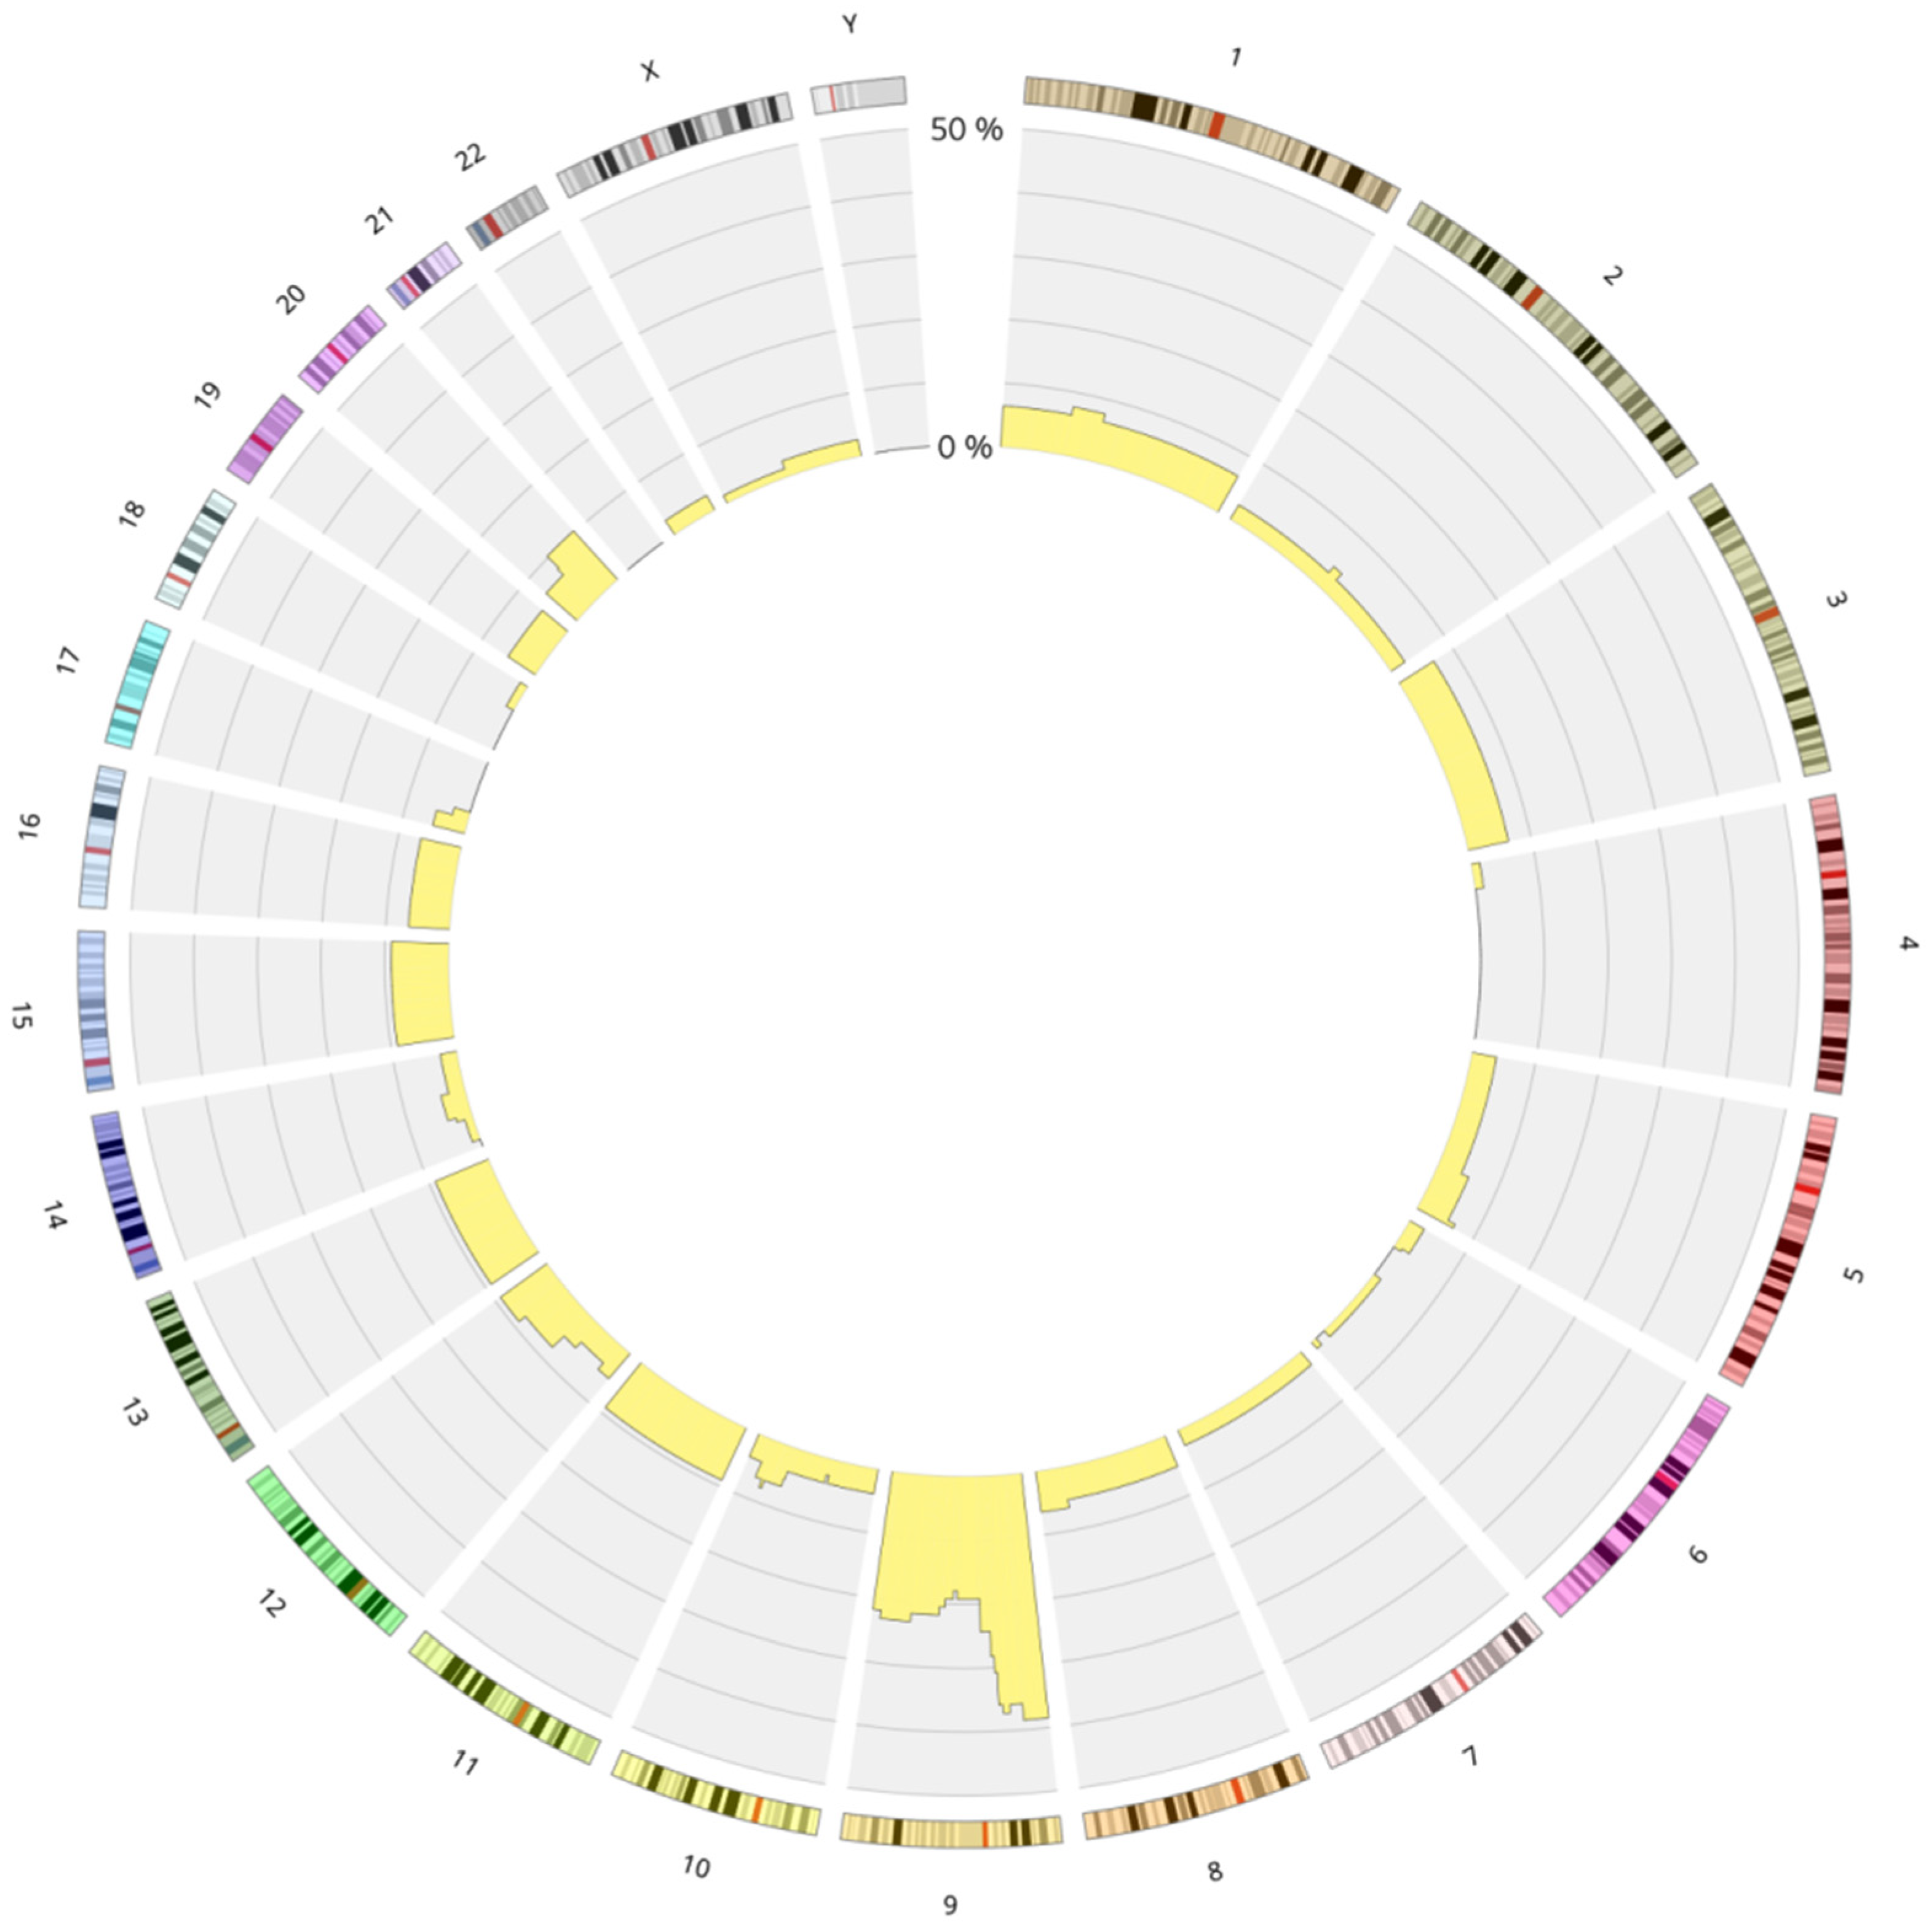
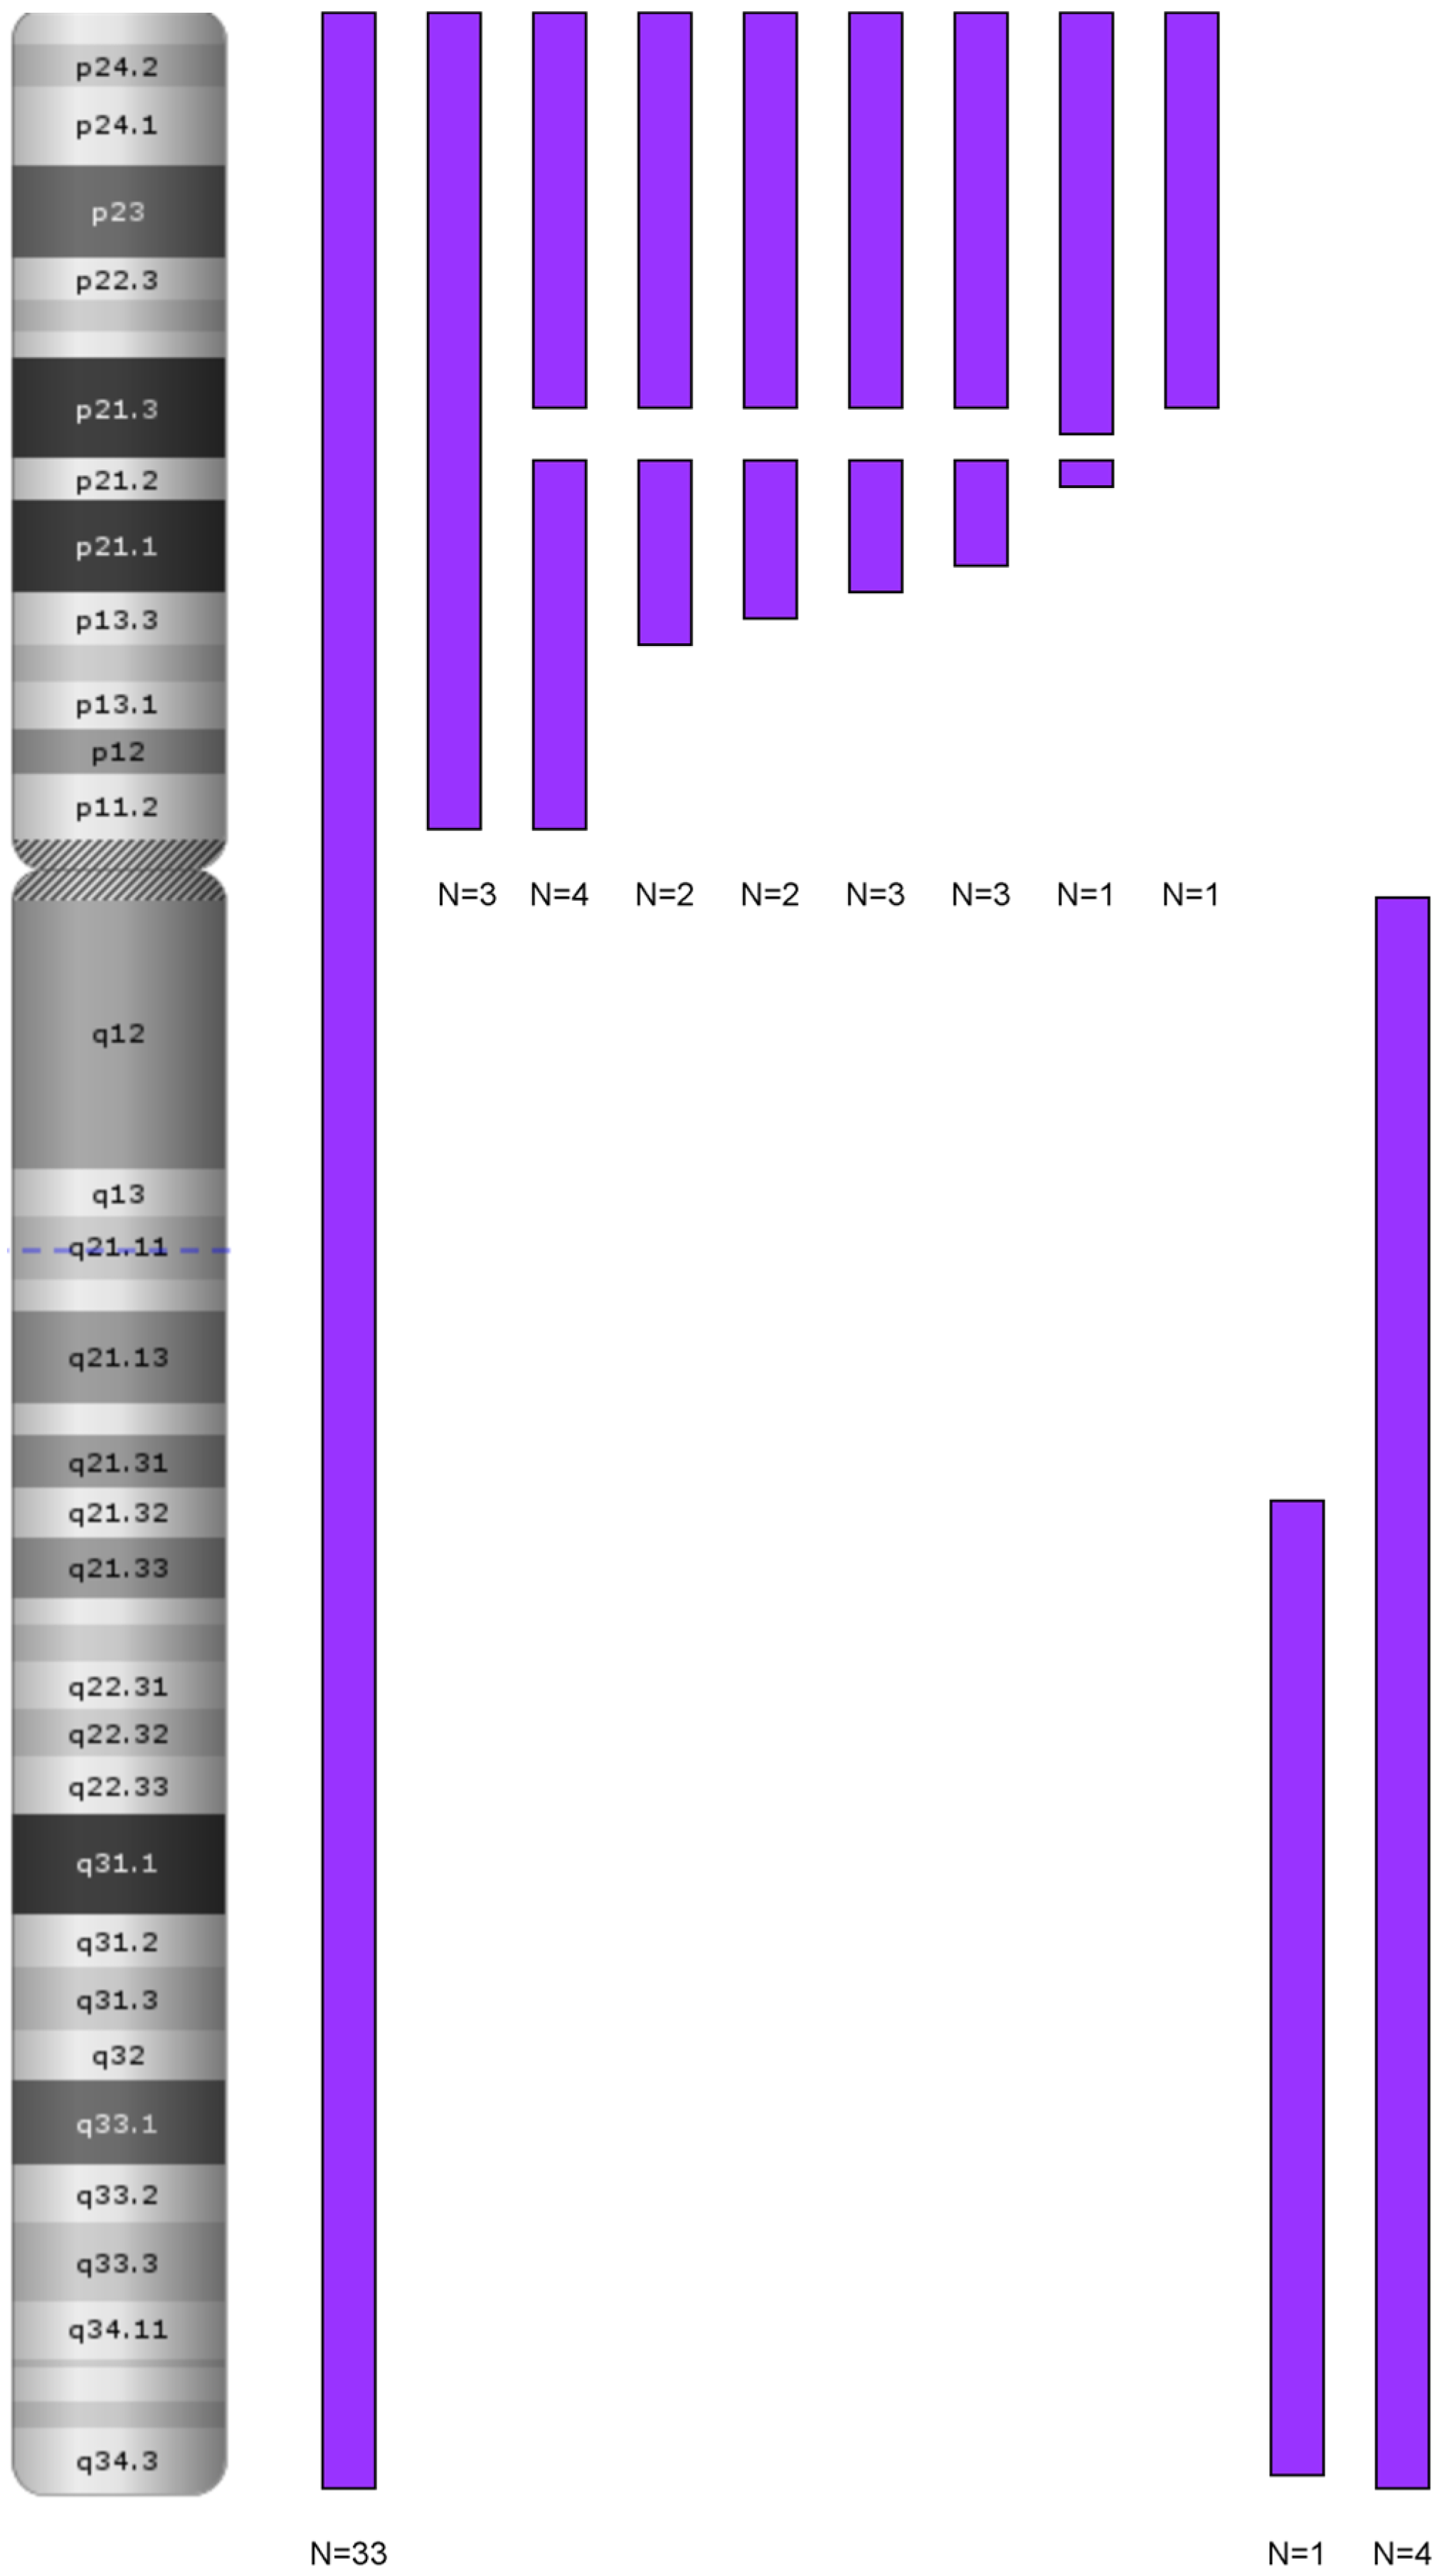
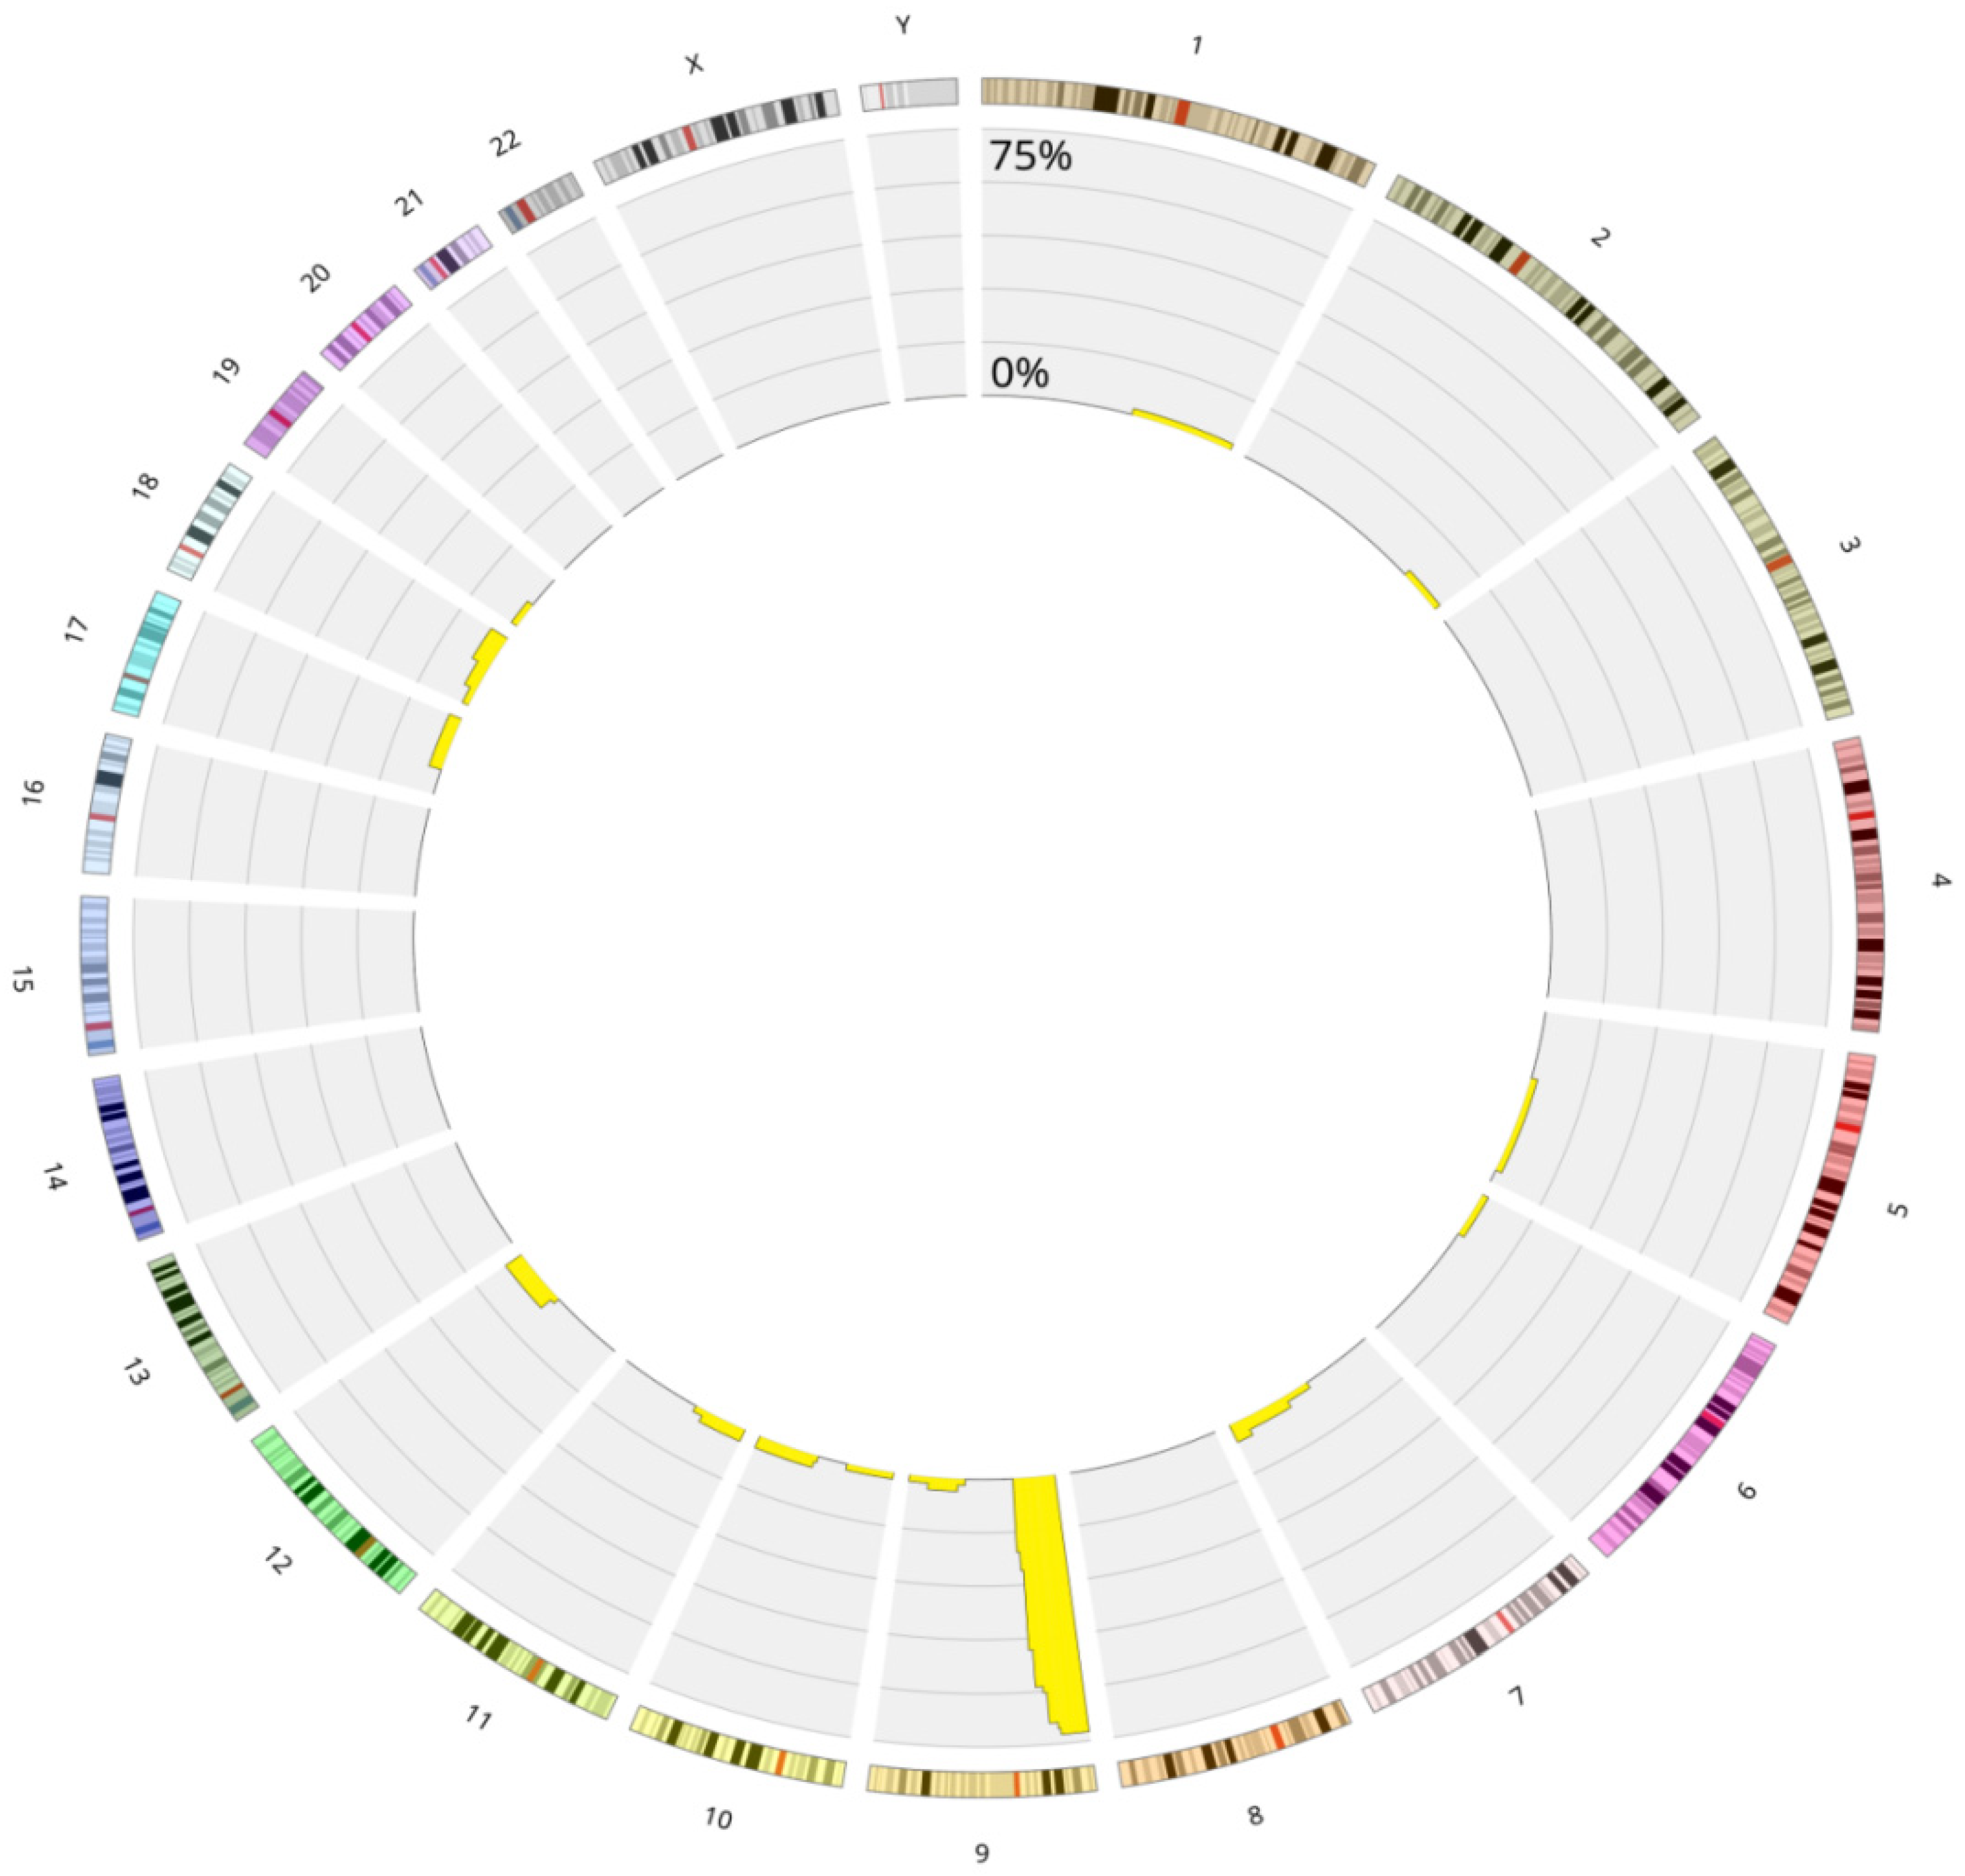
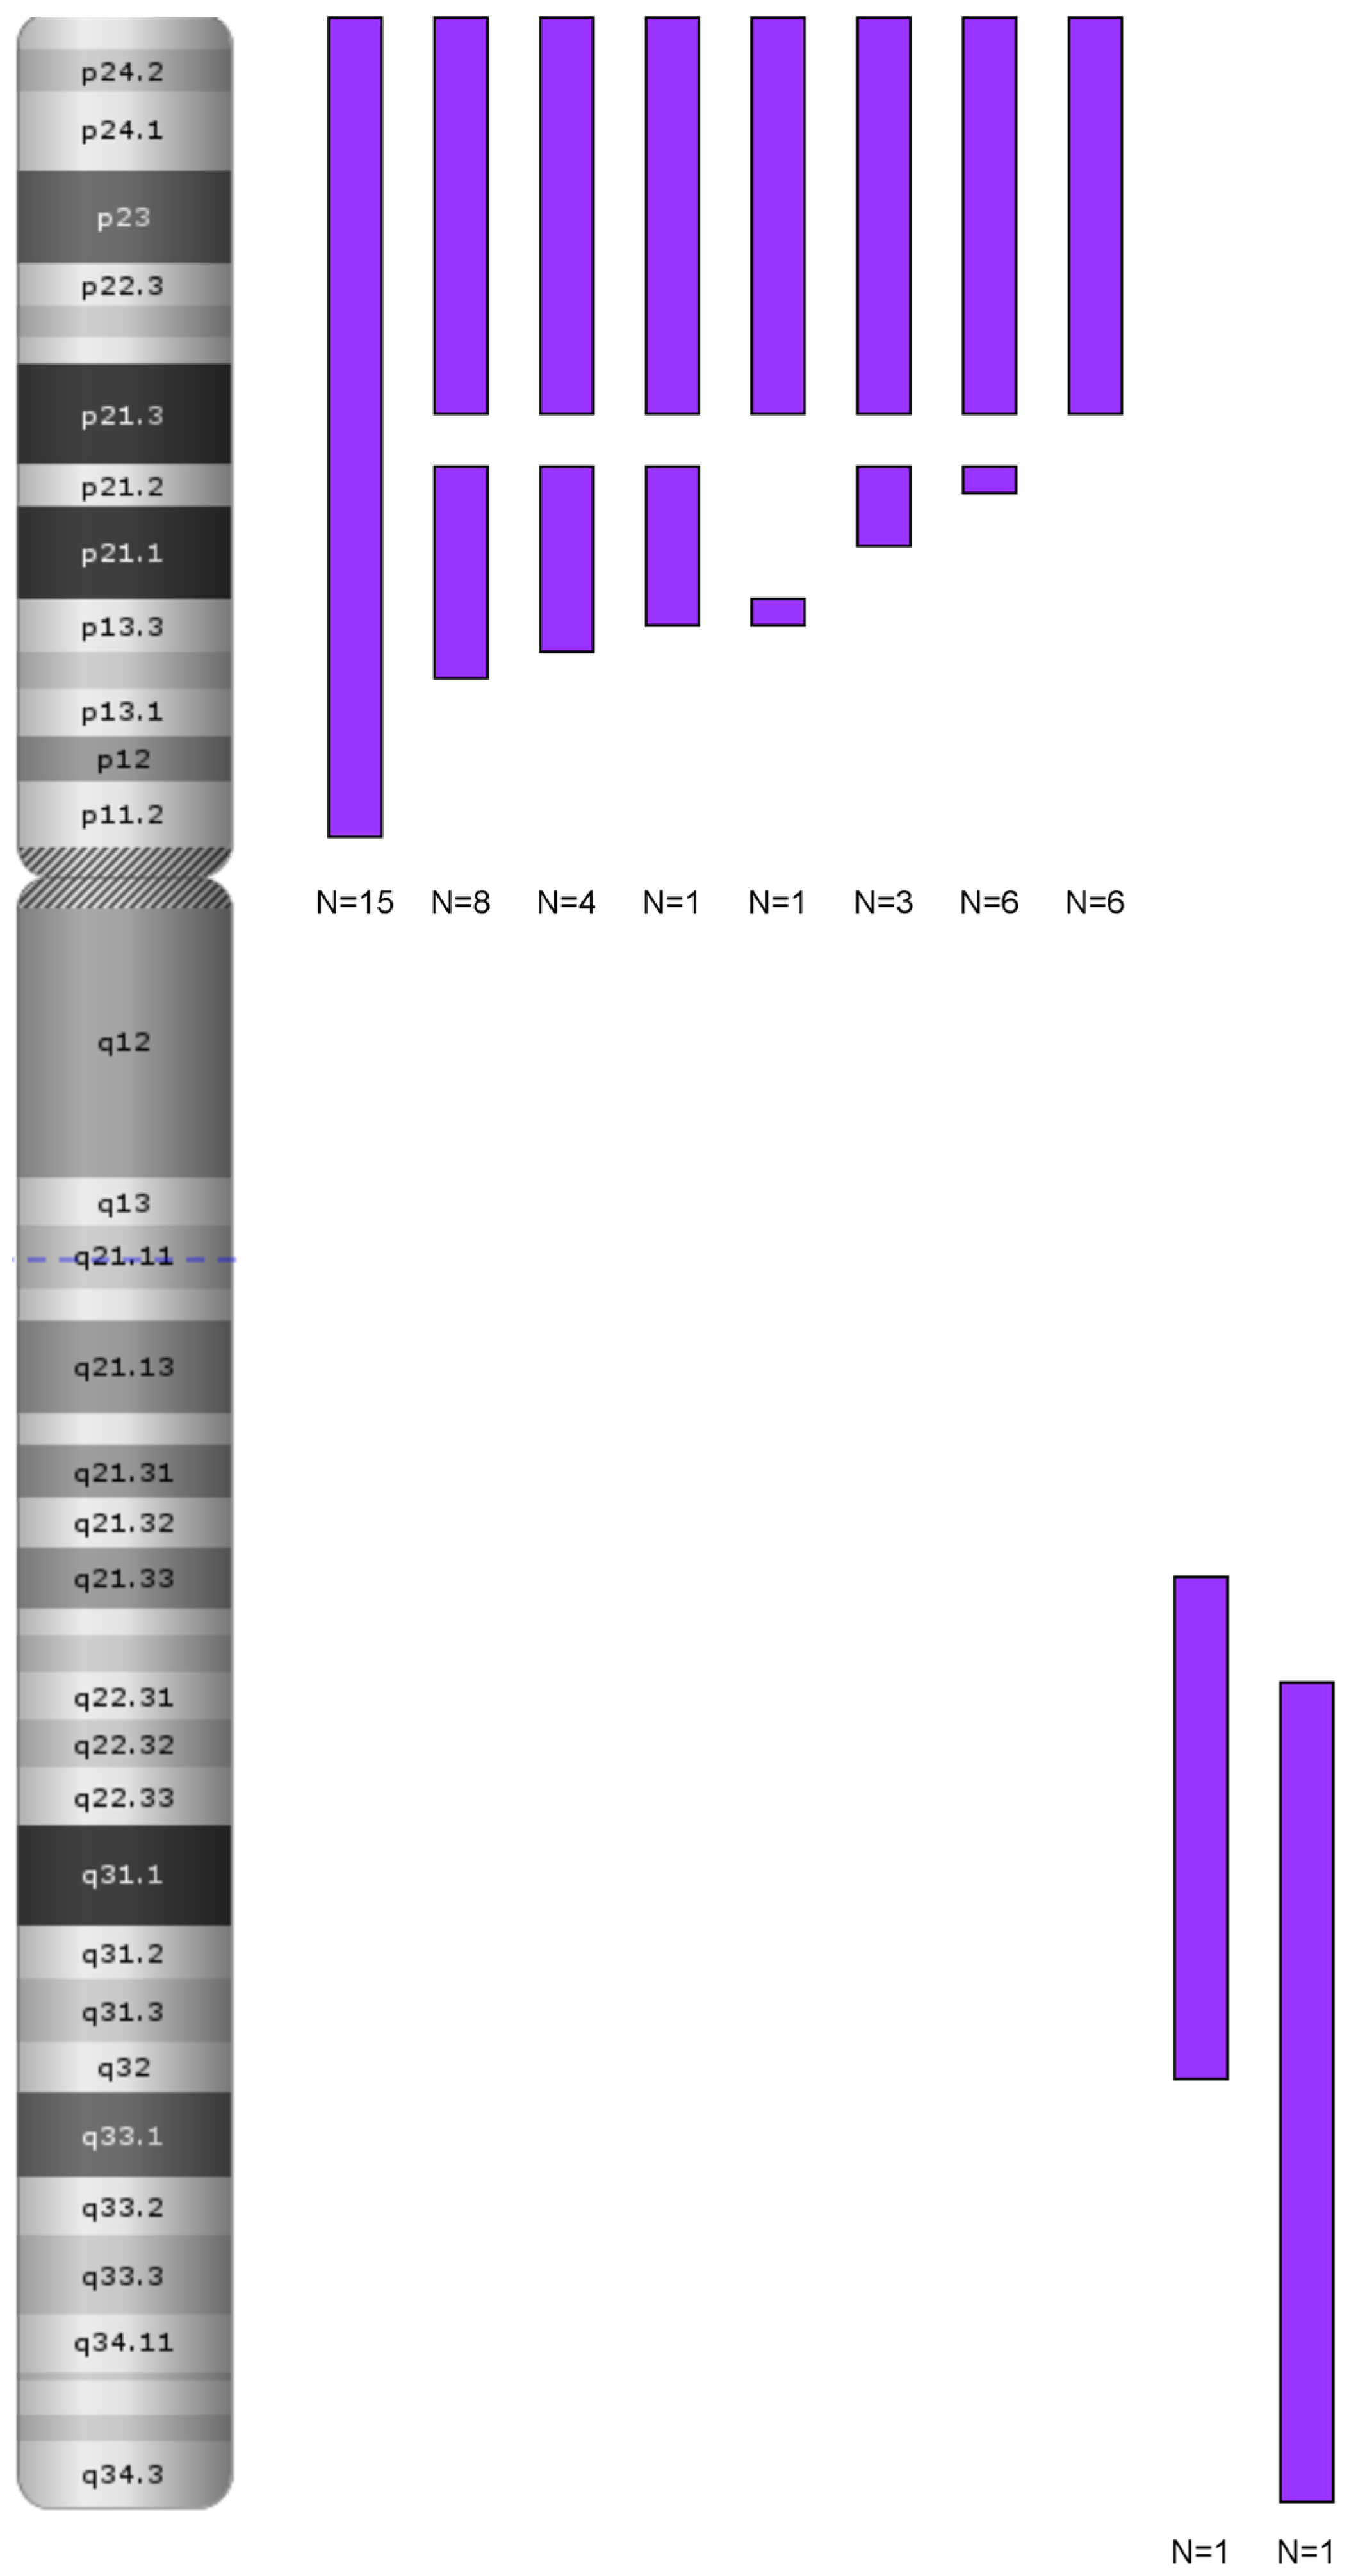
3.1. Genetics Characteristics of B-ALL with LOH
3.2. Clinical Characteristics of B-ALL with LOH
3.3. Genetic Characteristics of T-ALL with LOH
3.4. Clinical Characteristics of T-ALL Group
3.5. Chromothripsis
4. Discussion
4.1. B-ALL
4.1.1. LOH 9/9p and Deletion of CDKN2A/2B
LOH and Biallelic Deletion of CDKN2A
Role in Clonal Evolution of LOH on the Entire Chromosome 9
LOH in Other Chromosomal Regions: 6p and 12p/q
The Role of LOH 9p in the Pathogenesis of ALL
4.1.2. Clinical Implications of LOH 9/9p
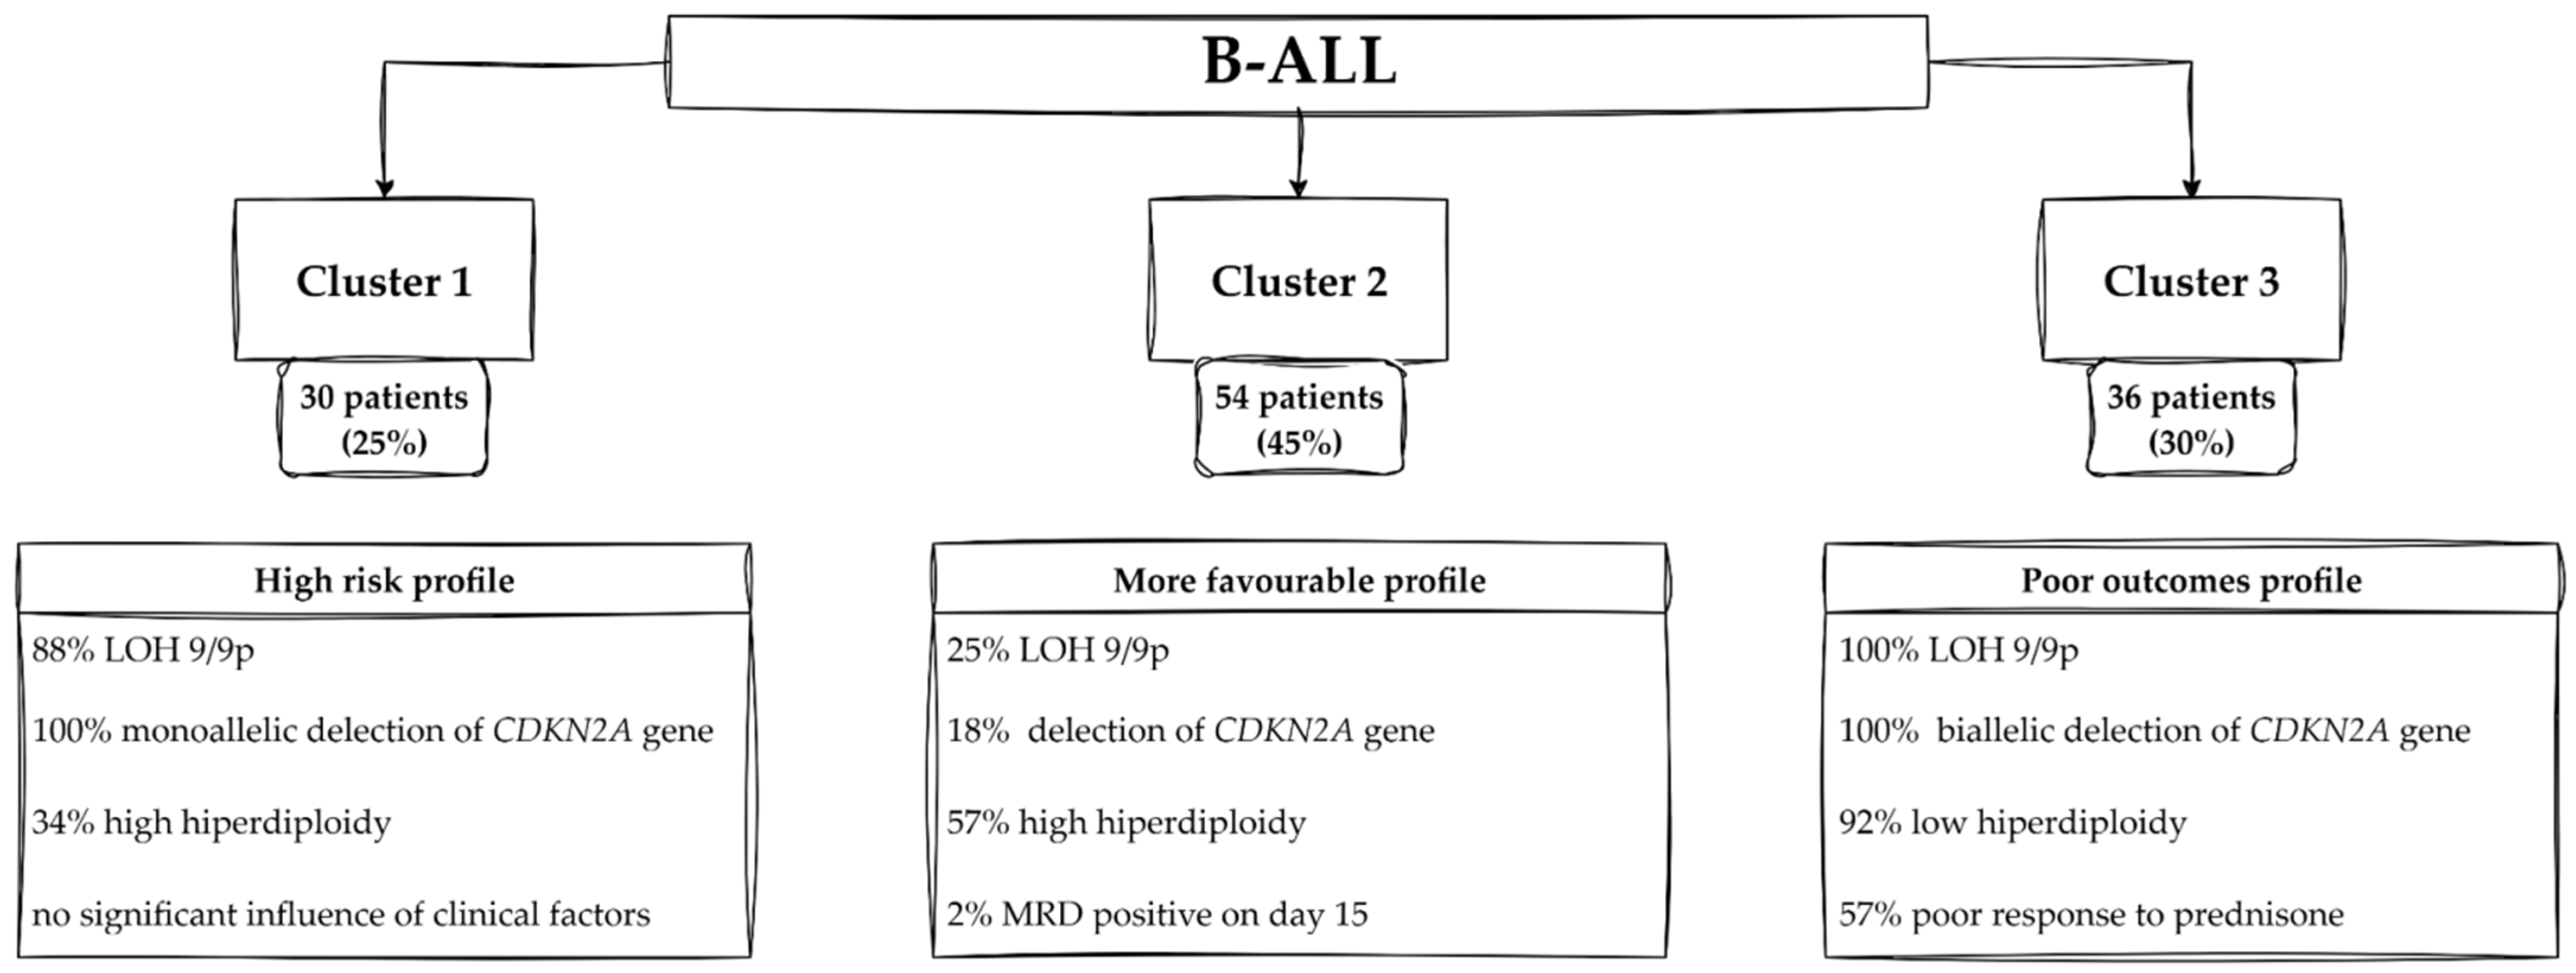
Profiles of Patients—Cluster 1
Profiles of Patients—Cluster 2
Profiles of Patients—Cluster 3
4.2. T-ALL
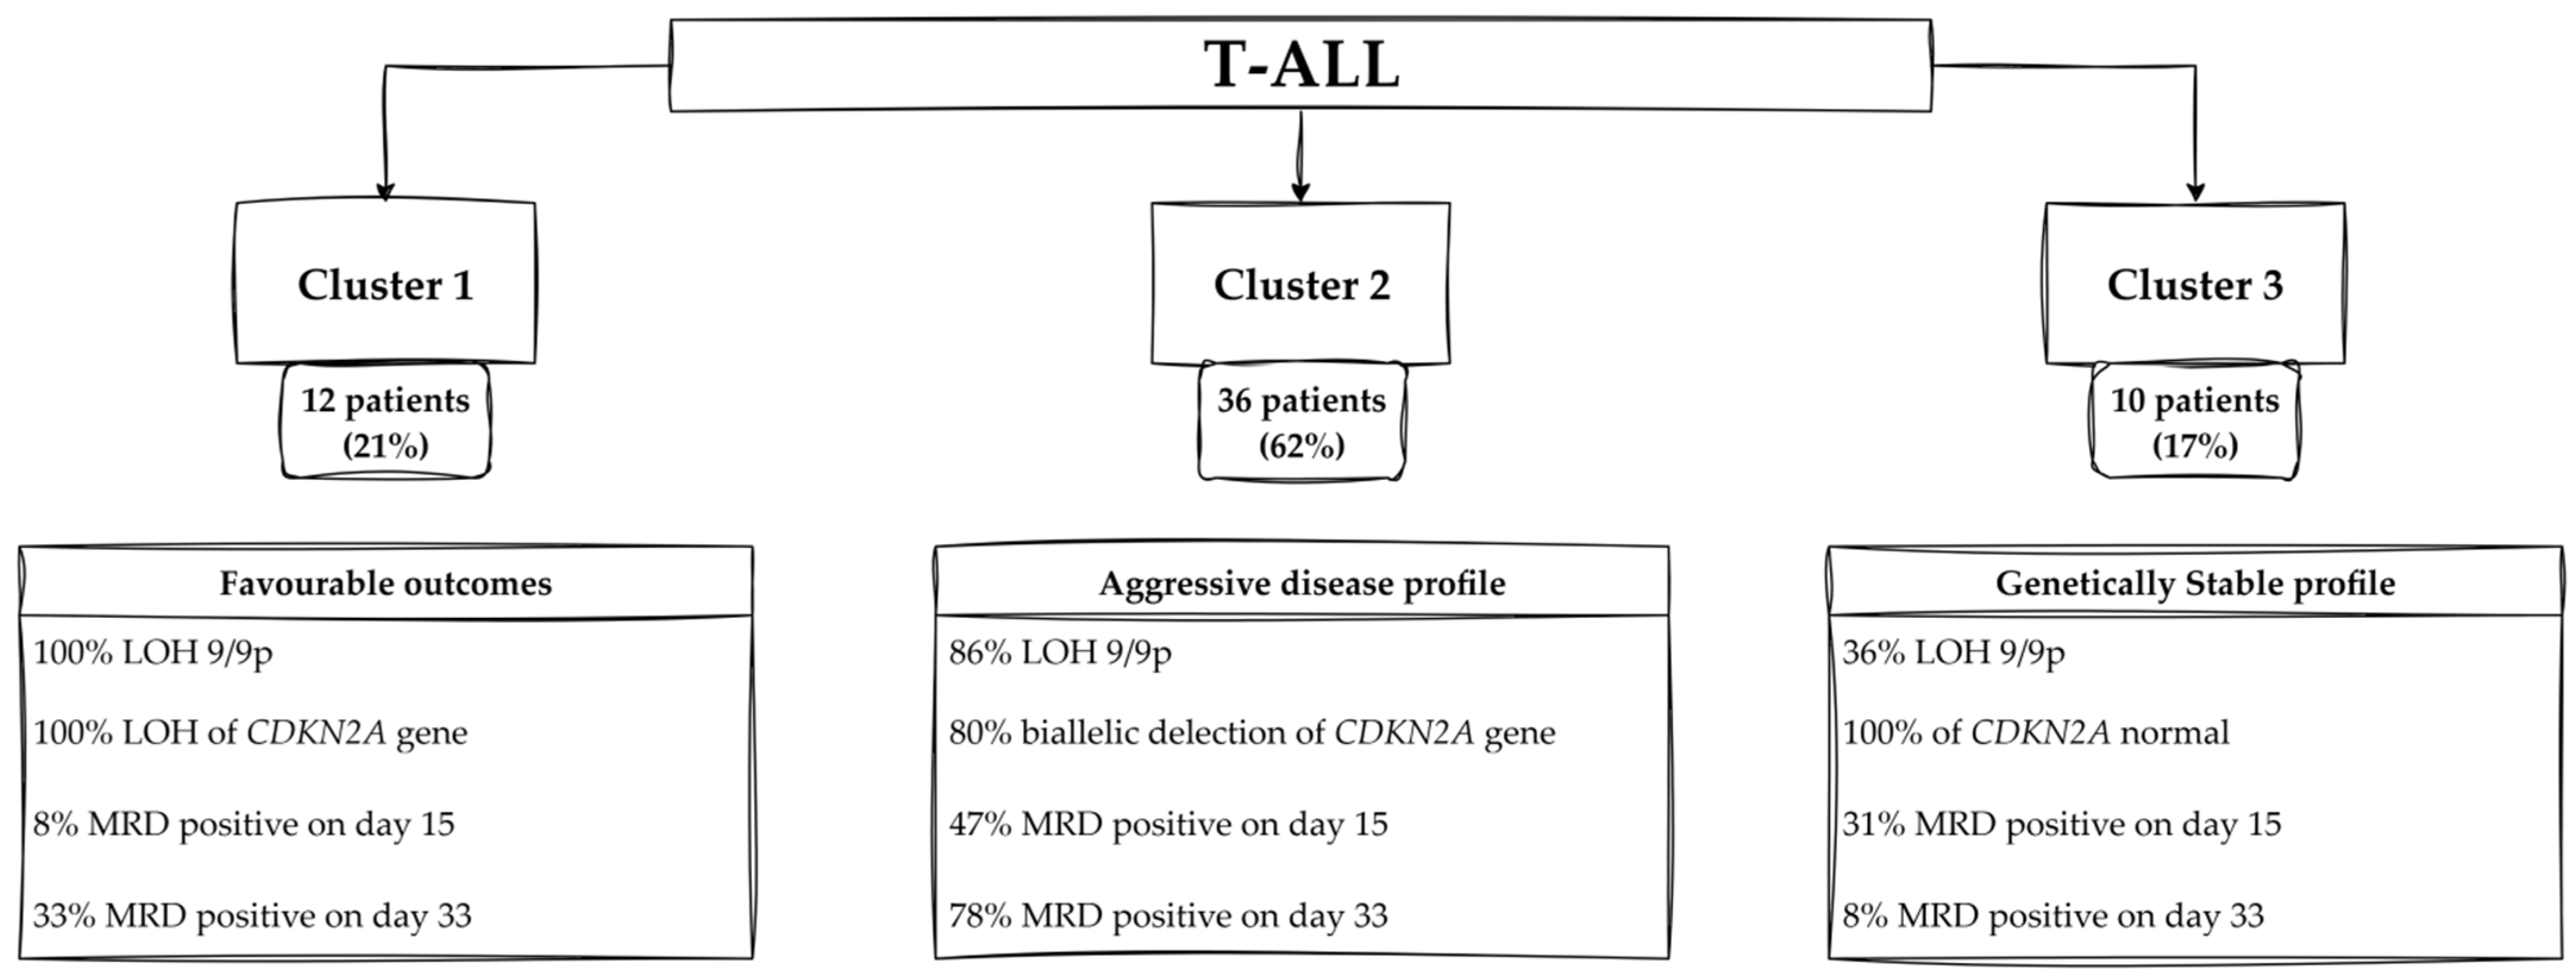
4.2.1. Profiles of Patients—Cluster 1
4.2.2. Profiles of Patients—Cluster 2
4.2.3. Profiles of Patients—Cluster 3
5. Conclusions
Supplementary Materials
Author Contributions
Funding
Institutional Review Board Statement
Informed Consent Statement
Data Availability Statement
Conflicts of Interest
Abbreviations
| ALL | acute lymphoblastic leukemia |
| B-ALL | B-cell acute lymphoblastic leukemia |
| T-ALL | T-cell acute lymphoblastic leukemia |
| LOH | loss of heterozygosity |
| CNL-LOH | loss of heterozygosity with copy number losses |
| CNN-LOH | copy number neutral loss of heterozygosity |
| DNA | deoxyribonucleic acid |
| FMC MRD | flow cytometry-minimal residual disease |
| MRD/PCR | minimal residual disease detected by polymerase chain reaction |
| SNP | single-nucleotide polymorphism |
| CNV | copy number variant |
| CNAs | copy numbers of altered regions |
| ChAS | Chromosome Analysis Suite |
| CN | copy number |
| kbp | kilobase pair |
| Mbp | megabase pair |
| BAF | biallelic frequency |
| p | short arm of a chromosome |
| q | long arm of a chromosome |
| MRD | minimal residual disease |
| WBC | white blood cells |
| NGS | next-generation sequencing |
References
- Puckett, Y.; Chan, O. Acute Lymphocytic Leukemia; StatPearls Publishing: Treasure Island, FL, USA, 2023. [Google Scholar]
- Rosenthal, A.; Rimsza, L. Genomics of aggressive B-cell lymphoma. Hematology 2018, 2018, 69–74. [Google Scholar] [CrossRef] [PubMed]
- Terwilliger, T.; Abdul-Hay, M. Acute lymphoblastic leukemia: A comprehensive review and 2017 update. Blood Cancer J. 2017, 7, e577. [Google Scholar] [CrossRef] [PubMed]
- Ninomiya, S.; Tyybäkinoja, A.; Borze, I.; Räty, R.; Saarinen-Pihkala, U.M.; Usvasalo, A.; Elonen, E.; Knuutila, S. Integrated analysis of gene copy number, copy neutral LOH, and microRNA profiles in adult acute lymphoblastic leukemia. Cytogenet. Genome Res. 2012, 136, 246–255. [Google Scholar] [CrossRef]
- Zhang, X.; Sjöblom, T. Targeting Loss of Heterozygosity: A Novel Paradigm for Cancer Therapy. Pharmaceuticals 2021, 14, 57. [Google Scholar] [CrossRef] [PubMed]
- Ryland, G.L.; Doyle, M.A.; Goode, D.; Boyle, S.E.; Choong, D.Y.; Rowley, S.M.; Li, J.; Australian Ovarian Cancer Study Group; Bowtell, D.D.; Tothill, R.W.; et al. Loss of heterozygosity: What is it good for? BMC Med. Genom. 2015, 8, 45. [Google Scholar] [CrossRef]
- Augustus, G.J.; Xicola, R.M.; Llor, X.; Ellis, N.A. Decreased copy-neutral loss of heterozygosity in African American colorectal cancers. Genes Chromosom. Cancer 2020, 59, 454–464. [Google Scholar] [CrossRef]
- Xicola, R.M.; Gagnon, M.; Clark, J.R.; Carroll, T.; Gao, W.; Fernandez, C.; Mijic, D.; Rawson, J.B.; Janoski, A.; Pusatcioglu, C.K.; et al. Excess of proximal microsatellite-stable colorectal cancer in African Americans from a multiethnic study. Clin. Cancer Res. 2014, 20, 4962–4970. [Google Scholar] [CrossRef]
- Takeuchi, S.; Tsukasaki, K.; Bartram, C.R.; Seriu, T.; Zimmermann, M.; Schrappe, M.; Takeuchi, N.; Park, S.; Taguchi, H.; Koeffler, H.P. Long-term study of the clinical significance of loss of heterozygosity in childhood acute lymphoblastic leukemia. Leukemia 2003, 17, 149–154. [Google Scholar] [CrossRef]
- Vrooman, L.M.; Blonquist, T.M.; Harris, M.H.; Stevenson, K.E.; Place, A.E.; Hunt, S.K.; O’Brien, J.E.; Asselin, B.L.; Athale, U.H.; Clavell, L.A.; et al. Refining risk classification in childhood B acute lymphoblastic leukemia: Results of DFCI ALL Consortium Protocol 05-001. Blood Adv. 2018, 2, 1449–1458. [Google Scholar] [CrossRef]
- Harrison, C.J. The detection and significance of chromosomal abnormalities in childhood acute lymphoblastic leukaemia. Blood Rev. 2001, 15, 49–59. [Google Scholar] [CrossRef]
- Moorman, A.V.; Ensor, H.M.; Richards, S.M.; Chilton, L.; Schwab, C.; Kinsey, S.E.; Vora, A.; Mitchell, C.D.; Harrison, C.J. Prognostic effect of chromosomal abnormalities in childhood B-cell precursor acute lymphoblastic leukaemia: Results from the UK Medical Research Council ALL97/99 randomised trial. Lancet Oncol. 2010, 11, 429–438. [Google Scholar] [CrossRef]
- Döhner, H.; Stilgenbauer, S.; Benner, A.; Leupolt, E.; Kröber, A.; Bullinger, L.; Döhner, K.; Bentz, M.; Lichter, P. Genomic aberrations and survival in chronic lymphocytic leukemia. N. Engl. J. Med. 2000, 343, 1910–1916. [Google Scholar] [CrossRef]
- Lejman, M.; Włodarczyk, M.; Styka, B.; Pastorczak, A.; Zawitkowska, J.; Taha, J.; Sędek, Ł.; Skonieczka, K.; Braun, M.; Haus, O.; et al. Advantages and Limitations of SNP Array in the Molecular Characterization of Pediatric T-Cell Acute Lymphoblastic Leukemia. Front. Oncol. 2020, 10, 1184. [Google Scholar] [CrossRef] [PubMed]
- A Randomized Trial of the I-BFM-SG for the Management of Childhood—B Acute Lymphoblastic Leukemia. 2009. Available online: http://www.bialaczka.org/wp-content/uploads/2016/10/ALLIC_BFM_2009.pdf (accessed on 28 July 2025).
- Treatment Protocol for Children and Adolescents with Acute Lymphoblastic Leukemia—AIEOP-BFM ALL. 2017. Available online: https://clinicaltrials.gov/ct2/show/NCT03643276 (accessed on 28 July 2025).
- Xu, X.; Bryke, C.; Sukhanova, M.; Huxley, E.; Dash, D.P.; Dixon-Mciver, A.; Fang, M.; Griepp, P.T.; Hodge, J.C.; Iqbal, A.; et al. Assessing copy number abnormalities and copy-neutral loss-of-heterozygosity across the genome as best practice in diagnostic evaluation of acute myeloid leukemia: An evidence-based review from the cancer genomics consortium (CGC) myeloid neoplasms working group. Cancer Genet. 2018, 228–229, 218–235. [Google Scholar] [CrossRef] [PubMed]
- Jerez, A.; Sugimoto, Y.; Makishima, H.; Verma, A.; Jankowska, A.M.; Przychodzen, B.; Visconte, V.; Tiu, R.V.; O’Keefe, C.L.; Mohamedali, A.M.; et al. Loss of heterozygosity in 7q myeloid disorders: Clinical associations and genomic pathogenesis. Blood 2012, 119, 6109–6117. [Google Scholar] [CrossRef] [PubMed] [PubMed Central]
- Chambon-Pautas, C.; Cavé, H.; Gérard, B.; Guidal-Giroux, C.; Duval, M.; Vilmer, E.; Grandchamp, B. High-resolution allelotype analysis of childhood B-lineage acute lymphoblastic leukemia. Leukemia 1998, 12, 1107–1113. [Google Scholar] [CrossRef]
- Baccichet, A.; Qualman, S.K.; Sinnett, D. Allelic loss in childhood acute lymphoblastic leukemia. Leuk. Res. 1997, 21, 817–823. [Google Scholar] [CrossRef]
- Risinskaya, N.; Gladysheva, M.; Abdulpatakhov, A.; Chabaeva, Y.; Surimova, V.; Aleshina, O.; Yushkova, A.; Dubova, O.; Kapranov, N.; Galtseva, I.; et al. DNA Copy Number Alterations and Copy Neutral Loss of Heterozygosity in Adult Ph-Negative Acute B-Lymphoblastic Leukemia: Focus on the Genes Involved. Int. J. Mol. Sci. 2023, 24, 17602. [Google Scholar] [CrossRef]
- Gourmel, A.; Perrault, H.; Colaiacovo, M.L.; Chabaeva, Y.; Surimova, V.; Aleshina, O.; Yushkova, A.; Dubova, O.; Kapranov, N.; Galtseva, I.; et al. The impact of comparative genomic hybridization/single-nucleotide polymorphism microarray in risk stratification of pediatric acute lymphoblastic leukemia. Pediatr. Blood Cancer 2024, 71, e31129. [Google Scholar] [CrossRef]
- Ampatzidou, M.; Papadhimitriou, S.I.; Paisiou, A.; Paterakis, G.; Tzanoudaki, M.; Papadakis, V.; Florentin, L.; Polychronopoulou, S. The Prognostic Effect of CDKN2A/2B Gene Deletions in Pediatric Acute Lymphoblastic Leukemia (ALL): Independent Prognostic Significance in BFM-Based Protocols. Diagnostics 2023, 13, 1589. [Google Scholar] [CrossRef]
- Shi, X.; Li, P.; Hu, R.; Han, W.; Gao, S. Pretransplant HLA mistyping in diagnostic sample of a T-ALL patient due to loss of heterozygosity in the major histocompatibility complex. Transpl. Immunol. 2021, 69, 101463. [Google Scholar] [CrossRef]
- Cavé, H.; Gérard, B.; Martin, E.; Guidal, C.; Devaux, I.; Weissenbach, J.; Elion, J.; Vilmer, E.; Grandchamp, B. Loss of heterozygosity in the chromosomal region 12p12-13 is very common in childhood acute lymphoblastic leukemia and permits the precise localization of a tumor-suppressor gene distinct from p27KIP1. Blood 1995, 86, 3869–3875. [Google Scholar] [CrossRef]
- Risinskaya, N.; Kozhevnikova, Y.; Gavrilina, O.; Chabaeva, J.; Kotova, E.; Yushkova, A.; Isinova, G.; Zarubina, K.; Obukhova, T.; Kulikov, S.; et al. Loss of Heterozygosity in the Tumor DNA of De Novo Diagnosed Patients Is Associated with Poor Outcome for B-ALL but Not for T-ALL. Genes 2022, 13, 398. [Google Scholar] [CrossRef]
- Sinclair, P.B.; Ryan, S.; Bashton, M.; Hollern, S.; Hanna, R.; Case, M.; Schwalbe, E.C.; Schwab, C.J.; Cranston, R.E.; Young, B.D.; et al. SH2B3 inactivation through CN-LOH 12q is uniquely associated with B-cell precursor ALL with iAMP21 or other chromosome 21 gain. Leukemia 2019, 33, 1881–1894. [Google Scholar] [CrossRef] [PubMed]
- Sulong, S.; Moorman, A.V.; Irving, J.A.; Hollern, S.; Hanna, R.; Case, M.; Schwalbe, E.C.; Schwab, C.J.; Cranston, R.E.; Young, B.D.; et al. A comprehensive analysis of the CDKN2A gene in childhood acute lymphoblastic leukemia reveals genomic deletion, copy number neutral loss of heterozygosity, and association with specific cytogenetic subgroups. Blood 2009, 113, 100–107. [Google Scholar] [CrossRef] [PubMed]
- Sandmann, S.; Te Vrugt, M.; Randau, G.; Beder, T.; Neumann, M.; Alfer, A.; Eckert, C.; Möricke, A.; Horns, J.; Brüggemann, M.; et al. Recurrent molecular variants, clonal evolution and clinical relevance in T-cell lymphoblastic neoplasia comparing lymphoma and leukemia samples derived from children and adults. Blood 2024, 144 (Suppl. S1), 2832. [Google Scholar] [CrossRef]
- Mullighan, C.G.; Goorha, S.; Radtke, I.; Miller, C.B.; Coustan-Smith, E.; Dalton, J.D.; Girtman, K.; Mathew, S.; Ma, J.; Pounds, S.B.; et al. Genome-wide analysis of genetic alterations in acute lymphoblastic leukaemia. Nature 2007, 446, 758–764. [Google Scholar] [CrossRef]
- Vijayakrishnan, J.; Henrion, M.; Moorman, A.V.; Fiege, B.; Kumar, R.; Filho, M.; Holroyd, A.; Koehler, R.; Thomsen, H.; Irving, J.A.; et al. The 9p21.3 risk of childhood acute lymphoblastic leukaemia is explained by a rare high-impact variant in CDKN2A. Sci. Rep. 2015, 5, 15065. [Google Scholar] [CrossRef]
- Pui, C.H.; Yang, J.J.; Hunger, S.P.; Pieters, R.; Schrappe, M.; Biondi, A.; Vora, A.; Baruchel, A.; Silverman, L.B.; Schmiegelow, K.; et al. Childhood Acute Lymphoblastic Leukemia: Progress Through Collaboration. J. Clin. Oncol. 2015, 33, 2938–2948. [Google Scholar] [CrossRef]
- Schwab, C.J.; Chilton, L.; Morrison, H.; Jones, L.; Al-Shehhi, H.; Erhorn, A.; Russell, L.J.; Moorman, A.V.; Harrison, C.J. Genes commonly deleted in childhood B-cell precursor acute lymphoblastic leukemia: Association with cytogenetics and clinical features. Haematologica 2013, 98, 1081–1088. [Google Scholar] [CrossRef]
- Zhang, W.; Kuang, P.; Liu, T. Prognostic significance of CDKN2A/B deletions in acute lymphoblastic leukaemia: A meta-analysis. Ann. Med. 2019, 51, 28–40. [Google Scholar] [CrossRef]
- Wang, H.P.; Zhou, Y.L.; Huang, X.; Zhang, Y.; Qian, J.J.; Li, J.H.; Li, X.Y.; Li, C.Y.; Lou, Y.J.; Mai, W.Y.; et al. CDKN2A deletions are associated with poor outcomes in 101 adults with T-cell acute lymphoblastic leukemia. Am. J. Hematol. 2020, 96, 312–319. [Google Scholar] [CrossRef]
- Patel, A.A.; Thomas, J.; Rojek, A.E.; Stock, W. Biology and Treatment Paradigms in T Cell Acute Lymphoblastic Leukemia in Older Adolescents and Adults. Curr. Treat. Options Oncol. 2020, 21, 57. [Google Scholar] [CrossRef]
- González-Gil, C.; Ribera, J.; Ribera, J.M.; Genescà, E. The Yin and Yang-Like Clinical Implications of the CDKN2A/ARF/CDKN2B Gene Cluster in Acute Lymphoblastic Leukemia. Genes 2021, 12, 79. [Google Scholar] [CrossRef]

| Characteristic | B-ALL (N = 120) | T-ALL (N = 58) |
|---|---|---|
| n (%) | n (%) | |
| Age, years | 5.39 (3.38, 9.23) a | 10.33 (4.90, 13.94) a |
| Gender: | ||
| female | 59 (49.17%) | 24 (41.38%) |
| male | 61 (50.83%) | 34 (58.62%) |
| WBC [×103/μL] | 7.04 (3.69, 25.00) a | 117.86 (43.93, 247.06) a |
| BM, % | 91.00 (84.50, 95.38) a | 90.00 (80.00, 94.95) a |
| Response to prednisone: | ||
| good | 90 (75.00%) | 36 (62.07%) |
| poor | 30 (25.00%) | 22 (37.93%) |
| MRD FMC 15 day: | ||
| <0.1% | 40 (33.33%) | 11 (18.97%) |
| 0.1–10% | 69 (57.50%) | 21 (36.21%) |
| ≥10% | 11 (9.17%) | 26 (44.83%) |
| MRD/PCR 33 day: | ||
| negative | 48 (40.00%) | 9 (15.52%) |
| positive | 72 (60.00%) | 37 (63.79%) |
| other (no marker) | 12 (20.69%) |
| LOH 9/9p | N | n (%) |
|---|---|---|
| No evidence of LOH | 63 | 52.5% |
| Patients with 9p LOH extending to 9p13 | 6 | 5% |
| LOH 9 | 33 | 27.5% |
| LOH 9p | 3 | 2.5% |
| LOH 9q | 5 | 4.2% |
| Patients with interrupted 9p LOH | 10 | 8.3% |
| CDKN2A | N | n (%) |
| del monoallelic | 24 | 20% |
| del biallelic | 19 | 15.8% |
| duplication | 14 | 11.7% |
| LOH | 24 | 20% |
| No alterations | 39 | 32.5% |
| LOH 9/9p | N | n (%) |
|---|---|---|
| No evidence of LOH | 14 | 24% |
| Patients with 9p LOH extending to 9p13 | 6 | 10% |
| LOH 9 | 0 | 0% |
| LOH 9p | 15 | 26% |
| Patients with interrupted 9p LOH | 23 | 40% |
| CDKN2A | N | n (%) |
| del monoallelic | 12 | 21% |
| del biallelic | 35 | 60% |
| LOH | 3 | 5% |
| No alterations | 8 | 14% |
Disclaimer/Publisher’s Note: The statements, opinions and data contained in all publications are solely those of the individual author(s) and contributor(s) and not of MDPI and/or the editor(s). MDPI and/or the editor(s) disclaim responsibility for any injury to people or property resulting from any ideas, methods, instructions or products referred to in the content. |
© 2025 by the authors. Licensee MDPI, Basel, Switzerland. This article is an open access article distributed under the terms and conditions of the Creative Commons Attribution (CC BY) license (https://creativecommons.org/licenses/by/4.0/).
Share and Cite
Styka, B.; Ręka, G.; Ozygała, A.; Janiszewska, M.; Stelmach, M.; Skowera, P.; Urbańska, Z.; Lejman, M. Loss of Heterozygosity in Pediatric Acute Lymphoblastic Leukemia and Its Prognostic Impact: A Retrospective Study. Cancers 2025, 17, 2500. https://doi.org/10.3390/cancers17152500
Styka B, Ręka G, Ozygała A, Janiszewska M, Stelmach M, Skowera P, Urbańska Z, Lejman M. Loss of Heterozygosity in Pediatric Acute Lymphoblastic Leukemia and Its Prognostic Impact: A Retrospective Study. Cancers. 2025; 17(15):2500. https://doi.org/10.3390/cancers17152500
Chicago/Turabian StyleStyka, Borys, Gabriela Ręka, Aleksandra Ozygała, Mariola Janiszewska, Magdalena Stelmach, Paulina Skowera, Zuzanna Urbańska, and Monika Lejman. 2025. "Loss of Heterozygosity in Pediatric Acute Lymphoblastic Leukemia and Its Prognostic Impact: A Retrospective Study" Cancers 17, no. 15: 2500. https://doi.org/10.3390/cancers17152500
APA StyleStyka, B., Ręka, G., Ozygała, A., Janiszewska, M., Stelmach, M., Skowera, P., Urbańska, Z., & Lejman, M. (2025). Loss of Heterozygosity in Pediatric Acute Lymphoblastic Leukemia and Its Prognostic Impact: A Retrospective Study. Cancers, 17(15), 2500. https://doi.org/10.3390/cancers17152500