
Histological Image Classification Between Follicular Lymphoma and Reactive Lymphoid Tissue Using Deep Learning and Explainable Artificial Intelligence (XAI)

 , , ,
, , ,
Simple Summary
Abstract
1. Introduction
- The major question that confronts a pathologist when evaluating a lymph node biopsy is whether the process is benign or malignant, and the differential diagnosis between follicular lymphoma and reactive lymphoid tissue can be challenging.
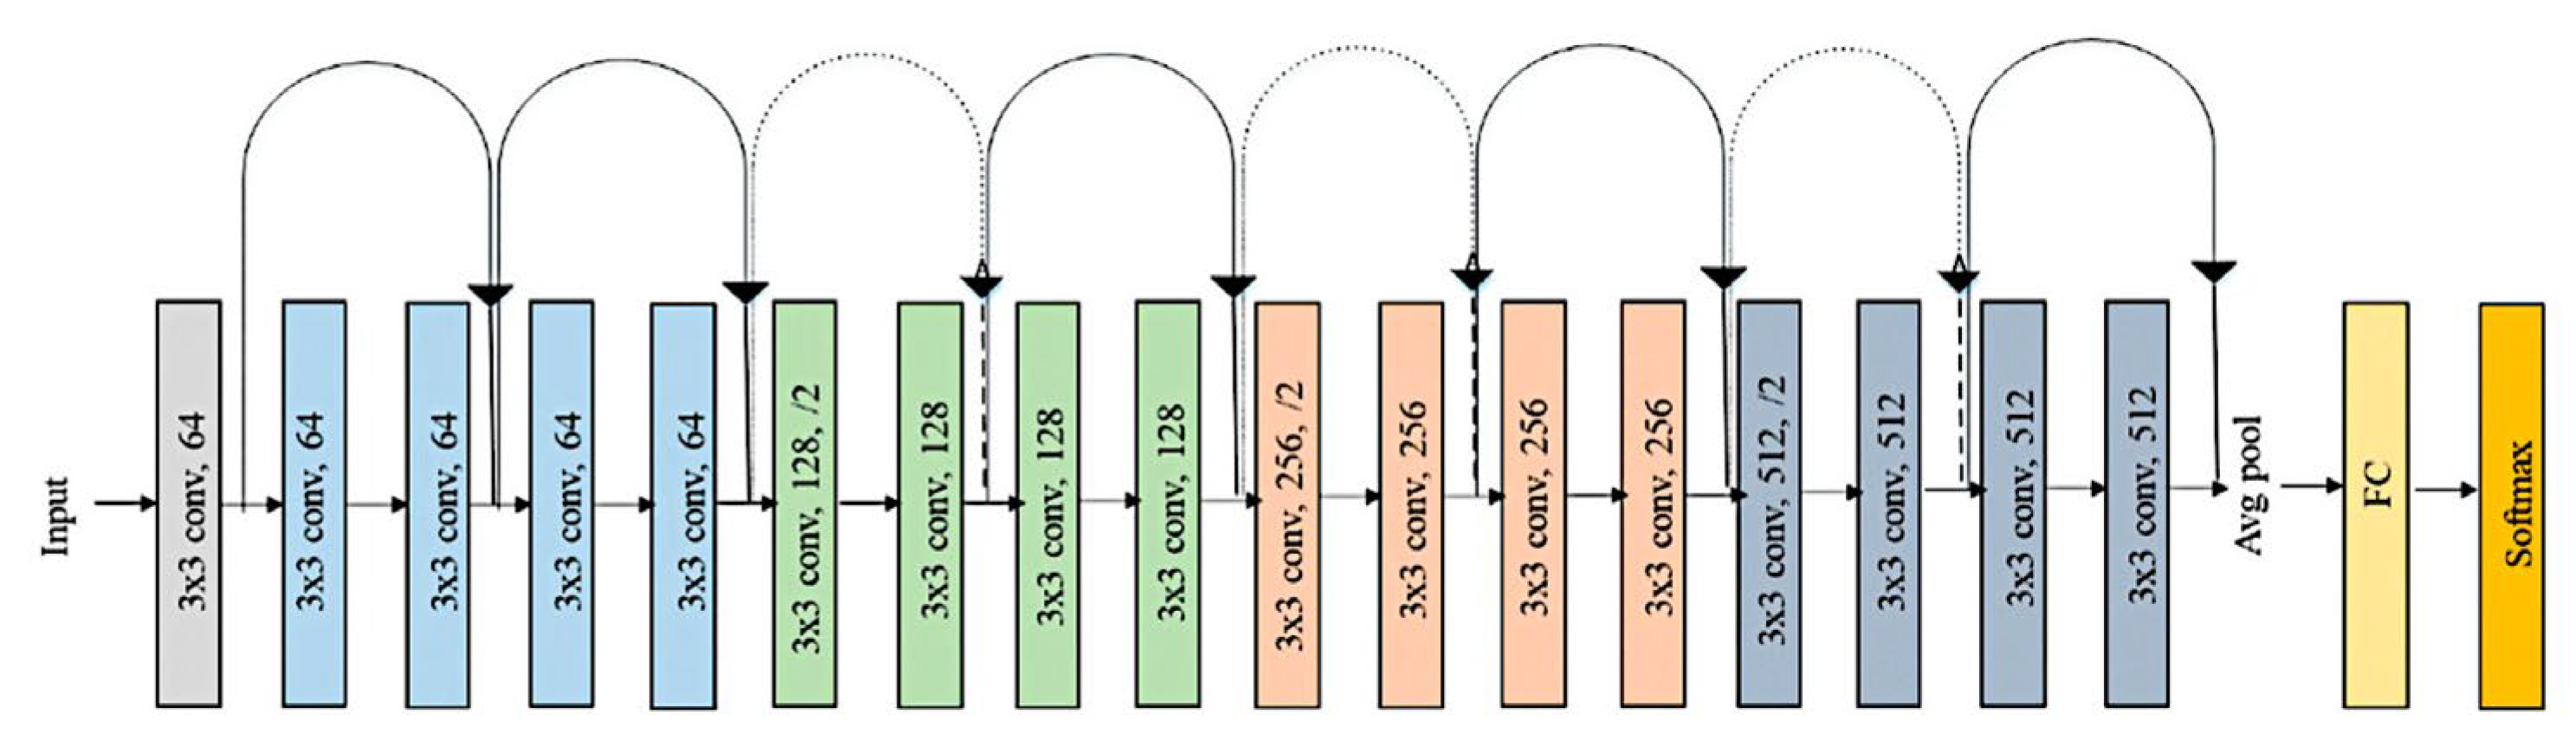
- A convolutional neural network based on ResNet-18 architecture was trained to classify H&E histological images of FL and reactive lymphoid tissue, and the model achieved high performance.
- This study has practical implications. In the future, the model can be used as a pretrained network for transfer learning to classify other types of lymphoma.
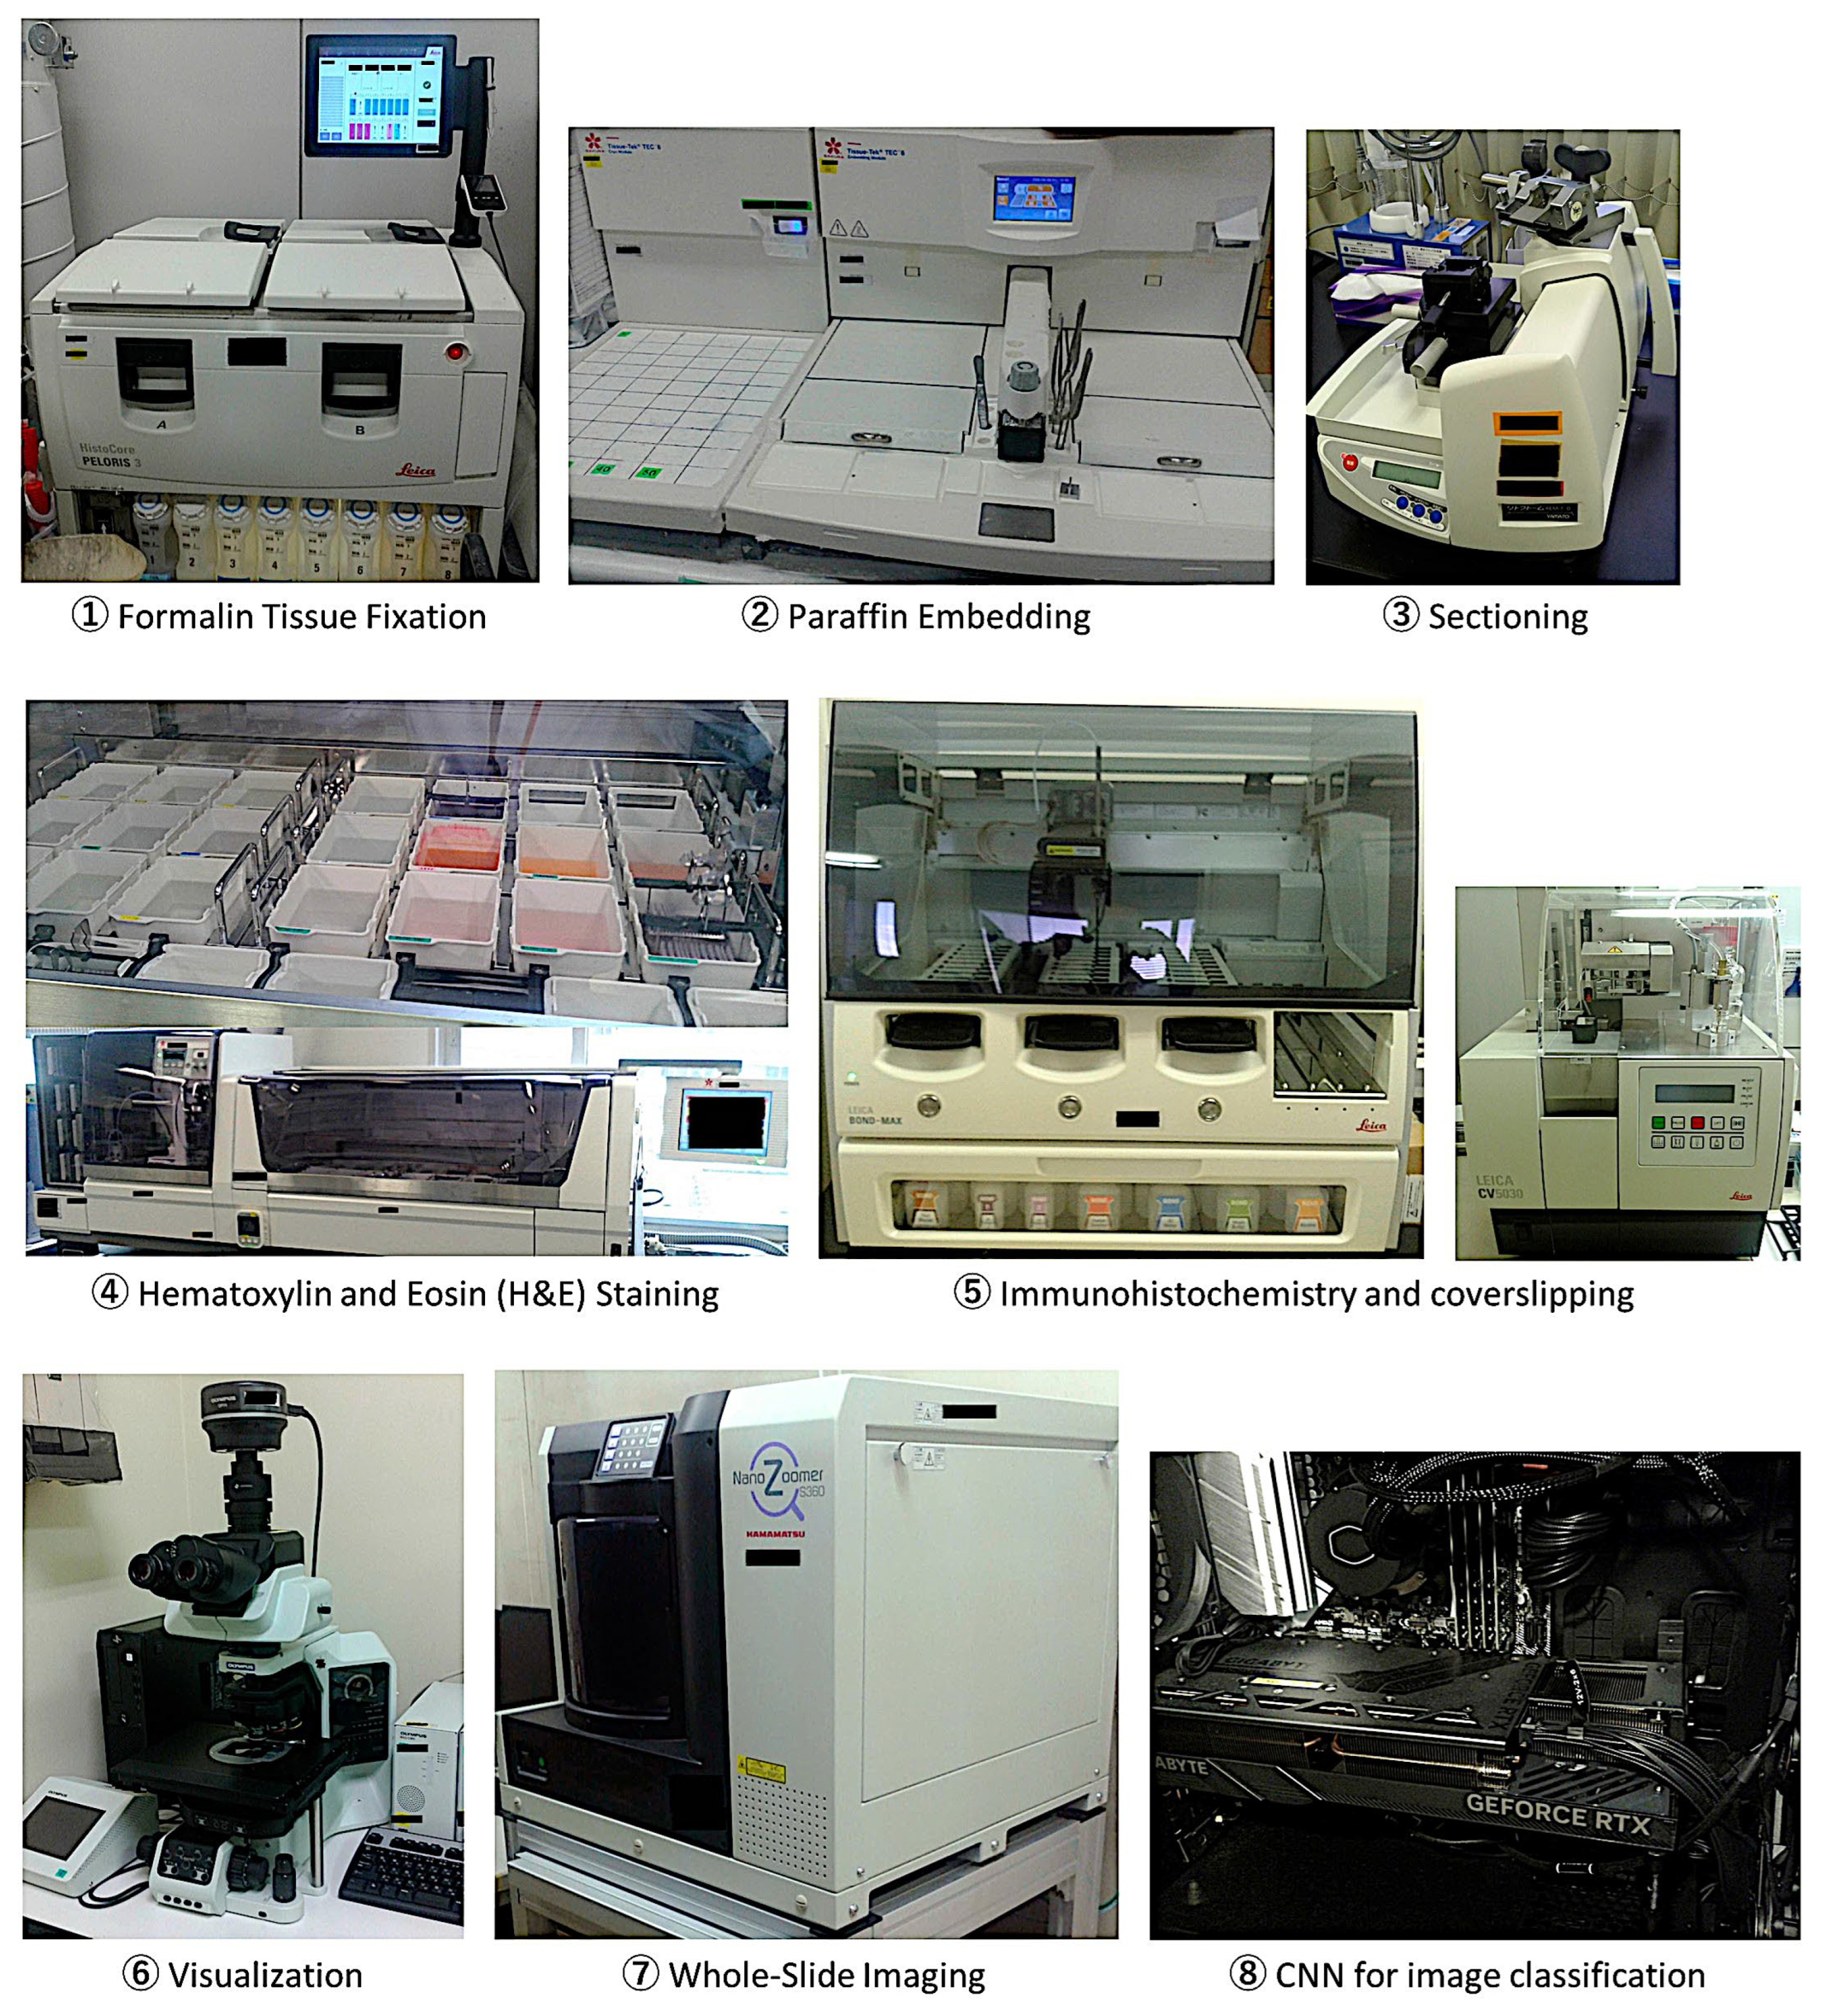
2. Materials and Methods
2.1. Samples
2.2. Deep Learning


| Training Parameters | |
|---|---|
| Solver | Sgdm |
| Initial learning rate | 0.001 |
| MiniBatch Size | 128 |
| MaxEpochs | 5 |
| Validation frequency | 50 |
| Solver momentum | 0.9 |
| Learn Rate | |
| LearnRateSchedule | None |
| LearnRateDropFactor | 0.1 |
| LearnRateDropPeriod | 10 |
| Normalization and Regularization | |
| L2Regularization | 0.0001 |
| ResetinputNormalization | yes |
| BatchNormalizationStatistics | Population |
| Mini-batch suffle | Every-epoch |
| Validation and Output | |
| ValidationPatience | Inf |
| OutputNetwork | Last-iteration |
| Gradient Clipping | |
| GradientThresholdMethod | I2norm |
| GradientThreshold | Inf |
| Hardware execution environment | Auto |
| Checkpoint | |
| CheckpointPath | - |
| CheckpointFrequency | 1 |
| CheckpointFrequencyUnit | Auto |
| CNN Design | Data Partitioning | |||
|---|---|---|---|---|
| Set 1 | Set 2 | |||
| ResNet-based | Training set (70%) | Validation set (10%) | Testing set 1 (20%) | Testing set 2 (100%) |
| Input: images | Patch-based analysis | Patch-based analysis | Patch-based analysis | Case-based analysis |
| Output: classification | 919,153 patches | 131,308 patches | 262,615 patches | 190,880 patches |
| Number of layers: 71 | 2 classes | 2 classes | 2 classes | 2 classes |
| Num. of connections: 78 | FL: 642,398 | FL: 91,772 | FL: 183,699 | FL: 10 cases (82,263 patches) |
| Augmentation: none | Reactive: 276,755 | Reactive: 39,536 | Reactive: 78,916 | Reactive: 10 cases (108,617 patches) |
| Strategy: transfer learning from ResNet-18 | Solver: sgdm Initial learning rate: 0.001 MiniBatchSize: 128 MaxEpochs: 5 Validation frequency: 50 | Classification Score calculation Confusion chart Performance | Classification Diagnostic % | |
3. Results
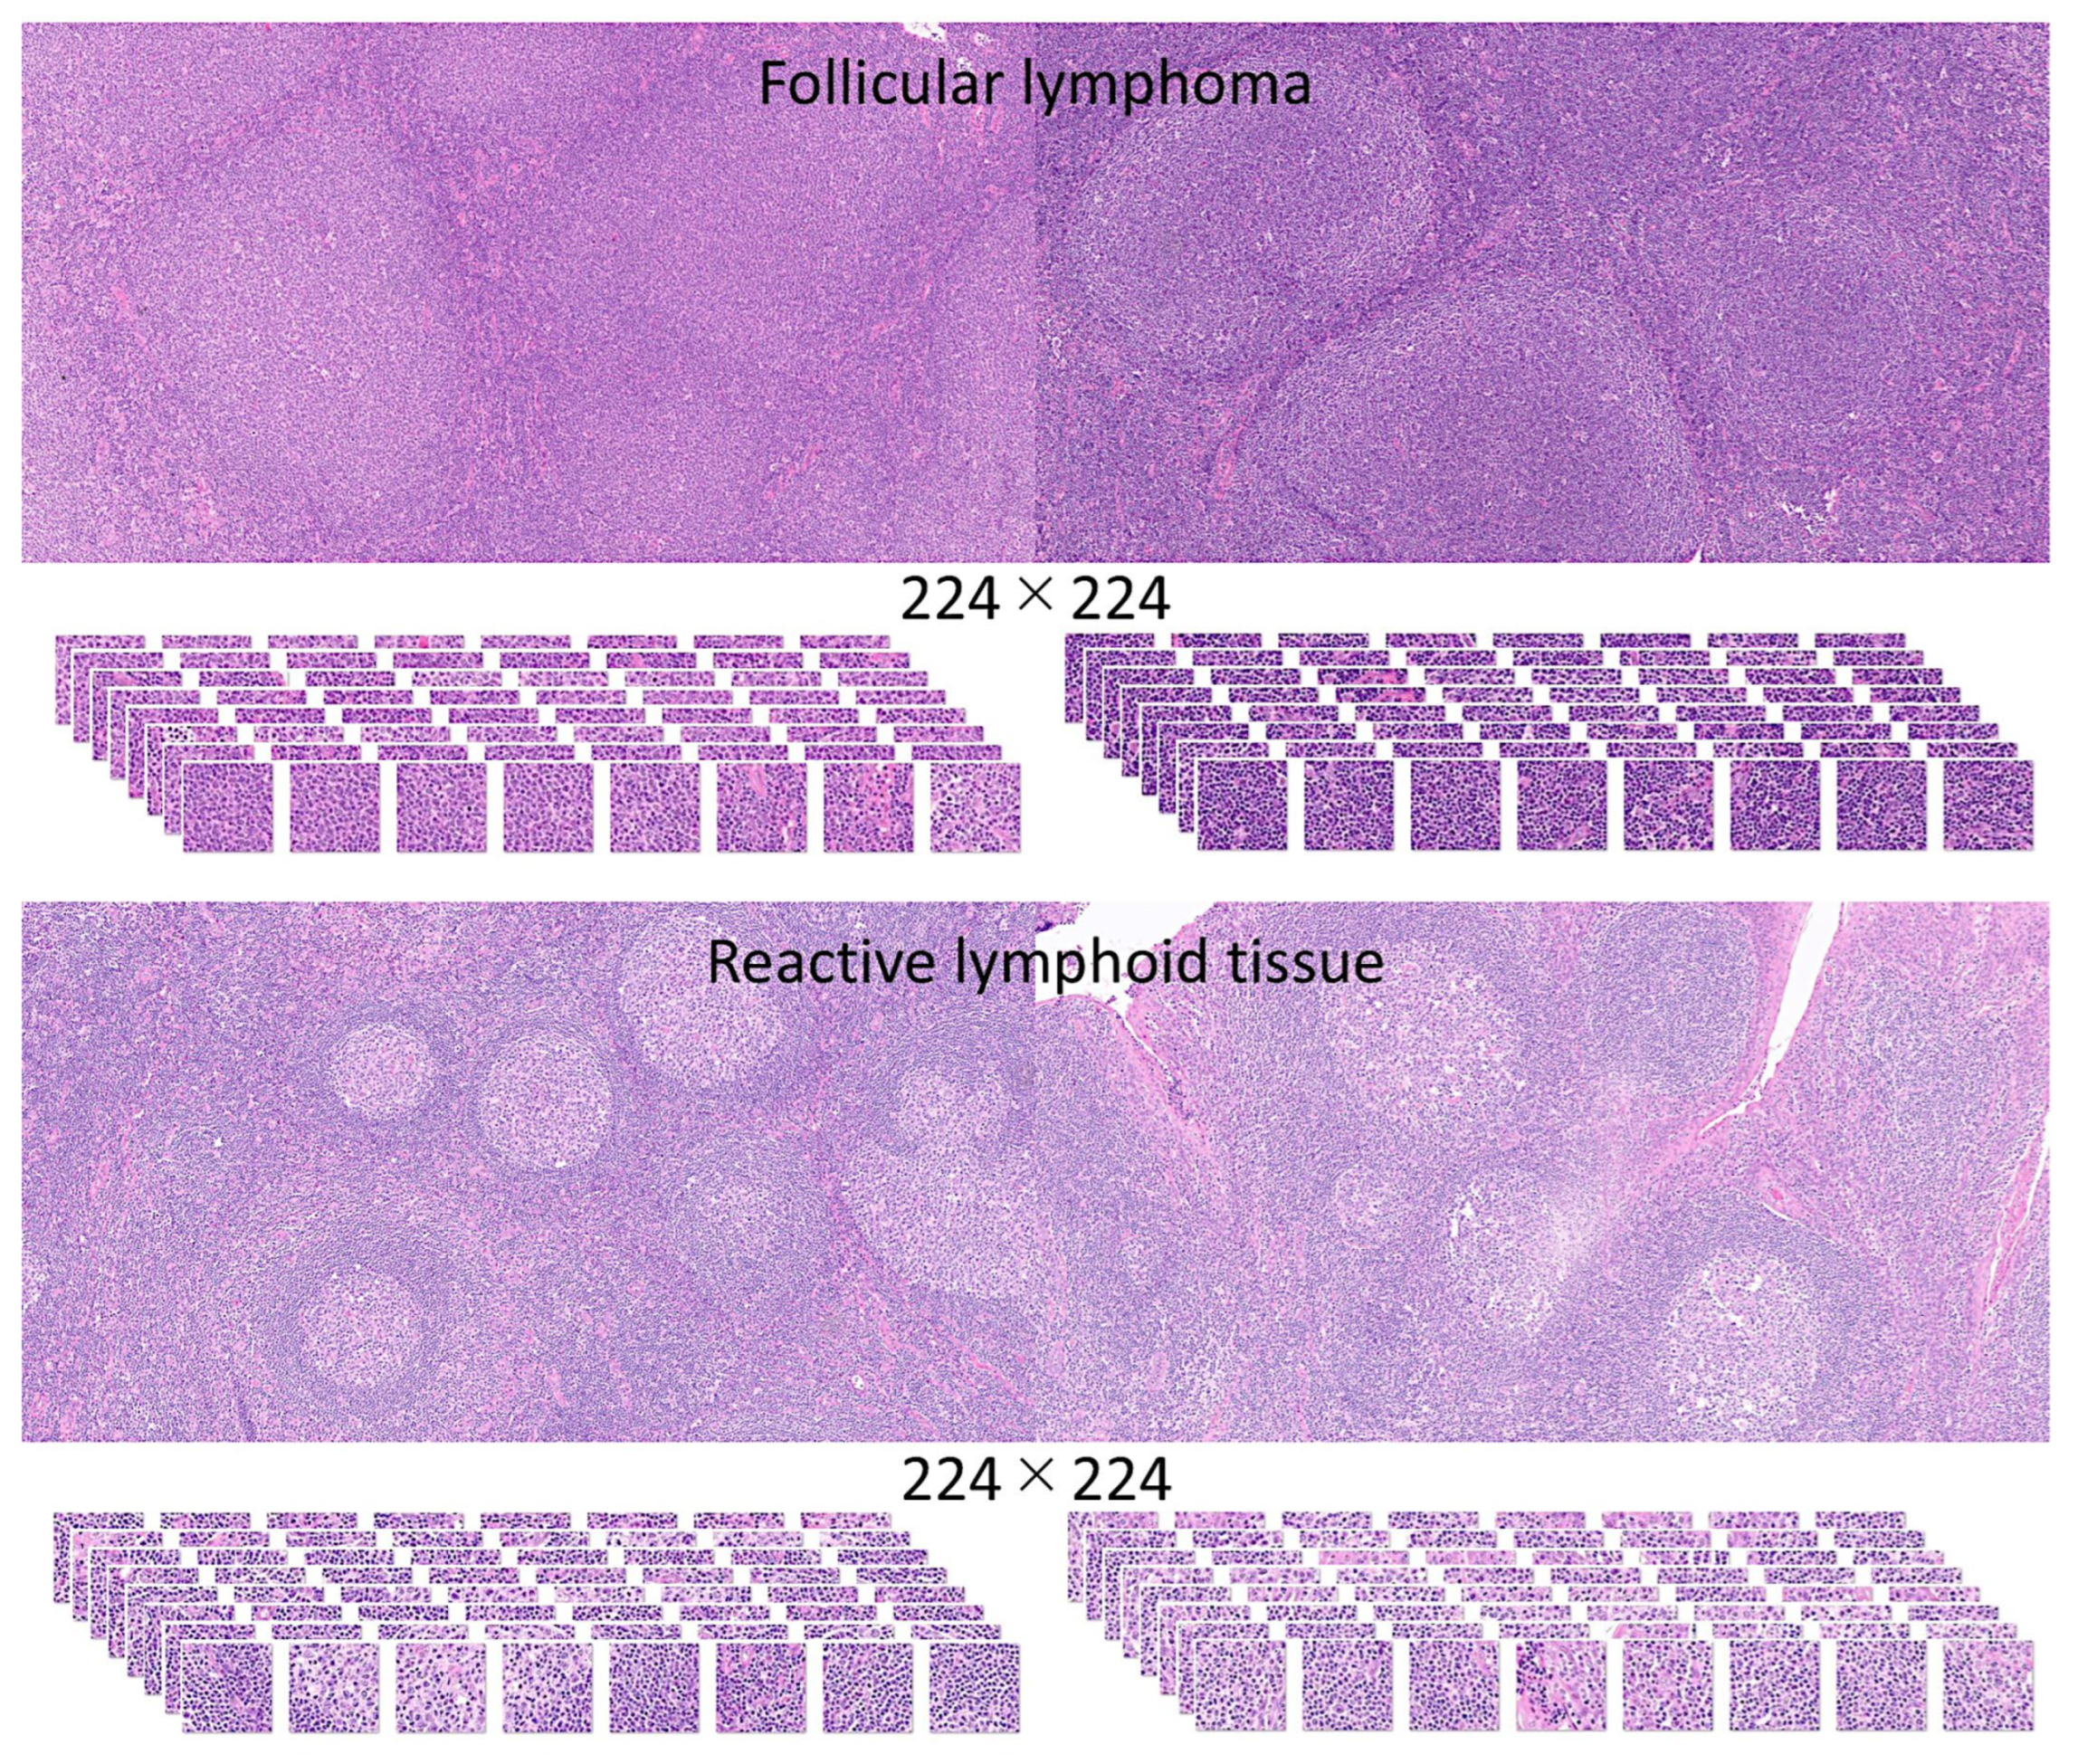
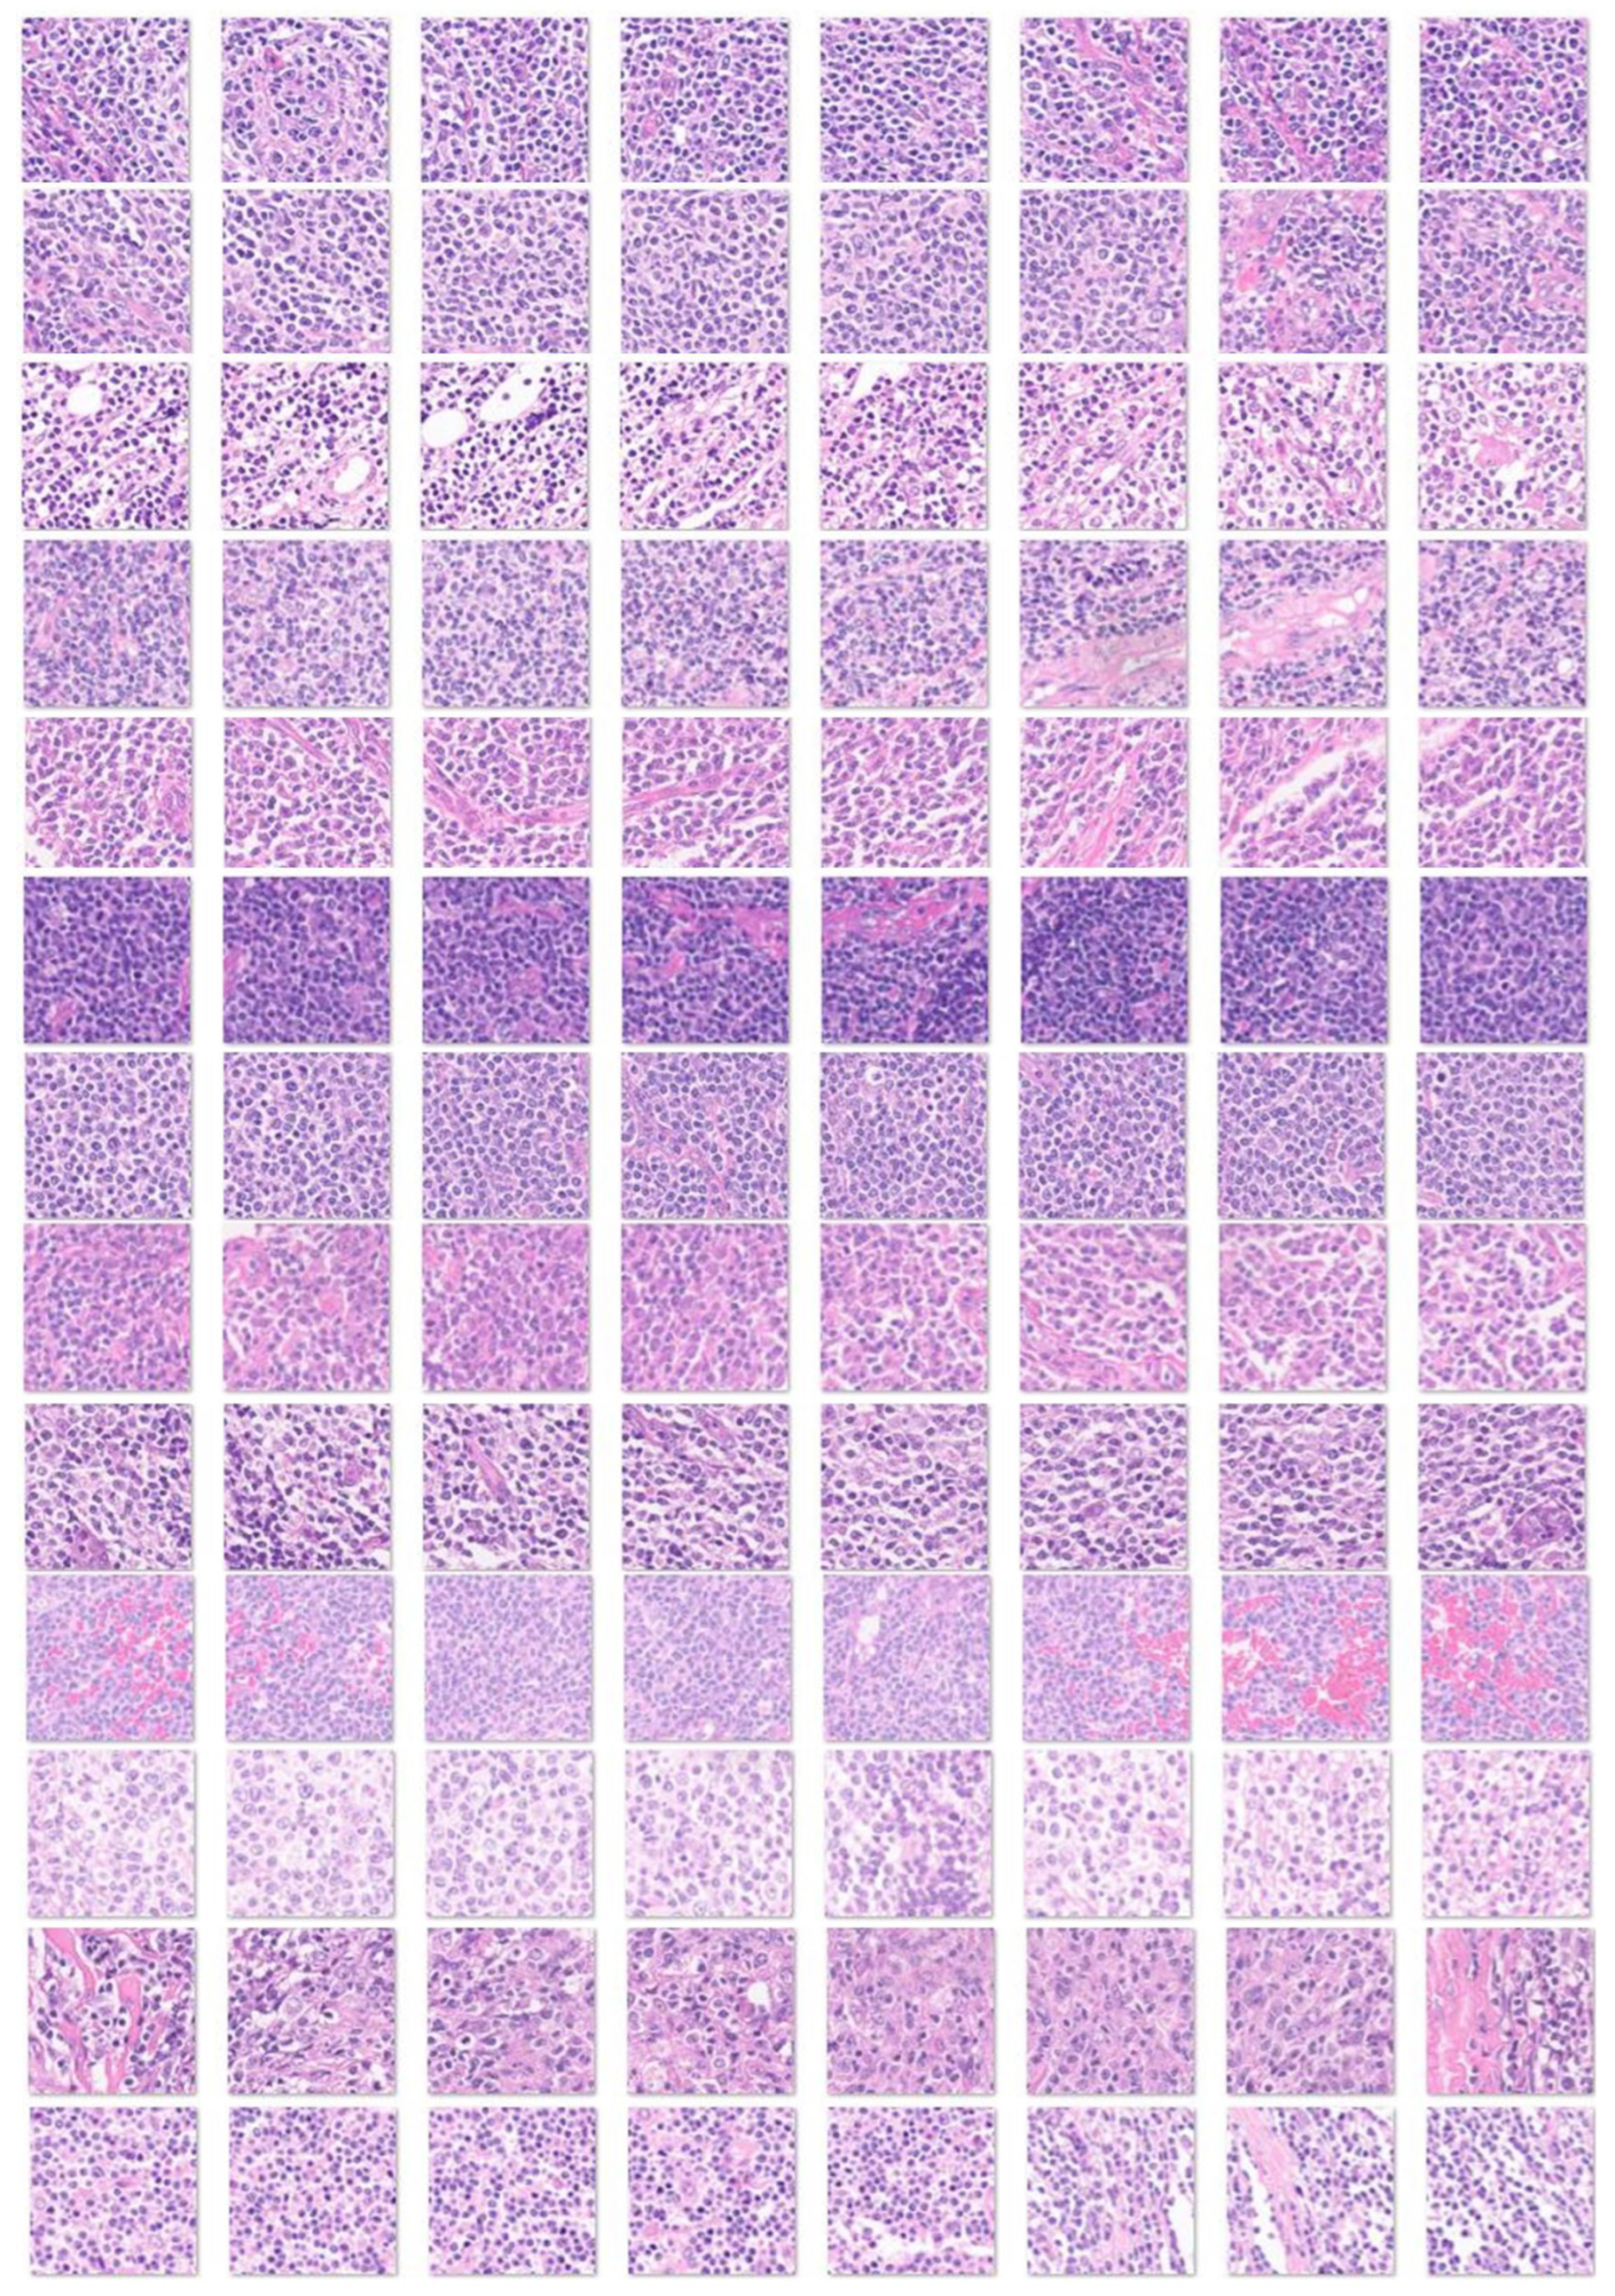
3.1. Image Dataset
3.2. Design of the CNN
3.3. Data Partitioning (Type 1), Image-Patch–Based Analysis
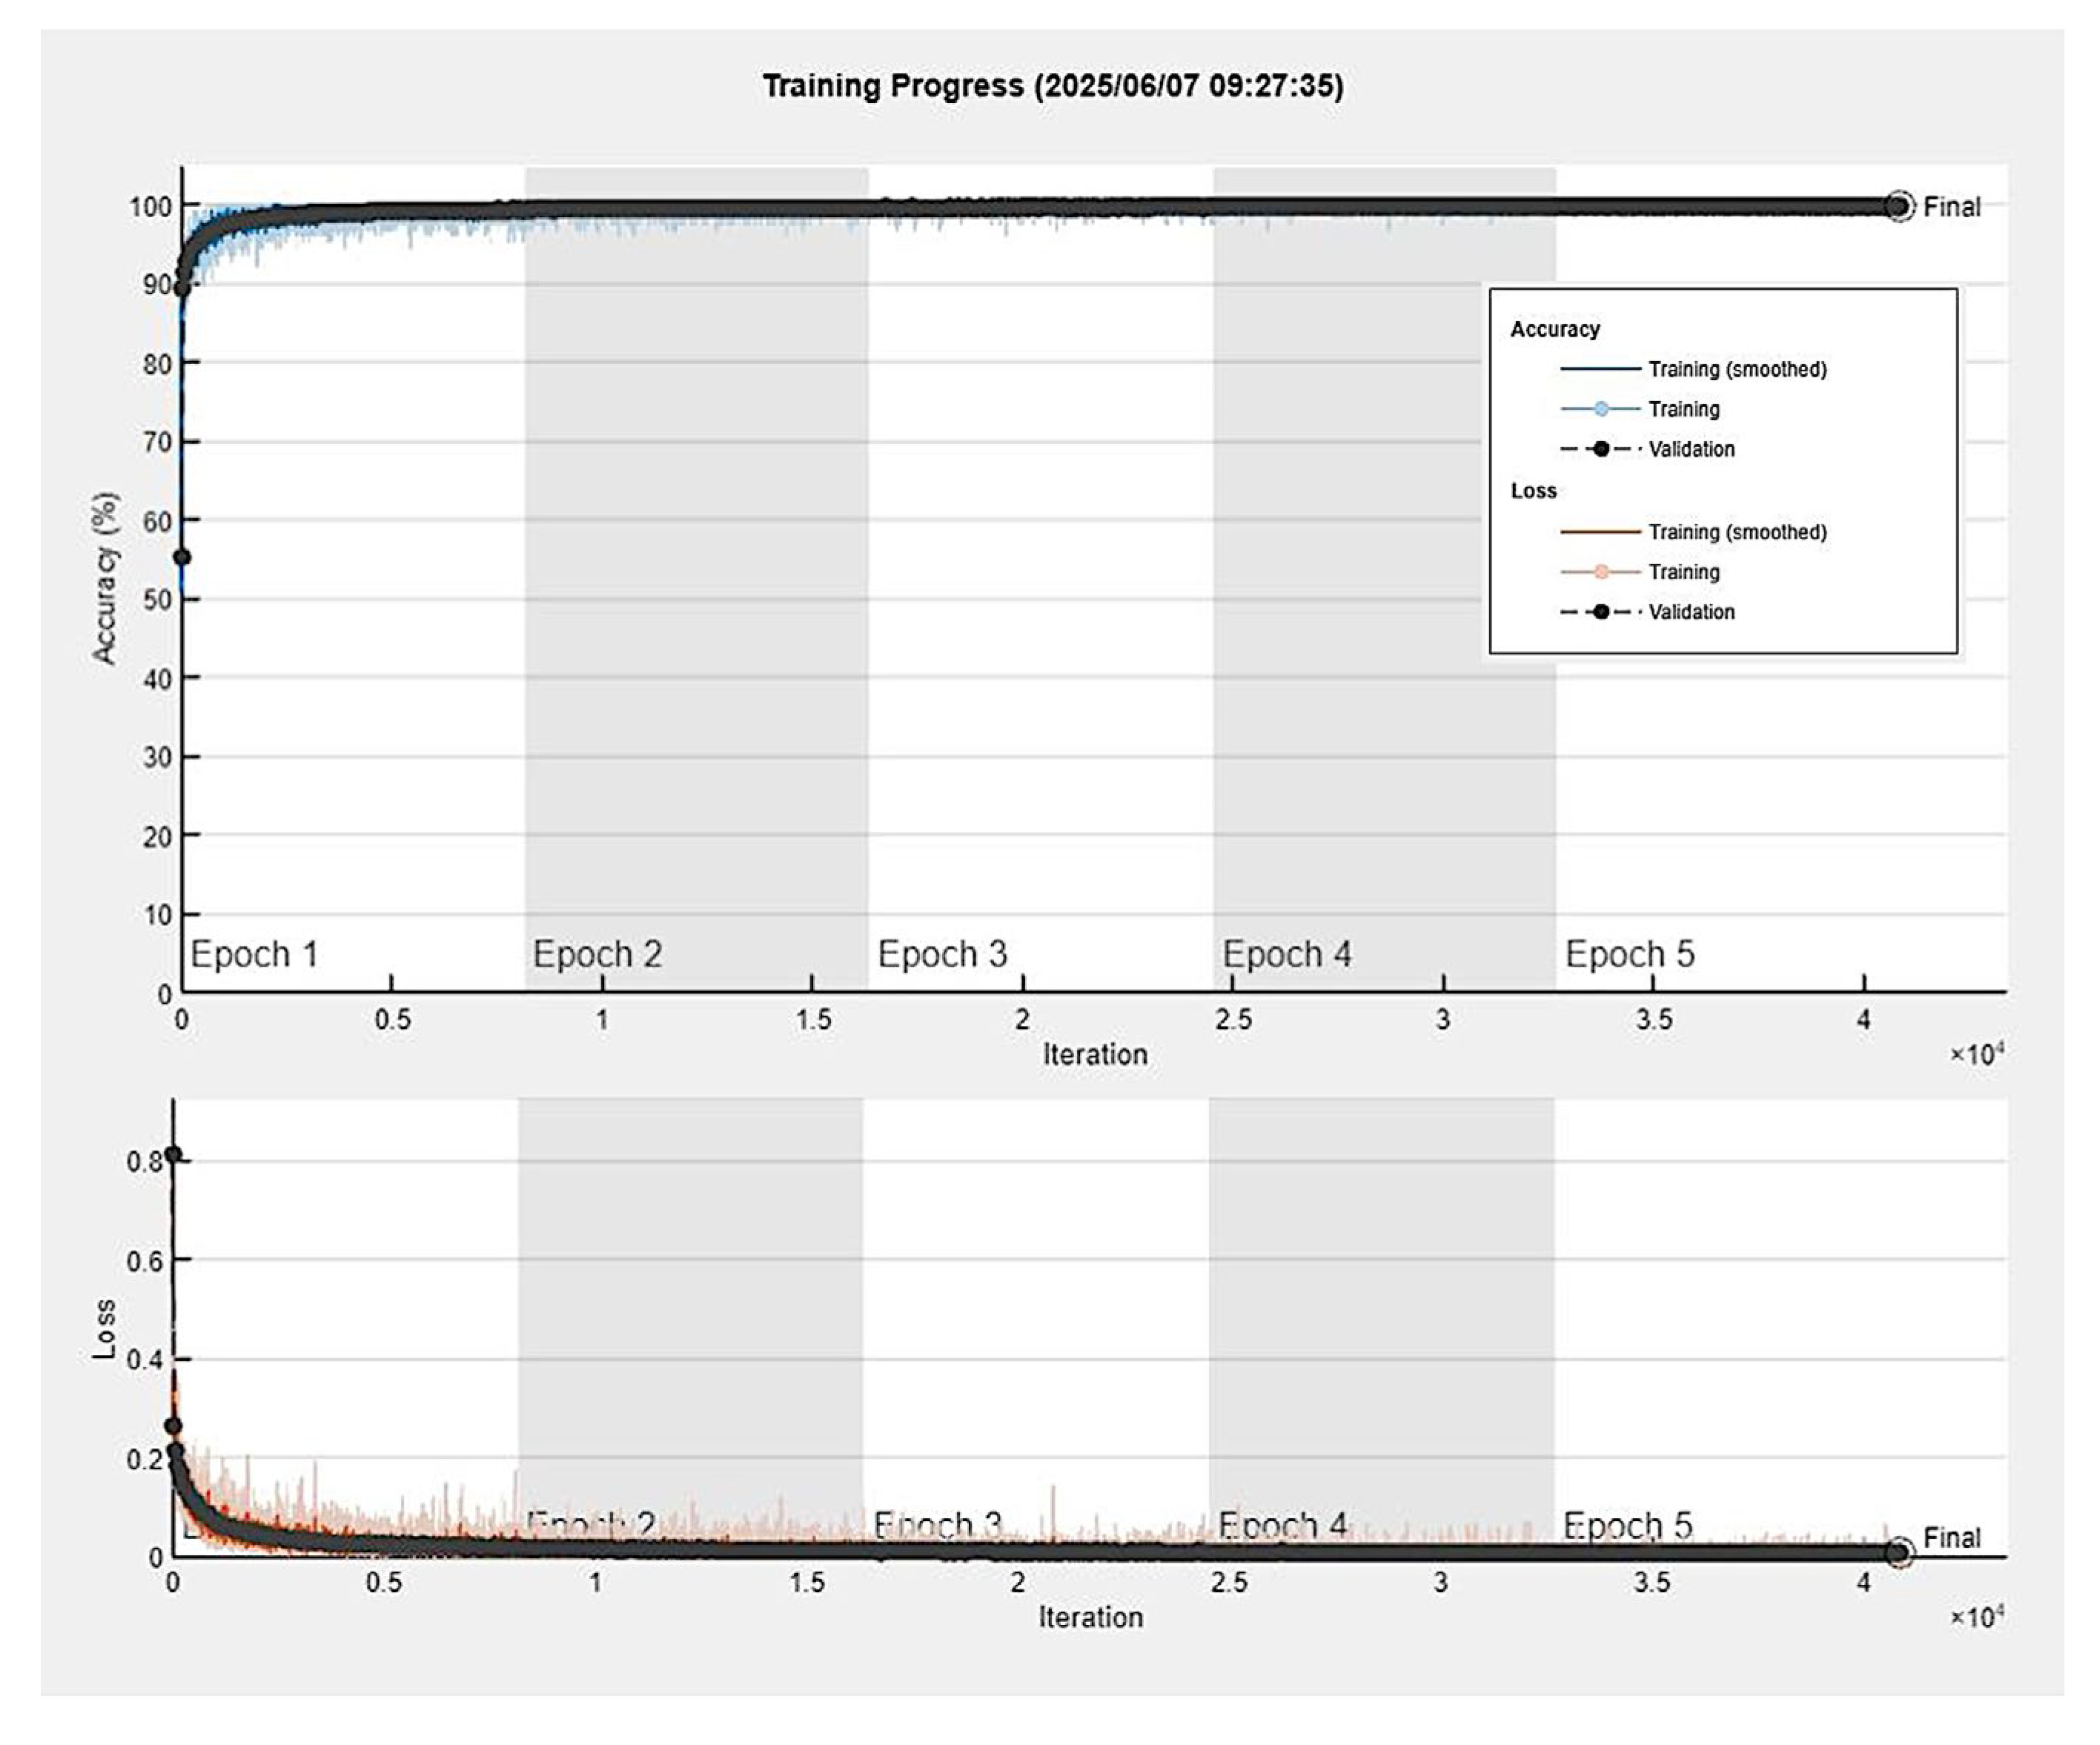
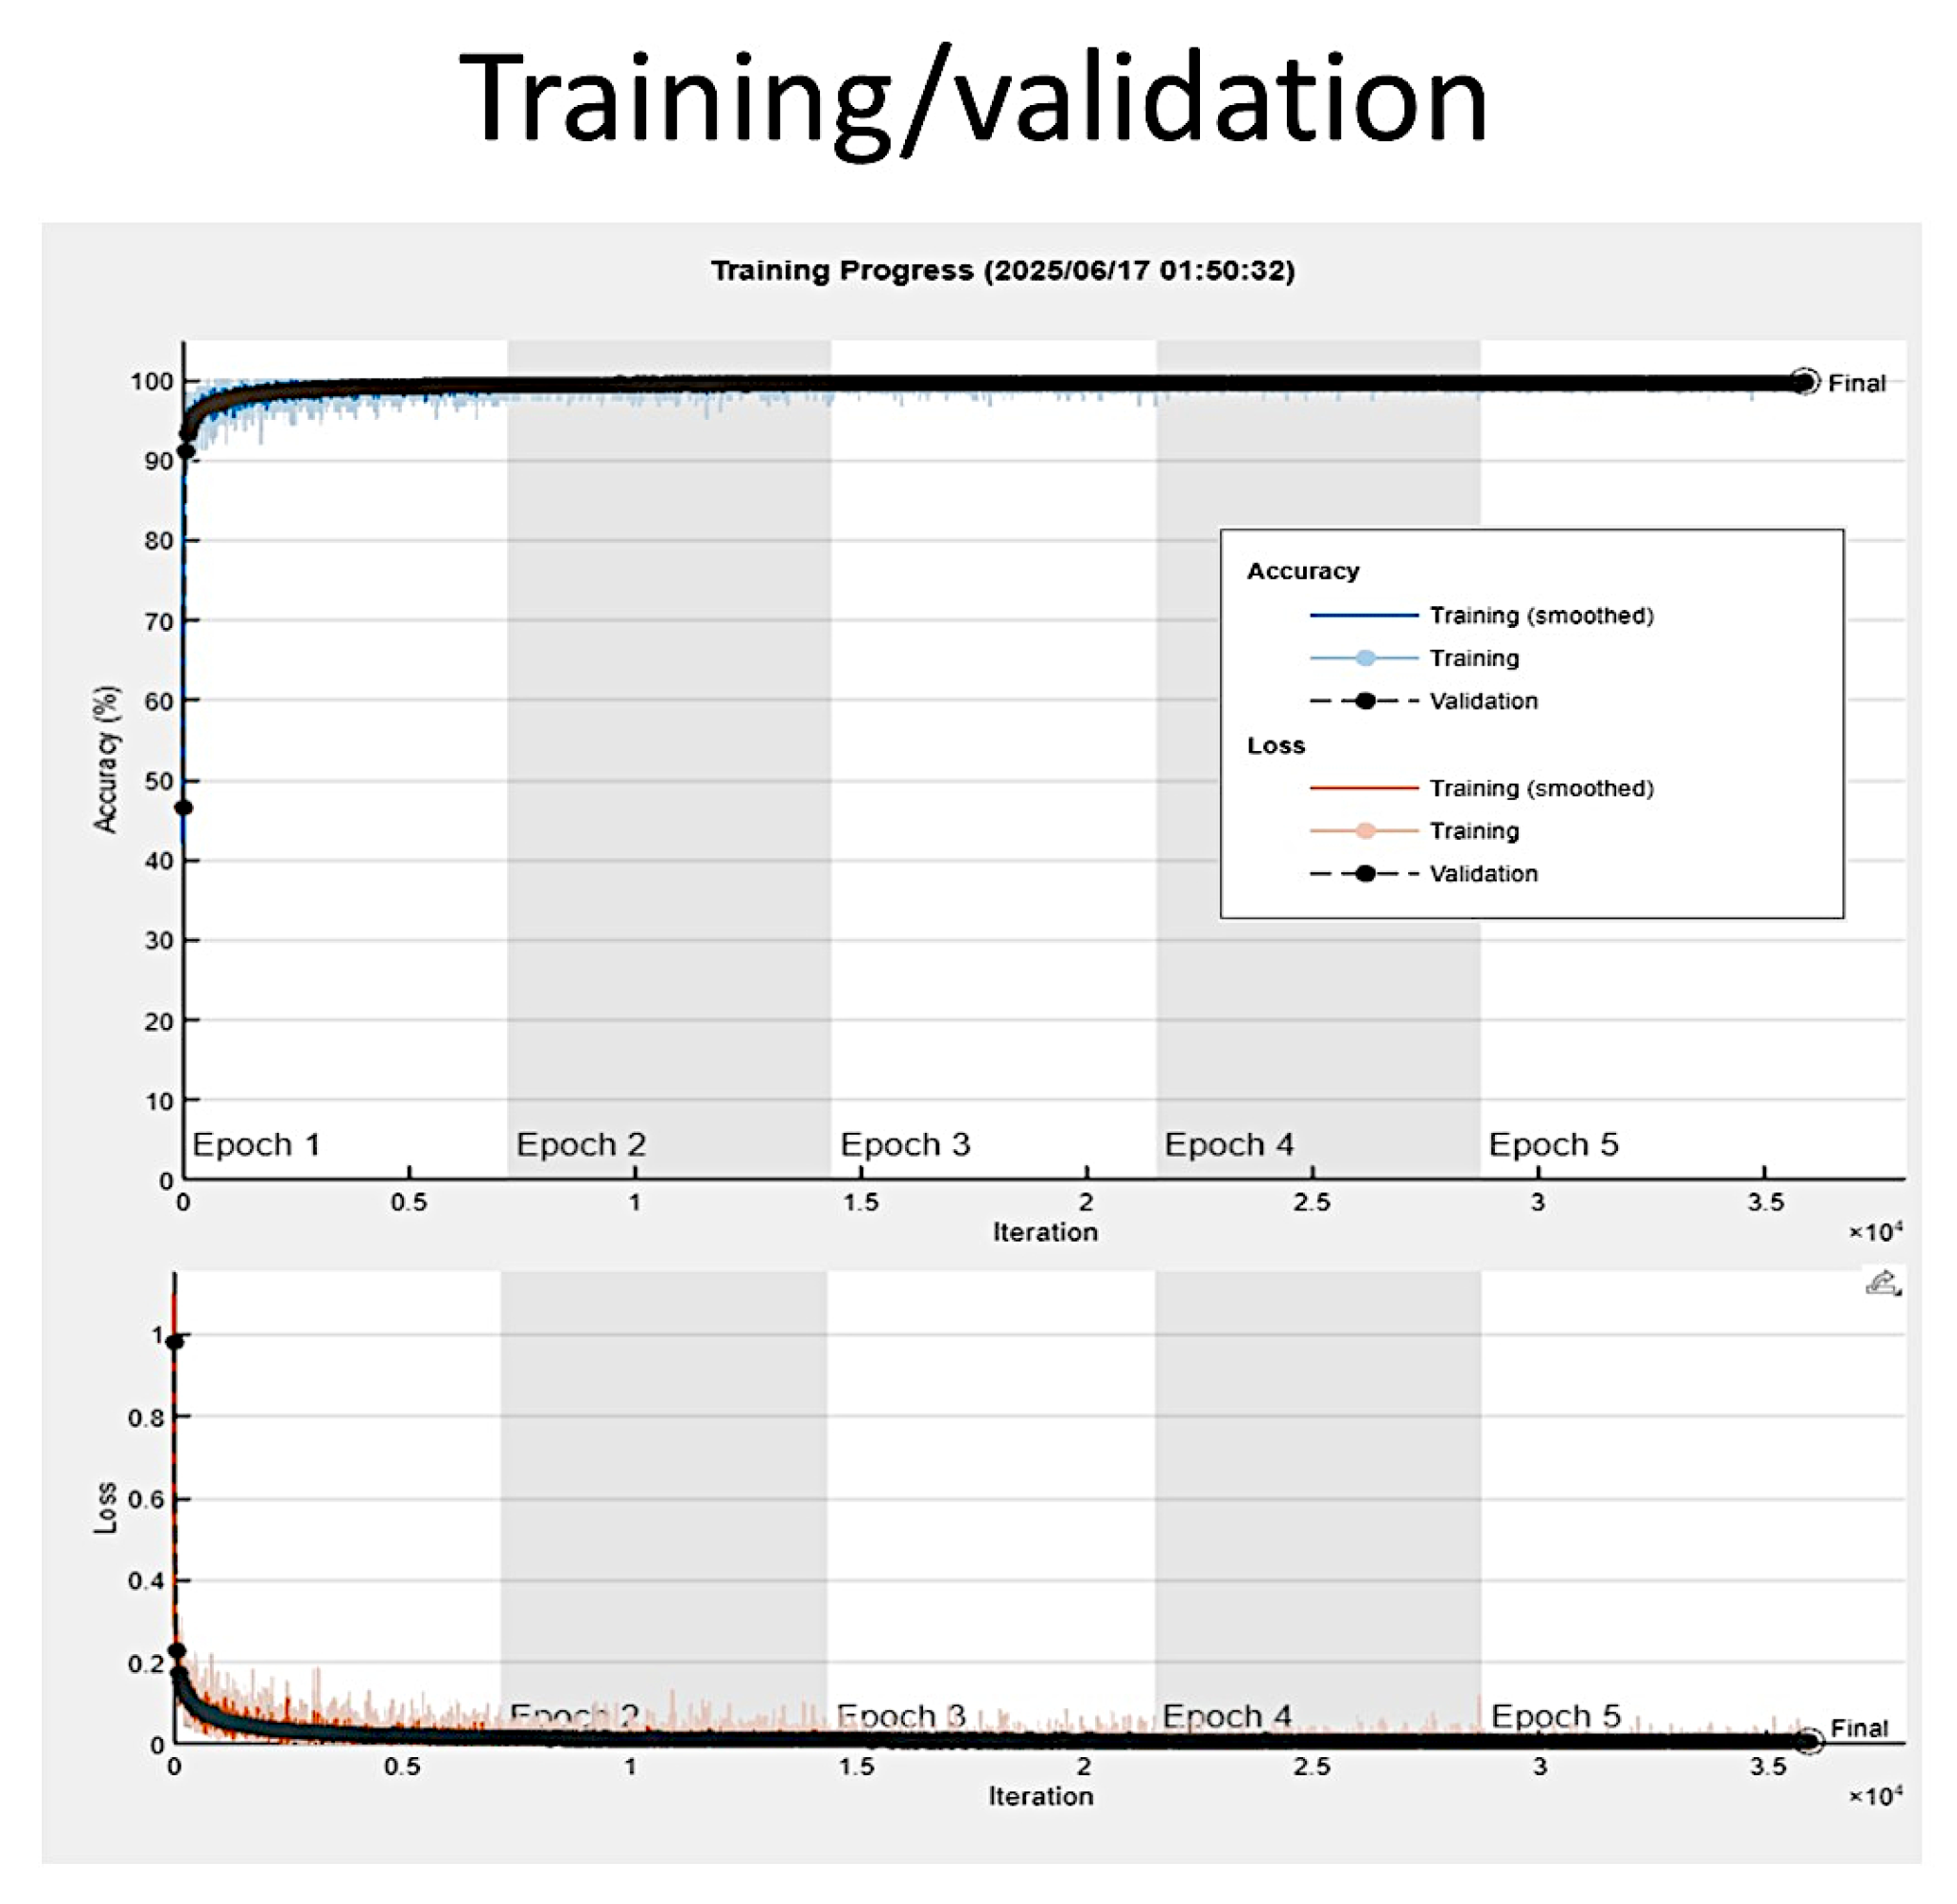
3.4. Training Progress
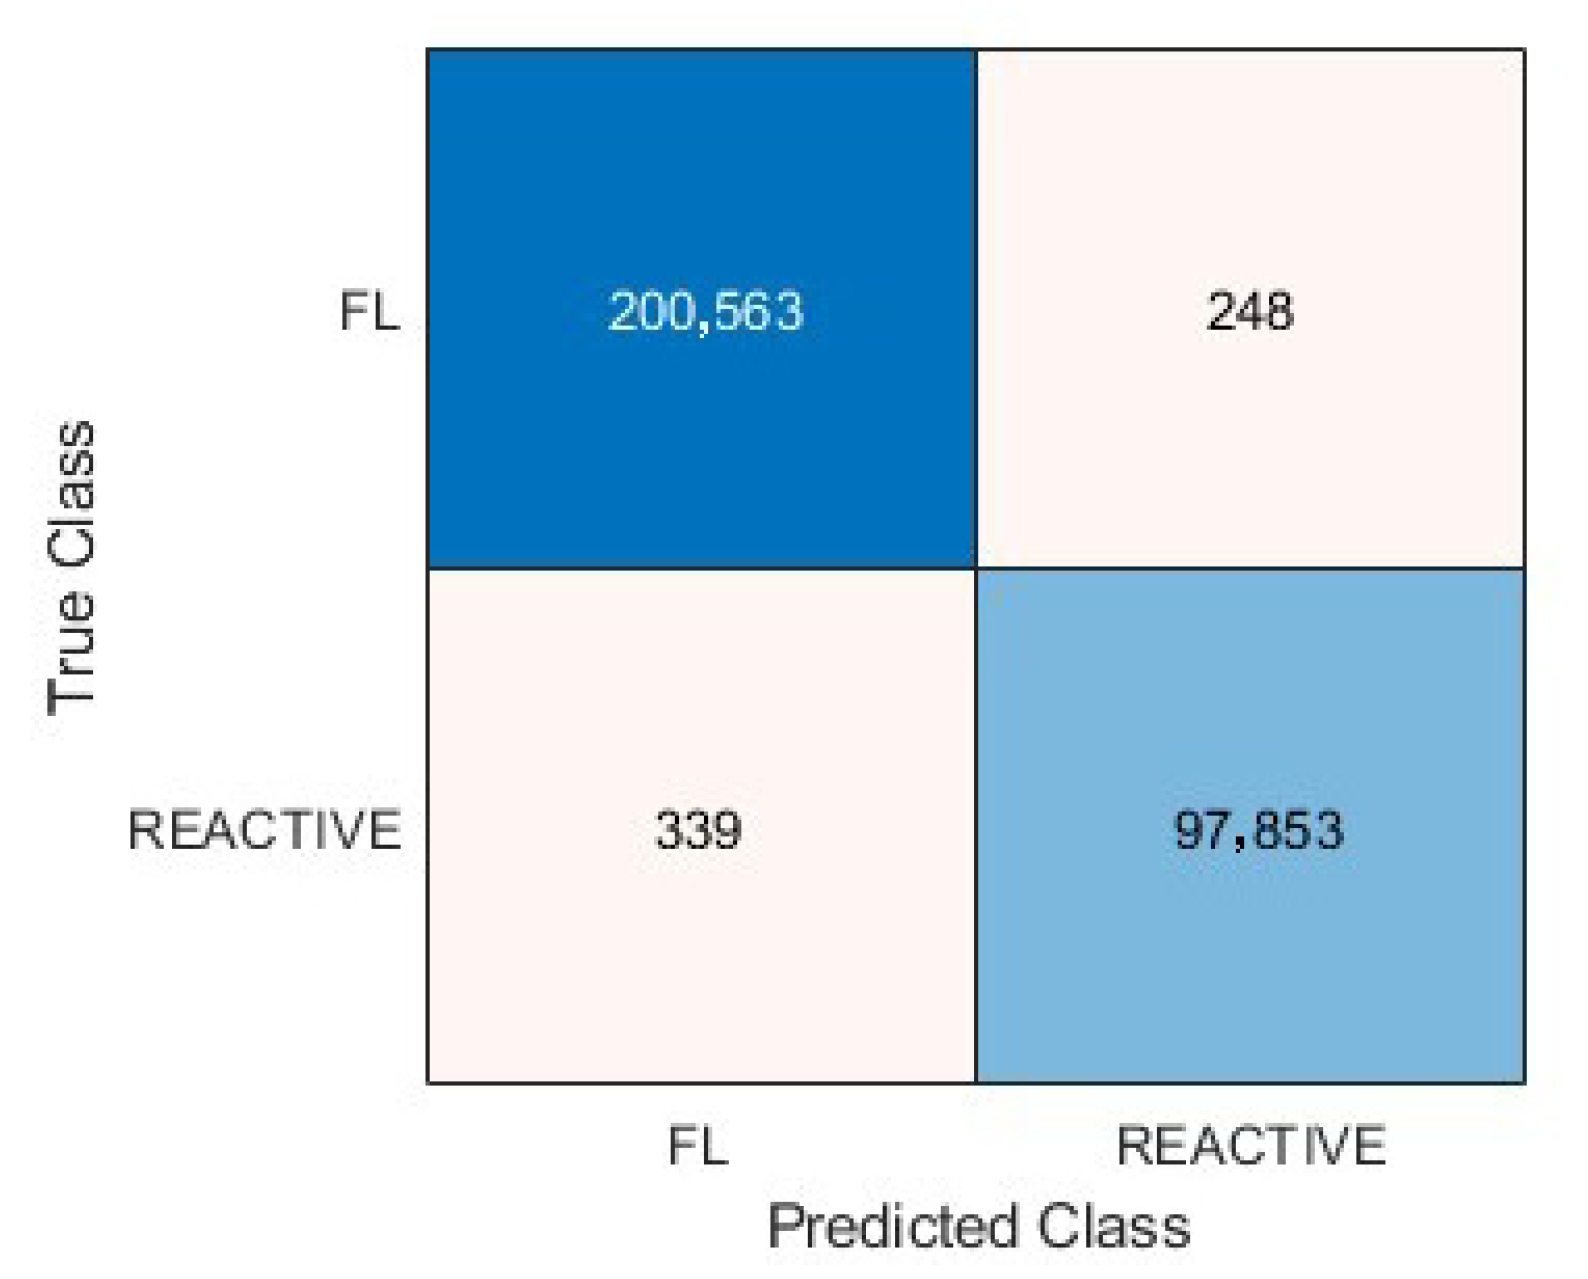
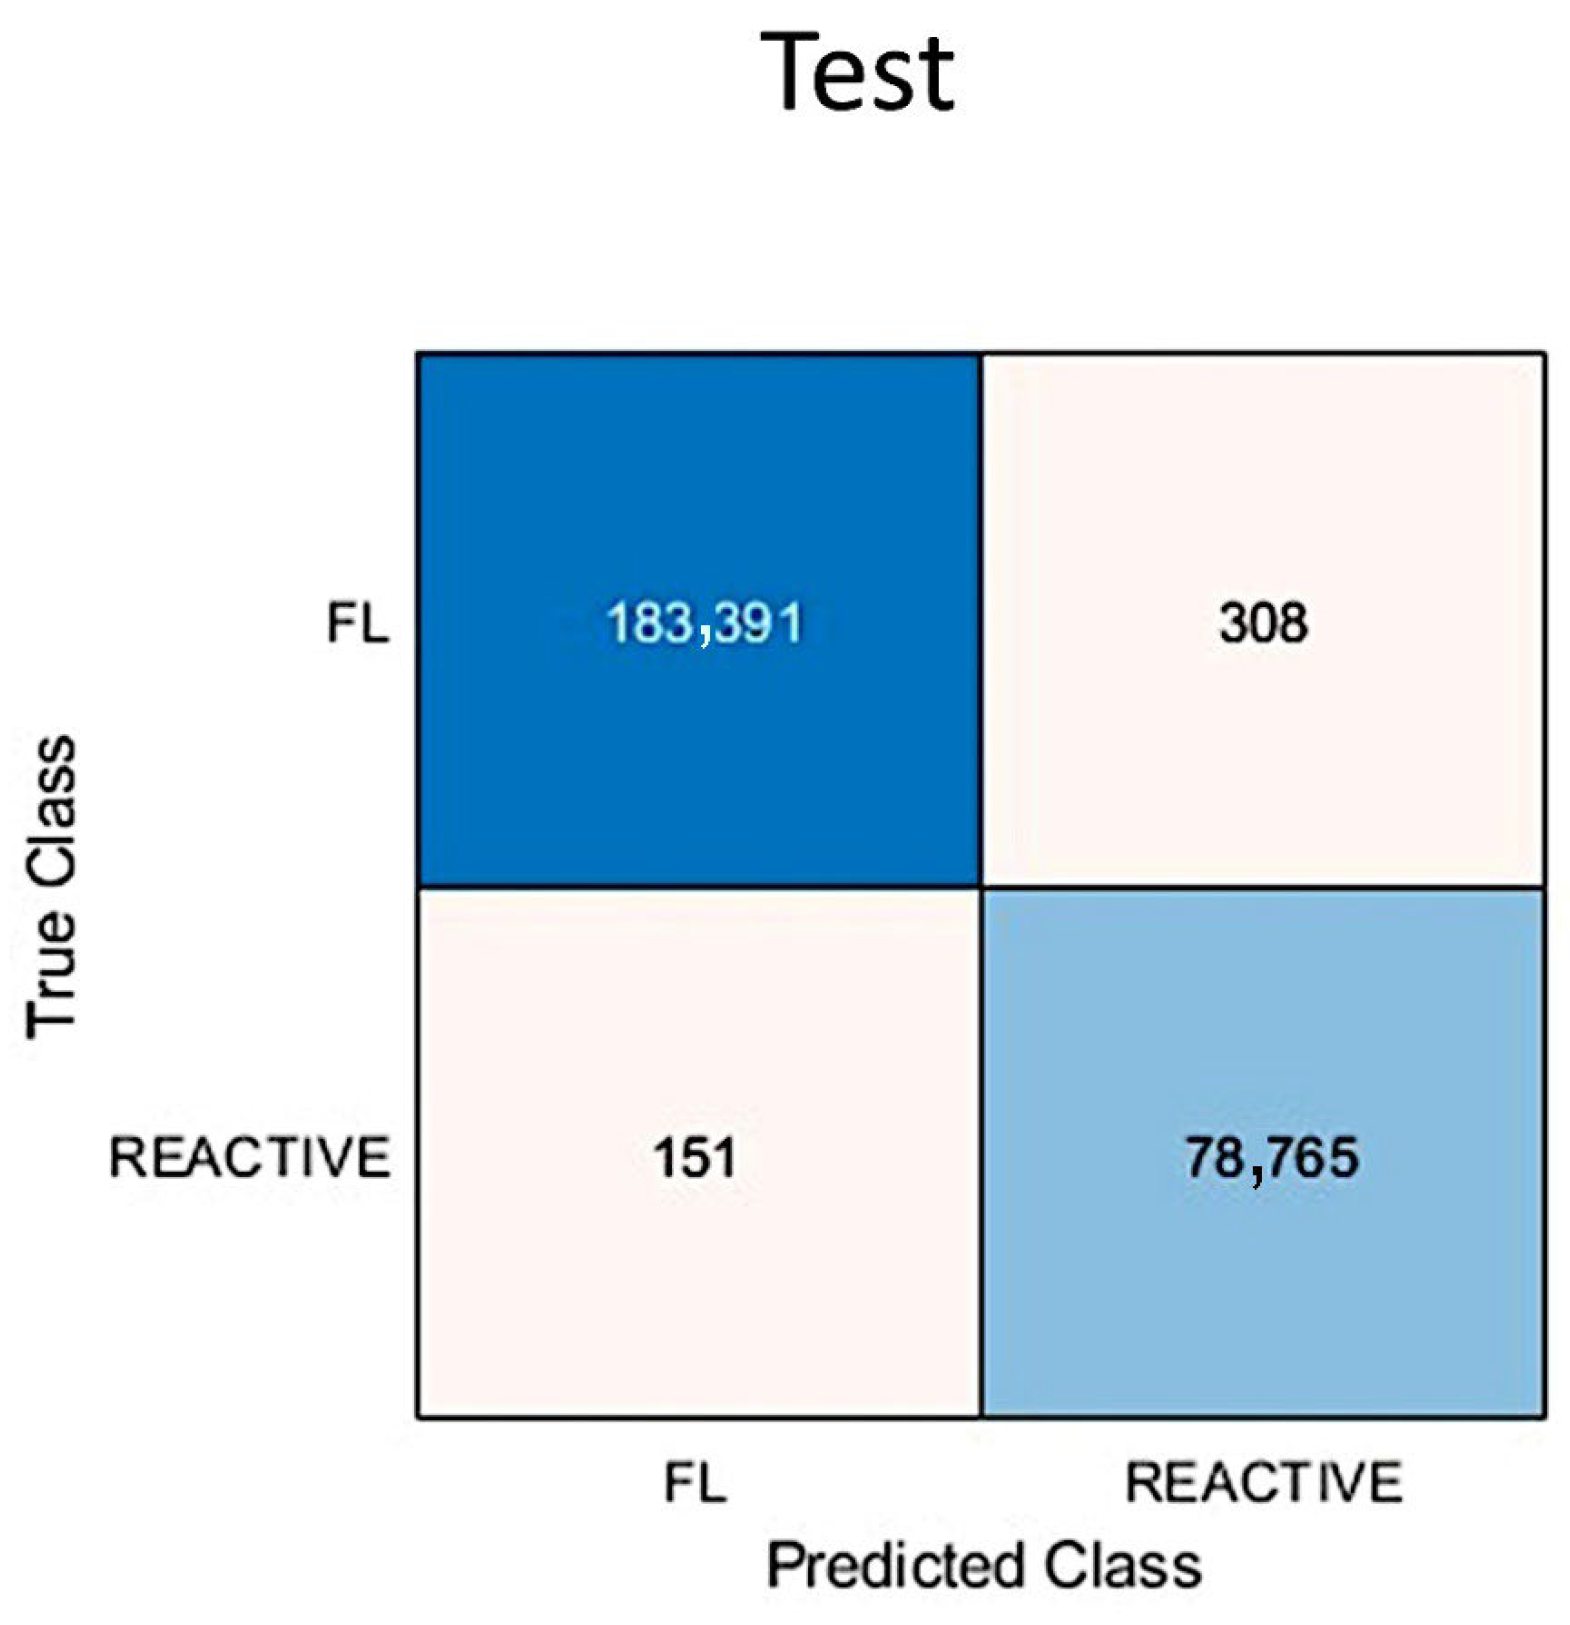
3.5. Metrics and Prediction Using the Test Set
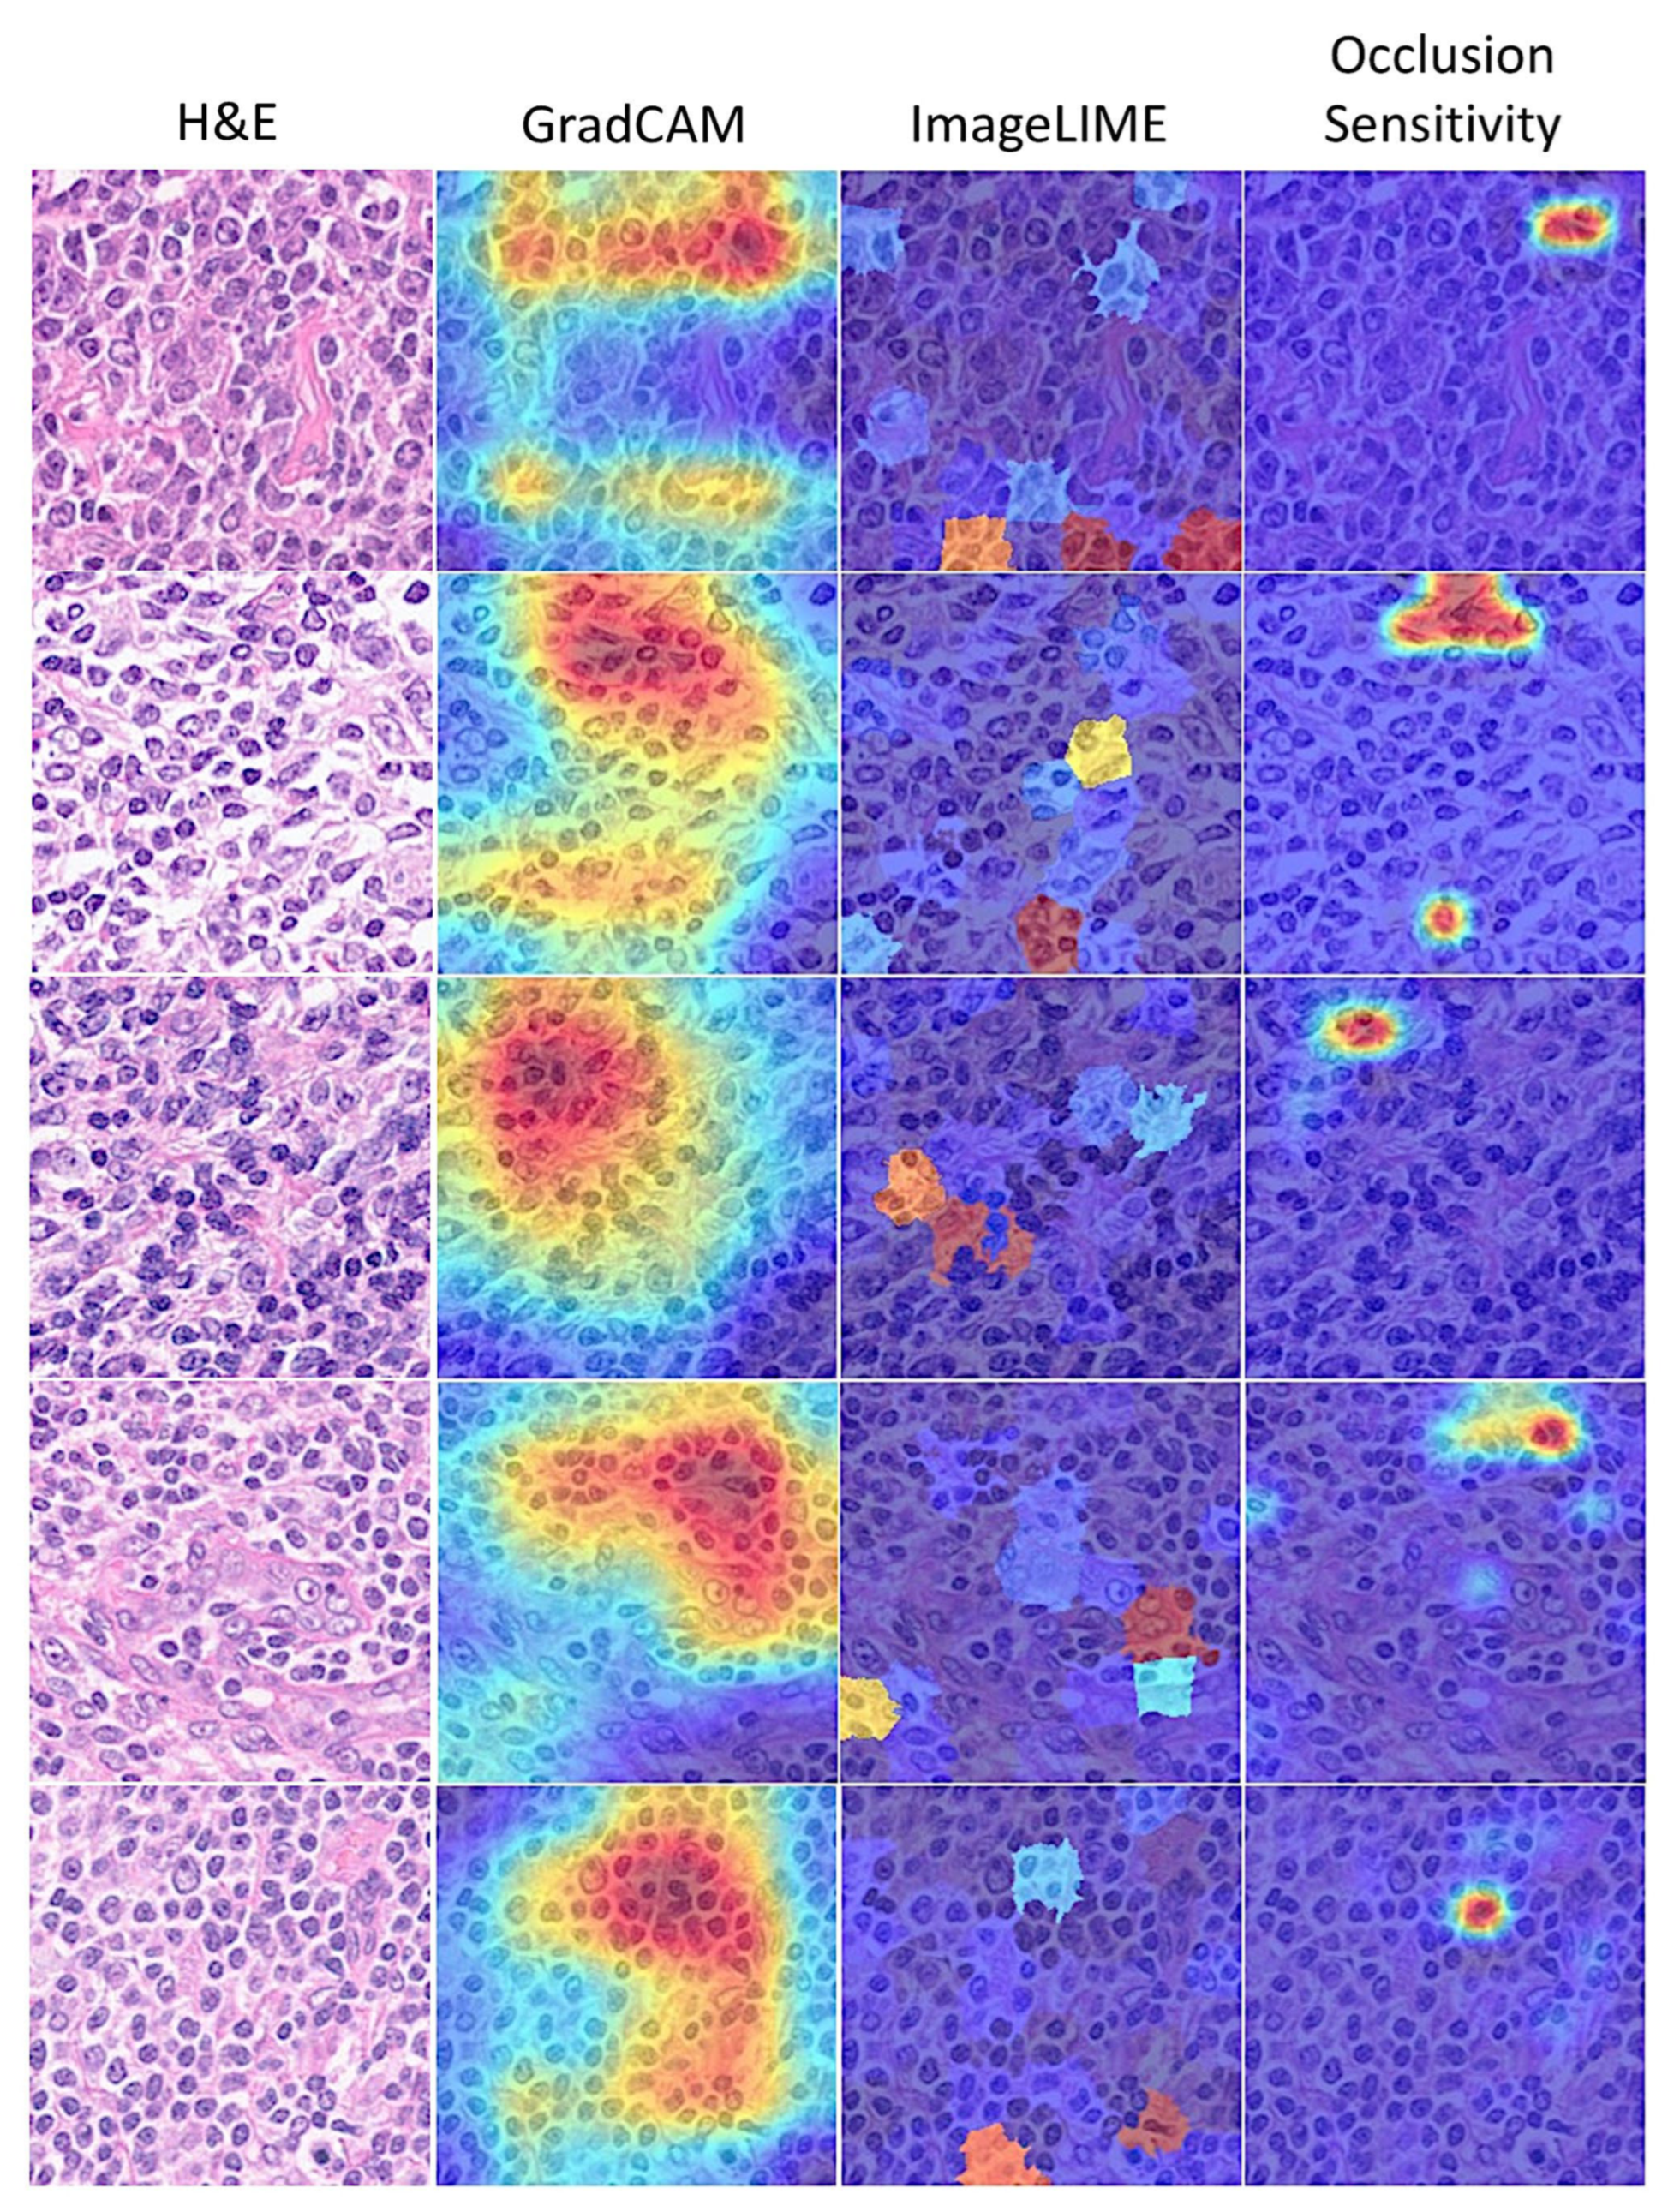
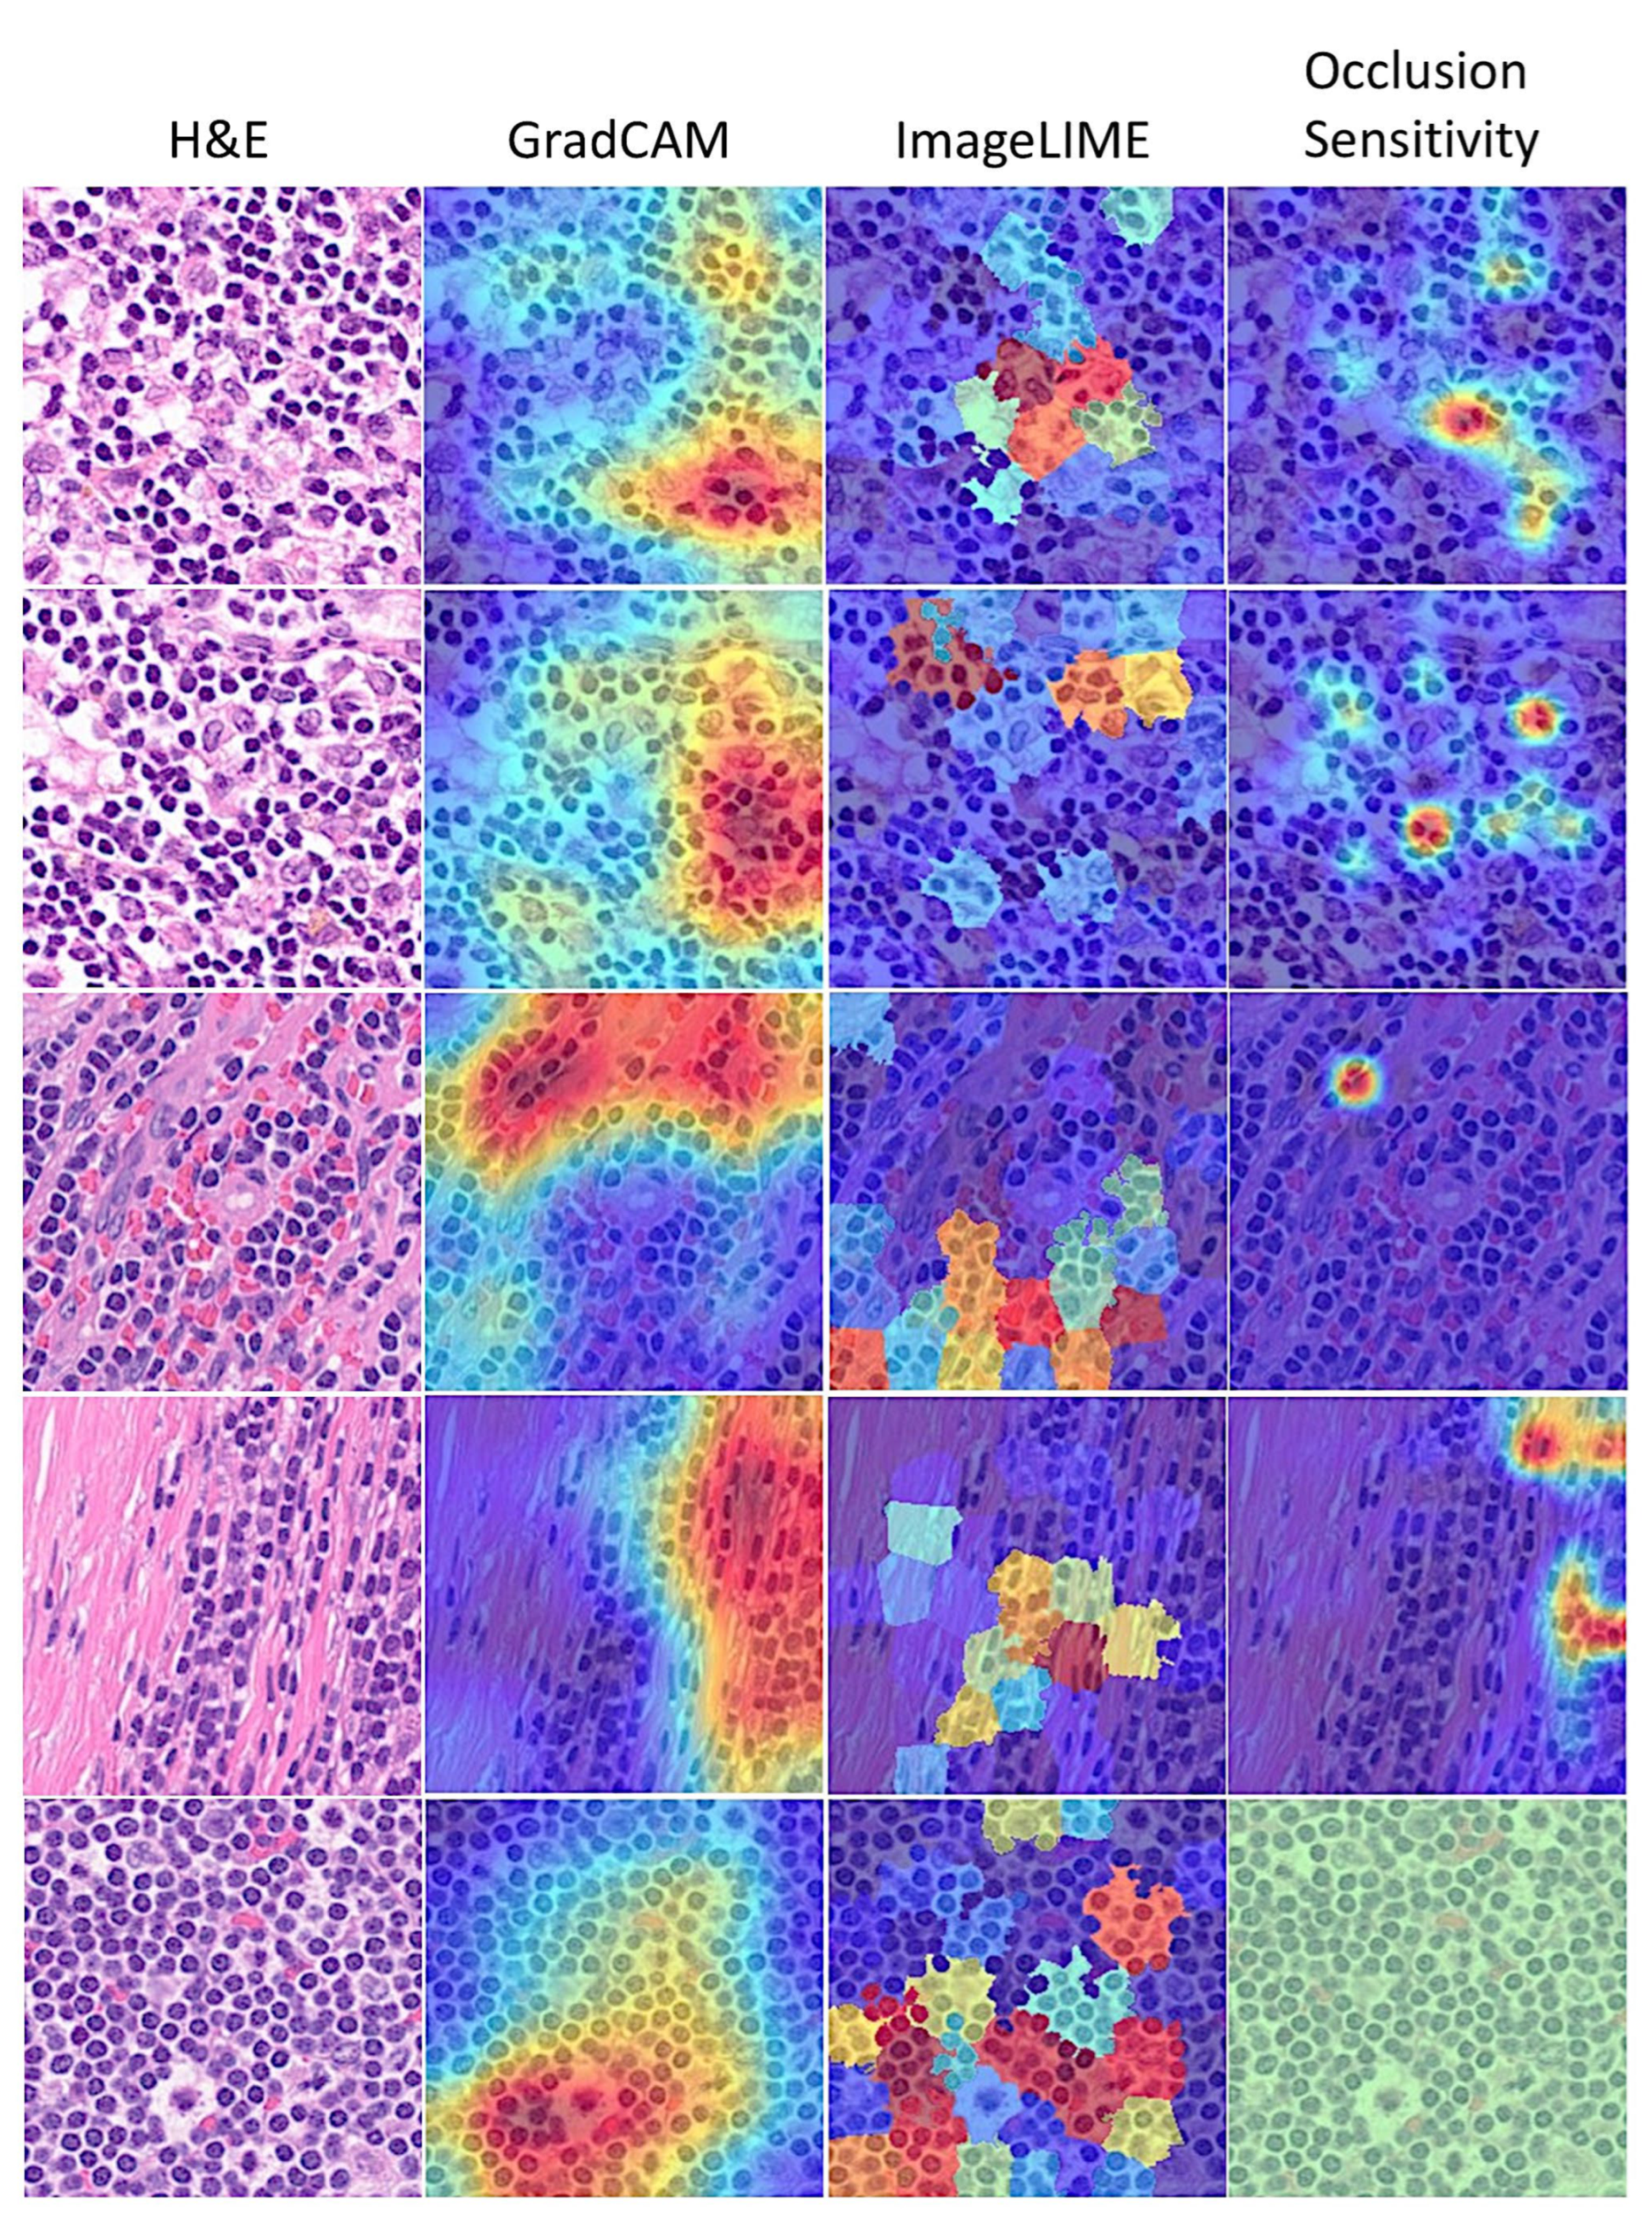
3.6. Interpretability
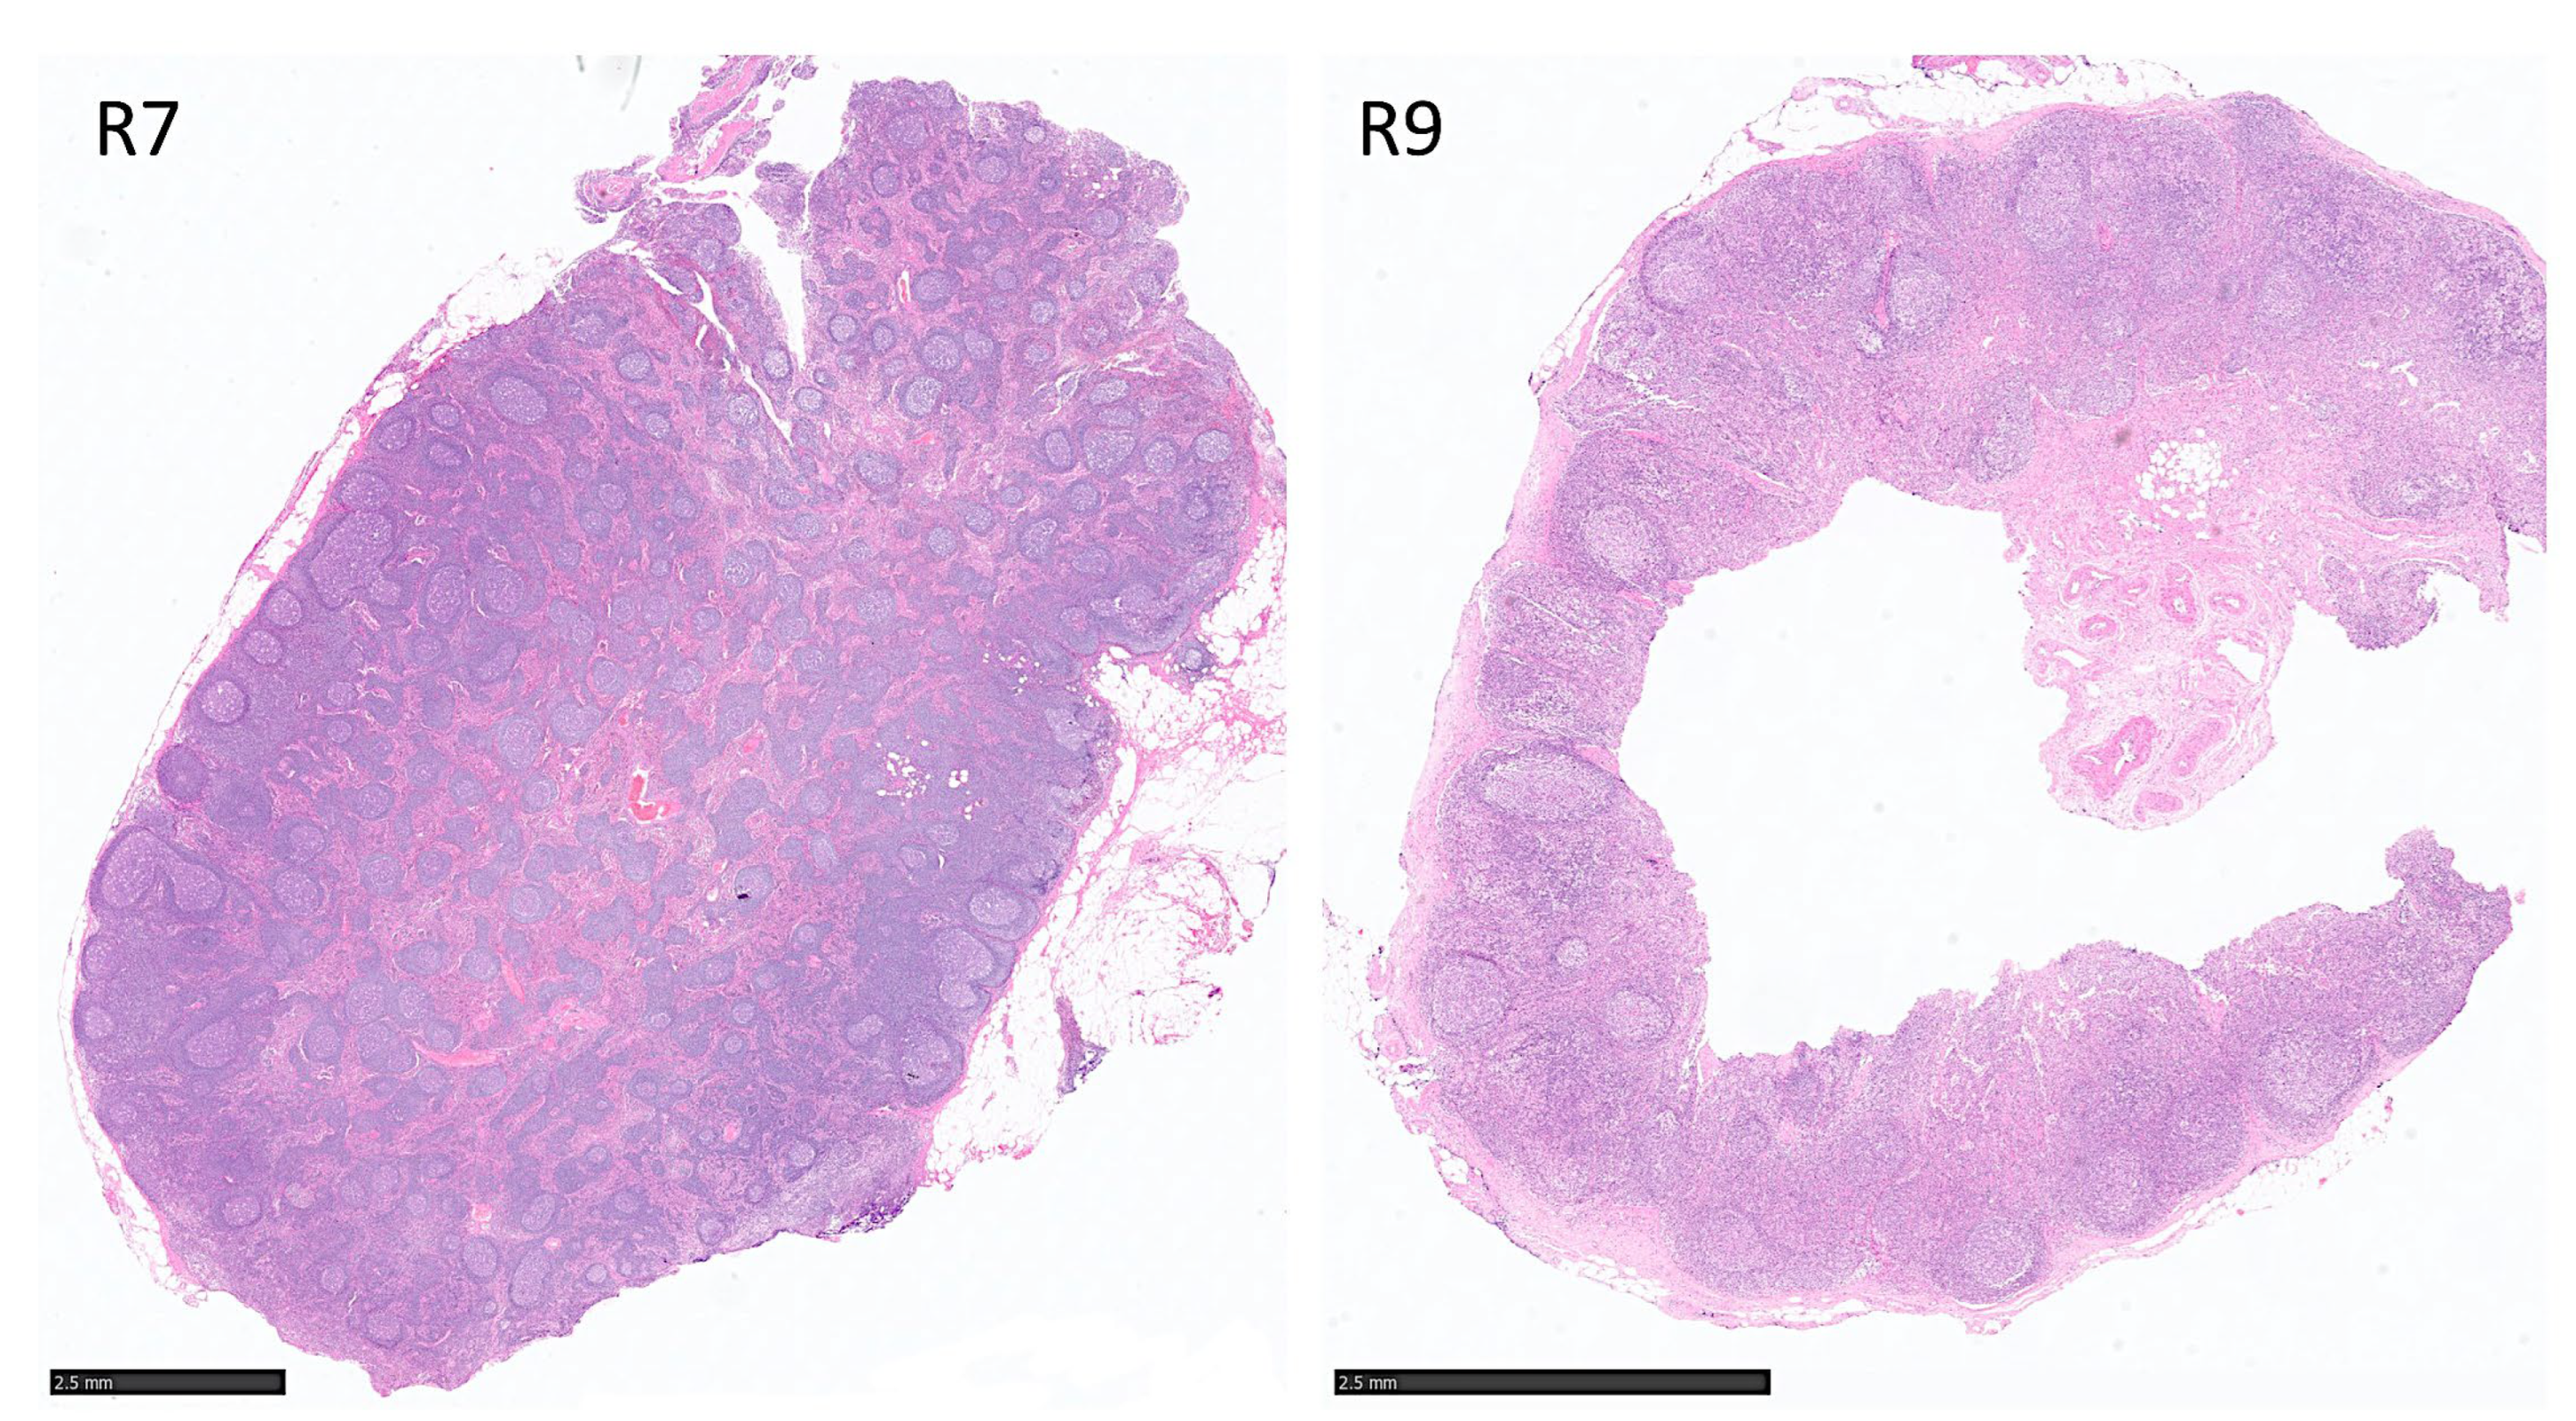
3.7. Data Partitioning to Avoid Information Leak (Type 2), Including Independent Patient Level Analysis
4. Discussion
5. Conclusions
Supplementary Materials
Author Contributions
Funding
Institutional Review Board
Informed Consent Statement
Data Availability Statement
Conflicts of Interest
Abbreviations
| FL | Follicular lymphoma |
| H&E | Hematoxylin and eosin |
| CNN | Convolutional neural network |
Appendix A. Script for Creating and Training a Deep Learning Network with the Following Properties
| Number of layers: 71 |
| Number of connections: 78 |
| Training setup file: “params.mat” |
| This script is run to create the network layers, import training and validation data, and train the network. |
| ➀ Load Training Setup Data: |
| trainingSetup = load(“params.mat”) |
| ➁ Import Data: |
| imdsTrain = trainingSetup.imdsTrain; |
| imdsValidation = trainingSetup.imdsValidation; |
| % Resize the images to match the network input layer. |
| augimdsTrain = augmentedImageDatastore([224 224 3],imdsTrain); |
| augimdsValidation = augmentedImageDatastore([224 224 3],imdsValidation); |
| ➂ Set Training Options: |
| opts = trainingOptions(“sgdm”,… |
| “ExecutionEnvironment”,“auto”,… |
| “InitialLearnRate”,0.001,… |
| “MaxEpochs”,5,… |
| “Shuffle”,“every-epoch”,… |
| “Plots”,“training-progress”,… |
| “ValidationData”,augimdsValidation); |
| ➃ Create Layer Graph: |
| lgraph = layerGraph(); |
| Add Layer Branches: |
| tempLayers = [ |
| imageInputLayer([224 224 3],“Name”,“data”,“Normalization”,“zscore”,“Mean”,trainingSetup.data.Mean,“StandardDeviation”,trainingSetup.data.StandardDeviation) |
| convolution2dLayer([7 7],64,“Name”,“conv1”,“BiasLearnRateFactor”,0,“Padding”,[3 3 3 3],“Stride”,[2 2],“Bias”,trainingSetup.conv1.Bias,“Weights”,trainingSetup.conv1.Weights) |
| batchNormalizationLayer(“Name”,“bn_conv1”,“Offset”,trainingSetup.bn_conv1.Offset,“Scale”,trainingSetup.bn_conv1.Scale,“TrainedMean”,trainingSetup.bn_conv1.TrainedMean,“TrainedVariance”,trainingSetup.bn_conv1.TrainedVariance) |
| reluLayer(“Name”,“conv1_relu”) |
| maxPooling2dLayer([3 3],“Name”,“pool1”,“Padding”,[1 1 1 1],“Stride”,[2 2])]; |
| lgraph = addLayers(lgraph,tempLayers); |
| tempLayers = [ |
| convolution2dLayer([3 3],64,“Name”,“res2a_branch2a”,“BiasLearnRateFactor”,0,“Padding”,[1 1 1 1],“Bias”,trainingSetup.res2a_branch2a.Bias,“Weights”,trainingSetup.res2a_branch2a.Weights) |
| batchNormalizationLayer(“Name”,“bn2a_branch2a”,“Offset”,trainingSetup.bn2a_branch2a.Offset,“Scale”,trainingSetup.bn2a_branch2a.Scale,“TrainedMean”,trainingSetup.bn2a_branch2a.TrainedMean,“TrainedVariance”,trainingSetup.bn2a_branch2a.TrainedVariance) |
| reluLayer(“Name”,“res2a_branch2a_relu”) |
| convolution2dLayer([3 3],64,“Name”,“res2a_branch2b”,“BiasLearnRateFactor”,0,“Padding”,[1 1 1 1],“Bias”,trainingSetup.res2a_branch2b.Bias,“Weights”,trainingSetup.res2a_branch2b.Weights) |
| batchNormalizationLayer(“Name”,“bn2a_branch2b”,“Offset”,trainingSetup.bn2a_branch2b.Offset,“Scale”,trainingSetup.bn2a_branch2b.Scale,“TrainedMean”,trainingSetup.bn2a_branch2b.TrainedMean,“TrainedVariance”,trainingSetup.bn2a_branch2b.TrainedVariance)]; |
| lgraph = addLayers(lgraph,tempLayers); |
| tempLayers = [ |
| additionLayer(2,“Name”,“res2a”) |
| reluLayer(“Name”,“res2a_relu”)]; |
| lgraph = addLayers(lgraph,tempLayers); |
| tempLayers = [ |
| convolution2dLayer([3 3],64,“Name”,“res2b_branch2a”,“BiasLearnRateFactor”,0,“Padding”,[1 1 1 1],“Bias”,trainingSetup.res2b_branch2a.Bias,“Weights”,trainingSetup.res2b_branch2a.Weights) |
| batchNormalizationLayer(“Name”,“bn2b_branch2a”,“Offset”,trainingSetup.bn2b_branch2a.Offset,“Scale”,trainingSetup.bn2b_branch2a.Scale,“TrainedMean”,trainingSetup.bn2b_branch2a.TrainedMean,“TrainedVariance”,trainingSetup.bn2b_branch2a.TrainedVariance) |
| reluLayer(“Name”,“res2b_branch2a_relu”) |
| convolution2dLayer([3 3],64,“Name”,“res2b_branch2b”,“BiasLearnRateFactor”,0,“Padding”,[1 1 1 1],“Bias”,trainingSetup.res2b_branch2b.Bias,“Weights”,trainingSetup.res2b_branch2b.Weights) |
| batchNormalizationLayer(“Name”,“bn2b_branch2b”,“Offset”,trainingSetup.bn2b_branch2b.Offset,“Scale”,trainingSetup.bn2b_branch2b.Scale,“TrainedMean”,trainingSetup.bn2b_branch2b.TrainedMean,“TrainedVariance”,trainingSetup.bn2b_branch2b.TrainedVariance)]; |
| lgraph = addLayers(lgraph,tempLayers); |
| tempLayers = [ |
| additionLayer(2,“Name”,“res2b”) |
| reluLayer(“Name”,“res2b_relu”)]; |
| lgraph = addLayers(lgraph,tempLayers); |
| tempLayers = [ |
| convolution2dLayer([3 3],128,“Name”,“res3a_branch2a”,“BiasLearnRateFactor”,0,“Padding”,[1 1 1 1],“Stride”,[2 2],“Bias”,trainingSetup.res3a_branch2a.Bias,“Weights”,trainingSetup.res3a_branch2a.Weights) |
| batchNormalizationLayer(“Name”,“bn3a_branch2a”,“Offset”,trainingSetup.bn3a_branch2a.Offset,“Scale”,trainingSetup.bn3a_branch2a.Scale,“TrainedMean”,trainingSetup.bn3a_branch2a.TrainedMean,“TrainedVariance”,trainingSetup.bn3a_branch2a.TrainedVariance) |
| reluLayer(“Name”,“res3a_branch2a_relu”) |
| convolution2dLayer([3 3],128,“Name”,“res3a_branch2b”,“BiasLearnRateFactor”,0,“Padding”,[1 1 1 1],“Bias”,trainingSetup.res3a_branch2b.Bias,“Weights”,trainingSetup.res3a_branch2b.Weights) |
| batchNormalizationLayer(“Name”,“bn3a_branch2b”,“Offset”,trainingSetup.bn3a_branch2b.Offset,“Scale”,trainingSetup.bn3a_branch2b.Scale,“TrainedMean”,trainingSetup.bn3a_branch2b.TrainedMean,“TrainedVariance”,trainingSetup.bn3a_branch2b.TrainedVariance)]; |
| lgraph = addLayers(lgraph,tempLayers); |
| tempLayers = [ |
| convolution2dLayer([1 1],128,“Name”,“res3a_branch1”,“BiasLearnRateFactor”,0,“Stride”,[2 2],“Bias”,trainingSetup.res3a_branch1.Bias,“Weights”,trainingSetup.res3a_branch1.Weights) |
| batchNormalizationLayer(“Name”,“bn3a_branch1”,“Offset”,trainingSetup.bn3a_branch1.Offset,“Scale”,trainingSetup.bn3a_branch1.Scale,“TrainedMean”,trainingSetup.bn3a_branch1.TrainedMean,“TrainedVariance”,trainingSetup.bn3a_branch1.TrainedVariance)]; |
| lgraph = addLayers(lgraph,tempLayers); |
| tempLayers = [ |
| additionLayer(2,“Name”,“res3a”) |
| reluLayer(“Name”,“res3a_relu”)]; |
| lgraph = addLayers(lgraph,tempLayers); |
| tempLayers = [ |
| convolution2dLayer([3 3],128,“Name”,“res3b_branch2a”,“BiasLearnRateFactor”,0,“Padding”,[1 1 1 1],“Bias”,trainingSetup.res3b_branch2a.Bias,“Weights”,trainingSetup.res3b_branch2a.Weights) |
| batchNormalizationLayer(“Name”,“bn3b_branch2a”,“Offset”,trainingSetup.bn3b_branch2a.Offset,“Scale”,trainingSetup.bn3b_branch2a.Scale,“TrainedMean”,trainingSetup.bn3b_branch2a.TrainedMean,“TrainedVariance”,trainingSetup.bn3b_branch2a.TrainedVariance) |
| reluLayer(“Name”,“res3b_branch2a_relu”) |
| convolution2dLayer([3 3],128,“Name”,“res3b_branch2b”,“BiasLearnRateFactor”,0,“Padding”,[1 1 1 1],“Bias”,trainingSetup.res3b_branch2b.Bias,“Weights”,trainingSetup.res3b_branch2b.Weights) |
| batchNormalizationLayer(“Name”,“bn3b_branch2b”,“Offset”,trainingSetup.bn3b_branch2b.Offset,“Scale”,trainingSetup.bn3b_branch2b.Scale,“TrainedMean”,trainingSetup.bn3b_branch2b.TrainedMean,“TrainedVariance”,trainingSetup.bn3b_branch2b.TrainedVariance)]; |
| lgraph = addLayers(lgraph,tempLayers); |
| tempLayers = [ |
| additionLayer(2,“Name”,“res3b”) |
| reluLayer(“Name”,“res3b_relu”)]; |
| lgraph = addLayers(lgraph,tempLayers); |
| tempLayers = [ |
| convolution2dLayer([3 3],256,“Name”,“res4a_branch2a”,“BiasLearnRateFactor”,0,“Padding”,[1 1 1 1],“Stride”,[2 2],“Bias”,trainingSetup.res4a_branch2a.Bias,“Weights”,trainingSetup.res4a_branch2a.Weights) |
| batchNormalizationLayer(“Name”,“bn4a_branch2a”,“Offset”,trainingSetup.bn4a_branch2a.Offset,“Scale”,trainingSetup.bn4a_branch2a.Scale,“TrainedMean”,trainingSetup.bn4a_branch2a.TrainedMean,“TrainedVariance”,trainingSetup.bn4a_branch2a.TrainedVariance) |
| reluLayer(“Name”,“res4a_branch2a_relu”) |
| convolution2dLayer([3 3],256,“Name”,“res4a_branch2b”,“BiasLearnRateFactor”,0,“Padding”,[1 1 1 1],“Bias”,trainingSetup.res4a_branch2b.Bias,“Weights”,trainingSetup.res4a_branch2b.Weights) |
| batchNormalizationLayer(“Name”,“bn4a_branch2b”,“Offset”,trainingSetup.bn4a_branch2b.Offset,“Scale”,trainingSetup.bn4a_branch2b.Scale,“TrainedMean”,trainingSetup.bn4a_branch2b.TrainedMean,“TrainedVariance”,trainingSetup.bn4a_branch2b.TrainedVariance)]; |
| lgraph = addLayers(lgraph,tempLayers); |
| tempLayers = [ |
| convolution2dLayer([1 1],256,“Name”,“res4a_branch1”,“BiasLearnRateFactor”,0,“Stride”,[2 2],“Bias”,trainingSetup.res4a_branch1.Bias,“Weights”,trainingSetup.res4a_branch1.Weights) |
| batchNormalizationLayer(“Name”,“bn4a_branch1”,“Offset”,trainingSetup.bn4a_branch1.Offset,“Scale”,trainingSetup.bn4a_branch1.Scale,“TrainedMean”,trainingSetup.bn4a_branch1.TrainedMean,“TrainedVariance”,trainingSetup.bn4a_branch1.TrainedVariance)]; |
| lgraph = addLayers(lgraph,tempLayers); |
| tempLayers = [ |
| additionLayer(2,“Name”,“res4a”) |
| reluLayer(“Name”,“res4a_relu”)]; |
| lgraph = addLayers(lgraph,tempLayers); |
| tempLayers = [ |
| convolution2dLayer([3 3],256,“Name”,“res4b_branch2a”,“BiasLearnRateFactor”,0,“Padding”,[1 1 1 1],“Bias”,trainingSetup.res4b_branch2a.Bias,“Weights”,trainingSetup.res4b_branch2a.Weights) |
| batchNormalizationLayer(“Name”,“bn4b_branch2a”,“Offset”,trainingSetup.bn4b_branch2a.Offset,“Scale”,trainingSetup.bn4b_branch2a.Scale,“TrainedMean”,trainingSetup.bn4b_branch2a.TrainedMean,“TrainedVariance”,trainingSetup.bn4b_branch2a.TrainedVariance) |
| reluLayer(“Name”,“res4b_branch2a_relu”) |
| convolution2dLayer([3 3],256,“Name”,“res4b_branch2b”,“BiasLearnRateFactor”,0,“Padding”,[1 1 1 1],“Bias”,trainingSetup.res4b_branch2b.Bias,“Weights”,trainingSetup.res4b_branch2b.Weights) |
| batchNormalizationLayer(“Name”,“bn4b_branch2b”,“Offset”,trainingSetup.bn4b_branch2b.Offset,“Scale”,trainingSetup.bn4b_branch2b.Scale,“TrainedMean”,trainingSetup.bn4b_branch2b.TrainedMean,“TrainedVariance”,trainingSetup.bn4b_branch2b.TrainedVariance)]; |
| lgraph = addLayers(lgraph,tempLayers); |
| tempLayers = [ |
| additionLayer(2,“Name”,“res4b”) |
| reluLayer(“Name”,“res4b_relu”)]; |
| lgraph = addLayers(lgraph,tempLayers); |
| tempLayers = [ |
| convolution2dLayer([3 3],512,“Name”,“res5a_branch2a”,“BiasLearnRateFactor”,0,“Padding”,[1 1 1 1],“Stride”,[2 2],“Bias”,trainingSetup.res5a_branch2a.Bias,“Weights”,trainingSetup.res5a_branch2a.Weights) |
| batchNormalizationLayer(“Name”,“bn5a_branch2a”,“Offset”,trainingSetup.bn5a_branch2a.Offset,“Scale”,trainingSetup.bn5a_branch2a.Scale,“TrainedMean”,trainingSetup.bn5a_branch2a.TrainedMean,“TrainedVariance”,trainingSetup.bn5a_branch2a.TrainedVariance) |
| reluLayer(“Name”,“res5a_branch2a_relu”) |
| convolution2dLayer([3 3],512,“Name”,“res5a_branch2b”,“BiasLearnRateFactor”,0,“Padding”,[1 1 1 1],“Bias”,trainingSetup.res5a_branch2b.Bias,“Weights”,trainingSetup.res5a_branch2b.Weights) |
| batchNormalizationLayer(“Name”,“bn5a_branch2b”,“Offset”,trainingSetup.bn5a_branch2b.Offset,“Scale”,trainingSetup.bn5a_branch2b.Scale,“TrainedMean”,trainingSetup.bn5a_branch2b.TrainedMean,“TrainedVariance”,trainingSetup.bn5a_branch2b.TrainedVariance)]; |
| lgraph = addLayers(lgraph,tempLayers); |
| tempLayers = [ |
| convolution2dLayer([1 1],512,“Name”,“res5a_branch1”,“BiasLearnRateFactor”,0,“Stride”,[2 2],“Bias”,trainingSetup.res5a_branch1.Bias,“Weights”,trainingSetup.res5a_branch1.Weights) |
| batchNormalizationLayer(“Name”,“bn5a_branch1”,“Offset”,trainingSetup.bn5a_branch1.Offset,“Scale”,trainingSetup.bn5a_branch1.Scale,“TrainedMean”,trainingSetup.bn5a_branch1.TrainedMean,“TrainedVariance”,trainingSetup.bn5a_branch1.TrainedVariance)]; |
| lgraph = addLayers(lgraph,tempLayers); |
| tempLayers = [ |
| additionLayer(2,“Name”,“res5a”) |
| reluLayer(“Name”,“res5a_relu”)]; |
| lgraph = addLayers(lgraph,tempLayers); |
| tempLayers = [ |
| convolution2dLayer([3 3],512,“Name”,“res5b_branch2a”,“BiasLearnRateFactor”,0,“Padding”,[1 1 1 1],“Bias”,trainingSetup.res5b_branch2a.Bias,“Weights”,trainingSetup.res5b_branch2a.Weights) |
| batchNormalizationLayer(“Name”,“bn5b_branch2a”,“Offset”,trainingSetup.bn5b_branch2a.Offset,“Scale”,trainingSetup.bn5b_branch2a.Scale,“TrainedMean”,trainingSetup.bn5b_branch2a.TrainedMean,“TrainedVariance”,trainingSetup.bn5b_branch2a.TrainedVariance) |
| reluLayer(“Name”,“res5b_branch2a_relu”) |
| convolution2dLayer([3 3],512,“Name”,“res5b_branch2b”,“BiasLearnRateFactor”,0,“Padding”,[1 1 1 1],“Bias”,trainingSetup.res5b_branch2b.Bias,“Weights”,trainingSetup.res5b_branch2b.Weights) |
| batchNormalizationLayer(“Name”,“bn5b_branch2b”,“Offset”,trainingSetup.bn5b_branch2b.Offset,“Scale”,trainingSetup.bn5b_branch2b.Scale,“TrainedMean”,trainingSetup.bn5b_branch2b.TrainedMean,“TrainedVariance”,trainingSetup.bn5b_branch2b.TrainedVariance)]; |
| lgraph = addLayers(lgraph,tempLayers); |
| tempLayers = [ |
| additionLayer(2,“Name”,“res5b”) |
| reluLayer(“Name”,“res5b_relu”) |
| globalAveragePooling2dLayer(“Name”,“pool5”) |
| fullyConnectedLayer(2,“Name”,“fc”) |
| softmaxLayer(“Name”,“prob”) |
| classificationLayer(“Name”,“classoutput”)]; |
| lgraph = addLayers(lgraph,tempLayers); |
| % clean up helper variable |
| clear tempLayers; |
| ➄ Connect Layer Branches: |
| lgraph = connectLayers(lgraph,“pool1”,“res2a_branch2a”); |
| lgraph = connectLayers(lgraph,“pool1”,“res2a/in2”); |
| lgraph = connectLayers(lgraph,“bn2a_branch2b”,“res2a/in1”); |
| lgraph = connectLayers(lgraph,“res2a_relu”,“res2b_branch2a”); |
| lgraph = connectLayers(lgraph,“res2a_relu”,“res2b/in2”); |
| lgraph = connectLayers(lgraph,“bn2b_branch2b”,“res2b/in1”); |
| lgraph = connectLayers(lgraph,“res2b_relu”,“res3a_branch2a”); |
| lgraph = connectLayers(lgraph,“res2b_relu”,“res3a_branch1”); |
| lgraph = connectLayers(lgraph,“bn3a_branch2b”,“res3a/in1”); |
| lgraph = connectLayers(lgraph,“bn3a_branch1”,“res3a/in2”); |
| lgraph = connectLayers(lgraph,“res3a_relu”,“res3b_branch2a”); |
| lgraph = connectLayers(lgraph,“res3a_relu”,“res3b/in2”); |
| lgraph = connectLayers(lgraph,“bn3b_branch2b”,“res3b/in1”); |
| lgraph = connectLayers(lgraph,“res3b_relu”,“res4a_branch2a”); |
| lgraph = connectLayers(lgraph,“res3b_relu”,“res4a_branch1”); |
| lgraph = connectLayers(lgraph,“bn4a_branch2b”,“res4a/in1”); |
| lgraph = connectLayers(lgraph,“bn4a_branch1”,“res4a/in2”); |
| lgraph = connectLayers(lgraph,“res4a_relu”,“res4b_branch2a”); |
| lgraph = connectLayers(lgraph,“res4a_relu”,“res4b/in2”); |
| lgraph = connectLayers(lgraph,“bn4b_branch2b”,“res4b/in1”); |
| lgraph = connectLayers(lgraph,“res4b_relu”,“res5a_branch2a”); |
| lgraph = connectLayers(lgraph,“res4b_relu”,“res5a_branch1”); |
| lgraph = connectLayers(lgraph,“bn5a_branch2b”,“res5a/in1”); |
| lgraph = connectLayers(lgraph,“bn5a_branch1”,“res5a/in2”); |
| lgraph = connectLayers(lgraph,“res5a_relu”,“res5b_branch2a”); |
| lgraph = connectLayers(lgraph,“res5a_relu”,“res5b/in2”); |
| lgraph = connectLayers(lgraph,“bn5b_branch2b”,“res5b/in1”); |
| ➅ Train Network: |
| [net, traininfo] = trainNetwork(augimdsTrain,lgraph,opts); |
| Additional code |
| ➆ Grad-CAM: |
| label = classify(trainedNetwork_1,Image) |
| scoreMap = gradCAM(trainedNetwork_1,Image,label); |
| figure |
| imshow(Image) |
| hold on |
| imagesc(scoreMap,‘AlphaData’,0.5) |
| colormap jet |
| ➇ ImageLIME: |
| label = classify(trainedNetwork_1,Image) |
| scoreMap = imageLIME(trainedNetwork_1,Image,label); |
| figure |
| imshow(Image) |
| hold on |
| imagesc(scoreMap,‘AlphaData’,0.5) |
| colormap jet |
| ➈ Occlusion sensitivity: |
| label = classify(trainedNetwork_1,Image) |
| scoreMap = occlusionSensitivity(trainedNetwork_1,Image,label); |
| figure |
| imshow(Image) |
| hold on |
| imagesc(scoreMap,‘AlphaData’,0.5) |
| colormap jet |
References
- Lee, Y.; Terry, R.; Lukes, R.J. Lymph node biopsy for diagnosis: A statistical study. J. Surg. Oncol. 1980, 14, 53–60. [Google Scholar] [CrossRef] [PubMed]
- Frauenfeld, L.; Campo, E. Advances in the Classification of Aggressive B-cell Lymphomas. Adv. Anat. Pathol. 2025, 32, 208–219. [Google Scholar] [CrossRef]
- Arber, D.A.; Campo, E.; Jaffe, E.S. Advances in the Classification of Myeloid and Lymphoid Neoplasms. Virchows Arch. 2023, 482, 1–9. [Google Scholar] [CrossRef] [PubMed]
- Silkenstedt, E.; Salles, G.; Campo, E.; Dreyling, M. B-cell non-Hodgkin lymphomas. Lancet 2024, 403, 1791–1807. [Google Scholar] [CrossRef] [PubMed]
- Ikoma, H.; Carreras, J.; Kikuti, Y.Y.; Miyaoka, M.; Nagase, S.; Kondo, Y.; Ito, A.; Orita, M.; Tomita, S.; Hiraiwa, S.; et al. Comparison of the Mutational Profile between BCL2- and BCL6-Rearrangement Positive Follicular Lymphoma. J. Mol. Diagn. 2025, in press. [Google Scholar] [CrossRef] [PubMed]
- Campo, E.; Jaffe, E.S.; Cook, J.R.; Quintanilla-Martinez, L.; Swerdlow, S.H.; Anderson, K.C.; Brousset, P.; Cerroni, L.; de Leval, L.; Dirnhofer, S.; et al. The International Consensus Classification of Mature Lymphoid Neoplasms: A report from the Clinical Advisory Committee. Blood 2022, 140, 1229–1253. [Google Scholar] [CrossRef]
- de Leval, L.; Jaffe, E.S. Lymphoma Classification. Cancer J. 2020, 26, 176–185. [Google Scholar] [CrossRef] [PubMed]
- Campo, E.; Dierickx, D.; Dirnhofer, S.; Dunleavy, K.; Gaulard, P.; Hasserjian, R.P.; Jaffe, E.S.; Kim, W.S.; King, R.L.; Lim, M.S.; et al. Lymphoma Classifications, How to Develop a Future Unified Taxonomy. J. Clin. Oncol. 2024, 42, 3177–3182. [Google Scholar] [CrossRef]
- Hilton, L.K.; Collinge, B.; Ben-Neriah, S.; Alduaij, W.; Shaalan, H.; Weng, A.P.; Cruz, M.; Slack, G.W.; Farinha, P.; Miyata-Takata, T.; et al. Motive and opportunity: MYC rearrangements in high-grade B-cell lymphoma with MYC and BCL2 rearrangements (an LLMPP study). Blood 2024, 144, 525–540. [Google Scholar] [CrossRef]
- Harris, N.; Nathwani, B.; Swerdlow, S.H. Follicular Lymphoma. In WHO Classification Tumours of Haematopoietic and Lymphoid Tissues; Swerdlow, S., Campo, E., Harris, N., Pileri, S., Stein, H., Jaffe, E.S., Eds.; IARC: Lyon, France, 2008; pp. 220–226. [Google Scholar]
- Swerdlow, S.H.; Campo, E.; Harris, N.L.; Jaffe, E.S.; Pileri, S.A.; Stein, H.; Thiele, J. WHO Classification of Tumours of Haematopoietic and Lymphoid Tissues. WHO Classification of Tumours, Revised, 4th ed.; World Health Organization: Geneva, Switzerland, 2017; Volume 2, ISBN 13 9789283244943. [Google Scholar]
- Jaffe, E.S.; Arber, D.A.; Campo, E.; Quintanilla-Fend, F.; Orazi, A.; Rimsza, L.M.; Swerdlow, S.H. Hematopathology, 3rd ed.; Elsevier: Amsterdam, The Netherlands, 2024; ISBN 978032383165. [Google Scholar]
- Alaggio, R.; Amador, C.; Anagnostopoulos, I.; Attygalle, A.D.; Araujo, I.B.O.; Berti, E.; Bhagat, G.; Borges, A.M.; Boyer, D.; Calaminici, M.; et al. The 5th edition of the World Health Organization Classification of Haematolymphoid Tumours: Lymphoid Neoplasms. Leukemia 2022, 36, 1720–1748. [Google Scholar] [CrossRef]
- Hartmann, S.; Hansmann, M.L. Reactive lymphadenopathies. Pathologie 2022, 43, 271–281. [Google Scholar] [CrossRef]
- Faraz, M.; Rosado, F.G.N. Reactive Lymphadenopathies. Clin. Lab. Med. 2021, 41, 433–451. [Google Scholar] [CrossRef] [PubMed]
- Song, X.; Duan, R.; Duan, L.; Wei, L. Current knowledge of the immune reconstitution inflammatory syndrome in Whipple disease: A review. Front. Immunol. 2023, 14, 1265414. [Google Scholar] [CrossRef] [PubMed]
- Lagerstrom, I.T.; Danielson, D.T.; Muir, J.M.; Foss, R.D.; Auerbach, A.; Aguilera, N.S. A Comprehensive Review of Kimura Disease. Head Neck Pathol. 2025, 19, 75. [Google Scholar] [CrossRef] [PubMed]
- Yu, S.C.; Chen, H.H.; Lin, P.Y. Necrosis in lymph nodes and their differential diagnoses: Application of reticulin staining. Virchows Arch. 2024, 485, 137–142. [Google Scholar] [CrossRef] [PubMed]
- Abdu, A.; Pajkrt, D.; Bijker, E.M. Kikuchi Disease in Children: Case Report and Review of the Literature. Pediatr. Infect. Dis. J. 2022, 41, 199–204. [Google Scholar] [CrossRef]
- Weiss, L.M.; O’Malley, D. Benign lymphadenopathies. Mod. Pathol. 2013, 26 (Suppl. S1), S88–S96. [Google Scholar] [CrossRef]
- Chen, C.; Mat Isa, N.A.; Liu, X. A review of convolutional neural network based methods for medical image classification. Comput. Biol. Med. 2025, 185, 109507. [Google Scholar] [CrossRef]
- He, K.; Zhang, X.; Ren, S.; Sun, J. Deep Residual Learning for Image Recognition. arXiv 2015, arXiv:1512.03385. [Google Scholar] [CrossRef]
- Carreras, J.; Roncador, G.; Hamoudi, R. Dataset and AI Workflow for Deep Learning Image Classification of Ulcerative Colitis and Colorectal Cancer. Data 2025, 10, 99. [Google Scholar] [CrossRef]
- Carreras, J. Celiac Disease Deep Learning Image Classification Using Convolutional Neural Networks. J. Imaging 2024, 10, 200. [Google Scholar] [CrossRef]
- Carreras, J.; Roncador, G.; Hamoudi, R. Ulcerative Colitis, LAIR1 and TOX2 Expression, and Colorectal Cancer Deep Learning Image Classification Using Convolutional Neural Networks. Cancers 2024, 16, 4230. [Google Scholar] [CrossRef] [PubMed]
- He, K.; Zhang, X.; Ren, S.; Sun, J. Deep Residual Learning for Image Recognition. In Proceedings of the 2016 IEEE Conference on Computer Vision and Pattern Recognition (CVPR), Las Vegas, NV, USA, 27–30 June 2016; pp. 770–778. [Google Scholar] [CrossRef]
- Abdullakutty, F.; Akbari, Y.; Al-Maadeed, S.; Bouridane, A.; Talaat, I.M.; Hamoudi, R. Histopathology in focus: A review on explainable multi-modal approaches for breast cancer diagnosis. Front. Med. 2024, 11, 1450103. [Google Scholar] [CrossRef] [PubMed]
- Ghasemi, A.; Hashtarkhani, S.; Schwartz, D.L.; Shaban-Nejad, A. Explainable artificial intelligence in breast cancer detection and risk prediction: A systematic scoping review. Cancer Innov. 2024, 3, e136. [Google Scholar] [CrossRef] [PubMed]
- Haupt, M.; Maurer, M.H.; Thomas, R.P. Explainable Artificial Intelligence in Radiological Cardiovascular Imaging-A Systematic Review. Diagnostics 2025, 15, 1399. [Google Scholar] [CrossRef] [PubMed]
- Teng, Z.; Li, L.; Xin, Z.; Xiang, D.; Huang, J.; Zhou, H.; Shi, F.; Zhu, W.; Cai, J.; Peng, T.; et al. A literature review of artificial intelligence (AI) for medical image segmentation: From AI and explainable AI to trustworthy AI. Quant. Imaging Med. Surg. 2024, 14, 9620–9652. [Google Scholar] [CrossRef] [PubMed]
- Hashimoto, N.; Ko, K.; Yokota, T.; Kohno, K.; Nakaguro, M.; Nakamura, S.; Takeuchi, I.; Hontani, H. Subtype classification of malignant lymphoma using immunohistochemical staining pattern. Int. J. Comput. Assist. Radiol. Surg. 2022, 17, 1379–1389. [Google Scholar] [CrossRef]
- Achi, H.E.; Belousova, T.; Chen, L.; Wahed, A.; Wang, I.; Hu, Z.; Kanaan, Z.; Rios, A.; Nguyen, A.N.D. Automated Diagnosis of Lymphoma with Digital Pathology Images Using Deep Learning. Ann. Clin. Lab. Sci. 2019, 49, 153–160. [Google Scholar]
- Yamaguchi, S.; Isokawa, T.; Matsui, N.; Kamiura, N.; Tsuruyama, T. AI system for diagnosing mucosa-associated lymphoid tissue lymphoma and diffuse large B cell lymphoma using ImageNet and hematoxylin and eosin-stained specimens. PNAS Nexus 2025, 4, pgaf137. [Google Scholar] [CrossRef] [PubMed] [PubMed Central]
- Li, D.; Bledsoe, J.R.; Zeng, Y.; Liu, W.; Hu, Y.; Bi, K.; Liang, A.; Li, S. A deep learning diagnostic platform for diffuse large B-cell lymphoma with high accuracy across multiple hospitals. Nat. Commun. 2020, 11, 6004. [Google Scholar] [CrossRef]
- Kilim, O.; Baskay, J.; Biricz, A.; Bedohazi, Z.; Pollner, P.; Csabai, I. Transfer learning may explain pigeons’ ability to detect cancer in histopathology. Bioinspir. Biomim. 2024, 19, 056016. [Google Scholar] [CrossRef]
- Ameen, Z.S.; Mubarak, A.S.; Hamad, M.; Hamoudi, R.; Jemimah, S.; Ozsahin, D.U.; Hamad, M. Incorporating time as a third dimension in transcriptomic analysis using machine learning and explainable AI. Comput. Biol. Chem. 2025, 117, 108432. [Google Scholar] [CrossRef]
- Wang, X.; Zhao, J.; Marostica, E.; Yuan, W.; Jin, J.; Zhang, J.; Li, R.; Tang, H.; Wang, K.; Li, Y.; et al. A pathology foundation model for cancer diagnosis and prognosis prediction. Nature 2024, 634, 970–978. [Google Scholar] [CrossRef] [PubMed]
- Dos Santos, G.C.; Araujo, A.L.D.; de Amorim, H.A.; Giraldo-Roldan, D.; de Sousa-Neto, S.S.; Vargas, P.A.; Kowalski, L.P.; Santos-Silva, A.R.; Lopes, M.A.; Moraes, M.C. Feasibility study of ResNet-50 in the distinction of intraoral neural tumors using histopathological images. J. Oral Pathol. Med. 2024, 53, 444–450. [Google Scholar] [CrossRef] [PubMed]
- Wu, R.; Chen, Z.; Yu, J.; Lai, P.; Chen, X.; Han, A.; Xu, M.; Fan, Z.; Cheng, B.; Jiang, Y.; et al. A graph-learning based model for automatic diagnosis of Sjogren’s syndrome on digital pathological images: A multicentre cohort study. J. Transl. Med. 2024, 22, 748. [Google Scholar] [CrossRef] [PubMed]
- Carreras, J. Artificial Intelligence Analysis of Celiac Disease Using an Autoimmune Discovery Transcriptomic Panel Highlighted Pathogenic Genes including BTLA. Healthcare 2022, 10, 1550. [Google Scholar] [CrossRef] [PubMed]
- Finzel, B. Current methods in explainable artificial intelligence and future prospects for integrative physiology. Pflugers Arch. 2025, 477, 513–529. [Google Scholar] [CrossRef] [PubMed]
- Sano, M.; Kanatani, Y.; Ueda, T.; Nemoto, S.; Miyake, Y.; Tomita, N.; Suzuki, H. Explainable artificial intelligence for prediction of refractory ulcerative colitis: Analysis of a Japanese Nationwide Registry. Ann. Med. 2025, 57, 2499960. [Google Scholar] [CrossRef]
- Saw, S.N.; Yan, Y.Y.; Ng, K.H. Current status and future directions of explainable artificial intelligence in medical imaging. Eur. J. Radiol. 2025, 183, 111884. [Google Scholar] [CrossRef]
- Zeiler, M.D.; Fergus, R. Visualizing and Understanding Convolutional Networks. In Computer Vision–ECCV 2014; Lecture Notes in Computer Science; Fleet, D., Pajdla, T., Schiele, B., Tuytelaars, T., Eds.; Springer: Cham, Switzerland, 2014; Volume 8689. [Google Scholar]
- Ribeiro, M.; Singh, S.; Guestrin, C. “Why should I trust you?”: Explaining the predictions of any classifier. In Proceedings of the Meeting of the Association for Computational Linguistics, Berlin, Germany, 7–12 August 2016; pp. 97–101. [Google Scholar]
- Mitra, U.; Sarkar, P.; Mondal, J.; Kundu, J. Enhancing Interpretability in Diabetics Prediction: A Comparative Study of SHAP, LIME and Permutation Feature Importance. In Proceedings of the 2025 AI-Driven Smart Healthcare for Society 5.0, Kolkata, India, 14–15 February 2025; pp. 1–6. [Google Scholar] [CrossRef]
- Selvaraju, R.R.; Cogswell, M.; Das, A.; Vedantam, R.; Parikh, D.; Batra, D. Grad-CAM: Visual Explanations from Deep Networks via Gradient-Based Localization. In Proceedings of the 2017 IEEE Conference on Computer Vision, Venice, Italy, 22–29 October 2017; pp. 618–626. [Google Scholar] [CrossRef]
- Iwamoto, R.; Nishikawa, T.; Musangile, F.Y.; Matsuzaki, I.; Sagan, K.; Nishikawa, M.; Mikasa, Y.; Takahashi, Y.; Kojima, F.; Hori, Y.; et al. Small sized centroblasts as poor prognostic factor in follicular lymphoma—Based on artificial intelligence analysis. Comput. Biol. Med. 2024, 178, 108774. [Google Scholar] [CrossRef] [PubMed]
- Friedberg, J.W. Update on follicular lymphoma. Hematol. Oncol. 2023, 41 (Suppl. S1), 43–47. [Google Scholar] [CrossRef] [PubMed]
- Laurent, C.; Cook, J.R.; Yoshino, T.; Quintanilla-Martinez, L.; Jaffe, E.S. Follicular lymphoma and marginal zone lymphoma: How many diseases? Virchows Arch. 2023, 482, 149–162. [Google Scholar] [CrossRef] [PubMed]
- Mozas, P.; Sorigue, M.; Lopez-Guillermo, A. Follicular lymphoma: An update on diagnosis, prognosis, and management. Med. Clin. 2021, 157, 440–448. [Google Scholar] [CrossRef] [PubMed]
- Fu, Y.; Huang, Z.; Deng, X.; Xu, L.; Liu, Y.; Zhang, M.; Liu, J.; Huang, B. Artificial Intelligence in Lymphoma Histopathology: Systematic Review. J. Med. Internet Res. 2025, 27, e62851. [Google Scholar] [CrossRef] [PubMed]
- Koga, R.; Koide, S.; Tanaka, H.; Taguchi, K.; Kugler, M.; Yokota, T.; Ohshima, K.; Miyoshi, H.; Nagaishi, M.; Hashimoto, N.; et al. A study of criteria for grading follicular lymphoma using a cell type classifier from pathology images based on complementary-label learning. Micron 2024, 184, 103663. [Google Scholar] [CrossRef] [PubMed]
- Tsakiroglou, A.M.; Bacon, C.M.; Shingleton, D.; Slavin, G.; Vogiatzis, P.; Byers, R.; Carey, C.; Fergie, M. Lymphoma triage from H&E using AI for improved clinical management. J. Clin. Pathol. 2024, 78, 28–33. [Google Scholar]
- Miyoshi, H.; Sato, K.; Kabeya, Y.; Yonezawa, S.; Nakano, H.; Takeuchi, Y.; Ozawa, I.; Higo, S.; Yanagida, E.; Yamada, K.; et al. Deep learning shows the capability of high-level computer-aided diagnosis in malignant lymphoma. Lab. Investig. 2020, 100, 1300–1310. [Google Scholar] [CrossRef] [PubMed]
- Carreras, J.; Yukie Kikuti, Y.; Miyaoka, M.; Miyahara, S.; Roncador, G.; Hamoudi, R.; Nakamura, N. Artificial Intelligence Analysis and Reverse Engineering of Molecular Subtypes of Diffuse Large B-Cell Lymphoma Using Gene Expression Data. BioMedInformatics 2024, 4, 295–320. [Google Scholar] [CrossRef]
- Carreras, J.; Hamoudi, R. Anomaly Detection and Artificial Intelligence Identified the Pathogenic Role of Apoptosis and RELB Proto-Oncogene, NF-kB Subunit in Diffuse Large B-Cell Lymphoma. BioMedInformatics 2024, 4, 1480–1505. [Google Scholar] [CrossRef]
- Carreras, J.; Hamoudi, R.; Nakamura, N. Artificial intelligence and classification of mature lymphoid neoplasms. Explor. Target. Antitumor Ther. 2024, 5, 332–348. [Google Scholar] [CrossRef] [PubMed] [PubMed Central]
- Palanica, A.; Fossat, Y. Medication Name Comprehension of Intelligent Virtual Assistants: A Comparison of Amazon Alexa, Google Assistant, and Apple Siri Between 2019 and 2021. Front. Digit. Health 2021, 3, 669971. [Google Scholar] [CrossRef] [PubMed] [PubMed Central]
- Yang, S.; Lee, J.; Sezgin, E.; Bridge, J.; Lin, S. Clinical Advice by Voice Assistants on Postpartum Depression: Cross-Sectional Investigation Using Apple Siri, Amazon Alexa, Google Assistant, and Microsoft Cortana. JMIR Mhealth Uhealth 2021, 9, e24045. [Google Scholar] [CrossRef] [PubMed] [PubMed Central]
- Hong, G.; Folcarelli, A.; Less, J.; Wang, C.; Erbasi, N.; Lin, S. Voice Assistants and Cancer Screening: A Comparison of Alexa, Siri, Google Assistant, and Cortana. Ann. Fam. Med. 2021, 19, 447–449. [Google Scholar] [CrossRef] [PubMed] [PubMed Central]
- Orlofsky, S.; Wozniak, K. Older adults’ experiences using Alexa. Geriatr. Nurs. 2022, 48, 247–257. [Google Scholar] [CrossRef] [PubMed]
- Schindler-Ruwisch, J.; Palancia Esposito, C. “Alexa, Am I pregnant?”: A content analysis of a virtual assistant’s responses to prenatal health questions during the COVID-19 pandemic. Patient Educ. Couns. 2021, 104, 460–463. [Google Scholar] [CrossRef] [PubMed] [PubMed Central]
- Esposito, C.P.; Schindler-Ruwisch, J. “Alexa, did the pandemic make you smarter?” A follow up content analysis of a virtual assistant’s responses to a prenatal query. Inform. Health Soc. Care 2023, 48, 231–238. [Google Scholar] [CrossRef] [PubMed]
- Chen, Y.; Elenee Argentinis, J.D.; Weber, G. IBM Watson: How Cognitive Computing Can Be Applied to Big Data Challenges in Life Sciences Research. Clin. Ther. 2016, 38, 688–701. [Google Scholar] [CrossRef] [PubMed]
- Pesce, F.; Albanese, F.; Mallardi, D.; Rossini, M.; Pasculli, G.; Suavo-Bulzis, P.; Granata, A.; Brunetti, A.; Cascarano, G.D.; Bevilacqua, V.; et al. Identification of glomerulosclerosis using IBM Watson and shallow neural networks. J. Nephrol. 2022, 35, 1235–1242. [Google Scholar] [CrossRef] [PubMed] [PubMed Central]
- Hoyt, R.E.; Snider, D.; Thompson, C.; Mantravadi, S. IBM Watson Analytics: Automating Visualization, Descriptive, and Predictive Statistics. JMIR Public Health Surveill. 2016, 2, e157. [Google Scholar] [CrossRef] [PubMed] [PubMed Central]
- Zhou, Z.; Qin, P.; Cheng, X.; Shao, M.; Ren, Z.; Zhao, Y.; Li, Q.; Liu, L. ChatGPT in Oncology Diagnosis and Treatment: Applications, Legal and Ethical Challenges. Curr. Oncol. Rep. 2025, 27, 336–354. [Google Scholar] [CrossRef] [PubMed]
- Zhou, M.; Pan, Y.; Zhang, Y.; Song, X.; Zhou, Y. Evaluating AI-generated patient education materials for spinal surgeries: Comparative analysis of readability and DISCERN quality across ChatGPT and deepseek models. Int. J. Med. Inform. 2025, 198, 105871. [Google Scholar] [CrossRef] [PubMed]
- Chytas, D.; Noussios, G.; Paraskevas, G.; Vasiliadis, A.V.; Giovanidis, G.; Troupis, T. Can ChatGPT play a significant role in anatomy education? A scoping review. Morphologie 2025, 109, 100949. [Google Scholar] [CrossRef] [PubMed]
- Liu, Y.; Kong, W.; Merve, K. ChatGPT applications in academic writing: A review of potential, limitations, and ethical challenges. Arq. Bras. Oftalmol. 2025, 88, e2024-0269. [Google Scholar] [CrossRef] [PubMed]
- Akyol Onder, E.N.; Ensari, E.; Ertan, P. ChatGPT-4o’s performance on pediatric Vesicoureteral reflux. J. Pediatr. Urol. 2025, 21, 504–509. [Google Scholar] [CrossRef] [PubMed]
- Mese, I.; Kocak, B. ChatGPT as an effective tool for quality evaluation of radiomics research. Eur. Radiol. 2025, 35, 2030–2042. [Google Scholar] [CrossRef] [PubMed]
- Fei, N.; Lu, Z.; Gao, Y.; Yang, G.; Huo, Y.; Wen, J.; Lu, H.; Song, R.; Gao, X.; Xiang, T.; et al. Towards artificial general intelligence via a multimodal foundation model. Nat. Commun. 2022, 13, 3094. [Google Scholar] [CrossRef] [PubMed] [PubMed Central]
- Carreras, J. The pathobiology of follicular lymphoma. J. Clin. Exp. Hematop. 2023, 63, 152–163. [Google Scholar] [CrossRef]


| (1) Follicular and nodular patterns | Follicular hyperplasia | |
| Autoimmune disorders | Luetic lymphadenitis, Castleman disease hyaline vascular type, progressive transformation of germinal centers, mantle zone hyperplasia, and mycobacterial spindle cell pseudotumor | |
| (2) Predominant sinus patterns | Sinus histiocytosis | Non-specific, specific etiology such as prosthesis and Whipple disease, vascular transformation of sinuses, and hemophagocytic lymphohistiocytosis |
| (3) Interfollicular or mixed pattern | Paracortical hyperplasia and dermatopathic reaction, granulomatous lymphadenitis, IgG4-related lymphadenopathy, Kimura disease, toxoplasmic lymphadenitis, systemic lupus erythematosus, Kikuchi disease, inflammatory pseudotumor, and bacillary angiomatosis | |
| (4) Diffuse pattern | Infectious mononucleosis, cytomegalovirus infection, herpes simplex lymphadenitis, and dilantin lymphadenopathy | |
| Follicular Lymphoma | Follicular Hyperplasia | |
|---|---|---|
| Follicles with predominance of centrocytes | ○○○ | × |
| Interfollicular centrocytes | ○○○ | × |
| Vascular invasion of centrocytes | ○○○ | × |
| Extracapsular follicles | ○○ | × |
| Close packing of follicles | ○○ | × |
| Sclerosis | ○○ | × |
| Diffuse areas | ○○ | × |
| Absence of mantle zones | ○ | × |
| Absence of starry-sky pattern | ○ | × |
| Follicular Lymphoma (FL) (True) | ||||||||||
| Predicted | FL1 | FL2 | FL3 | FL4 | FL5 | FL6 | FL7 | FL8 | FL9 | FL10 |
| FL | 3992 | 1546 | 280 | 5146 | 7900 | 5180 | 13,126 | 4023 | 23,791 | 15,304 |
| Reactive | 542 | 1 | 0 | 16 | 36 | 1204 | 149 | 0 | 7 | 1 |
| Total | 4534 | 1547 | 280 | 5180 | 7936 | 6384 | 13,275 | 4023 | 23,798 | 15,305 |
| FL % | 88.1% | 99.9% | 100% | 99.7% | 99.6% | 81.1% | 98.9% | 100% | 99.9% | 99.9% |
| Reactive Lymphoid Tissue (R) (True) | ||||||||||
| Predicted | R1 | R2 | R3 | R4 | R5 | R6 | R7 | R8 | R9 | R10 |
| FL | 31 | 17 | 0 | 1689 | 1076 | 1039 | 11,857 | 240 | 1095 | 3767 |
| Reactive | 4269 | 7680 | 2754 | 33,880 | 3082 | 8463 | 6872 | 10,068 | 1029 | 5176 |
| Total | 4300 | 7697 | 2754 | 35,569 | 4158 | 9502 | 18,729 | 10,308 | 2124 | 8943 |
| Reactive % | 99.3% | 99.8% | 100% | 95.3% | 74.1% | 89.1% | 36.7% | 97.7% | 48.5% | 57.9% |
Disclaimer/Publisher’s Note: The statements, opinions and data contained in all publications are solely those of the individual author(s) and contributor(s) and not of MDPI and/or the editor(s). MDPI and/or the editor(s) disclaim responsibility for any injury to people or property resulting from any ideas, methods, instructions or products referred to in the content. |
© 2025 by the authors. Licensee MDPI, Basel, Switzerland. This article is an open access article distributed under the terms and conditions of the Creative Commons Attribution (CC BY) license (https://creativecommons.org/licenses/by/4.0/).
Share and Cite
Carreras, J.; Ikoma, H.; Kikuti, Y.Y.; Nagase, S.; Ito, A.; Orita, M.; Tomita, S.; Tanigaki, Y.; Nakamura, N.; Masugi, Y. Histological Image Classification Between Follicular Lymphoma and Reactive Lymphoid Tissue Using Deep Learning and Explainable Artificial Intelligence (XAI). Cancers 2025, 17, 2428. https://doi.org/10.3390/cancers17152428
Carreras J, Ikoma H, Kikuti YY, Nagase S, Ito A, Orita M, Tomita S, Tanigaki Y, Nakamura N, Masugi Y. Histological Image Classification Between Follicular Lymphoma and Reactive Lymphoid Tissue Using Deep Learning and Explainable Artificial Intelligence (XAI). Cancers. 2025; 17(15):2428. https://doi.org/10.3390/cancers17152428
Chicago/Turabian StyleCarreras, Joaquim, Haruka Ikoma, Yara Yukie Kikuti, Shunsuke Nagase, Atsushi Ito, Makoto Orita, Sakura Tomita, Yuki Tanigaki, Naoya Nakamura, and Yohei Masugi. 2025. "Histological Image Classification Between Follicular Lymphoma and Reactive Lymphoid Tissue Using Deep Learning and Explainable Artificial Intelligence (XAI)" Cancers 17, no. 15: 2428. https://doi.org/10.3390/cancers17152428
APA StyleCarreras, J., Ikoma, H., Kikuti, Y. Y., Nagase, S., Ito, A., Orita, M., Tomita, S., Tanigaki, Y., Nakamura, N., & Masugi, Y. (2025). Histological Image Classification Between Follicular Lymphoma and Reactive Lymphoid Tissue Using Deep Learning and Explainable Artificial Intelligence (XAI). Cancers, 17(15), 2428. https://doi.org/10.3390/cancers17152428