Article

Multivariate Framework of Metabolism in Advanced Prostate Cancer Using Whole Abdominal and Pelvic Hyperpolarized 13C MRI—A Correlative Study with Clinical Outcomes

1
Department of Radiology and Biomedical Imaging, University of California, San Francisco, CA 94158, USA
2
Helen Diller Family Comprehensive Cancer Center, University of California, San Francisco, CA 94158, USA
*
Author to whom correspondence should be addressed.
Cancers 2025, 17(13), 2211; https://doi.org/10.3390/cancers17132211
Submission received: 2 April 2025 / Revised: 5 June 2025 / Accepted: 27 June 2025 / Published: 1 July 2025

Simple Summary

A novel hyperpolarized (HP) 13C MRI-specific multivariate framework was developed and evaluated in 16 patients with advanced or metastatic prostate cancer using radiomic-compliant feature definitions. From three basic metabolic maps (kPL, pyruvate summed-over-time, and mean pyruvate time), 316 features were extracted to construct univariate and multivariate risk classifiers. In the univariate analysis, patient subgroup with lower median kPL had significantly longer PFS (11.2 vs. 0.5 months, p < 0.01) and OS (NR vs. 18.4 months, p < 0.05). A multivariate classifier also identified a lower-risk group with better outcomes. Despite limitations like small sample size and retrospective design, findings strongly support future investigation into prognostic values of these HP multivariate markers in prostate cancer.

Abstract

Background: Most of the existing hyperpolarized (HP) 13C MRI analyses use univariate rate maps of pyruvate-to-lactate conversion (kPL), and radiomic-style multiparametric models extracting complex, higher-order features remain unexplored. Purpose: To establish a multivariate framework based on whole abdomen/pelvis HP 13C-pyruvate MRI and evaluate the association between multiparametric features of metabolism (MFM) and clinical outcome measures in advanced and metastatic prostate cancer. Methods: Retrospective statistical analysis was performed on 16 participants with metastatic or local-regionally advanced prostate cancer prospectively enrolled in a tertiary center who underwent HP-pyruvate MRI of abdomen or pelvis between November 2020 and May 2023. Five patients were hormone-sensitive and eleven were castration-resistant. GMP-grade [1-13C]pyruvate was polarized using a 5T clinical-research DNP polarizer, and HP MRI used a set of flexible vest-transmit, array-receive coils, and echo-planar imaging sequences. Three basic metabolic maps (kPL, pyruvate summed-over-time, and mean pyruvate time) were created by semi-automatic segmentation, from which 316 MFMs were extracted using an open-source, radiomic-compliant software package. Univariate risk classifier was constructed using a biologically meaningful feature (kPL,median), and the multivariate classifier used a two-step feature selection process (ranking and clustering). Both were correlated with progression-free survival (PFS) and overall survival (OS) (median follow-up = 22.0 months) using Cox proportional hazards model. Results: In the univariate analysis, patients harboring tumors with lower-kPL,median had longer PFS (11.2 vs. 0.5 months, p < 0.01) and OS (NR vs. 18.4 months, p < 0.05) than their higher-kPL,median counterparts. Using a hypothesis-generating, age-adjusted multivariate risk classifier, the lower-risk subgroup also had longer PFS (NR vs. 2.4 months, p < 0.002) and OS (NR vs. 18.4 months, p < 0.05). By contrast, established laboratory markers, including PSA, lactate dehydrogenase, and alkaline phosphatase, were not significantly associated with PFS or OS (p > 0.05). Key limitations of this study include small sample size, retrospective study design, and referral bias. Conclusions: Risk classifiers derived from select multiparametric HP features were significantly associated with clinically meaningful outcome measures in this small, heterogeneous patient cohort, strongly supporting further investigation into their prognostic values.

1. Introduction

Recent years have seen a rapidly shifting landscape in the clinical management of advanced prostate cancer. Triplet regimens combining androgen receptor (AR)-targeted and cytotoxic drugs have prolonged survival in metastatic hormone-sensitive disease [1]; the approval of PARP inhibitors benefits select men carrying genetic vulnerabilities associated with DNA double-strand damage repairs [2], and PSMA-targeted Lutetium-177 radioligand therapy demonstrated an improvement in overall survival in a recent phase 3 trial in the post-taxane metastatic castration resistant (CRPC) setting [3].
These latest advances present oncologists and patients with a widening array of therapies both in the frontline and salvage settings. Concurrently, optimizing the selection, sequencing, and combination of treatments becomes more critical than ever. Non-invasive molecular imaging biomarkers offer an appealing methodology for the characterization of cancer biology, early assessment of therapeutic efficacy, and prognostic and predictive utility.
Hyperpolarized (HP) 13C-pyruvate MRI is a rapid 5 min, non-radioactive molecular MRI technology that has demonstrated both excellent safety and reproducible findings of cellular metabolism at over 15 research facilities globally in 1000+ cancer patients and normal volunteers [4,5]. The cancer Warburg effect—greatly increased lactate dehydrogenase (LDH)-driven malignant metabolism, quantifiable with HP 13C pyruvate-to-lactate conversion, is a hallmark of aggressive cancer biology, and is sensitive to early treatment response and resistance [6,7].
Despite the growing application of HP 13C MRI to characterize human prostate cancer [8,9,10,11,12,13,14,15], most of the existing analytics rely on the basic spatial distribution of pyruvate-to-lactate conversion rate (kPL) values [16,17], and currently, a paucity of effort is being made to systematically and quantitatively extract more complex underlying metabolic features—whether visible or invisible—such as shape, size, volume, texture, histogram statistics, and more.
Radiomic-style quantitative methods have become increasingly popular for extracting hundreds of rigorously defined and analytically calculated features from medical images [18,19]. These include simple first-order features describing voxel intensities such as mean, median, standard deviation, and entropy, second-order features portraying shape, texture, and patterns, as well as higher-order features derived by applying digital filters, time-frequency analysis or mathematical transforms to the original imaging data. Unlike artificial intelligence-based algorithms, which often operate through complex and opaque logic, radiomic-based feature extraction offers unambiguous definitions of HP MRI features that unifies interpretation and analysis. This provides a more direct understanding of their underlying molecular pathophysiological machinery, like Warburg metabolism, tumor microenvironment, tracer perfusion, and cellular uptake. There are suggestions that radiomics may be more robust for small-sample datasets and offer potential advantages in data-scarce scenarios compared with completely data-driven AI that directly learns obscure features from the native imaging data but requires a larger training set. This may make radiomics particularly appealing for many ongoing HP 13C studies, which are typically single-center or small multisite trials involving a relatively small number of subjects [20,21]. Nevertheless, a direct comparison is beyond the scope of our research.
Radiomic-style approaches have been utilized for feature extraction in conventional morphological MRI in different contexts such as breast cancer diagnosis and classification of brain tumor subtypes [22,23], as well as in a few molecular imaging modalities, including PET and SPECT [24,25,26,27]. Despite the smaller sample size available among the rapidly emerging field of HP 13C MRI research, there is growing enthusiasm for the use of such methodologies to conduct advanced image analytics just like its conventional and nuclear imaging counterparts, yet this angle remains largely unexplored [28]. To our knowledge, no prior work applied radiomic-style feature extraction for HP 13C MRI data.
This study evaluated a new radiomic-compliant multivariate quantitative framework to extract and characterize multiparametric features of metabolism (MFM) in advanced prostate cancer using cutting-edge abdomen/pelvis HP 13C MRI techniques and examined the correlation between these MFMs and clinical outcome measures using (1) a simple univariate and (2) a hypothesis-generating multivariate correlative analyses in a small set of patients.

2. Materials and Methods

2.1. Patient Demographics

Retrospective analysis was conducted on patients with locally advanced or metastatic prostate cancer prospectively enrolled in a HP 13C MRI study (NCT04346225) between November 2020 and May 2023. Key inclusion criteria included histologic and radiographic evidence of locally advanced or metastatic prostate cancer, presence of at least one target lesion amenable to HP 13C MRI, which met the conditions of either osseous lesion(s) visible on CT or MR or soft tissue lesion(s) measuring at least 1cm on cross-sectional imaging, and an ECOG status of 0 or 1. All participants (N = 16) were examined for and confirmed eligibility prior to enrollment. Written informed consent was obtained from all study participants. Follow-up data was available for all participants until either the event-of-interest, last day of follow-up, or lost to follow-up.

2.2. Hyperpolarization Methods

A mixture of 1.46 g of GMP-grade [1-13C]pyruvic acid (ISOTEC, MilliporeSigma, Burlington, MA, USA) and electroparamagnetic agent (EPA) AH111501 was loaded into a pharmacy kit and hyperpolarized for 2.5–3 h at 0.8 K in a 5T clinical-research DNP polarizer (SPINlab, GE healthcare, Chicago, IL, USA). The pyruvate mixture was then rapidly dissoluted, neutralized with an NaOH buffer, and underwent terminal sterilization. Prior to the delivery of each pyruvate dose to the patients, a pharmacist released the drug upon ensuring all quality control (QC) parameters were compliant with published safety/sterility criteria [29]. A summary of some recorded QC parameters included pyruvate concentration = 243 ± 13 mM, polarization = 33.9 ± 5.4%, pH = 7.6 ± 0.3, EPA concentration = 1.4 ± 1.0 mM, dose temperature = 30.3 ± 2.7 °C. Averaged time from dissolution to injection was = 53 ± 8 s.

2.3. Hyperpolarized 13C MRI Exam of Abdomen/Pelvis—Planning and Execution

The most recent clinical restaging scans (including CT, MR, and bone scans, subject to availability) were reviewed by HP 13C MRI scientists (HYC, RAB) and experienced clinical-research radiologists (MAO, ZJW) subspecialized in genitourinary cancers. An imaging plan was devised by identifying the target lesions of interest and corresponding coil placement via the consensus among these researchers.
The hyperpolarized exam was conducted using a clinical 3T MRI scanner (MR750, GE Healthcare, IL, USA) equipped with multi-nuclear spectroscopy package. The HP 13C imaging used a pairing of vest-shaped flexible transmitter and an 8-channel flexible array receiver (QTAR, Clinical MR Solutions, Brookfield, WI, USA), as previously described [30], which provided an approximately 32 × 24 × 22cm coverage in (LR, AP, SI) dimensions, respectively (Figure 1). The 1H MRI used the body coil transmit and a 21-channel flexible array (“AIR” coils, GE Healthcare) receive. RF transmit power on the 13C band was calibrated using a dimethyl silicone phantom prior to each MRI exam, and the center frequency was dialed in using a predefined scale-down factor from 1H frequency during the exam [31].
A 2D multislice EPI sequence was prescribed over the active region of the 13C coils targeting abdomen/pelvis with either 1.5 or 2 cm in-plane, 2 cm through-plane, and 3 s temporal resolutions [32]. Matrix size in (LR, AP, SI) was 22 × 22 × 15 for 1.5cm or 16 × 16 × 15 for 2cm resolutions. Excitation flip angles for pyruvate and lactate were set to 15° and 30°, respectively. Alanine images (30° flip angle) were additionally acquired for liver metastasis cases but excluded from the formal analysis due to its undetermined biological role in prostate cancer [33].
Proton MRI protocol of the abdomen or pelvis was tailored to the targets of interest per patient, which entailed a pre-contrast and multiphase post-contrast T1 fast-spoiled-gradient-echo sequences, T2 single-shot FSE, diffusion weighted imaging with b = 50 and 800, and a three-point Dixon sequence providing fat, water, and B0 field maps. A T2-short-tau-inversion-recovery imaging sequence was used to detect bone marrow abnormalities. In cases involving liver metastases, hepatobiliary phase images were acquired 15–20 min after intravenous contrast (gadoxetic acid) when feasible.

2.4. Multiparametric Feature Extraction and Analysis

Tumor ROIs were segmented using 3D Slicer [34] semi-automatically by a researcher with 7+ years of experience interpretating both HP 13C and 1H MRI of advanced prostate cancer (HYC). The observer first reviewed the acquired 1H images alongside clinical MRI report and prior CT/MRI images to identify any existing and new cancerous lesions. An ROI is defined for any lesion found within the imaging volume, including metastatic lesions to the bone, visceral organs, lymph nodes, and primary tumor site when present. The ROIs were delineated with reference to a 13C/1H pseudocolor overlay heatmap and representative 1H anatomical series, displayed side by side; this was done primarily in a qualitative fashion based on lesion shape, size, and extent on underlying 1H images but was extended whenever hotspots with elevated kPL exceeded the boundaries of 1H MRI lesion. Additionally, the identified lesions were annotated on 1H/13C images, summarized into a PowerPoint presentation for each patient, reviewed by board-certified and fellowship-trained abdominal radiologists (MAO, ZJW) as well as key research personnel (IdK, RAB, DBV), and discussed during monthly meetings. Ambiguous lesion findings on 1H MRI were consulted with the aforementioned radiologists for either confirmation or exclusion. Co-registration between 1H and 13C images were visually confirmed using key anatomical features such as the aorta, iliac arteries and kidneys.
PyRadiomics (v3.1.0) [35], an open-source Image Biomarker Standardisation Initiative (IBSI, a consensus effort to standardize the definition and extraction of imaging features aiming to improve reproducibility of radiomic research)-compliant software package based on Python (v3.8), was used to extract MRI features from three source HP parametric maps, namely pyruvate-to-lactate conversion rate (kPL), pyruvate signal summed-over-time (AUC), and mean pyruvate time (MT). To homogenize the data, these source maps were resampled from their native resolutions to 5 mm isotropic voxels. A total of 316 multiparametric features of metabolism (MFM) were extracted using PyRadiomics. Classes of extracted features included Pyradiomics’ default first-order features, as well as higher-order classes gray-level dependence matrix (GLDM), gray-level run length matrix (GLRLM), and gray-level size zone matrix (GLSZM).
kPL was calculated using an inputless two-site exchange model [36]. Mean pyruvate time was defined as the center of mass of the time-resolved pyruvate pharmacokinetic signal curve. Gray scale discretization was implemented using empirically determined bin widths of 0.001, 0.02, and 0.1 for kPL, AUC, and MT, resulting in 43, 100, and 471 bins, respectively. PET literature suggested fixed bin width yielded more reproducible measures than fixed bin count [37].

2.5. Survival Analyses Using Uni- and Multivariate Models

Clinical information was extracted from the medical chart and included patient age, race and ethnicity, clinical TNM staging, hormonal status (hormone sensitive versus castration-resistant), serological biomarkers such as prostate-specific antigen (PSA), LDH, and alkaline phosphatase (ALP), and histological subtypes from any metastatic biopsy. Note: ALP readings were missing from two participants and replaced with cohort median for the statistical analysis.
Progression-free survival (PFS) was defined as the interval between the date of HP MRI and the date of either clinical or radiographic progression, or death. Overall survival (OS) was similarly defined as the interval between the date of HP MRI and the date of death. Patients who continued to be followed up and remained event-free were censored on the last day of follow-up (October 2023), while those lost to follow-up were censored at the last date they were either known to be alive or event-free. Progression was determined according to the judgment of the treating oncologist, which typically depended on one or more of the following factors: (1) radiographic progression, (2) worsening of symptoms, and (3) switching treatment or management.
Survival analyses using uni- and multivariate Cox proportional hazards models examined the prognostic values of these MFMs. In the univariate model, p-value and Harrell’s concordance index (C-index) of PFS and OS were calculated for each individual MFM and serological feature (PSA, LDH, ALP) as correlative metrics to clinical endpoints. Regression was conducted with Cox proportional hazards model provided in the MATLAB toolbox (R2016a) which performed the likelihood ratio test to estimate the β coefficient, p-values, and covariance matrix, taking the PFS, OS data, and censoring array as inputs. C-index is the equivalent of area under receiver operating curve for survival models dealing with censored data [38].
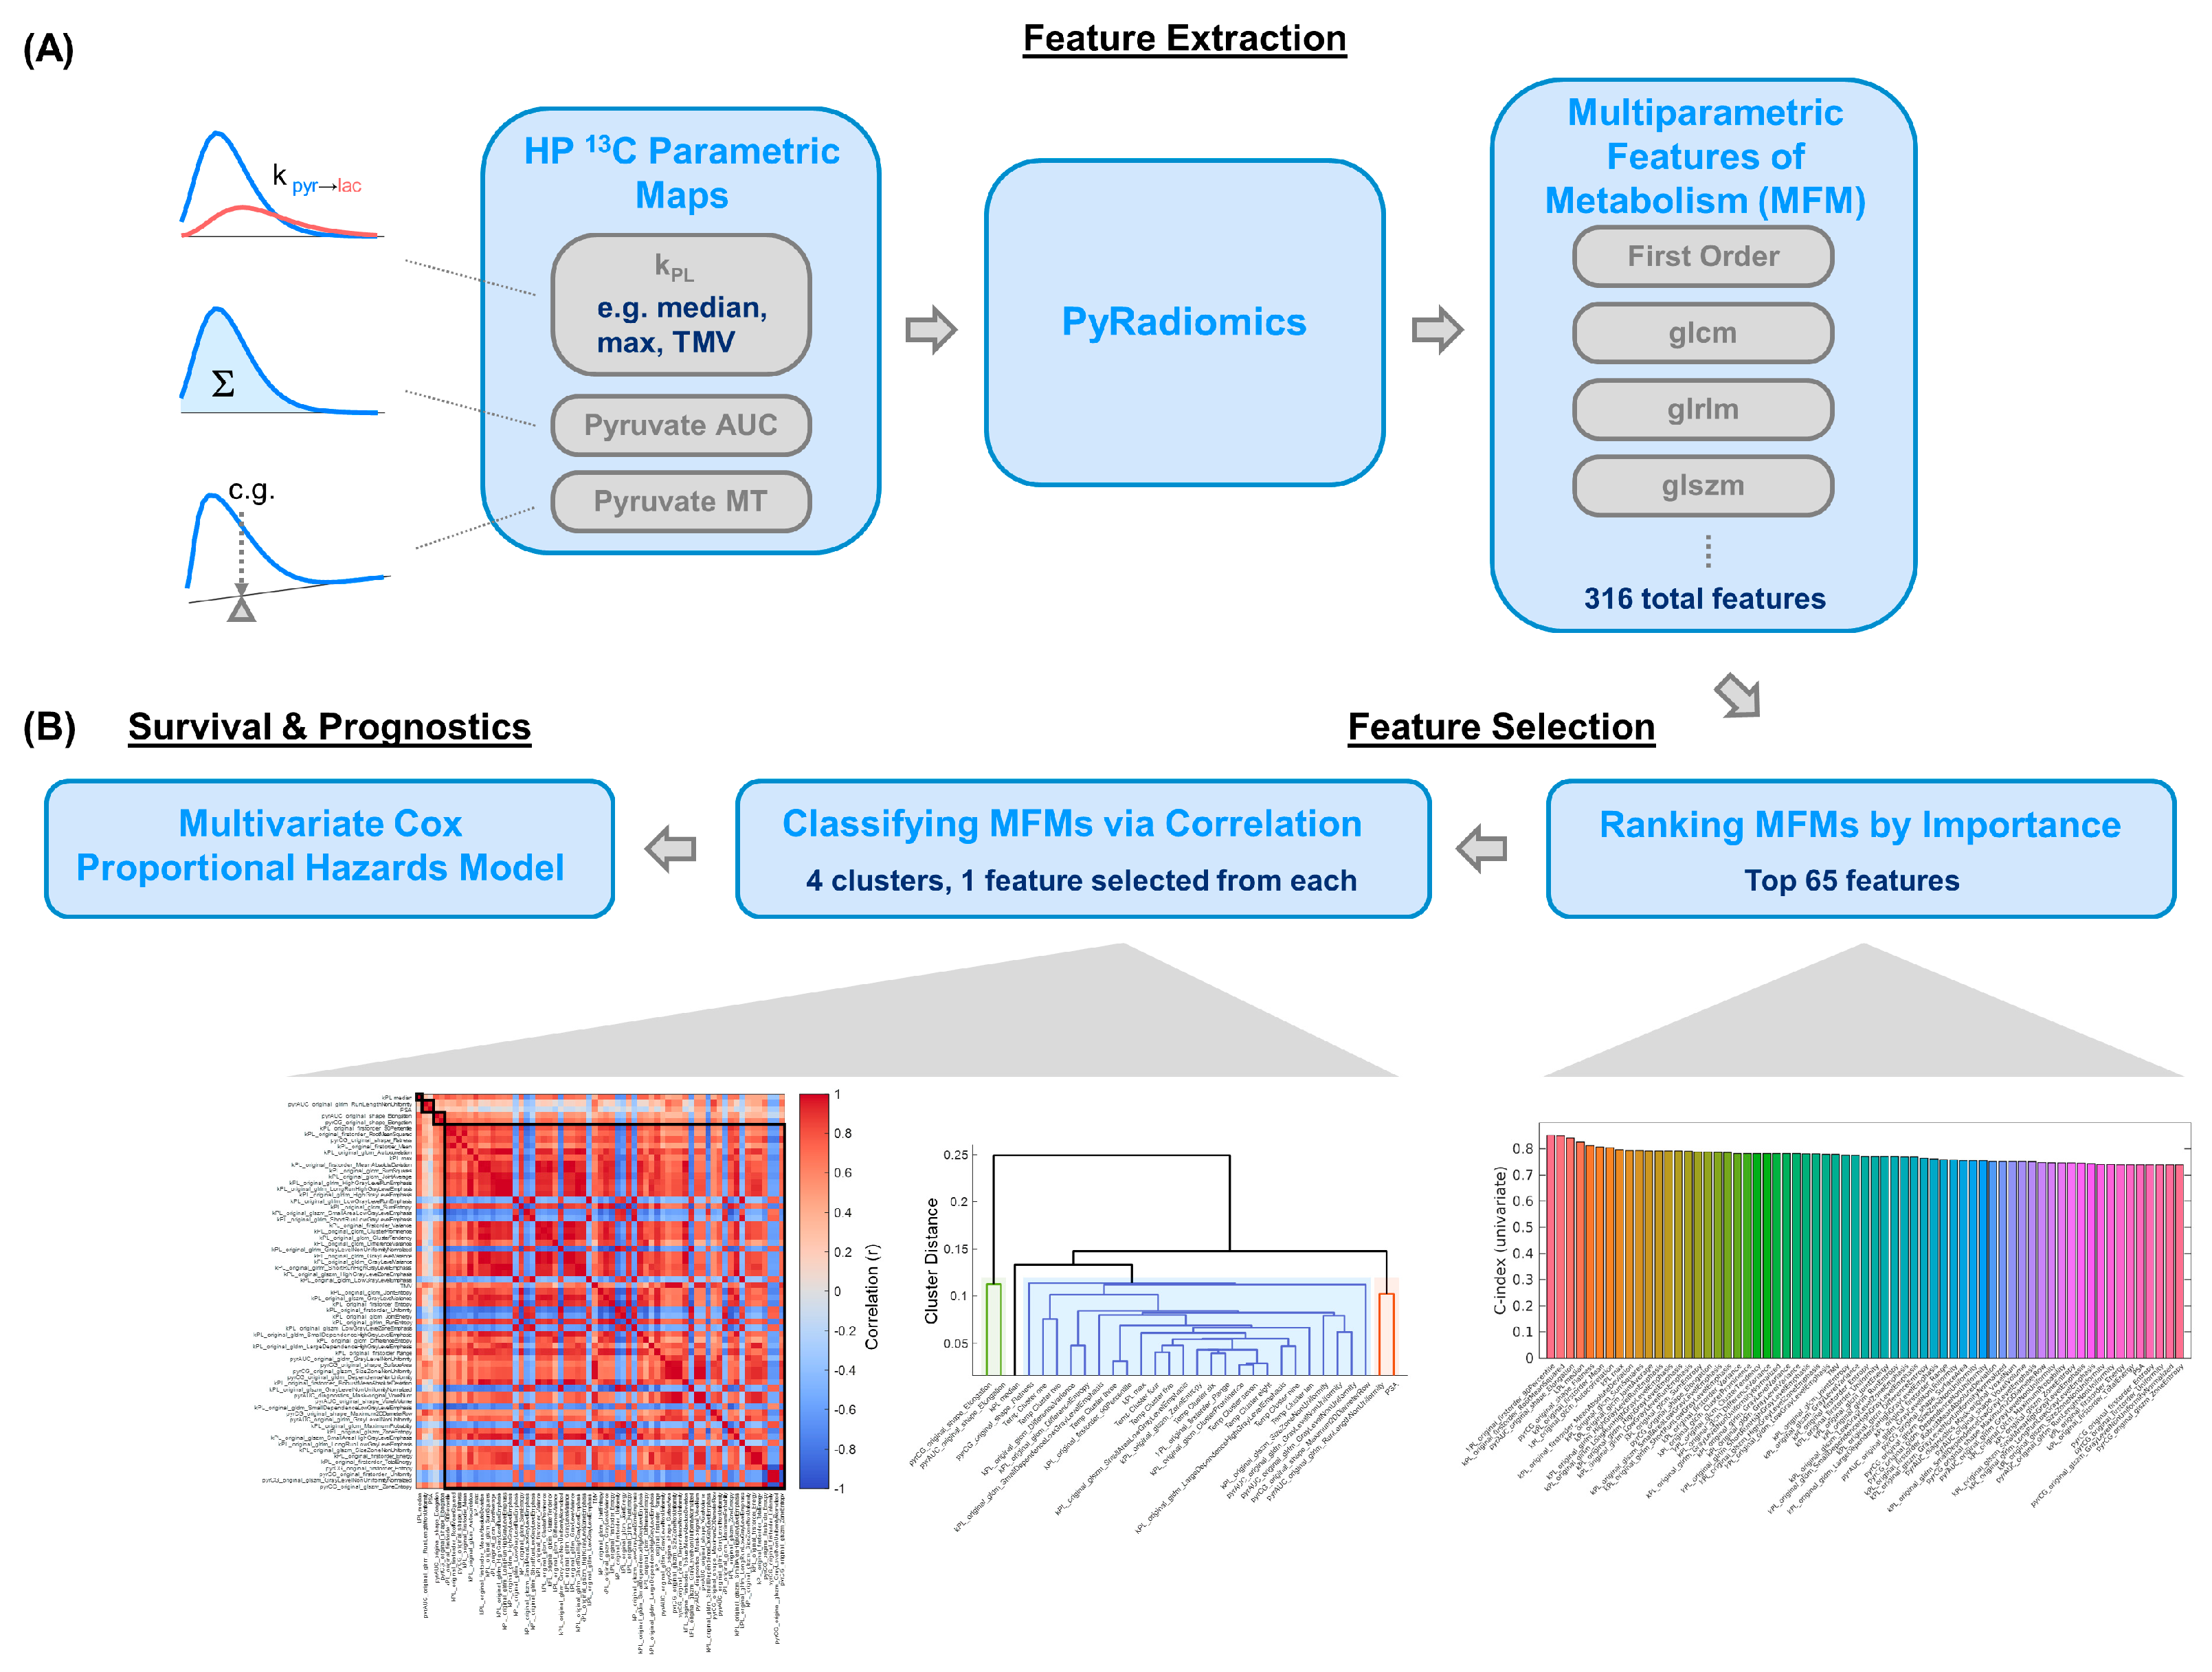
In the multivariate case, all 316 MFMs and 3 clinical serological features were initially incorporated. Feature selection (dimensional reduction, an essential process in multivariate models for identifying important MFMs and eliminating redundancy) was performed by ranking features’ importance by C-index, followed by agglomerative (hierarchical) clustering [39] classifiers to eliminate highly correlated (i.e., redundant) features.
In the ranking step, features with top 20% highest adjusted C-index were retained, resulting in 65 remaining features. The adjusted C-index was empirically defined as a weighted sum of 0.8 × C-index{PFS} + 0.2 × C-index{OS}, based on the maturity of the PFS and OS data (maturity of each survival metric was qualitatively defined as a combination of the median follow-up time, number of events, and censoring rate). The clustering step used a distance metric, defined as 1 − absolute Pearson correlation, to construct a hierarchical dendrogram “tree” with 4 branches and multiple leaf nodes on each branch, with the highest mutually dependent features located on the same leaf node [40]. The tree was reorganized into a correlogram consisting of 4 clusters for visualization, where one feature with the highest C-index was selected from each cluster. Finally, a metabolic prognostic score (MPS) was defined using the 4 selected variables and adjusted for patient age, as detailed in the results.
To determine the stability of the multivariate model and detect potential overfitting, a sensitivity analysis was conducted in a cross-validation manner. One patient dataset was withheld at a time, and Cox model regression was conducted on the remaining fifteen datasets to estimate the MPS risk classifier coefficients. Normalized standard deviation of each MPS coefficient were calculated across 16 iterations.

3. Results

3.1. Clinical Characteristics

Sixteen consecutive prostate cancer patients who underwent HP 13C MRI of the abdomen/pelvis were included in this analysis. At the time of scans, 11 patients had CRPC and 5 had hormone-sensitive prostate cancer (HSPC). Staging-wise, four patients with distant metastases had visceral metastases (M1c), eight had osseous disease with or without nodal metastases (M1b), and one had nodal metastases only (M1a). Of the locally advanced disease category, two had nearby organ invasion (T4), and one had seminal vesicle invasion (T3b) (Table 1). On a per lesion basis, the analysis included 90 metastatic lesions of the bones, 12 of the liver, 14 of the lymph nodes, and 2 of other soft tissues such as the rectal wall; there were also seven primary tumor lesions of the prostate. Of the six patients who underwent metastatic biopsy, exclusively adenocarcinoma was found in four, adenocarcinoma with focal neuroendocrine prostate cancer (NEPC) was found in one, and one was negative on histopathology (attributed to sampling error).

3.2. Univariate Model Detected Significant Correlation Between kPL and Clinical Endpoints

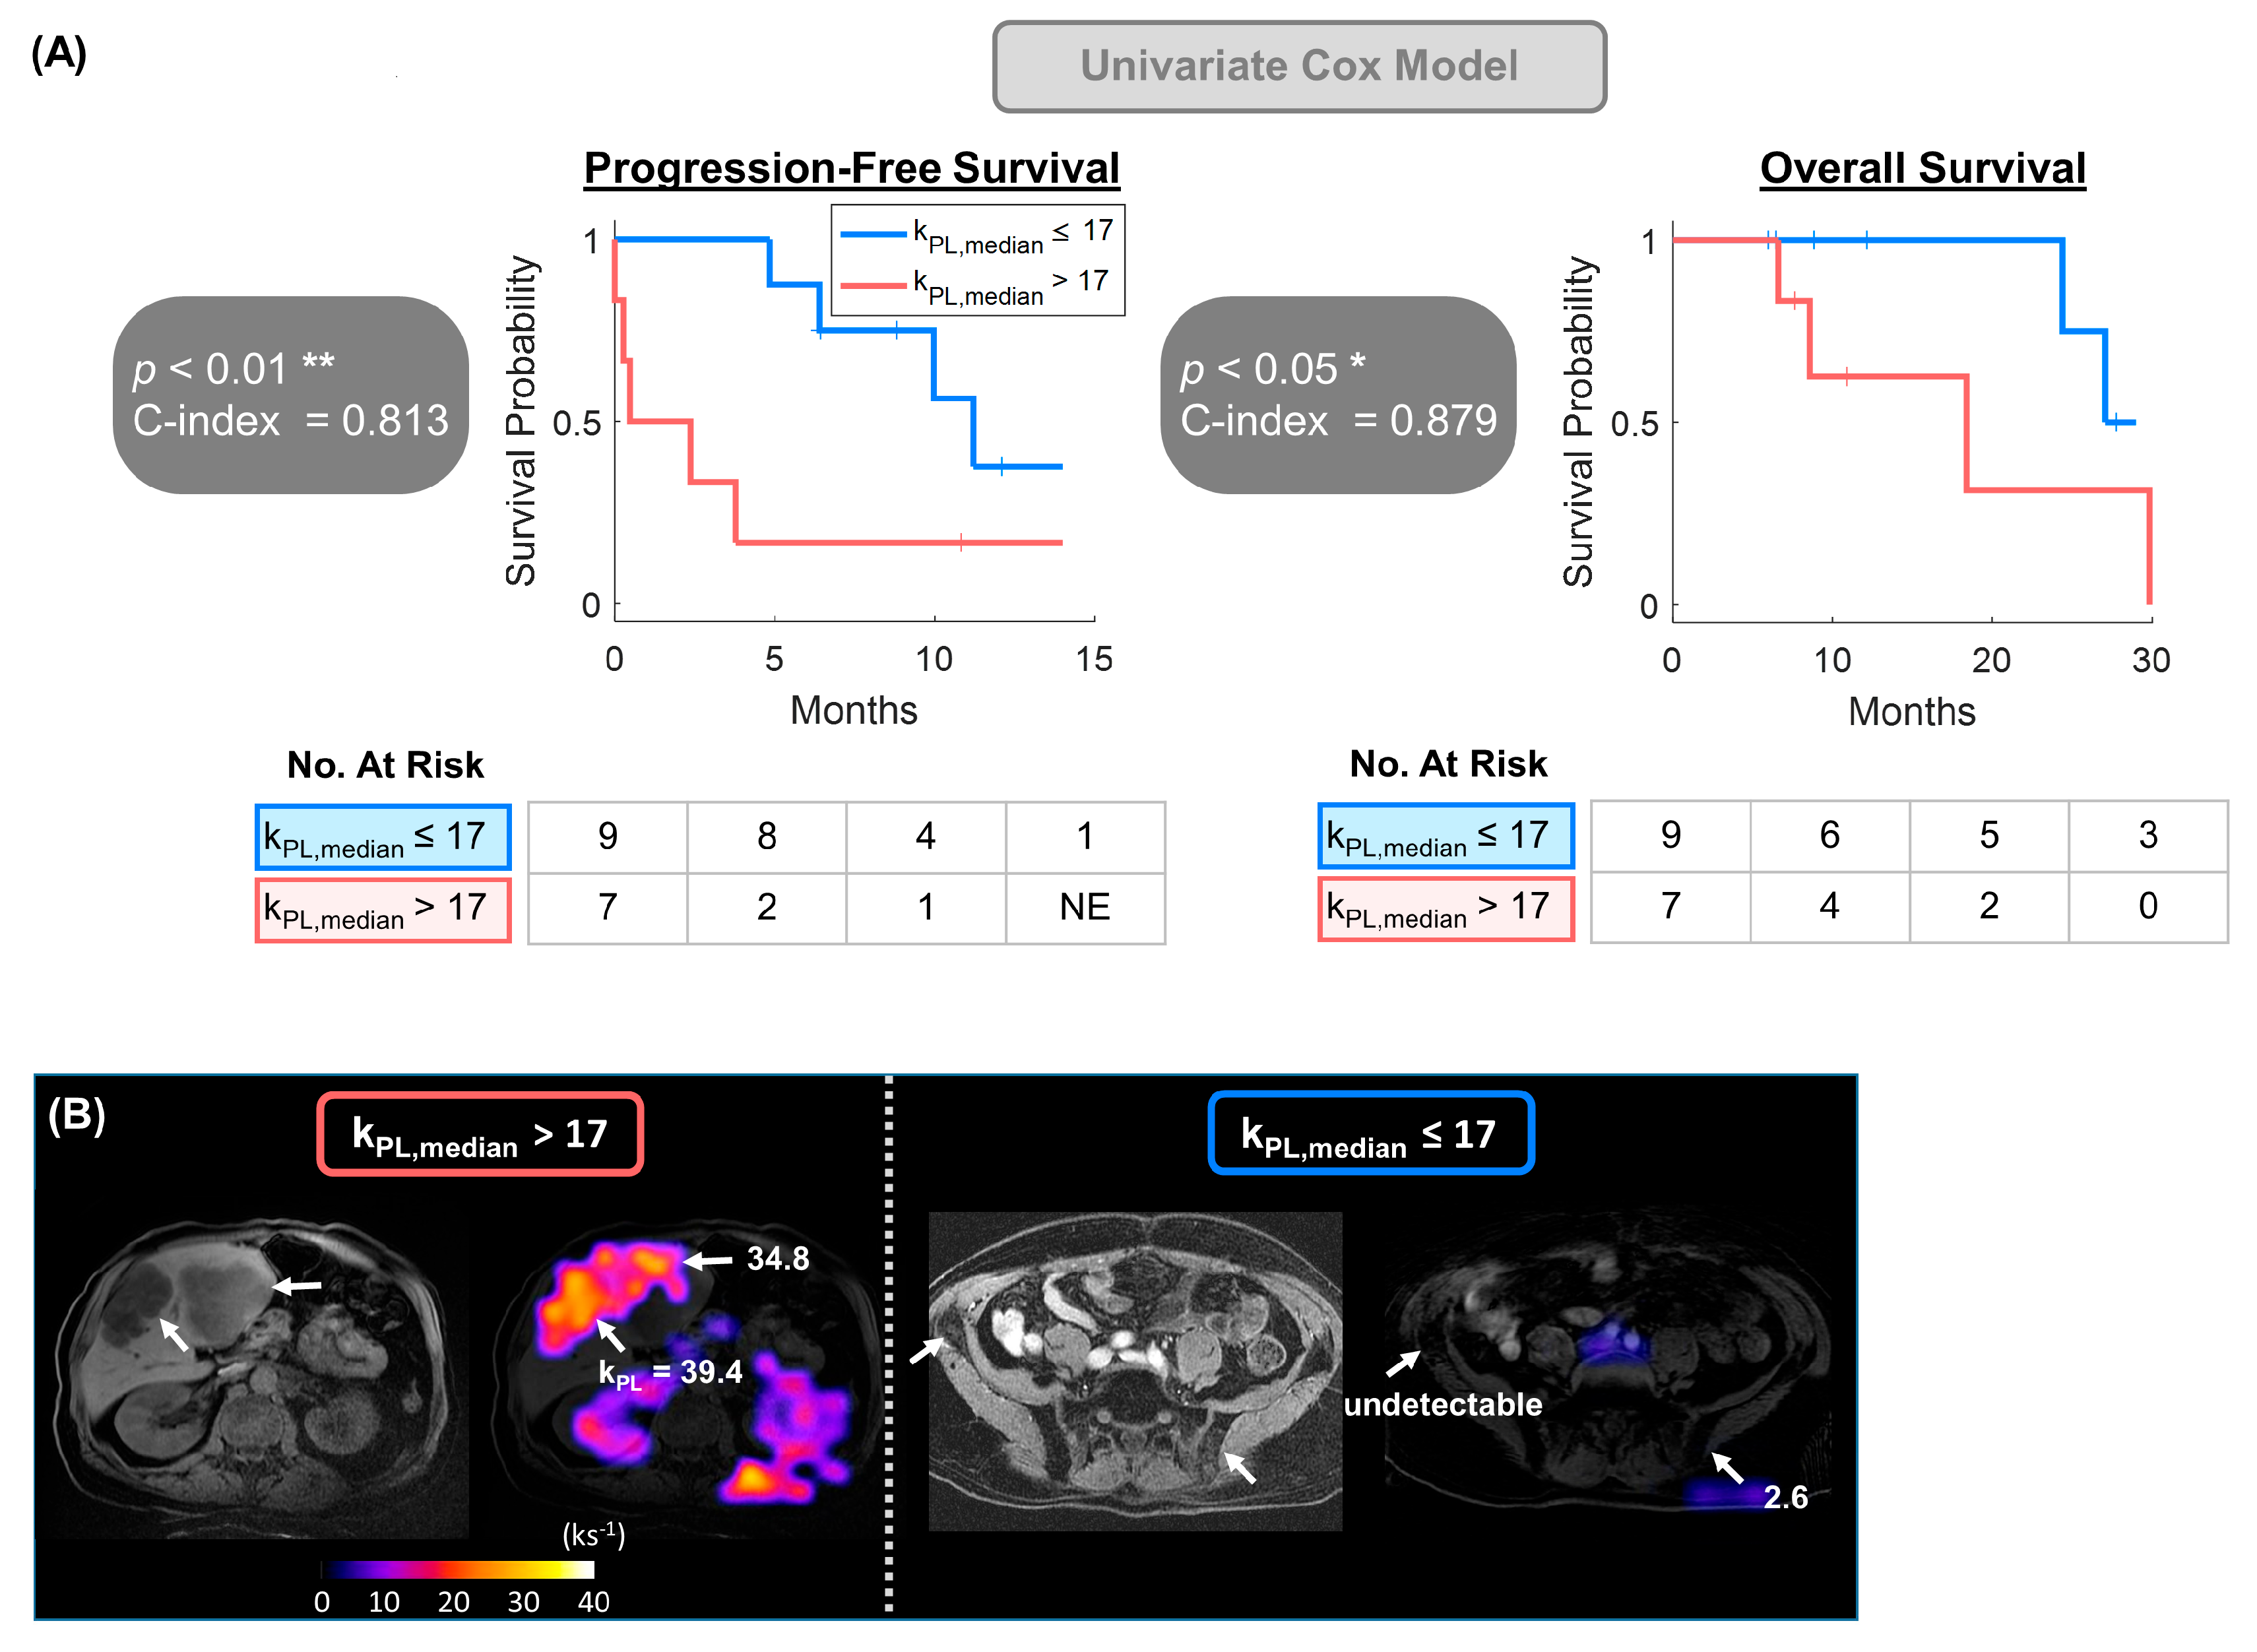
The 316 MFMs extracted out of the three basic HP parametric maps contained first-order features such as mean, median, variance, kurtosis, and total metabolic volume (TMV, total tumor volume with measurable kPL values), as well as higher-order features including GLDM, GLRLM, and GLSZM. With a median follow-up of 22.0 months, kPL,median significantly correlated with both PFS (p < 0.01) and OS (p < 0.05). Corresponding Kaplan–Meier statistics revealed significantly longer median PFS (11.2 vs. 0.5 months, C-index = 0.813, hazard ratio [HR] = 5.1; 95% confidence interval [CI]: 1.3–20.3) and OS (NR vs. 18.4 months, C-index = 0.879, HR = 6.1; CI: 1.1–32.3) in the lower- than the higher-kPL subgroup, dichotomized by a kPL,median cutoff value of 17 (ks−1) (Figure 2).
On the other hand, there was no significant difference in kPL,median as a function of hormonal status. The CRPC subgroup had kPL,median = 15 ± 11 ks−1, and the HSPC subgroup had kPL,median = 16 ± 6 ks−1 (p > 0.5).
Interestingly, serological markers, including PSA, LDH, and ALP, were not significantly associated with PFS or OS (p > 0.05) in this small cohort (Table 2).
Pearson correlative statistics (Figure 3 and a full coefficient table in Supplemental Figure S1) identified a strongly negative correlation between kPL kurtosis and OS (r = −0.75), and moderately negative correlations between kPL,median with OS (r = −0.45), kPL,max with both PFS (r = −0.48) and OS (r = −0.54), and kurtosis with PFS (r = −0.37). Correlative metrics between MFMs and serological markers revealed a moderate correlation between TMV and PSA (r = 0.55), and weak correlations between kPL,median and both PSA (r = 0.08) and LDH (r = 0.08); similarly, weak correlations were found between kPL,max and PSA (r = 0.12) and LDH (r = −0.09).

3.3. Multivariate Model Offered a Provisional Approach for Larger Future Datasets

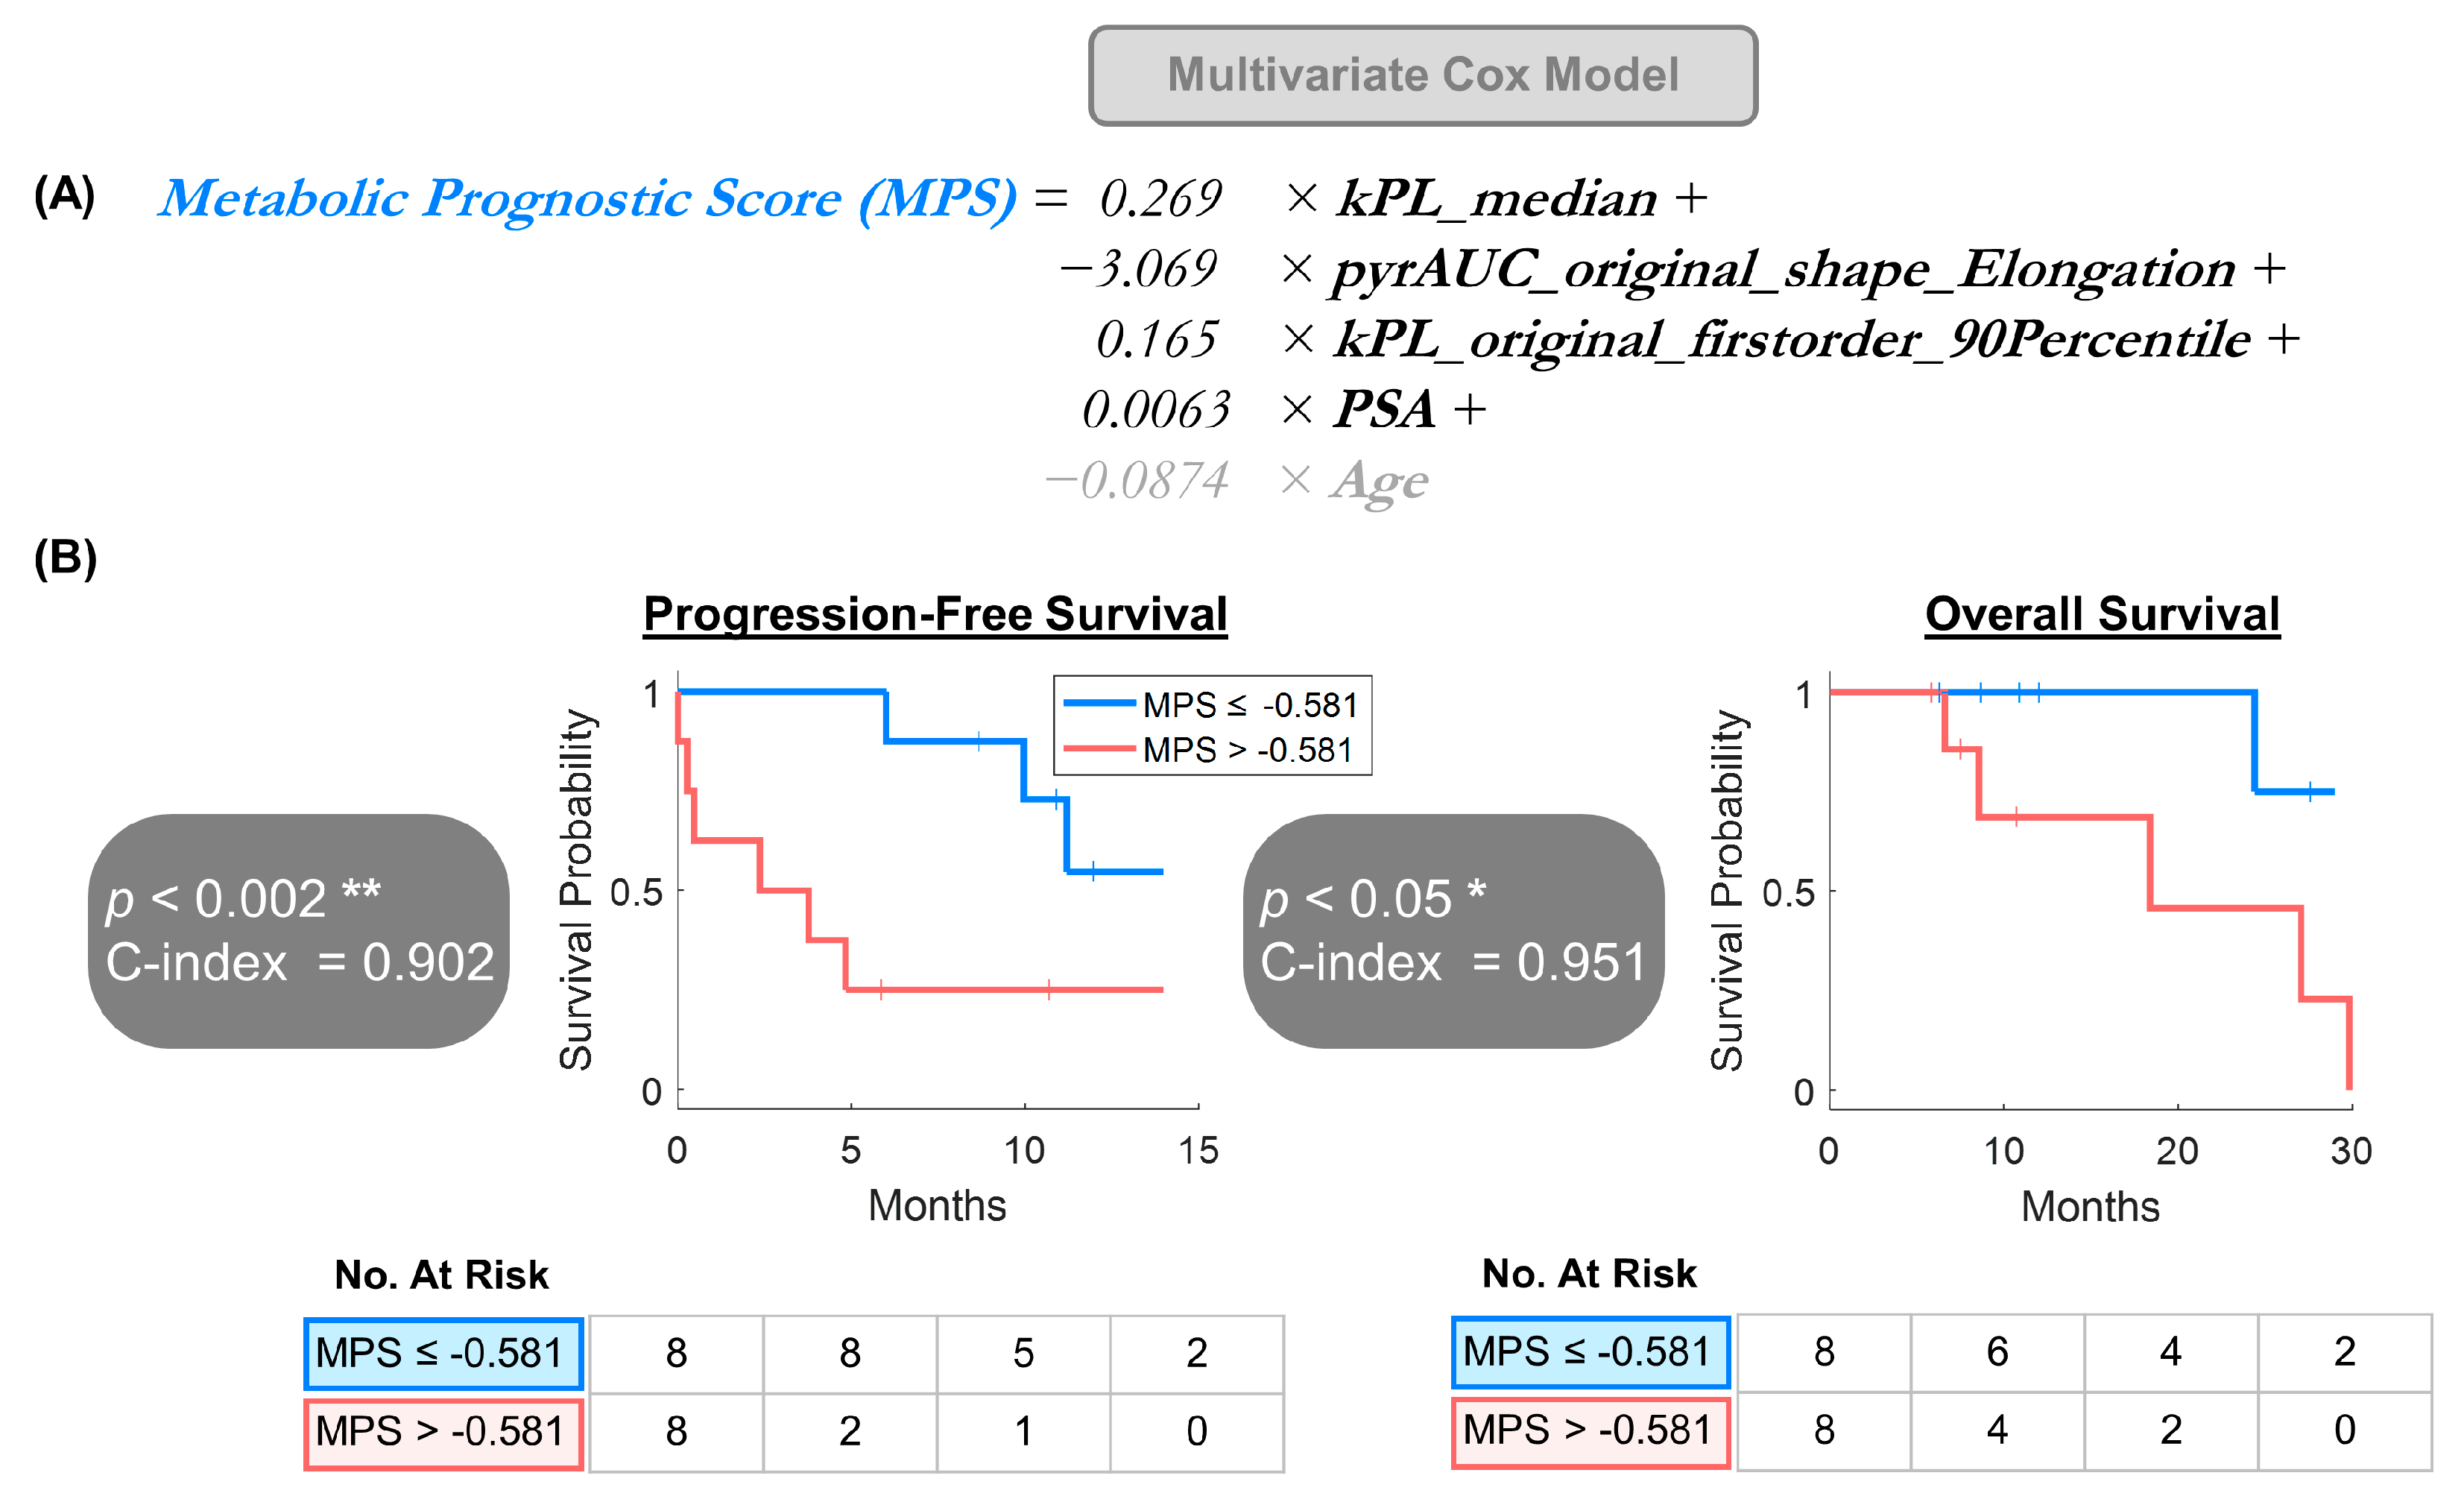
The 65 retained MFMs (top 20% highest adjusted C-indices) had a median adjusted C-index of 0.77 (range: 0.74–0.85). Agglomerative clustering identified four clusters consisting of highly correlated, redundant features, and one representative feature were selected from each while eliminating the remainders (Figure 4). Three MFMs and one serological feature were selected, namely kPL_median, pyrAUC_original_shape_Elongation, kPL_original_firstorder_90Percentile, and PSA, respectively. kPL_median was the median kPL across ROIs, pyrAUC_original_shape_Elongation represented square root aspect ratio derived from the lengths of the largest and second largest principal component axes extracted from the pyrAUC map, and kPL_original_firstorder_90Percentile stood for 90th percentile signal intensity from the kPL map. These three MFMs all belonged to the first-order feature class. The multivariate Cox proportional hazards model was constructed using a composite risk score—metabolic prognostic score (MPS), defined as a weighted combination of these four variates using the b coefficients extracted from the model regression and adjusted for patient age. A lower MPS means more favorable prognosis.
Metabolic Prognostic Score (MPS) = 0.269 × kPL_median +
                                −3.069 × pyrAUC_original_shape_Elongation +
                               0.165 × kPL_original_firstorder_90Percentile +
                0.0063 × PSA +
              −0.0874 × Age
Similarly to the univariate approach, the age-adjusted MPS significantly correlated with both PFS (p < 0.002, C-index = 0.902) and OS (p < 0.05, C-index = 0.951), with longer PFS (NR vs. 2.4 months) and OS (NR vs. 18.4 months) in the lower vs. higher MPS categories, dichotomized by the cohort median MPS = −0.581 (Figure 5).

4. Discussion

For the first time, quantitative multivariate MRI features evaluating Warburg metabolism, pyruvate uptake, and bolus profiles were methodically extracted from whole-abdomen/pelvic HP 13C-pyruvate MRI of men with advanced prostate cancer. This new framework was enabled by a combination of commercially available 13C + 1H coil array hardware, a rapid volumetric EPI acquisition, and an open-source radiomic-compliant software package. The feasibility of HP 13C MRI as a safe, 5 min addition to standard staging/restaging 1H MRI scans and the accompanying capability to calculate hundreds of MFMs—from as simple as kPL,median, kPL,max to composite, multivariate risk classifiers like MPS—may shed light on the complex metabolic behavior of aggressive prostate cancer variants associated with poor outcomes. The study results highlight HP MRI’s unique potential to provide highly prognostic relevant metabolic information noninvasively.
The early signal of statistical correlation between MFMs and clinical endpoints proved particularly encouraging, considering the substantial heterogeneity among this small study population—clinical stages ranging from locoregional to distant metastases; and variable scan timings corresponding with clinical status anywhere from remission to stable or progressive disease.
kPL,median was experientially chosen as the risk classifier for the univariate model owing to its established role as a HP biomarker of Warburg metabolism. Similarly, kPL,max turned out to be a statistically significant univariate predictor. However, we elected not to report an exhaustive predictive analysis searching through each of the 316 HP 13C multiparametric MRI features, out of the caution that many false positive findings can arise by sole probability without a strong supporting biological rationale. On the other hand, many MFMs calculated from the kPL base map will conceivably turn out positive due to redundancy and yet may not provide much additional mechanistic insight beyond simple kPL,median. Such an analysis would be better suited for the presented multivariate survival model intended for hypothesis generation.
Another interesting observation was that kPL value alone strongly discriminated patients with more favorable from unfavorable prognosis. By contrast, a recent work examining the prognostic value of PSMA-PET [41] found the SUV value to have a much weaker effect compared with other PSMA-derived metrics such as lesion count, tumor volume, and presence of distant metastases (see reference [41]’s Figure 1 forest plot and Figure 2 nomogram). Dysregulated glycolytic metabolism is essential for driving tumor cell survival, proliferation, and invasion, and kPL is known to be highly associated with cancer aggressiveness and treatment resistance [4,5]. PSMA expression levels are often modulated by prolonged hormonal therapy and may not be a direct readout of cancer aggressiveness in heavily pretreated disease [42]. The growing use of radioligand therapies could further complicate PSMA interpretation.
A few key observations from the Pearson correlation matrix (Figure 3) are worth highlighting. The weak correlations between kPL-related MFMs (kPL,median, kPL,max) and serological markers (PSA, LDH) suggested that these MFMs provided independent prognostic information not accessible via conventional clinical markers. High kPL,kurtosis reflected tumor metabolic heterogeneity resulting from treatment-induced clonal evolution and increased mutational burden [43]. This presumably gave rise to aggressive treatment-resistant variants associated with poor outcomes. The moderate correlation between metabolic tumor volume (MTV) and PSA (r = 0.55) possibly reflected these biomarkers’ role as estimators of tumor burden.
While kPL,median and kPL,max were significantly associated with both PFS and OS, the same association was not found in this study for established serological prognostic markers such as PSA, LDH, and ALP [44,45]. This could possibly suggest that select HP MFMs have a larger effect for detection in this relatively small cohort. Nevertheless, this preliminary observation needs to be validated in a larger population. Along the same line, whether these MFMs are stronger predictors and/or independent predictors of clinical TNM staging remains to be answered in the future.
Many aggressive variants of prostate cancer, such as AR-independent and NEPC subtypes, are often characterized by low serum PSA secretion but rapid progression and poor prognosis [46,47]. Although four out of five subjects in this study who underwent successful metastatic biopsy found only adenocarcinoma, these biopsies are not immune to sampling error—the presence of inter- and intratumoral heterogeneity is well understood [48]; mixed phenotypes are particularly common in heavily pretreated disease [47,49]. In addition, AR staining was not routinely performed as a part of our clinical practice. Furthermore, these biopsies were not routinely performed at the time of HP MRI. These uncertainties pose challenges to directly link MFM-PSA disassociation identified in this study to histological evidence of aggressive variants.
Although LDH is the key upregulated enzyme driving the cancer Warburg effect, elevated serum LDH can be linked to a range of non-specific biological processes such as inflammation and immune response [50,51]. HP MRI features could provide spatial specificity through tumor localization that circulating LDH markers do not. Also, as a biomarker of bone matrix breakdown, ALP level is more meaningful in bone-dominant or bone-only disease [52] and thus may not be as prognostic in our cohort of 16, which consisted of a heterogeneous mixture of bone, soft tissue, and visceral metastases.
Prostate cancer is a heterogeneous malignancy with complex underlying biology and diverse clinical presentation, histological subtypes, and gene expression [53]. Accordingly, most established clinical risk classifiers and nomograms are multivariate [54,55]—accounting for clinical, serological, and histological parameters. These strongly support the idea of a multivariate radiomics approach toward HP 13C MRI of advanced prostate cancer. Keeping in mind the small size of our pilot study, we observed that the multivariate MPS was dependent on kPL levels and the tumor ROI’s shape elongation (aspect ratio). The shape factor could be related to tumor invasiveness. It was reassuring that PSA, an established clinical biomarker, was identified as one of the four classifier variables in the multivariate analysis, underscoring its role reflecting tumor burden despite the possible discordance commonly found in aggressive histological variants. Although MPS showed higher concordance (C-index) with outcomes over kPL alone, the advantages of our multivariate model over its univariate counterpart requires an external validation dataset to be definitively established.
Cross-validation of the multivariate model showed varying stability of each MPS coefficient—normalized standard deviation ranged from 0.33 to 0.57 (Supplemental Figure S2). This suggested that caution should be exercised about the limited sample size and associated possibility of false discovery. Although the numerical coefficients may suffer from a certain degree of overfitting, our primary intention is to propose and showcase the generalizable approach of whole abdomen/pelvis HP MRI, metabolic feature extraction, selection, model construction, and data representation and visualization that will be readily applicable to future collaborative, multicenter HP studies to establish more refined multivariate cancer metabolic risk classifiers.
Taken together, the value proposition for this multivariate approach is its generalizability toward larger studies. Additionally, our initial observations uncovered tantalizing leads to identifying potentially important risk variables predictive of clinical outcomes.
Our two-step feature selection process consisted of feature ranking followed by agglomerative clustering. This was chosen out of intuitiveness and the possibility of stepwise graphical visualization. More sophisticated methods for dimensional reduction, such as random forest classifier [56], LASSO regression [57], and recursive feature elimination [58] could offer better performance. Comparison of these dimensionality reduction techniques in conventional radiographs (e.g., LASSO, PCA, recursive feature elimination) showed similar performances and each useful for certain scenarios [59,60], but drawing such a conclusion specifically in the HP 13C MRI context requires more data than that available from our study.
The fast-growing field of deep learning may benefit complex HP 13C MRI feature extraction and classification tasks. However, a direct comparison between conventional radiomics and convolutional neural networks is outside of our scope and better suited for a larger future study.
A few limitations should be acknowledged for the current research, including limited sample size, referral bias and retrospective endpoint definitions. A major limitation lies in the small sample size, which precluded division of the 16 subjects into training and validation sets to rigorously evaluate the model performance and may limit the generalizability of our models. Nevertheless, these initial positive findings provide optimism that the necessary sample size for validation will be addressed in future multicenter collaborative HP research.
As this was a retrospective analysis, the scan timings and the corresponding clinical statuses were not prespecified and were indeed somewhat heterogeneous. Common fallacies of retrospective studies like ours may include lack of randomization, misclassification bias, missing data entries, confounders, and misidentification of cause–effect [61,62]. While OS is less ambiguous and minimally impacted by retrospective endpoint design, surrogate endpoints like PFS can be confounded by recall bias, informative censoring, and assessment time bias; these remained to be addressed in a prospective study.
Interobserver agreement was not assessed in this small-sample pilot research, which may limit ROI reproducibility. This was partially mitigated by a standardized approach for ROI identification and delineation in the single-observer scenario, and routine consensus imaging data and lesion review by radiologists and key researchers. The researchers were not blinded to the patients’ medical history or any prior (conventional) scan findings at the time of the HP 13C MRI. However, this impact is considered minimal due to the observational nature of this research.
The survival metrics calculated in this study reflect those with relatively good functional status (per inclusion criteria) and could be positively biased against the population median which would have included older, frailer and/or more symptomatic individuals. Care should be taken when comparing these PFS and OS findings to other observational studies or clinical trials.
Although proton MRI was performed alongside HP 13C MRI for all patients, the 1H MRI protocols varied depending on which body part was being targeted in an attempt to optimize our approach. Such variability precluded incorporation of proton-MRI features (based on T1-, T2-, and diffusion-weighted imaging) into this research. Establishing a generic 1H protocol similar to the published whole-body MRI for prostate cancer evaluation can potentially make future 1H scans more routine and uniform [63,64]. The combination of both HP 13C and standard 1H MRI features would be an interesting topic for future study.

5. Conclusions

For the first time, multiparametric features of metabolism (MFM) were systematically extracted from hyperpolarized (HP) 13C-pyruvate MRI of men with advanced prostate cancer, enabled by the latest advancements of HP 13C + 1H array hardware combinations and novel metabolic MRI approaches offering full abdominal or pelvic coverage. Preliminary analysis of a small set of patients found that select MFMs—including intratumoral HP 13C pyruvate-to-lactate conversation rate kPL—were significantly associated with clinically meaningful outcome measures. These encouraging data strongly support further pursuit of the prognostic values of HP 13C MRI-derived metabolic features in prospective studies.

Supplementary Materials

The following supporting information can be downloaded at: https://www.mdpi.com/article/10.3390/cancers17132211/s1, Figure S1: Numerical representation of the Pearson correlation matrix in Figure 3; Figure S2: Sensitivity analysis of multivariate risk variables (i.e., MFM) in a cross validation manner.

Author Contributions

Conceptualization, H.-Y.C., I.d.K., R.A., and D.B.V.; methodology, H.-Y.C., I.d.K., R.A.B., M.A.O., Z.J.W., J.W.G., P.E.Z.L., R.A., and D.B.V.; software, H.-Y.C., J.W.G., and P.E.Z.L.; validation, H.-Y.C., I.d.K., R.A.B., M.A.O., and Z.J.W.; formal analysis, H.-Y.C. and I.d.K.; investigation, H.-Y.C., I.d.K., R.A.B., M.A.O., Z.J.W., D.G., and R.A.; resources, H.-Y.C., I.d.K., R.A.B., D.G., T.N., L.C., J.W.G., P.E.Z.L., R.A., and D.B.V.; data curation, H.-Y.C.; writing—original draft preparation, H.-Y.C.; writing—review and editing, I.d.K., R.A.B., M.A.O., Z.J.W., D.G., T.N., L.C., J.W.G., P.E.Z.L., J.K., R.A., and D.B.V.; visualization, H.-Y.C.; supervision, R.A.B., J.W.G., P.E.Z.L., J.K., R.A., and D.B.V.; project administration, R.A.B., J.K., R.A., and D.B.V.; funding acquisition, R.A.B., J.W.G., R.A., and D.B.V. All authors have read and agreed to the published version of the manuscript.

Funding

This work was supported by grants from the NIH (R01CA256740, R01CA215694, R01CA238379, U01EB026412, P41EB013598, S10OD025077).

Institutional Review Board Statement

The study was conducted in accordance with the Declaration of Helsinki and approved by the Institutional Review Board of University of California, San Francisco (IRB protocol code: CC#20922; date of approval: 30 January 2020).

Informed Consent Statement

Written informed consent was obtained from all subjects involved in the study.

Data Availability Statement

Deidentified data can be made available upon request made to the corresponding author.

Acknowledgments

We would like to thank Duy Dang, Heather Daniel, Nikhil Deveshwar, Evelyn Escobar, Mary Frost, Yaewon Kim, Philip Lee, Louise Magat, Kimberly Okamoto, Andrew Riselli, and James Slater for their help with this research.

Conflicts of Interest

The authors declare no conflict of interest.

Abbreviations

The following abbreviations are used in this manuscript:
MFMMultiparametric Features of Metabolism
HP 13C MRIHyperpolarized 13C MRI
PFSProgression-free survival
OSOverall survival
PSAProstate-specific antigen

References

  1. Fizazi, K.; Foulon, S.; Carles, J.; Roubaud, G.; McDermott, R.; Flechon, A.; Tombal, B.; Supiot, S.; Berthold, D.; Ronchin, P.; et al. Abiraterone plus prednisone added to androgen deprivation therapy and docetaxel in de novo metastatic castration-sensitive prostate cancer (PEACE-1): A multicentre, open-label, randomised, phase 3 study with a 2 × 2 factorial design. Lancet 2022, 399, 1695–1707. [Google Scholar] [CrossRef] [PubMed]
  2. de Bono, J.; Kang, J.; Hussain, M. Olaparib for Metastatic Castration-Resistant Prostate Cancer. Reply. N. Engl. J. Med. 2020, 383, 891. [Google Scholar] [CrossRef] [PubMed]
  3. Sartor, O.; de Bono, J.; Chi, K.N.; Fizazi, K.; Herrmann, K.; Rahbar, K.; Tagawa, S.T.; Nordquist, L.T.; Vaishampayan, N.; El-Haddad, G.; et al. Lutetium-177-PSMA-617 for Metastatic Castration-Resistant Prostate Cancer. N. Engl. J. Med. 2021, 385, 1091–1103. [Google Scholar] [CrossRef] [PubMed] [PubMed Central]
  4. Kurhanewicz, J.; Vigneron, D.B.; Ardenkjaer-Larsen, J.H.; Bankson, J.A.; Brindle, K.; Cunningham, C.H.; Gallagher, F.A.; Keshari, K.R.; Kjaer, A.; Laustsen, C.; et al. Hyperpolarized (13)C MRI: Path to Clinical Translation in Oncology. Neoplasia 2019, 21, 1–16. [Google Scholar] [CrossRef] [PubMed] [PubMed Central]
  5. Wang, Z.J.; Ohliger, M.A.; Larson, P.E.Z.; Gordon, J.W.; Bok, R.A.; Slater, J.; Villanueva-Meyer, J.E.; Hess, C.P.; Kurhanewicz, J.; Vigneron, D.B. Hyperpolarized (13)C MRI: State of the Art and Future Directions. Radiology 2019, 291, 273–284. [Google Scholar] [CrossRef] [PubMed] [PubMed Central]
  6. Brindle, K.M.; Bohndiek, S.E.; Gallagher, F.A.; Kettunen, M.I. Tumor imaging using hyperpolarized 13C magnetic resonance spectroscopy. Magn. Reson. Med. 2011, 66, 505–519. [Google Scholar] [CrossRef] [PubMed]
  7. Vander Heiden, M.G.; Cantley, L.C.; Thompson, C.B. Understanding the Warburg effect: The metabolic requirements of cell proliferation. Science 2009, 324, 1029–1033. [Google Scholar] [CrossRef] [PubMed] [PubMed Central]
  8. Aggarwal, R.; Vigneron, D.B.; Kurhanewicz, J. Hyperpolarized 1-[(13)C]-Pyruvate Magnetic Resonance Imaging Detects an Early Metabolic Response to Androgen Ablation Therapy in Prostate Cancer. Eur. Urol. 2017, 72, 1028–1029. [Google Scholar] [CrossRef] [PubMed] [PubMed Central]
  9. Chen, H.Y.; Aggarwal, R.; Bok, R.A.; Ohliger, M.A.; Zhu, Z.; Lee, P.; Gordon, J.W.; van Criekinge, M.; Carvajal, L.; Slater, J.B.; et al. Hyperpolarized (13)C-pyruvate MRI detects real-time metabolic flux in prostate cancer metastases to bone and liver: A clinical feasibility study. Prostate Cancer Prostatic Dis. 2020, 23, 269–276. [Google Scholar] [CrossRef] [PubMed] [PubMed Central]
  10. Chowdhury, R.; Mueller, C.A.; Smith, L.; Gong, F.; Papoutsaki, M.V.; Rogers, H.; Syer, T.; Singh, S.; Brembilla, G.; Retter, A.; et al. Quantification of Prostate Cancer Metabolism Using 3D Multiecho bSSFP and Hyperpolarized [1-(13) C] Pyruvate: Metabolism Differs Between Tumors of the Same Gleason Grade. J. Magn. Reson. Imaging JMRI 2022, 57, 1865–1875. [Google Scholar] [CrossRef] [PubMed]
  11. de Kouchkovsky, I.; Nguyen, H.; Chen, H.-Y.; Liu, X.; Qin, H.; Stohr, B.A.; Santos, R.D.; Ohliger, M.A.; Wang, Z.J.; Bok, R.A.; et al. Dual Hyperpolarized [1-13C] Pyruvate and [13C] Urea Magnetic Resonance Imaging of Prostate Cancer. J. Magn. Reson. Open 2024, 21, 100165. [Google Scholar] [CrossRef]
  12. Granlund, K.L.; Tee, S.S.; Vargas, H.A.; Lyashchenko, S.K.; Reznik, E.; Fine, S.; Laudone, V.; Eastham, J.A.; Touijer, K.A.; Reuter, V.E.; et al. Hyperpolarized MRI of Human Prostate Cancer Reveals Increased Lactate with Tumor Grade Driven by Monocarboxylate Transporter 1. Cell Metab. 2020, 31, 105–114.e3. [Google Scholar] [CrossRef] [PubMed] [PubMed Central]
  13. Nelson, S.J.; Kurhanewicz, J.; Vigneron, D.B.; Larson, P.E.; Harzstark, A.L.; Ferrone, M.; van Criekinge, M.; Chang, J.W.; Bok, R.; Park, I.; et al. Metabolic imaging of patients with prostate cancer using hyperpolarized [1-(1)(3)C]pyruvate. Sci. Transl. Med. 2013, 5, 198ra08. [Google Scholar] [CrossRef] [PubMed] [PubMed Central]
  14. Sushentsev, N.; Hamm, G.; Flint, L.; Birtles, D.; Zakirov, A.; Richings, J.; Ling, S.; Tan, J.Y.; McLean, M.A.; Ayyappan, V.; et al. Metabolic imaging across scales reveals distinct prostate cancer phenotypes. Nat. Commun. 2024, 15, 5980. [Google Scholar] [CrossRef] [PubMed] [PubMed Central]
  15. Sushentsev, N.; McLean, M.A.; Warren, A.Y.; Benjamin, A.J.; Brodie, C.; Frary, A.; Gill, A.B.; Jones, J.; Kaggie, J.D.; Lamb, B.W.; et al. Hyperpolarised 13C-MRI identifies the emergence of a glycolytic cell population within intermediate-risk human prostate cancer. Nat. Commun. 2022, 13, 466. [Google Scholar]
  16. Bankson, J.; Larson, P.E. Analysis and visualization of hyperpolarized 13C MR data. In Advances in Magnetic Resonance Technology and Applications; Elsevier: Amsterdam, The Netherlands, 2021; Volume 3, pp. 129–155. [Google Scholar]
  17. Larson, P.E.Z.; Bernard, J.M.L.; Bankson, J.A.; Bogh, N.; Bok, R.A.; Chen, A.P.; Cunningham, C.H.; Gordon, J.; Hövener, J.-B.; Laustsen, C.; et al. Current methods for hyperpolarized [1-(13)C]pyruvate MRI human studies. Magn. Reson. Med. 2024, 91, 2204–2228. [Google Scholar] [CrossRef] [PubMed] [PubMed Central]
  18. Liberini, V.; Laudicella, R.; Balma, M.; Nicolotti, D.G.; Buschiazzo, A.; Grimaldi, S.; Lorenzon, L.; Bianchi, A.; Peano, S.; Bartolotta, T.V.; et al. Radiomics and artificial intelligence in prostate cancer: New tools for molecular hybrid imaging and theragnostics. Eur. Radiol. Exp. 2022, 6, 27. [Google Scholar] [CrossRef] [PubMed] [PubMed Central]
  19. van Timmeren, J.E.; Cester, D.; Tanadini-Lang, S.; Alkadhi, H.; Baessler, B. Radiomics in medical imaging-“how-to” guide and critical reflection. Insights Into Imaging 2020, 11, 91. [Google Scholar] [CrossRef] [PubMed] [PubMed Central]
  20. Zhao, B. Understanding Sources of Variation to Improve the Reproducibility of Radiomics. Front. Oncol. 2021, 11, 633176. [Google Scholar] [CrossRef] [PubMed] [PubMed Central]
  21. Du, L.X.; Yuan, J.P.; Gan, M.; Li, Z.G.; Wang, P.; Hou, Z.J.; Wang, C. A comparative study between deep learning and radiomics models in grading liver tumors using hepatobiliary phase contrast-enhanced MR images. BMC Med. Imaging 2022, 22, 218. [Google Scholar] [CrossRef]
  22. Bakas, S.; Akbari, H.; Sotiras, A.; Bilello, M.; Rozycki, M.; Kirby, J.S.; Freymann, J.B.; Farahani, K.; Davatzikos, C. Advancing The Cancer Genome Atlas glioma MRI collections with expert segmentation labels and radiomic features. Sci. Data 2017, 4, 170117. [Google Scholar] [CrossRef] [PubMed] [PubMed Central]
  23. Tagliafico, A.S.; Piana, M.; Schenone, D.; Lai, R.; Massone, A.M.; Houssami, N. Overview of radiomics in breast cancer diagnosis and prognostication. Breast 2020, 49, 74–80. [Google Scholar] [CrossRef] [PubMed] [PubMed Central]
  24. Lovinfosse, P.; Polus, M.; Van Daele, D.; Martinive, P.; Daenen, F.; Hatt, M.; Visvikis, D.; Koopmansch, B.; Lambert, F.; Coimbra, C.; et al. FDG PET/CT radiomics for predicting the outcome of locally advanced rectal cancer. Eur. J. Nucl. Med. Mol. Imaging 2018, 45, 365–375. [Google Scholar] [CrossRef] [PubMed]
  25. Yoon, H.; Choi, W.H.; Joo, M.W.; Ha, S.; Chung, Y.-A. SPECT/CT Radiomics for Differentiating between Enchondroma and Grade I Chondrosarcoma. Tomography 2023, 9, 148. [Google Scholar] [CrossRef]
  26. Cook, G.J.R.; Azad, G.; Owczarczyk, K.; Siddique, M.; Goh, V. Challenges and Promises of PET Radiomics. Int. J. Radiat. Oncol. 2018, 102, 1083–1089. [Google Scholar] [CrossRef]
  27. Peng, S.; Spetsieris, P.G.; Eidelberg, D.; Ma, Y. Radiomics and supervised machine learning in the diagnosis of parkinsonism with FDG PET: Promises and challenges. Ann. Transl. Med. 2020, 8. [Google Scholar] [CrossRef] [PubMed]
  28. Brindle, K.M. Imaging cancer metabolism using magnetic resonance. npj Imaging 2024, 2, 1. [Google Scholar] [CrossRef]
  29. Autry, A.W.; Gordon, J.W.; Chen, H.Y.; LaFontaine, M.; Bok, R.; Van Criekinge, M.; Slater, J.B.; Carvajal, L.; Villanueva-Meyer, J.E.; Chang, S.M.; et al. Characterization of serial hyperpolarized (13)C metabolic imaging in patients with glioma. NeuroImage Clin. 2020, 27, 102323. [Google Scholar] [CrossRef] [PubMed] [PubMed Central]
  30. Lee, P.M.; Chen, H.Y.; Gordon, J.W.; Wang, Z.J.; Bok, R.; Hashoian, R.; Kim, Y.; Liu, X.; Nickles, T.; Cheung, K.; et al. Whole-Abdomen Metabolic Imaging of Healthy Volunteers Using Hyperpolarized [1-(13) C]pyruvate MRI. J. Magn. Reson. Imaging JMRI 2022, 56, 1792–1806. [Google Scholar] [CrossRef] [PubMed] [PubMed Central]
  31. Grist, J.T.; Hansen, E.S.S.; Sanchez-Heredia, J.D.; McLean, M.A.; Tougaard, R.; Riemer, F.; Schulte, R.F.; Kaggie, J.D.; Ardenkjaer-Larsen, J.H.; Laustsen, C.; et al. Creating a clinical platform for carbon-13 studies using the sodium-23 and proton resonances. Magn. Reson. Med. 2020, 84, 1817–1827. [Google Scholar] [CrossRef] [PubMed] [PubMed Central]
  32. Gordon, J.W.; Vigneron, D.B.; Larson, P.E. Development of a symmetric echo planar imaging framework for clinical translation of rapid dynamic hyperpolarized (13) C imaging. Magn. Reson. Med. 2017, 77, 826–832. [Google Scholar] [CrossRef] [PubMed] [PubMed Central]
  33. Bok, R.; Lee, J.; Sriram, R.; Keshari, K.; Sukumar, S.; Daneshmandi, S.; Korenchan, D.E.; Flavell, R.R.; Vigneron, D.B.; Kurhanewicz, J.; et al. The Role of Lactate Metabolism in Prostate Cancer Progression and Metastases Revealed by Dual-Agent Hyperpolarized (13)C MRSI. Cancers 2019, 11, 257. [Google Scholar] [CrossRef] [PubMed] [PubMed Central]
  34. Fedorov, A.; Beichel, R.; Kalpathy-Cramer, J.; Finet, J.; Fillion-Robin, J.C.; Pujol, S.; Bauer, C.; Jennings, D.; Fennessy, F.; Sonka, M.; et al. 3D Slicer as an image computing platform for the Quantitative Imaging Network. Magn. Reson. Imaging 2012, 30, 1323–1341. [Google Scholar] [CrossRef]
  35. van Griethuysen, J.J.M.; Fedorov, A.; Parmar, C.; Hosny, A.; Aucoin, N.; Narayan, V.; Beets-Tan, R.G.H.; Fillion-Robin, J.C.; Pieper, S.; Aerts, H.J.W.L. Computational Radiomics System to Decode the Radiographic Phenotype. Cancer Res. 2017, 77, E104–E107. [Google Scholar] [CrossRef]
  36. Larson, P.E.Z.; Chen, H.Y.; Gordon, J.W.; Korn, N.; Maidens, J.; Arcak, M.; Tang, S.; Criekinge, M.; Carvajal, L.; Mammoli, D.; et al. Investigation of analysis methods for hyperpolarized 13C-pyruvate metabolic MRI in prostate cancer patients. NMR Biomed. 2018, 31, e3997. [Google Scholar] [CrossRef] [PubMed] [PubMed Central]
  37. Leijenaar, R.T.; Nalbantov, G.; Carvalho, S.; van Elmpt, W.J.; Troost, E.G.; Boellaard, R.; Aerts, H.J.; Gillies, R.J.; Lambin, P. The effect of SUV discretization in quantitative FDG-PET Radiomics: The need for standardized methodology in tumor texture analysis. Sci. Rep. 2015, 5, 11075. [Google Scholar] [CrossRef] [PubMed] [PubMed Central]
  38. Harrell, F.E.; Califf, R.M., Jr.; Pryor, D.B.; Lee, K.L.; Rosati, R.A. Evaluating the yield of medical tests. JAMA 1982, 247, 2543–2546. [Google Scholar] [CrossRef] [PubMed]
  39. Heller, K.A.; Ghahramani, Z. Bayesian hierarchical clustering. In Proceedings of the 22nd International Conference on Machine Learning, Bonn, Germany, 7–11 August 2005. [Google Scholar]
  40. Song, Y.Y.; Lu, Y. Decision tree methods: Applications for classification and prediction. Shanghai Arch. Psychiatry 2015, 27, 130–135. [Google Scholar] [PubMed] [PubMed Central]
  41. Karpinski, M.J.; Husing, J.; Claassen, K.; Moller, L.; Kajuter, H.; Oesterling, F.; Grünwald, V.; Umutlu, L.; Kleesiek, J.; Telli, T.; et al. Combining PSMA-PET and PROMISE to re-define disease stage and risk in patients with prostate cancer: A multicentre retrospective study. Lancet Oncol. 2024, 25, 1188–1201. [Google Scholar] [CrossRef] [PubMed]
  42. Vaz, S.; Hadaschik, B.; Gabriel, M.; Herrmann, K.; Eiber, M.; Costa, D. Influence of androgen deprivation therapy on PSMA expression and PSMA-ligand PET imaging of prostate cancer patients. Eur. J. Nucl. Med. Mol. Imaging 2020, 47, 9–15. [Google Scholar] [CrossRef] [PubMed]
  43. McGranahan, N.; Swanton, C. Clonal heterogeneity and tumor evolution: Past, present, and the future. Cell 2017, 168, 613–628. [Google Scholar] [CrossRef]
  44. Armstrong, A.J.; Lin, P.; Higano, C.S.; Sternberg, C.N.; Sonpavde, G.; Tombal, B.; Templeton, A.; Fizazi, K.; Phung, D.; Wong, E.; et al. Development and validation of a prognostic model for overall survival in chemotherapy-na⟨ve men with metastatic castration-resistant prostate cancer. Ann. Oncol. 2018, 29, 2200–2207. [Google Scholar] [CrossRef] [PubMed]
  45. Halabi, S.; Yang, Q.; Roy, A.; Luo, B.; Araujo, J.C.; Logothetis, C.; Sternberg, C.N.; Armstrong, A.J.; Carducci, M.A.; Chi, K.N.; et al. External Validation of a Prognostic Model of Overall Survival in Men With Chemotherapy-Naive Metastatic Castration-Resistant Prostate Cancer. J. Clin. Oncol. 2023, 41, 2736–2746. [Google Scholar] [CrossRef] [PubMed]
  46. Aggarwal, R.; Zhang, T.; Small, E.J.; Armstrong, A.J. Neuroendocrine prostate cancer: Subtypes, biology, and clinical outcomes. J. Natl. Compr. Cancer Netw. JNCCN 2014, 12, 719–726. [Google Scholar] [CrossRef] [PubMed]
  47. Beltran, H.; Tomlins, S.; Aparicio, A.; Arora, V.; Rickman, D.; Ayala, G.; Huang, J.; True, L.; Gleave, M.E.; Soule, H.; et al. Aggressive Variants of Castration-Resistant Prostate Cancer. Clin. Cancer Res. 2014, 20, 2846–2850. [Google Scholar] [CrossRef] [PubMed]
  48. Haffner, M.C.; Zwart, W.; Roudier, M.P.; True, L.D.; Nelson, W.G.; Epstein, J.; De Marzo, A.M.; Nelson, P.S.; Yegnasubramanian, S. Genomic and phenotypic heterogeneity in prostate cancer. Nat. Rev. Urol. 2021, 18, 79–92. [Google Scholar] [CrossRef]
  49. Aggarwal, R.R.; Quigley, D.A.; Huang, J.; Zhang, L.; Beer, T.M.; Rettig, M.B.; Reiter, R.E.; Gleave, M.E.; Thomas, G.V.; Foye, A.; et al. Whole-Genome and Transcriptional Analysis of Treatment-Emergent Small-Cell Neuroendocrine Prostate Cancer Demonstrates Intraclass Heterogeneity. Mol. Cancer Res. MCR 2019, 17, 1235–1240. [Google Scholar] [CrossRef] [PubMed] [PubMed Central]
  50. Forkasiewicz, A.; Dorociak, M.; Stach, K.; Szelachowski, P.; Tabola, R.; Augoff, K. The usefulness of lactate dehydrogenase measurements in current oncological practice. Cell. Mol. Biol. Lett. 2020, 25, 35. [Google Scholar] [CrossRef]
  51. Gupta, G. The lactate and the lactate dehydrogenase in inflammatory diseases and major risk factors in COVID-19 patients. Inflammation 2022, 45, 2091–2123. [Google Scholar] [CrossRef]
  52. Sonpavde, G.; Pond, G.R.; Berry, W.R.; de Wit, R.; Armstrong, A.J.; Eisenberger, M.A.; Tannock, I.F. Serum alkaline phosphatase changes predict survival independent of PSA changes in men with castration-resistant prostate cancer and bone metastasis receiving chemotherapy. Urol. Oncol-Semin. Ori. 2012, 30, 607–613. [Google Scholar] [CrossRef]
  53. Beltran, H.; Yelensky, R.; Frampton, G.M.; Park, K.; Downing, S.R.; MacDonald, T.Y.; Jarosz, M.; Lipson, D.; Tagawa, S.T.; Nanus, D.M.; et al. Targeted next-generation sequencing of advanced prostate cancer identifies potential therapeutic targets and disease heterogeneity. Eur. Urol. 2013, 63, 920–926. [Google Scholar] [CrossRef] [PubMed] [PubMed Central]
  54. Cooperberg, M.R.; Pasta, D.J.; Elkin, E.P.; Litwin, M.S.; Latini, D.M.; Du Chane, J.; Carroll, P.R. The University of California, San Francisco Cancer of the Prostate Risk Assessment score: A straightforward and reliable preoperative predictor of disease recurrence after radical prostatectomy. J. Urol. 2005, 173, 1938–1942. [Google Scholar] [CrossRef] [PubMed] [PubMed Central]
  55. Cagiannos, I.; Karakiewicz, P.; Eastham, J.A.; Ohori, M.; Rabbani, F.; Gerigk, C.; Reuter, V.; Graefen, M.; Hammerer, P.G.; Erbersdobler, A.; et al. A preoperative nomogram identifying decreased risk of positive pelvic lymph nodes in patients with prostate cancer. J. Urol. 2003, 170, 1798–1803. [Google Scholar] [CrossRef] [PubMed]
  56. Qi, Y.J. Random Forest for Bioinformatics. In Ensemble Machine Learning; Springer: New York, NY, USA, 2012; pp. 307–323. [Google Scholar]
  57. Friedman, J.; Hastie, T.; Tibshirani, R.; Narasimhan, B.; Tay, K.; Simon, N.; Qian, J.; Yang, J. glmnet: Lasso and Elastic-Net Regularized Generalized Linear Models. Astrophysics Source Code Library. 2023. ascl: 2308.011. Available online: https://ascl.net/2308.011 (accessed on 30 June 2025).
  58. Jeon, H.; Oh, S. Hybrid-Recursive Feature Elimination for Efficient Feature Selection. Appl. Sci. 2020, 10, 3211. [Google Scholar] [CrossRef]
  59. Demircioglu, A. Benchmarking Feature Selection Methods in Radiomics. Investig. Radiol. 2022, 57, 433–443. [Google Scholar] [CrossRef] [PubMed]
  60. Mylona, E.; Zaridis, D.I.; Kalantzopoulos, C.; Tachos, N.S.; Regge, D.; Papanikolaou, N.; Tsiknakis, M.; Marias, K.; Fotiadis, D.I. Optimizing radiomics for prostate cancer diagnosis: Feature selection strategies, machine learning classifiers, and MRI sequences. Insights Into Imaging 2024, 15, 265. [Google Scholar] [CrossRef] [PubMed] [PubMed Central]
  61. Tannock, I.F.; Pond, G.R.; Booth, C.M. Biased evaluation in cancer drug trials—How use of progression-free survival as the primary end point can mislead. JAMA Oncol. 2022, 8, 679–680. [Google Scholar] [CrossRef]
  62. Lesan, V.; Olivier, T.; Prasad, V. Progression-free survival estimates are shaped by specific censoring rules: Implications for PFS as an endpoint in cancer randomized trials. Eur. J. Cancer 2024, 202, 114022. [Google Scholar] [CrossRef]
  63. Padhani, A.R.; Lecouvet, F.E.; Tunariu, N.; Koh, D.M.; De Keyzer, F.; Collins, D.J.; Sala, E.; Schlemmer, H.P.; Petralia, G.; Vargas, H.A.; et al. METastasis Reporting and Data System for Prostate Cancer: Practical Guidelines for Acquisition, Interpretation, and Reporting of Whole-body Magnetic Resonance Imaging-based Evaluations of Multiorgan Involvement in Advanced Prostate Cancer. Eur. Urol. 2017, 71, 81–92. [Google Scholar] [CrossRef] [PubMed] [PubMed Central]
  64. Van Nieuwenhove, S.; Van Damme, J.; Padhani, A.R.; Vandecaveye, V.; Tombal, B.; Wuts, J.; Pasoglou, V.; Lecouvet, F.E. Whole-body magnetic resonance imaging for prostate cancer assessment: Current status and future directions. J. Magn. Reson. Imaging JMRI 2022, 55, 653–680. [Google Scholar] [CrossRef] [PubMed]
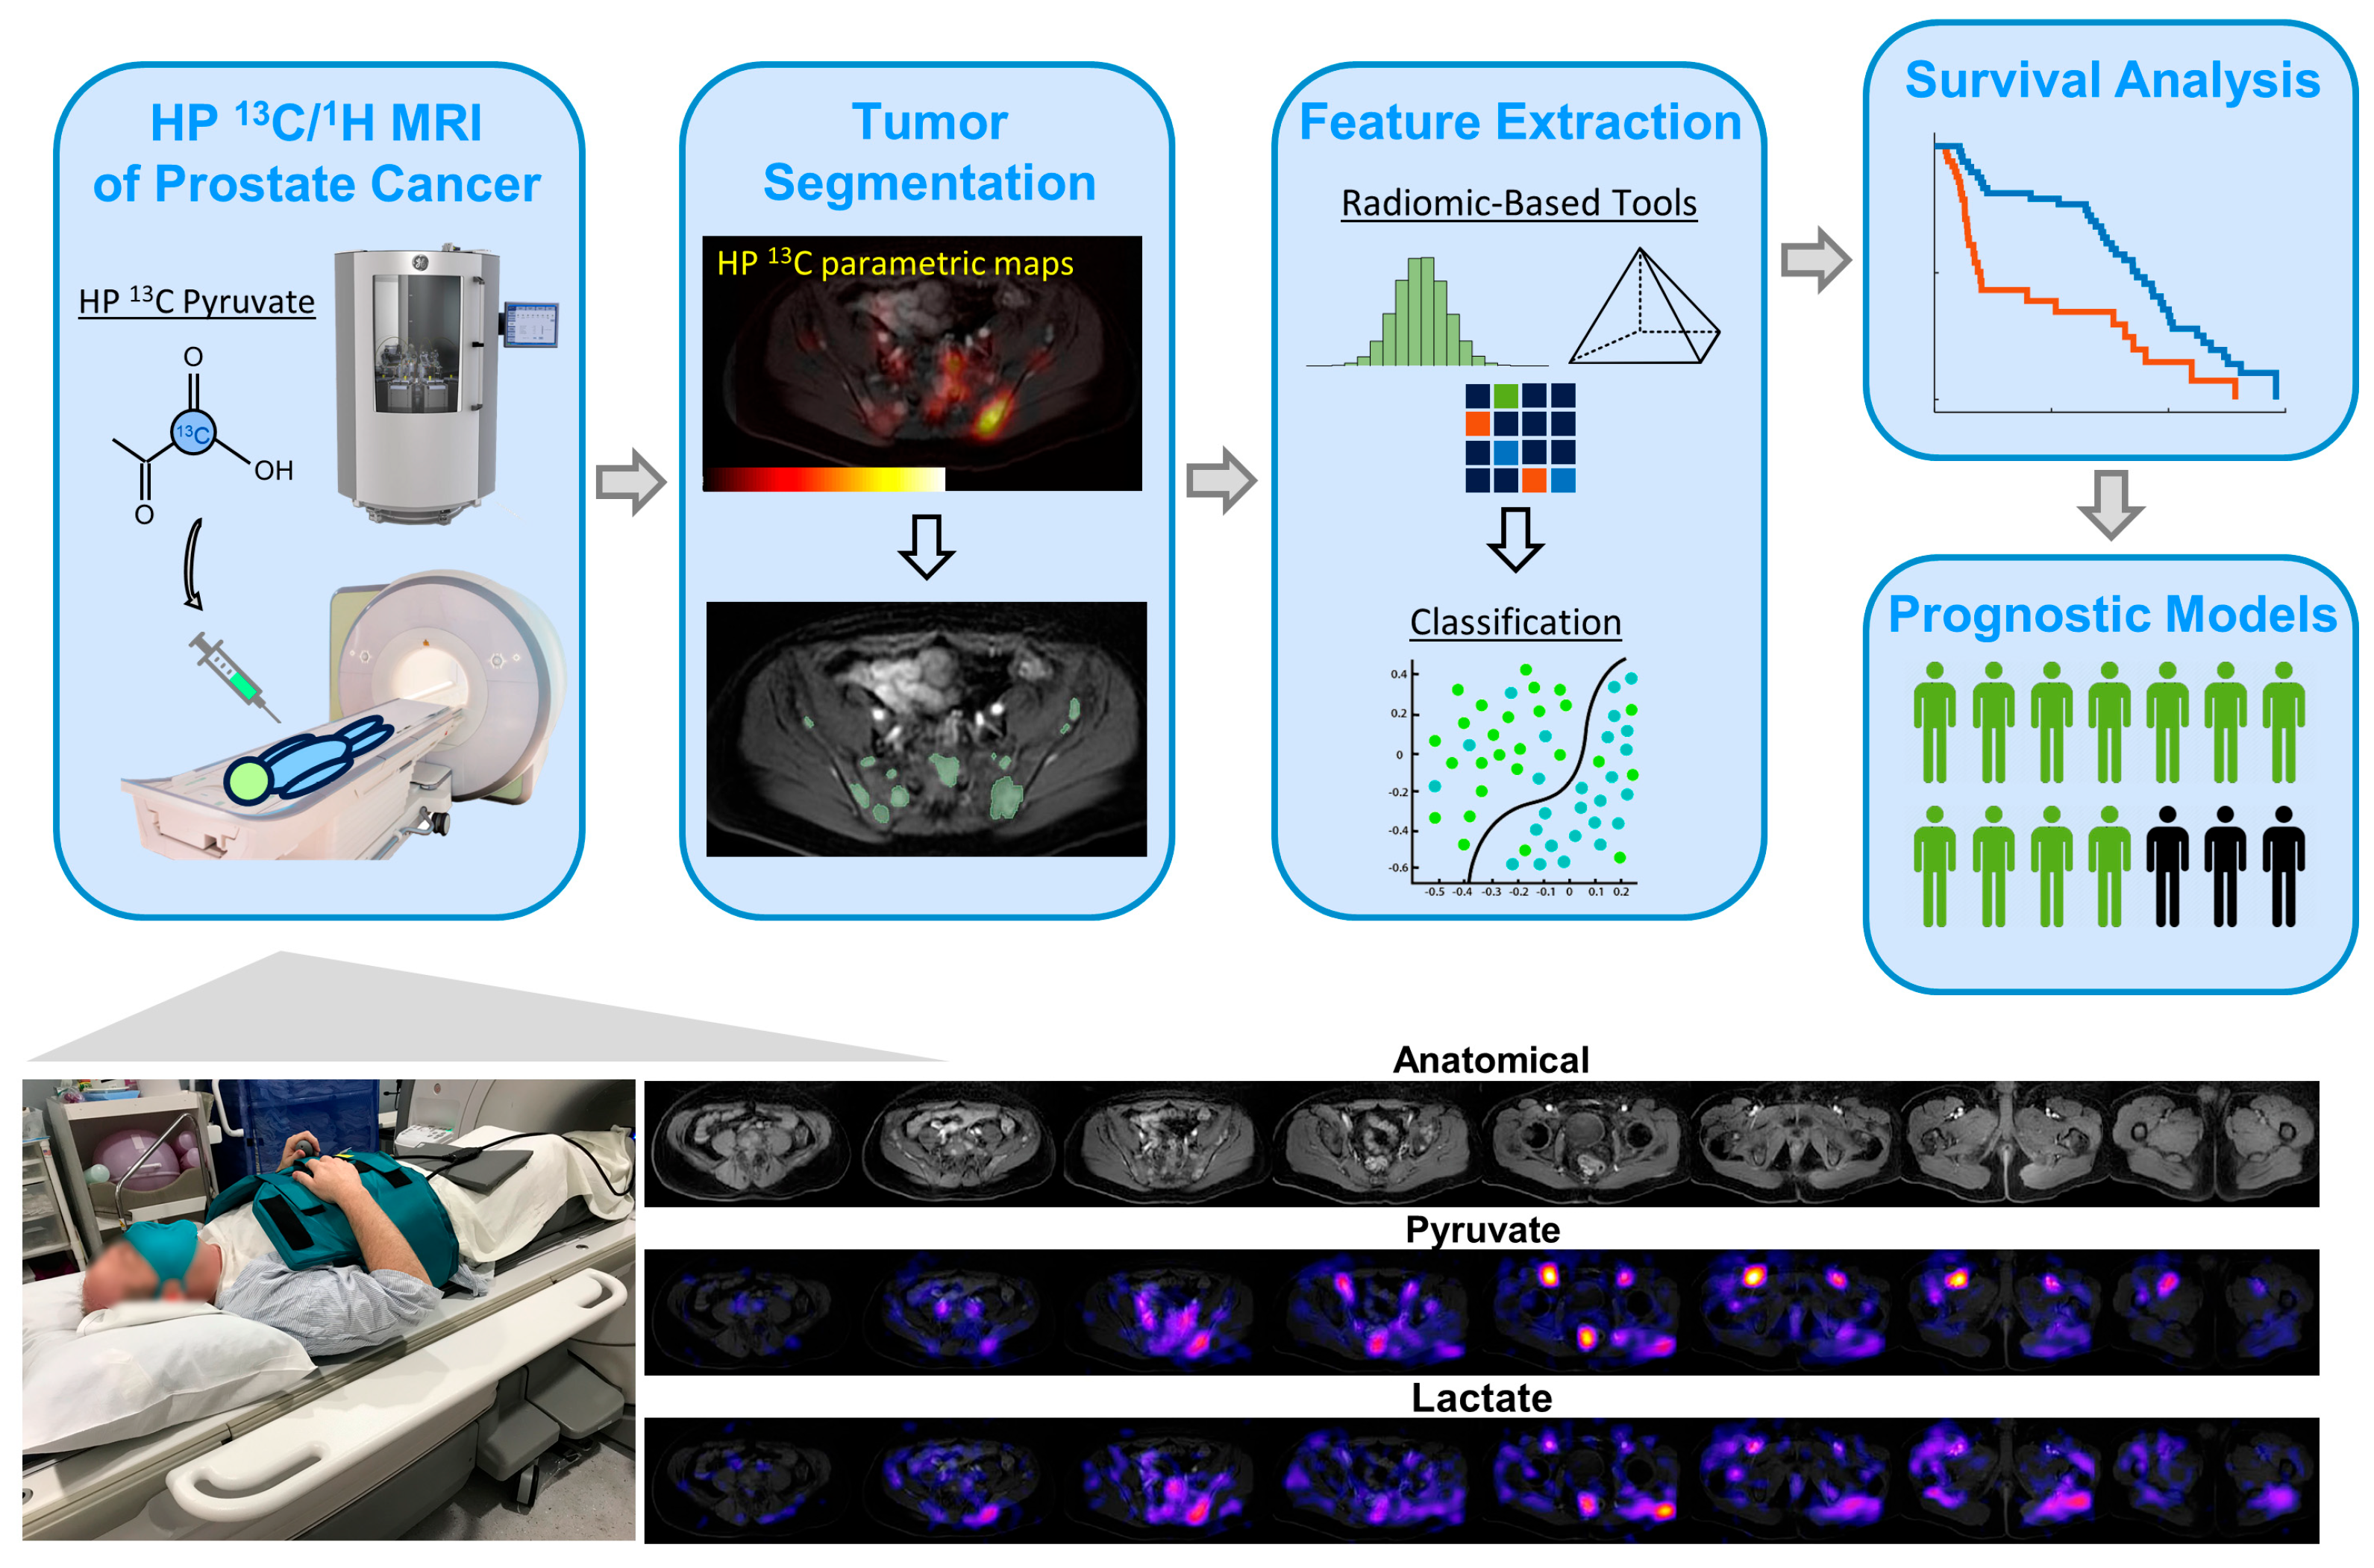
Figure 1. Whole abdominopelvic HP 13C metabolic MRI using cutting-edge hardware and techniques enabled extraction and characterization of radiomic-compliant multiparametric features of metabolism (MFM) in advanced prostate cancer.
Cancers 17 02211 g001
Figure 2. HP multiparametric features of metabolism (MFM) kPL,median was selected and applied to univariate Cox proportional hazards model. (A) Kaplan–Meier analysis revealed substantially longer PFS and OS in patients with kPL,median ≤ 17 ks−1 (median PFS: 11.2 vs. 0.5 months; median OS: NR vs. 18.4 months). (B) Example cases illustrating metastatic prostate cancer patients with kPL,median higher and lower than the dichotomized cutoff value of 17. The patient on the left had high-volume liver metastases with kPL,median = 24.8, whereas on the right had low or undetectable kPL,median across the osseous pelvic metastases. Images shown were kPL heatmaps overlaid on 1H T1-FSPGR references. * p < 0.05, ** p < 0.01.
Cancers 17 02211 g002
Figure 3. Pearson correlation matrix revealed a strongly negative correlation between kPL kurtosis and OS, and moderately negative correlations between kPL,median with OS, kPL,max with both PFS and OS, and kurtosis with PFS. Red and blue colors on the heatmap represent positive and negative correlations, respectively; the circle size represents the correlation strength. TMV: Total metabolic volume. PFS: Progression-free survival. OS: Overall survival.
Cancers 17 02211 g003
Figure 4. (A) Framework for extraction, selection, and classification of multiparametric features of metabolism (MFMs) consisted of a feature extraction step where open-source PyRadiomics package extracts MFMs from the three source HP parametric maps (kPL, pyruvate AUC and MT), followed by a feature selection step consisting of C-index ranking of MFM importance and an agglomerative clustering classifier. (B) Four clusters consisted of highly correlated, redundant features, and one representative feature was selected from each while eliminating the remainders.
Cancers 17 02211 g004
Figure 5. Hypothesis-generating multivariate survival analyses using (A) metabolic prognostic score (MPS) derived from multivariate Cox proportional hazards model, adjusted for patient age. (B) MPS was significantly associated with both PFS (p < 0.002) and OS (p < 0.05), with longer median PFS (NR vs. 2.4 months) and OS (NR vs. 18.4 months) for lower-MPS vs. higher-MPS patients, dichotomized by the cohort median MPS = −0.581. * p < 0.05, ** p < 0.01.
Cancers 17 02211 g005
Table 1. Clinical characteristics of the study participants.
CharacteristicValue
Participants (N = 16)
 Age (years)69 ± 10 (52–88)
Staging
 Local-regionally advanced
  T31
  T42
 Metastatic
  M1a1
  M1b8
  M1c4
Hormonal Status
 Sensitive5
 Resistant11
Laboratory Markers
 PSA13.9 (0.05–336.0)
 LDH208 (139–422)
 ALP76 (37–190)
PSA: Prostate-specific antigen. LDH: Lactate dehydrogenase. ALP: Alkaline phosphatase.
Table 2. In the univariate analysis, kPL max, median, and kurtosis were significantly associated with both PFS and OS, outperforming established clinical prognostic markers PSA and LDH. This preliminary finding suggested the HP 13C multiparametric features of metabolism (MFM) may have stronger effect for detection in this small dataset than these clinical markers.
FeatureLikelihood p-Values
PFSOS
kPL max* 0.024* 0.031
kPL median** 0.008* 0.048
kurtosis* 0.023* 0.029
TMV0.106* 0.028
PSA0.1940.412
LDH0.6010.342
ALP0.8530.821
* p < 0.05, ** p < 0.01.
Disclaimer/Publisher’s Note: The statements, opinions and data contained in all publications are solely those of the individual author(s) and contributor(s) and not of MDPI and/or the editor(s). MDPI and/or the editor(s) disclaim responsibility for any injury to people or property resulting from any ideas, methods, instructions or products referred to in the content.