
Stage Shifting by Modifying the Determinants of Breast Cancer Stage at Diagnosis: A Simulation Study


Abstract
Simple Summary
Abstract
1. Introduction
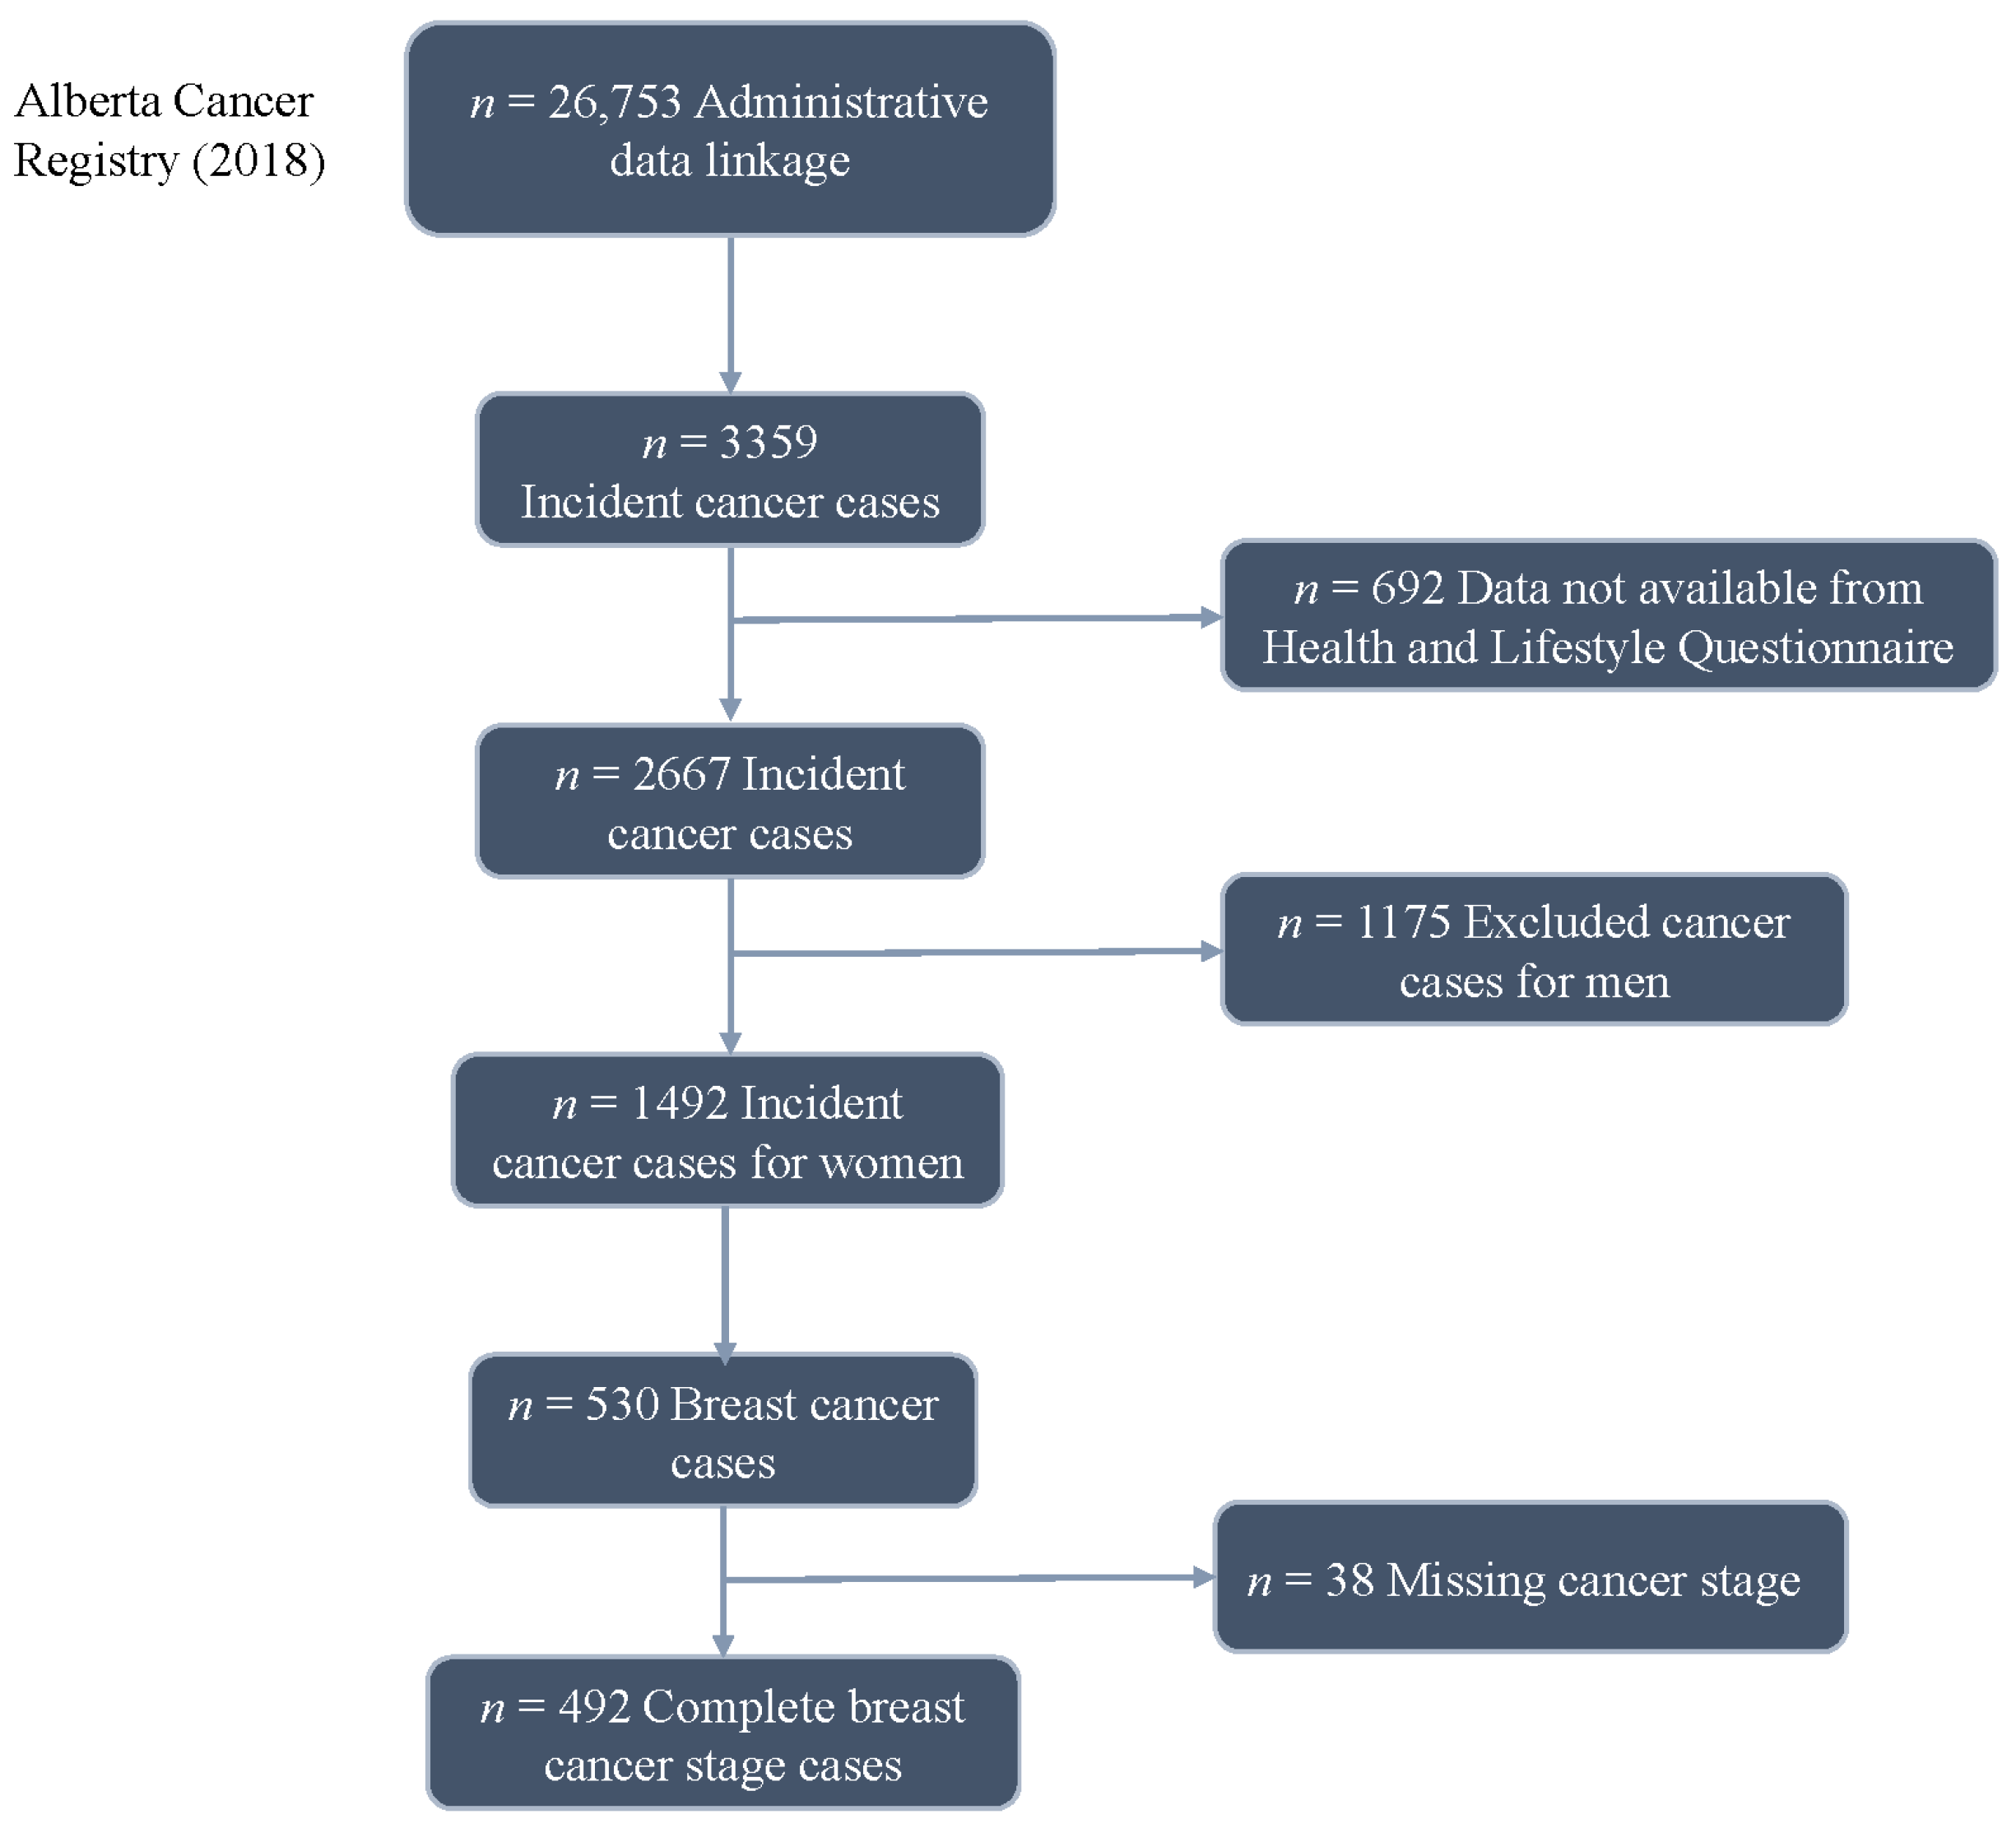
2. Methods
2.1. Proportional and Partial Proportional Odds Models
2.2. Data Simulation
2.3. Stage Shifting
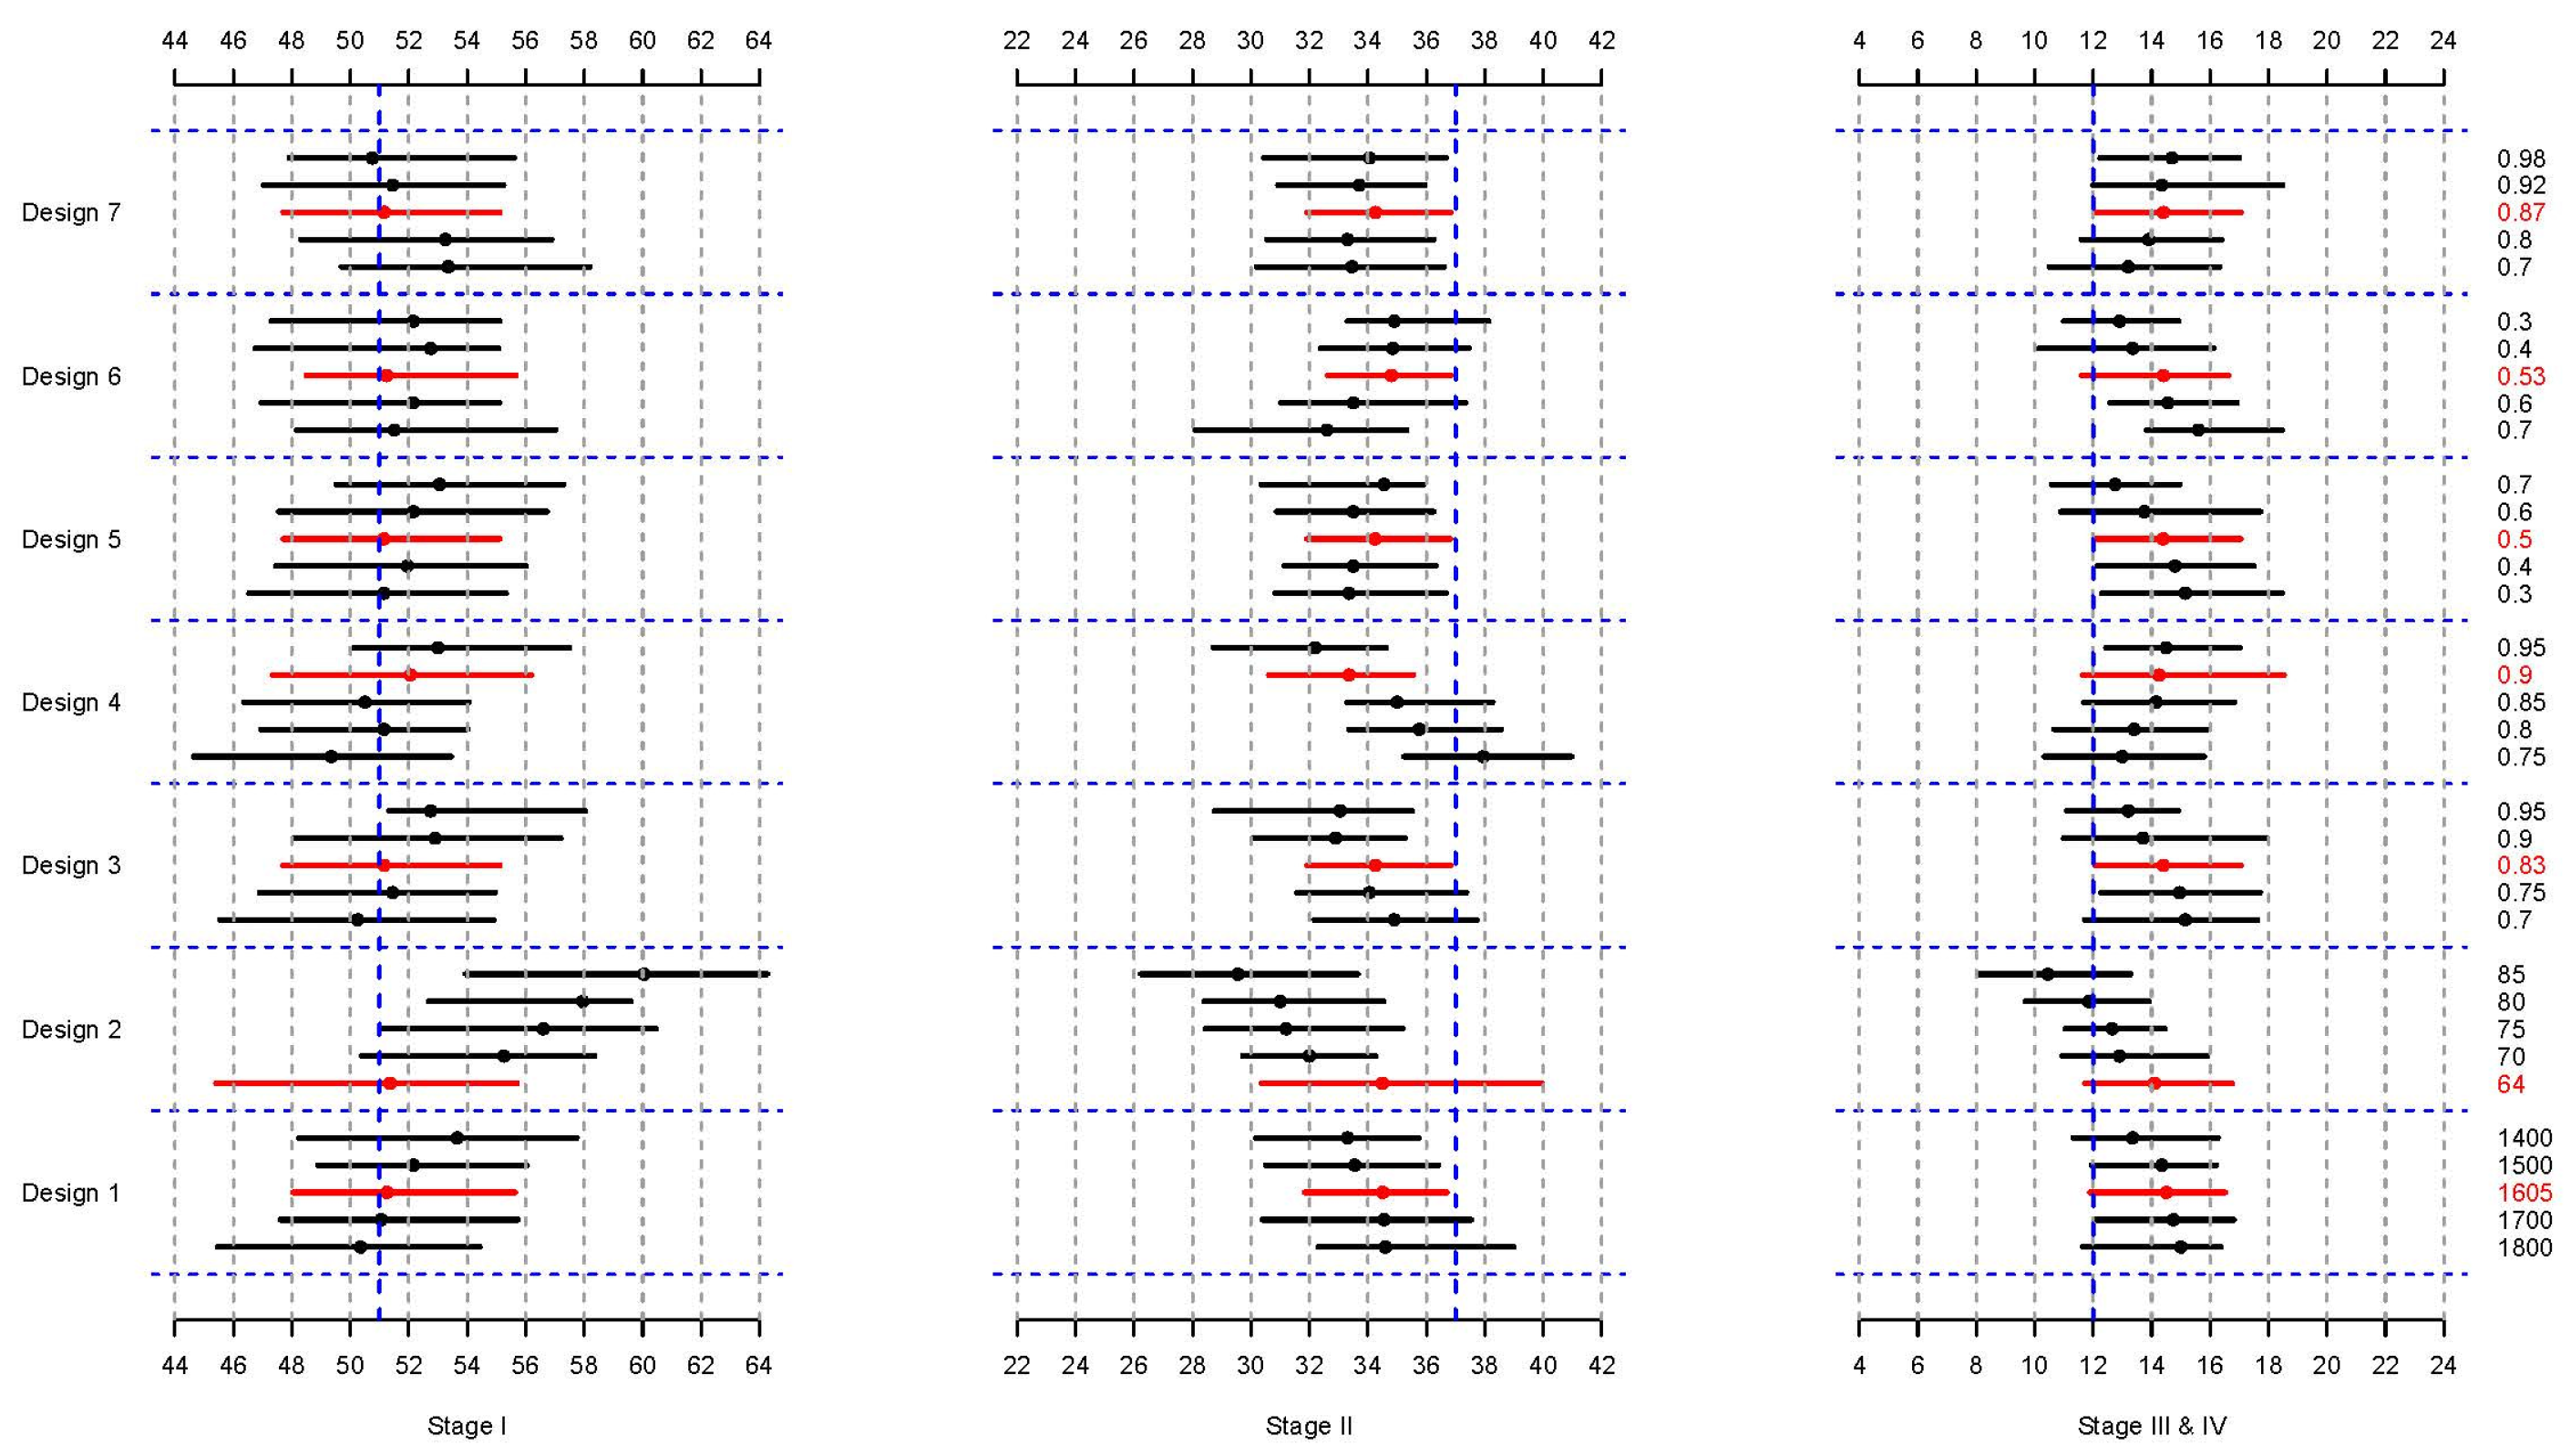
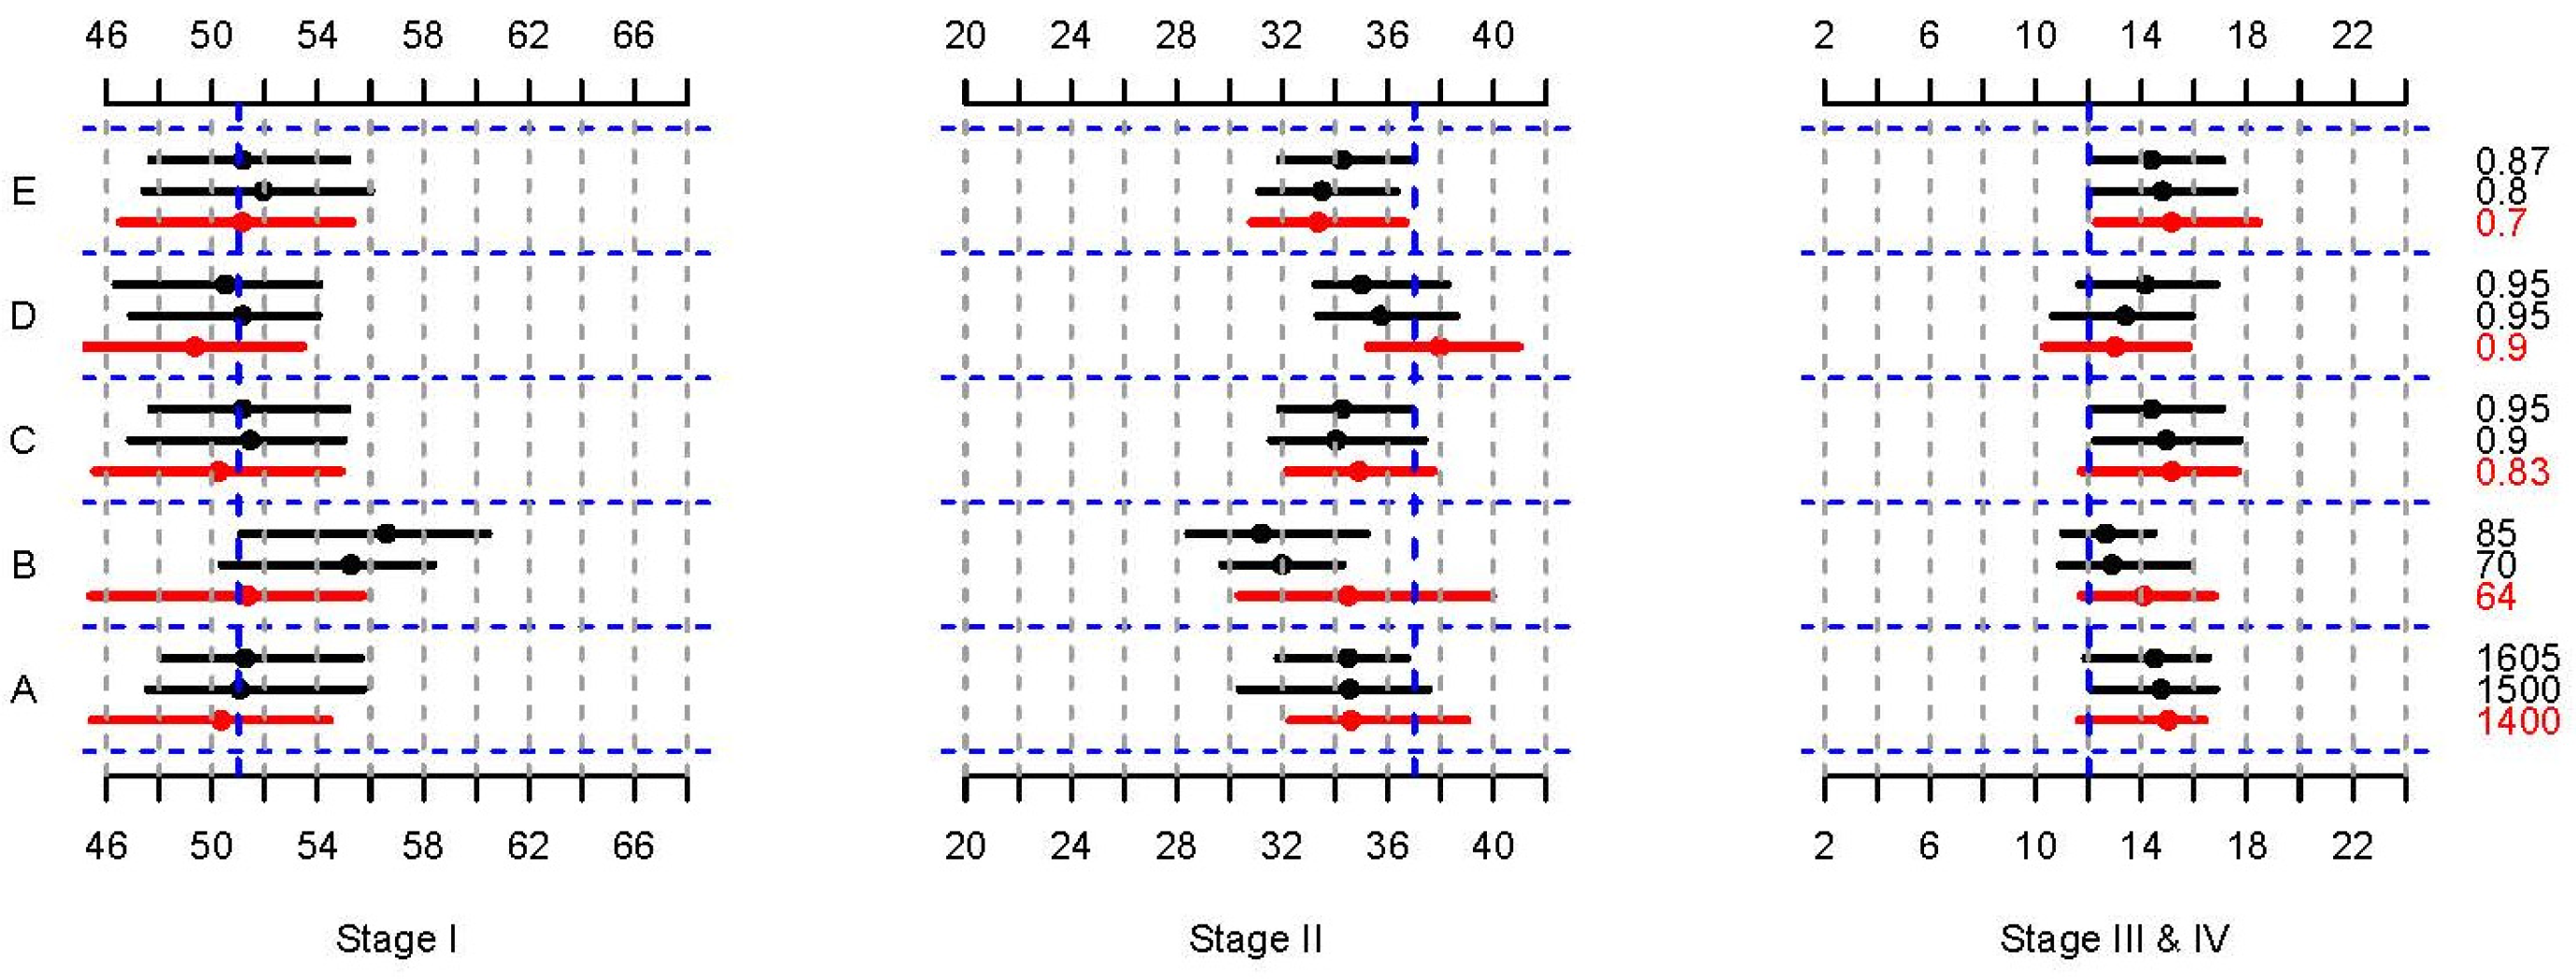
3. Results
4. Discussion
5. Conclusions
Supplementary Materials
Author Contributions
Funding
Institutional Review Board Statement
Informed Consent Statement
Data Availability Statement
Acknowledgments
Conflicts of Interest
Abbreviations
| AJCC | American Joint Committee on Cancer |
| ATP | Alberta’s Tomorrow Project |
| BMI | Body mass index |
| CISNET | Cancer Intervention and Surveillance Modeling Network |
| M | Metastases |
| N | Lymph node involvement |
| PO | Proportional odds |
| PPO | Partial proportional odds |
| T | Tumor size |
References
- Canadian Cancer Statistics 2017; Canadian Cancer Society: Toronto, ON, Canada, 2017.
- World Health Organization. Breast Cancer. Available online: https://www.who.int/news-room/fact-sheets/detail/breast-cancer#:~:text=Treatments%20for%20breast%20cancer%20are,the%20whole%20breast%20(mastectomy) (accessed on 23 February 2024).
- Breast Cancer Stages. Available online: https://www.cancer.org/cancer/breast-cancer/understanding-a-breast-cancer-diagnosis/stages-of-breast-cancer.html (accessed on 1 August 2023).
- Ellison, L.F.; Saint-Jaques, N. Five-year cancer survival by stage at diagnosis in Canada. Health Rep. 2023, 34, 3–15. [Google Scholar] [CrossRef]
- World Health Organization. Promoting Cancer Early Diagnosis. Available online: https://www.who.int/activities/promoting-cancer-early-diagnosis (accessed on 22 February 2024).
- Wang, F.; Luo, L.; McLafferty, S. Healthcare access, socioeconomic factors and late-stage cancer diagnosis: An exploratory spatial analysis and public policy implication. Int. J. Public Pol. 2010, 5, 237–258. [Google Scholar] [CrossRef]
- Examining Disparities in Cancer Control: A System Performance Special Focus Report 2014; Canadian Partnership Against Cancer: Toronto, ON, Canada, 2014.
- Shields, M.; Wilkins, K. An update on mammography use in Canada. Health Rep. 2009, 20, 7–19. [Google Scholar]
- Chan, W.; Yun, L.; Austin, P.C.; Jaakkimainen, R.L.; Booth, G.L.; Hux, J.; Rochon, P.A.; Lipscombe, L.L. Impact of socio-economic status on breast cancer screening in women with diabetes: A population-based study. Diabet. Med. 2014, 31, 806–812. [Google Scholar] [CrossRef]
- Breast Cancer in Canada. Available online: https://www.canada.ca/en/public-health/services/publications/diseases-conditions/breast-cancer.html (accessed on 23 February 2024).
- Keegan, T.H.M.; Parsons, H.M.; Chen, Y.; Maguire, F.B.; Morris, C.R.; Parikh-Patel, A.; Kizer, K.W.; Wun, T. Impact of Health Insurance on Stage at Cancer Diagnosis Among Adolescents and Young Adults. J. Natl. Cancer Inst. 2019, 111, 1152–1160. [Google Scholar] [CrossRef] [PubMed]
- Pinto, B.M.; Trunzo, J.J. Health behaviors during and after a cancer diagnosis. Cancer 2005, 104, 2614–2623. [Google Scholar] [CrossRef]
- Taplin, S.H.; Ichikawa, L.; Yood, M.U.; Manos, M.M.; Geiger, A.M.; Weinmann, S.; Gilbert, J.; Mouchawar, J.; Leyden, W.A.; Altaras, R.; et al. Reason for Late-Stage Breast Cancer: Absence of Screening or Detection, or Breakdown in Follow-up? JNCI J. Natl. Cancer Inst. 2004, 96, 1518–1527. [Google Scholar] [CrossRef]
- Robson, P.J.; Solbak, N.M.; Haig, T.R.; Whelan, H.K.; Vena, J.E.; Akawung, A.K.; Rosner, W.K.; Brenner, D.R.; Cook, L.S.; Csizmadi, I.; et al. Design, methods and demographics from phase I of Alberta’s Tomorrow Project cohort: A prospective cohort profile. CMAJ Open 2016, 4, E515. [Google Scholar] [CrossRef] [PubMed]
- Łukasiewicz, S.; Czeczelewski, M.; Forma, A.; Baj, J.; Sitarz, R.; Stanisławek, A. Breast Cancer-Epidemiology, Risk Factors, Classification, Prognostic Markers, and Current Treatment Strategies-An Updated Review. Cancers 2021, 13, 4287. [Google Scholar] [CrossRef]
- Allahqoli, L.; Mazidimoradi, A.; Momenimovahed, Z.; Rahmani, A.; Hakimi, S.; Tiznobaik, A.; Gharacheh, M.; Salehiniya, H.; Babaey, F.; Alkatout, I. The Global Incidence, Mortality, and Burden of Breast Cancer in 2019: Correlation With Smoking, Drinking, and Drug Use. Front. Oncol. 2022, 12, 921015. [Google Scholar] [CrossRef] [PubMed]
- Amin, M.B.; Greene, F.L.; Edge, S.B.; Compton, C.C.; Gershenwald, J.E.; Brookland, R.K.; Meyer, L.; Gress, D.M.; Byrd, D.R.; Winchester, D.P. The Eighth Edition AJCC Cancer Staging Manual: Continuing to build a bridge from a population-based to a more “personalized” approach to cancer staging. CA Cancer J. Clin. 2017, 67, 93–99. [Google Scholar] [CrossRef] [PubMed]
- Edge, S.B.; Compton, C.C. The American Joint Committee on Cancer: The 7th edition of the AJCC cancer staging manual and the future of TNM. Ann. Surg. Oncol. 2010, 17, 1471–1474. [Google Scholar] [CrossRef]
- Schmoll, H.J. AJCC Cancer Staging Manual, 6th ed.; Lippincott Raven Publishers: Philadelphia, PA, USA, 2002; Part VII. [Google Scholar]
- Wang, Q.; Aktary, M.L.; Spinelli, J.J.; Shack, L.; Robson, P.J.; Kopciuk, K.A. Pre-diagnosis lifestyle, health history and psychosocial factors associated with stage at breast cancer diagnosis—Potential targets to shift stage earlier. Cancer Epidemiol. 2022, 78, 102152. [Google Scholar] [CrossRef]
- Van Herck, Y.; Feyaerts, A.; Alibhai, S.; Papamichael, D.; Decoster, L.; Lambrechts, Y.; Pinchuk, M.; Bechter, O.; Herrera-Caceres, J.; Bibeau, F.; et al. Is cancer biology different in older patients? Lancet Healthy Longev. 2021, 2, e663–e677. [Google Scholar] [CrossRef]
- Richie, R.C.; Swanson, J.O. Breast cancer: A review of the literature. J. Insur. Med. 2003, 35, 85–101. [Google Scholar] [PubMed]
- Uhomoibhi, T.O.; Okobi, T.J.; Okobi, O.E.; Koko, J.O.; Uhomoibhi, O.; Igbinosun, O.E.; Ehibor, U.D.; Boms, M.G.; Abdulgaffar, R.A.; Hammed, B.L.; et al. High-Fat Diet as a Risk Factor for Breast Cancer: A Meta-Analysis. Cureus 2022, 14, e32309. [Google Scholar] [CrossRef]
- Lonnie, M.; Hooker, E.; Brunstrom, J.M.; Corfe, B.M.; Green, M.A.; Watson, A.W.; Williams, E.A.; Stevenson, E.J.; Penson, S.; Johnstone, A.M. Protein for Life: Review of Optimal Protein Intake, Sustainable Dietary Sources and the Effect on Appetite in Ageing Adults. Nutrients 2018, 10, 360. [Google Scholar] [CrossRef] [PubMed]
- Miglioretti, D.L.; Lange, J.; van den Broek, J.J.; Lee, C.I.; van Ravesteyn, N.T.; Ritley, D.; Kerlikowske, K.; Fenton, J.J.; Melnikow, J.; de Koning, H.J.; et al. Radiation-Induced Breast Cancer Incidence and Mortality From Digital Mammography Screening: A Modeling Study. Ann. Intern. Med. 2016, 164, 205–214. [Google Scholar] [CrossRef]
- The Ontario Cancer Screening Performance Report 2020; Cancer Care Ontario: Toronto, ON, Canada, 2021.
- Kelsey, J.L.; Gammon, M.D.; John, E.M. Reproductive factors and breast cancer. Epidemiol. Rev. 1993, 15, 36–47. [Google Scholar] [CrossRef]
- Lambe, M.; Hsieh, C.C.; Chan, H.W.; Ekbom, A.; Trichopoulos, D.; Adami, H.O. Parity, age at first and last birth, and risk of breast cancer: A population-based study in Sweden. Breast Cancer Res. Treat. 1996, 38, 305–311. [Google Scholar] [CrossRef]
- Epilogue Family-Centred Maternity and Newborn Care: National Guidelines; Public Health Agency of Canada: Ottawa, ON, Canada, 2022.
- Statistics Canada. Births. 2022. Available online: https://www150.statcan.gc.ca/n1/daily-quotidien/230926/dq230926a-eng.htm (accessed on 23 February 2024).
- Van der Rhee, H.; Coebergh, J.W.; de Vries, E. Is prevention of cancer by sun exposure more than just the effect of vitamin D? A systematic review of epidemiological studies. Eur. J. Cancer 2013, 49, 1422–1436. [Google Scholar] [CrossRef]
- Hiller, T.W.R.; O’Sullivan, D.E.; Brenner, D.R.; Peters, C.E.; King, W.D. Solar Ultraviolet Radiation and Breast Cancer Risk: A Systematic Review and Meta-Analysis. Environ. Health Perspect. 2020, 128, 16002. [Google Scholar] [CrossRef]
- Dai, S.; Mo, Y.; Wang, Y.; Xiang, B.; Liao, Q.; Zhou, M.; Li, X.; Li, Y.; Xiong, W.; Li, G.; et al. Chronic Stress Promotes Cancer Development. Front. Oncol. 2020, 10, 1492. [Google Scholar] [CrossRef]
- Can, Y.S.; Iles-Smith, H.; Chalabianloo, N.; Ekiz, D.; Fernández-Álvarez, J.; Repetto, C.; Riva, G.; Ersoy, C. How to Relax in Stressful Situations: A Smart Stress Reduction System. Healthcare 2020, 8, 100. [Google Scholar] [CrossRef]
- Vogel, L. Canadian women opting for less effective birth control. CMAJ 2017, 189, E921–E922. [Google Scholar] [CrossRef] [PubMed]
- The 2021 Report on Cancer Statistics in Alberta; Alberta Health Services: Edmonton, AB, Canada, 2021.
- World Cancer Research Fund; American Institute for Cancer Research. Diet, Nutrition, Physical Activity and Cancer: A Global Perspective; Continuous Update Project Expert Report; 2018; Available online: https://www.wcrf.org/diet-activity-and-cancer/ (accessed on 23 February 2024).
- Holmes, M.D.; Wang, J.; Hankinson, S.E.; Tamimi, R.M.; Chen, W.Y. Protein Intake and Breast Cancer Survival in the Nurses’ Health Study. J. Clin. Oncol. 2017, 35, 325–333. [Google Scholar] [CrossRef]
- Pan, K.; Larson, J.C.; Prentice, R.L.; Mortimer, J.E.; Neuhouser, M.L.; Manson, J.E.; Van Horn, L.; Rohan, T.E.; Lane, D.; Chlebowski, R.T. Protein Intake by Source and Breast Cancer Incidence and Mortality: The Women’s Health Initiative. JNCI Cancer Spectr. 2020, 4, pkaa101. [Google Scholar] [CrossRef] [PubMed]
- Gordon, P.B. The Impact of Dense Breasts on the Stage of Breast Cancer at Diagnosis: A Review and Options for Supplemental Screening. Curr. Oncol. 2022, 29, 3595–3636. [Google Scholar] [CrossRef] [PubMed]
- Lee, Y.; Kang, E.; Shin, H.-C.; Lee, H.; Yoon, K.; Kang, B.; Kim, E.-K. The Effect of Body Mass Index on Initial Breast Cancer Stage Among Korean Women. Clin. Breast Cancer 2021, 21, e631–e637. [Google Scholar] [CrossRef] [PubMed]
- Yampaka, T.; Noolek, D. Data Driven for Early Breast Cancer Staging using Integrated Mammography and Biopsy. Asian Pac. J. Cancer Prev. 2021, 22, 4069–4074. [Google Scholar] [CrossRef] [PubMed]
- Van den Broek, J.J.; van Ravesteyn, N.T.; Mandelblatt, J.S.; Cevik, M.; Schechter, C.B.; Lee, S.J.; Huang, H.; Li, Y.; Munoz, D.F.; Plevritis, S.K.; et al. Comparing CISNET Breast Cancer Models Using the Maximum Clinical Incidence Reduction Methodology. Med. Decis. Mak. 2018, 38, 112s–125s. [Google Scholar] [CrossRef] [PubMed]
- Monks, T.; Currie, C.S.M.; Onggo, B.S.; Robinson, S.; Kunc, M.; Taylor, S.J.E. Strengthening the reporting of empirical simulation studies: Introducing the STRESS guidelines. J. Simul. 2019, 13, 55–67. [Google Scholar] [CrossRef]
- Sargent, R.G. Verification and validation of simulation models. J. Simul. 2013, 7, 12–24. [Google Scholar] [CrossRef]

| Lifestyle Factor | Effect * | Mean | Standard Deviation |
|---|---|---|---|
| Total dietary energy intake (kcal/day) | Increased risk | 1605 | 576 |
| Total dietary protein intake (g/day) | Decreased risk | 64 | 25 |
| N | % | ||
| Have had mammogram test (Yes) | Decreased risk | 409 | 83.1 |
| Have been pregnant (Yes) | Decreased risk | 444 | 90.2 |
| Spend time in the sun between 11 am and 4 pm from June to August (≥1 h/day) | Decreased risk | 248 | 50.4 |
| Currently experiencing stressful situation (≥1) | Increased risk | 263 | 53.5 |
| Use birth control pills (Yes) | Increased risk | 427 | 86.8 |
| Design | Factor | Modified Distribution | * ORs (95% CI) |
|---|---|---|---|
| 1 | Total dietary energy intake (numeric, kcal/day) | (1800, 1700, 1605, 1500, 1400) | 1.07 (1.01–1.14) |
| 2 | Total dietary protein intake (numeric, g/day) | (64, 70, 75, 80, 85) | 0.98 (0.97–1.00) |
| 3 | Ever had a mammogram (proportion) | (0.7, 0.75, 0.83, 0.90, 0.95) | 0.57 (0.33–0.97) |
| 4 | Ever been pregnant (proportion) | (0.75, 0.80, 0.85, 0.9, 0.95) | 0.51 (0.27–0.98) |
| 5 | Spending time in the sun from 11 am to 4 pm, June–August (proportion) | (0.3, 0.4, 0.5, 0.6, 0.7) | 0.56 (0.32–0.99) |
| 6 | Currently experiencing stressful situations (proportion) | (0.7, 0.6, 0.53, 0.4, 0.3) | 2.87 (1.55–5.32) |
| 7 | Using birth control pills (proportion) | (0.70, 0.80, 0.87, 0.92, 0.98) | 1.64 (0.94–2.86) |
| Design | Factor | Shift Amount | Average % Change | Effect | ||
|---|---|---|---|---|---|---|
| Stage I | Stage II | Stage III and IV | ||||
| 1 | Total dietary energy intake (numeric, kcal/day) | −100 kcal/day | 0.83 | −0.33 | −0.41 | Increased Risk |
| 2 | Total dietary protein intake (numeric, g/day) | +5 g/day | 2.18 | −1.24 | −0.91 | Decreased Risk |
| 3 | Having ever had a mammogram (proportion) | +5% | 0.63 | −0.46 | −0.49 | Decreased Risk |
| 4 | Having ever been pregnant (proportion) | +5% | 0.91 | −1.44 | 0.38 | Decreased risk |
| 5 | Spending time in the sun between 11 am and 4 pm, June–August (proportion) | +10% | 0.48 | 0.30 | −0.60 | Decreased Risk |
| 6 | Currently experiencing stressful situations (proportion) | −10% | 0.16 | 0.58 | −0.68 | Increased Risk |
| 7 | Using birth control pills (proportion) | +10% | −0.65 | 0.15 | 0.38 | Increased Risk |
| Design | Factor | Shifted Values | Effect |
|---|---|---|---|
| A | Total dietary energy intake (kcal/day) | (1400, 1500, 1605) | Increased Risk |
| B | Total dietary protein intake (g/day) | (64.0, 70.0, 85.0) | Decreased Risk |
| C | Having ever had a mammogram | (0.83, 0.90, 0.95) | Decreased Risk |
| D | Having ever been pregnant | (0.90, 0.95, 0.95) | Decreased Risk |
| E | Using birth control pills | (0.70, 0.80, 0.87) | Increased Risk |
Disclaimer/Publisher’s Note: The statements, opinions and data contained in all publications are solely those of the individual author(s) and contributor(s) and not of MDPI and/or the editor(s). MDPI and/or the editor(s) disclaim responsibility for any injury to people or property resulting from any ideas, methods, instructions or products referred to in the content. |
© 2024 by the authors. Licensee MDPI, Basel, Switzerland. This article is an open access article distributed under the terms and conditions of the Creative Commons Attribution (CC BY) license (https://creativecommons.org/licenses/by/4.0/).
Share and Cite
Pokharel, G.; Wang, Q.; Khan, M.; Robson, P.J.; Shack, L.; Kopciuk, K.A. Stage Shifting by Modifying the Determinants of Breast Cancer Stage at Diagnosis: A Simulation Study. Cancers 2024, 16, 1201. https://doi.org/10.3390/cancers16061201
Pokharel G, Wang Q, Khan M, Robson PJ, Shack L, Kopciuk KA. Stage Shifting by Modifying the Determinants of Breast Cancer Stage at Diagnosis: A Simulation Study. Cancers. 2024; 16(6):1201. https://doi.org/10.3390/cancers16061201
Chicago/Turabian StylePokharel, Gyanendra, Qinggang Wang, Momtafin Khan, Paula J. Robson, Lorraine Shack, and Karen A. Kopciuk. 2024. "Stage Shifting by Modifying the Determinants of Breast Cancer Stage at Diagnosis: A Simulation Study" Cancers 16, no. 6: 1201. https://doi.org/10.3390/cancers16061201
APA StylePokharel, G., Wang, Q., Khan, M., Robson, P. J., Shack, L., & Kopciuk, K. A. (2024). Stage Shifting by Modifying the Determinants of Breast Cancer Stage at Diagnosis: A Simulation Study. Cancers, 16(6), 1201. https://doi.org/10.3390/cancers16061201