
Transcriptomic, Proteomic, and Genomic Mutational Fraction Differences Based on HPV Status Observed in Patient-Derived Xenograft Models of Penile Squamous Cell Carcinoma


 ,
, 
 ,
,
Abstract
Simple Summary
Abstract
1. Introduction
2. Materials and Methods
2.1. Patient Tissue
2.2. Engraftment into Mice
2.3. Tumor Growth Measurements
2.4. Statistical Analysis of Clinical Characteristics and Engraftment
2.5. Histology and Immunohistochemical Staining (IHC)
2.6. DNA Extraction
2.7. STR Fingerprinting
2.8. Whole-Exome Sequencing (WES) and Analysis
2.9. RNA Extraction and Sequencing
2.10. Reverse Phase Protein Array (RPPA)
2.11. Immunoblots
3. Results
3.1. Tumor Engraftment Rate and Growth Rate
3.2. STR Characterization and HPV Genotyping
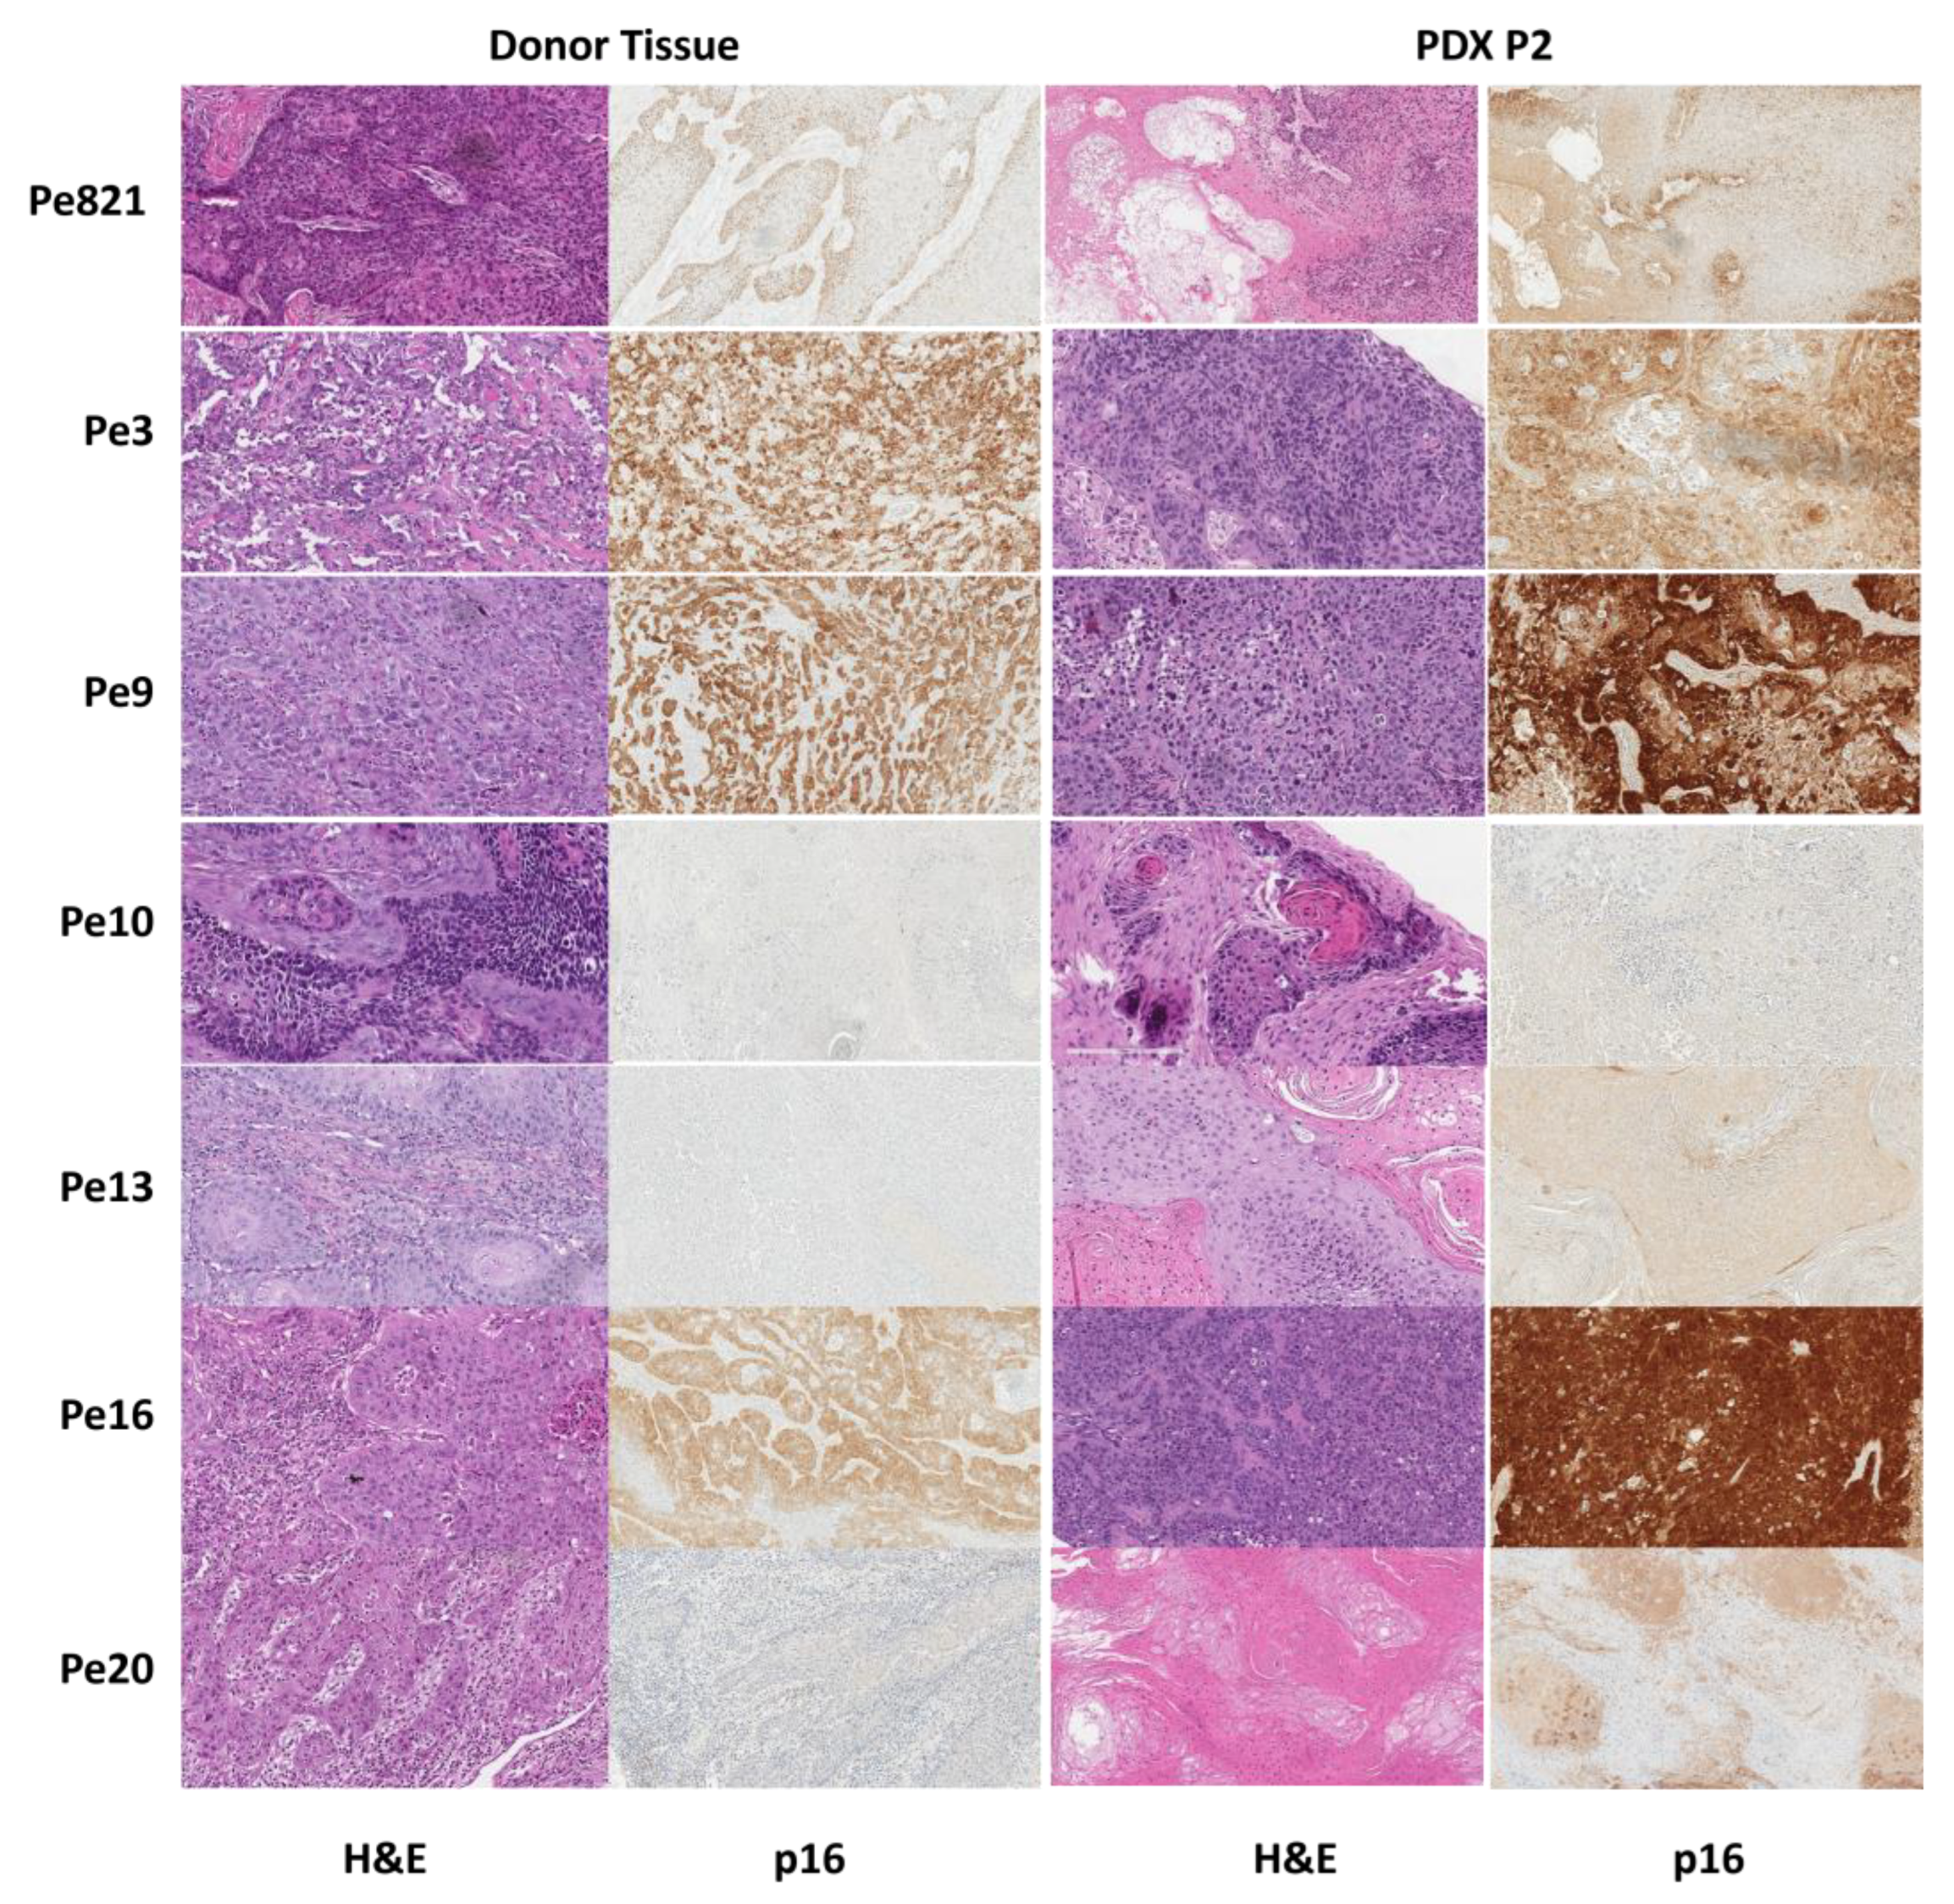
3.3. Histology
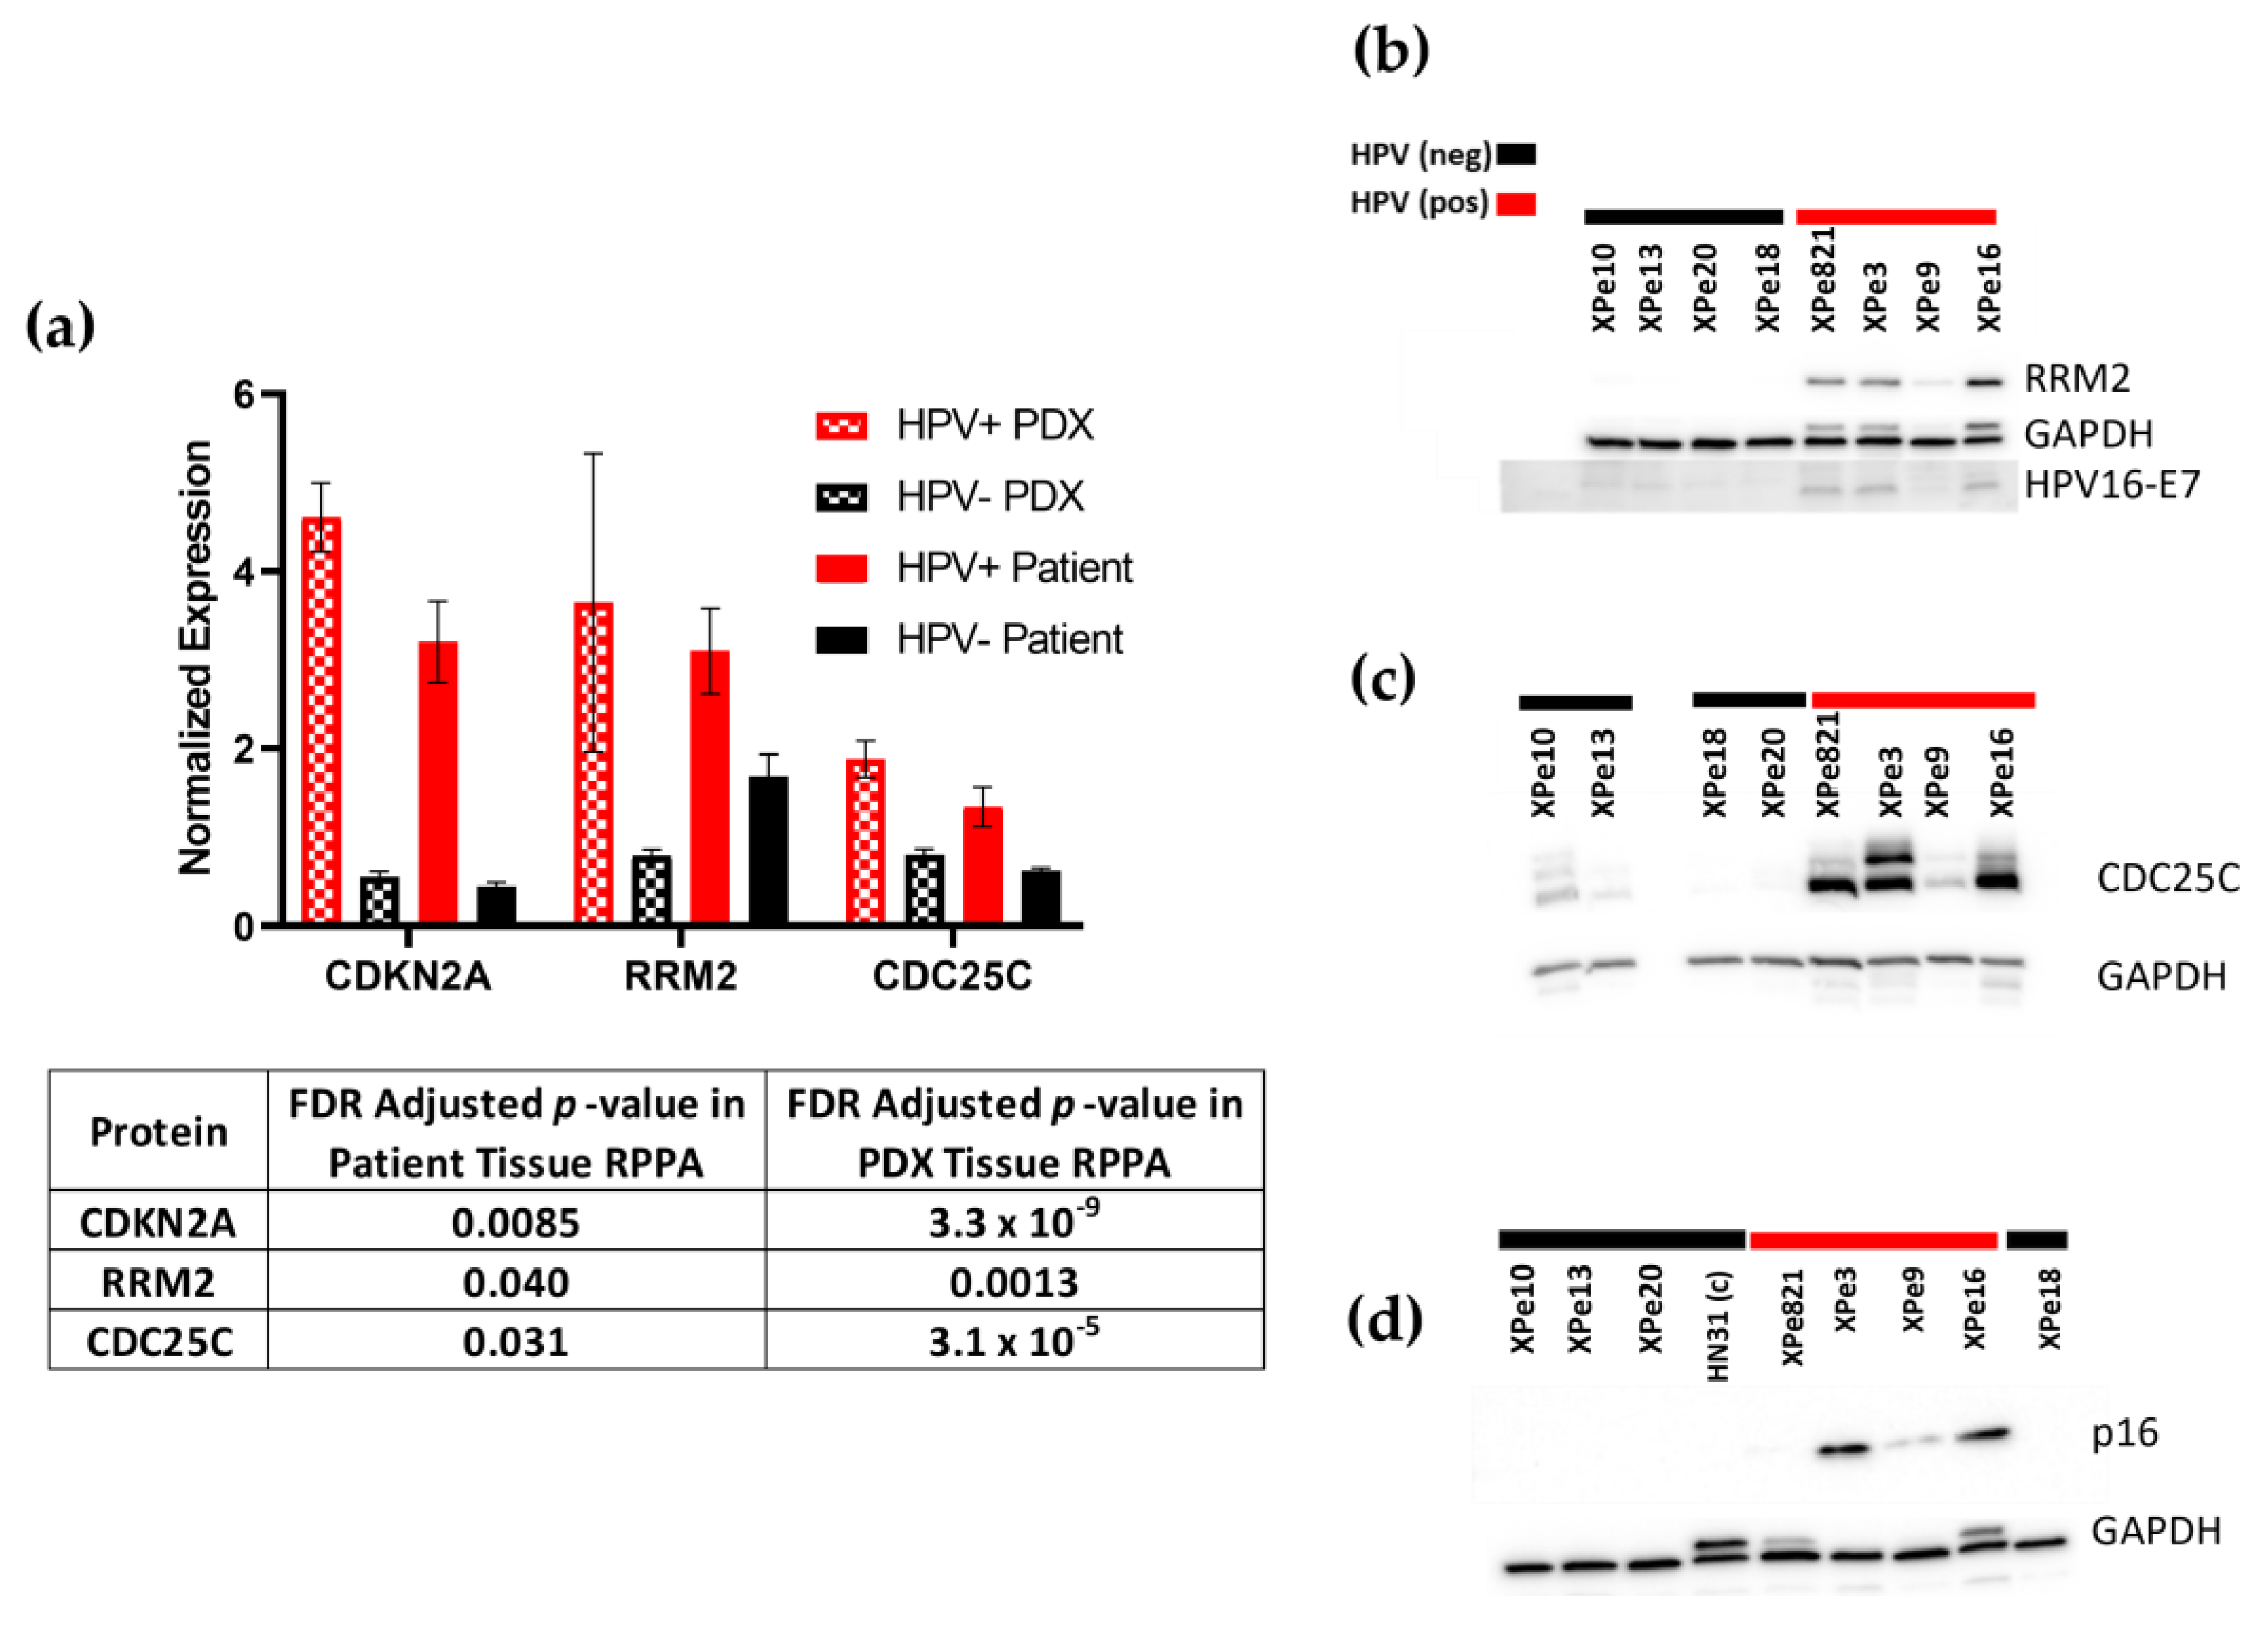
3.4. Proteomics
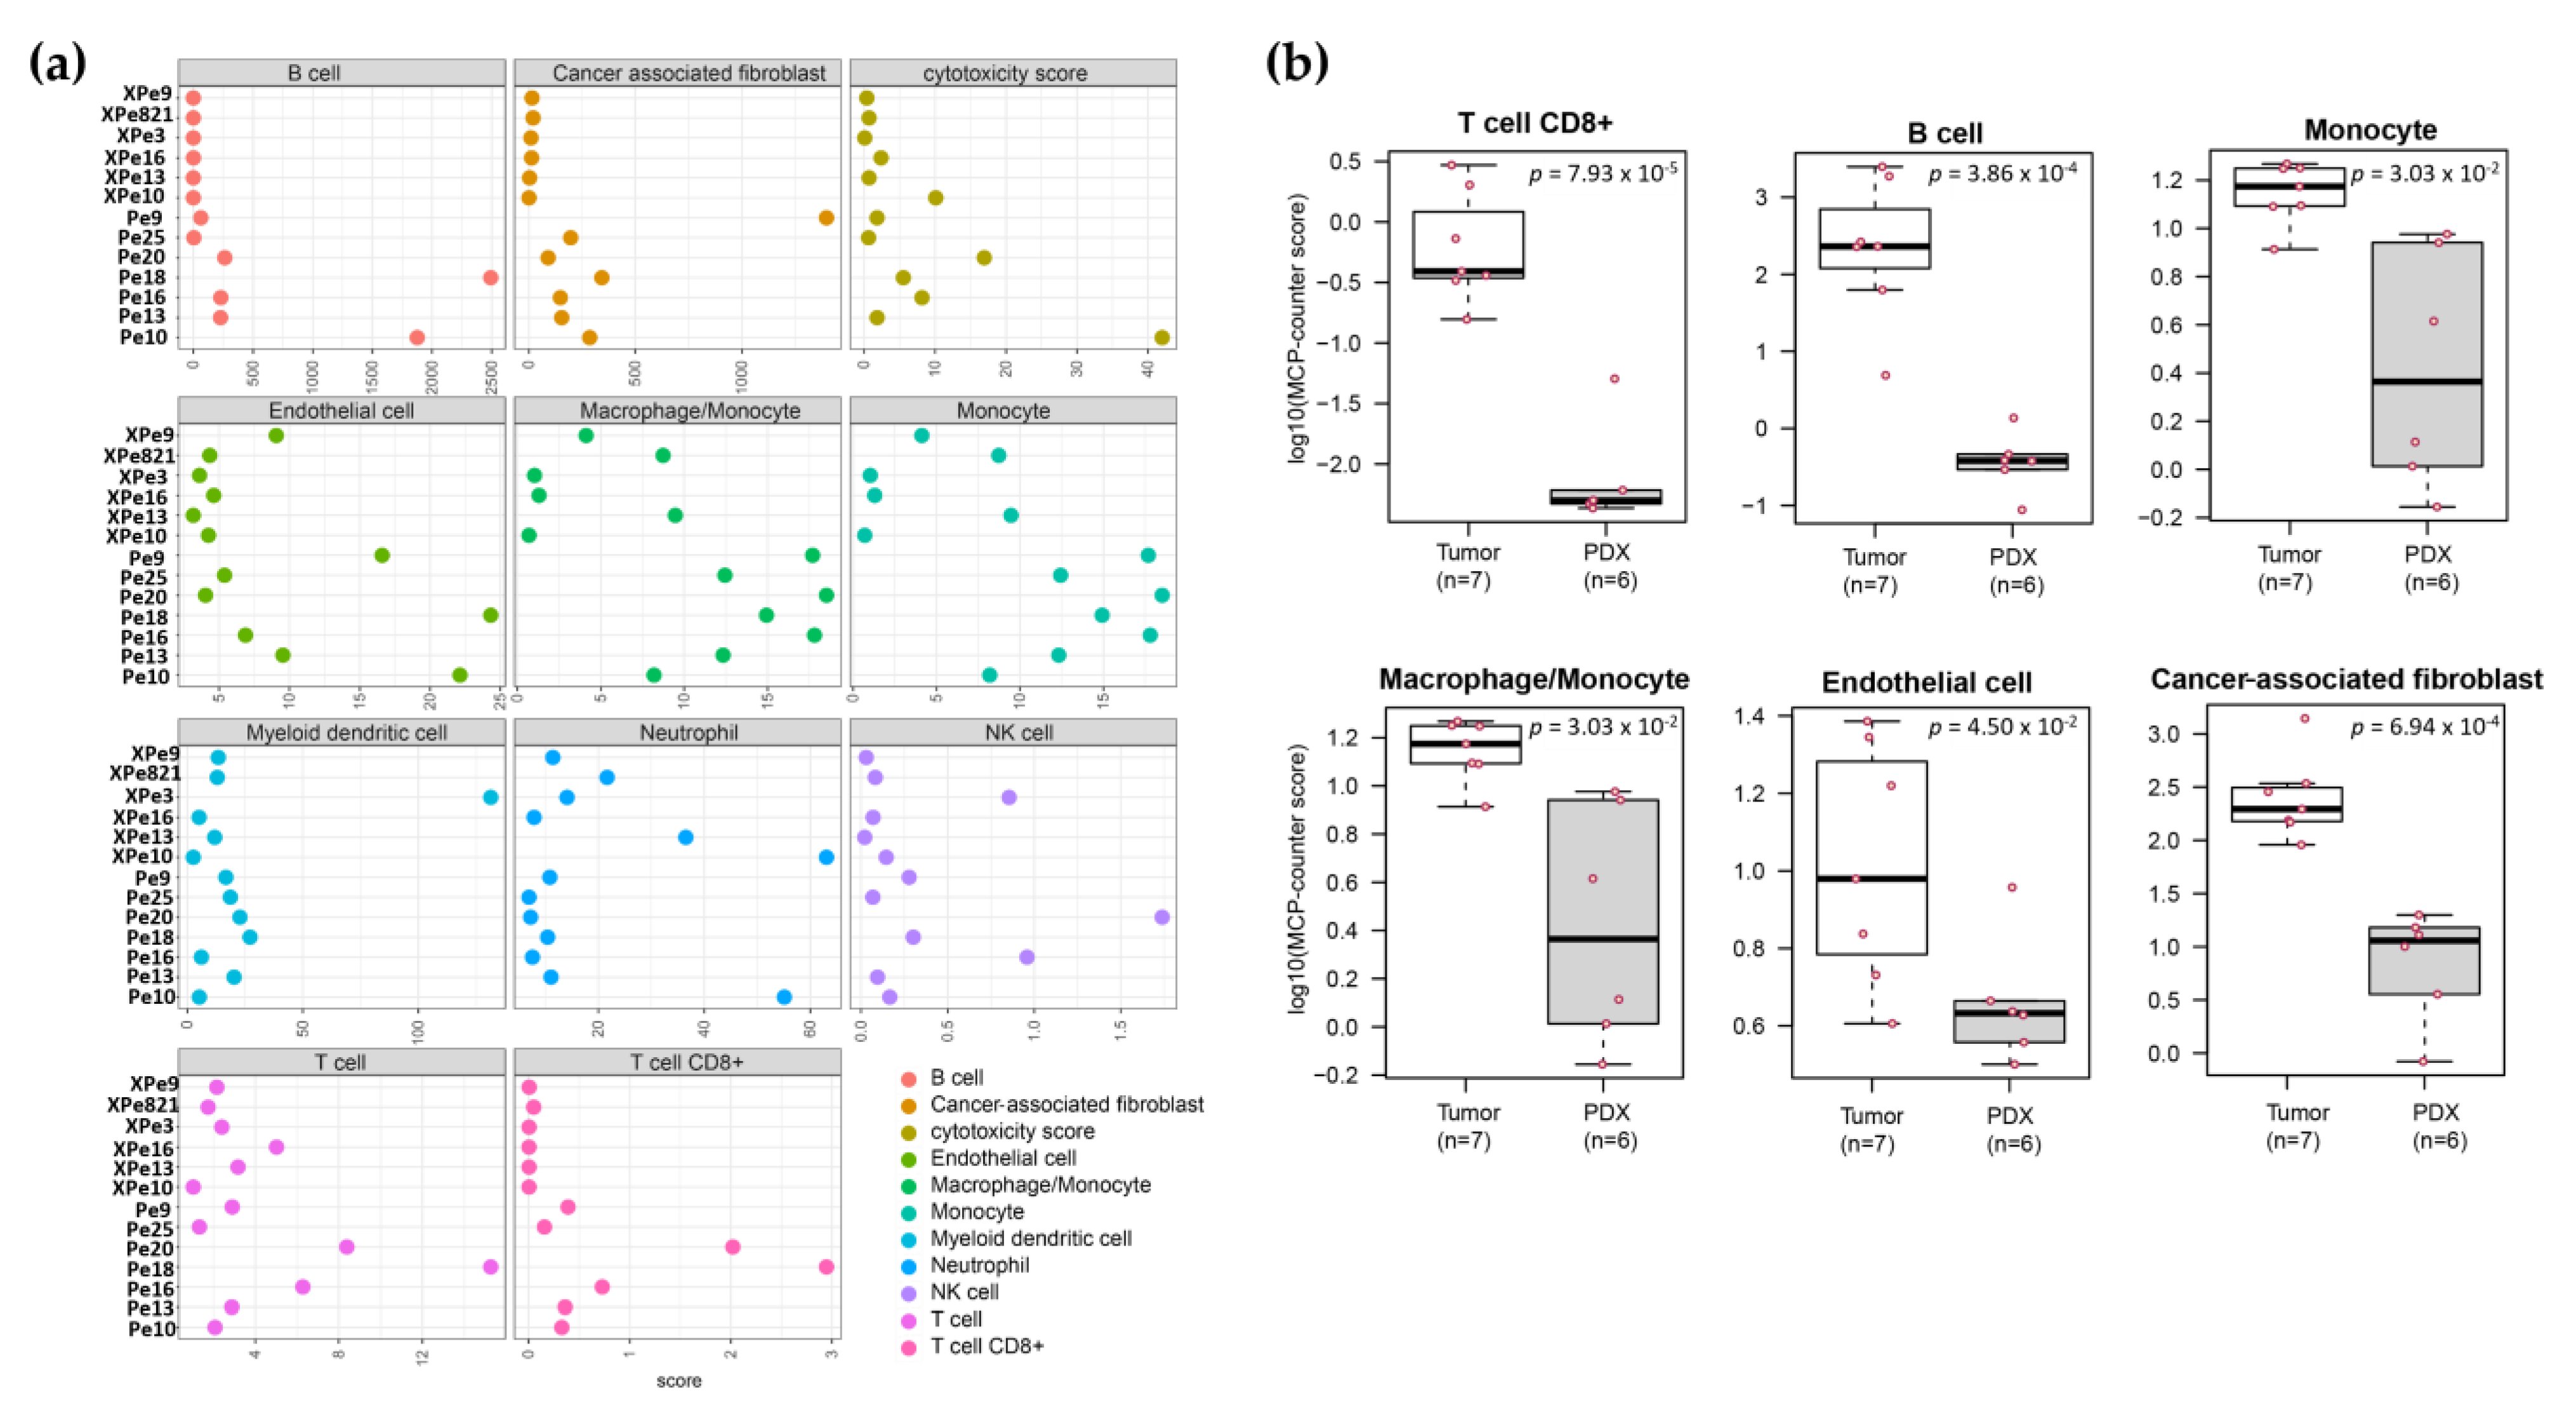
3.5. Transcriptomics
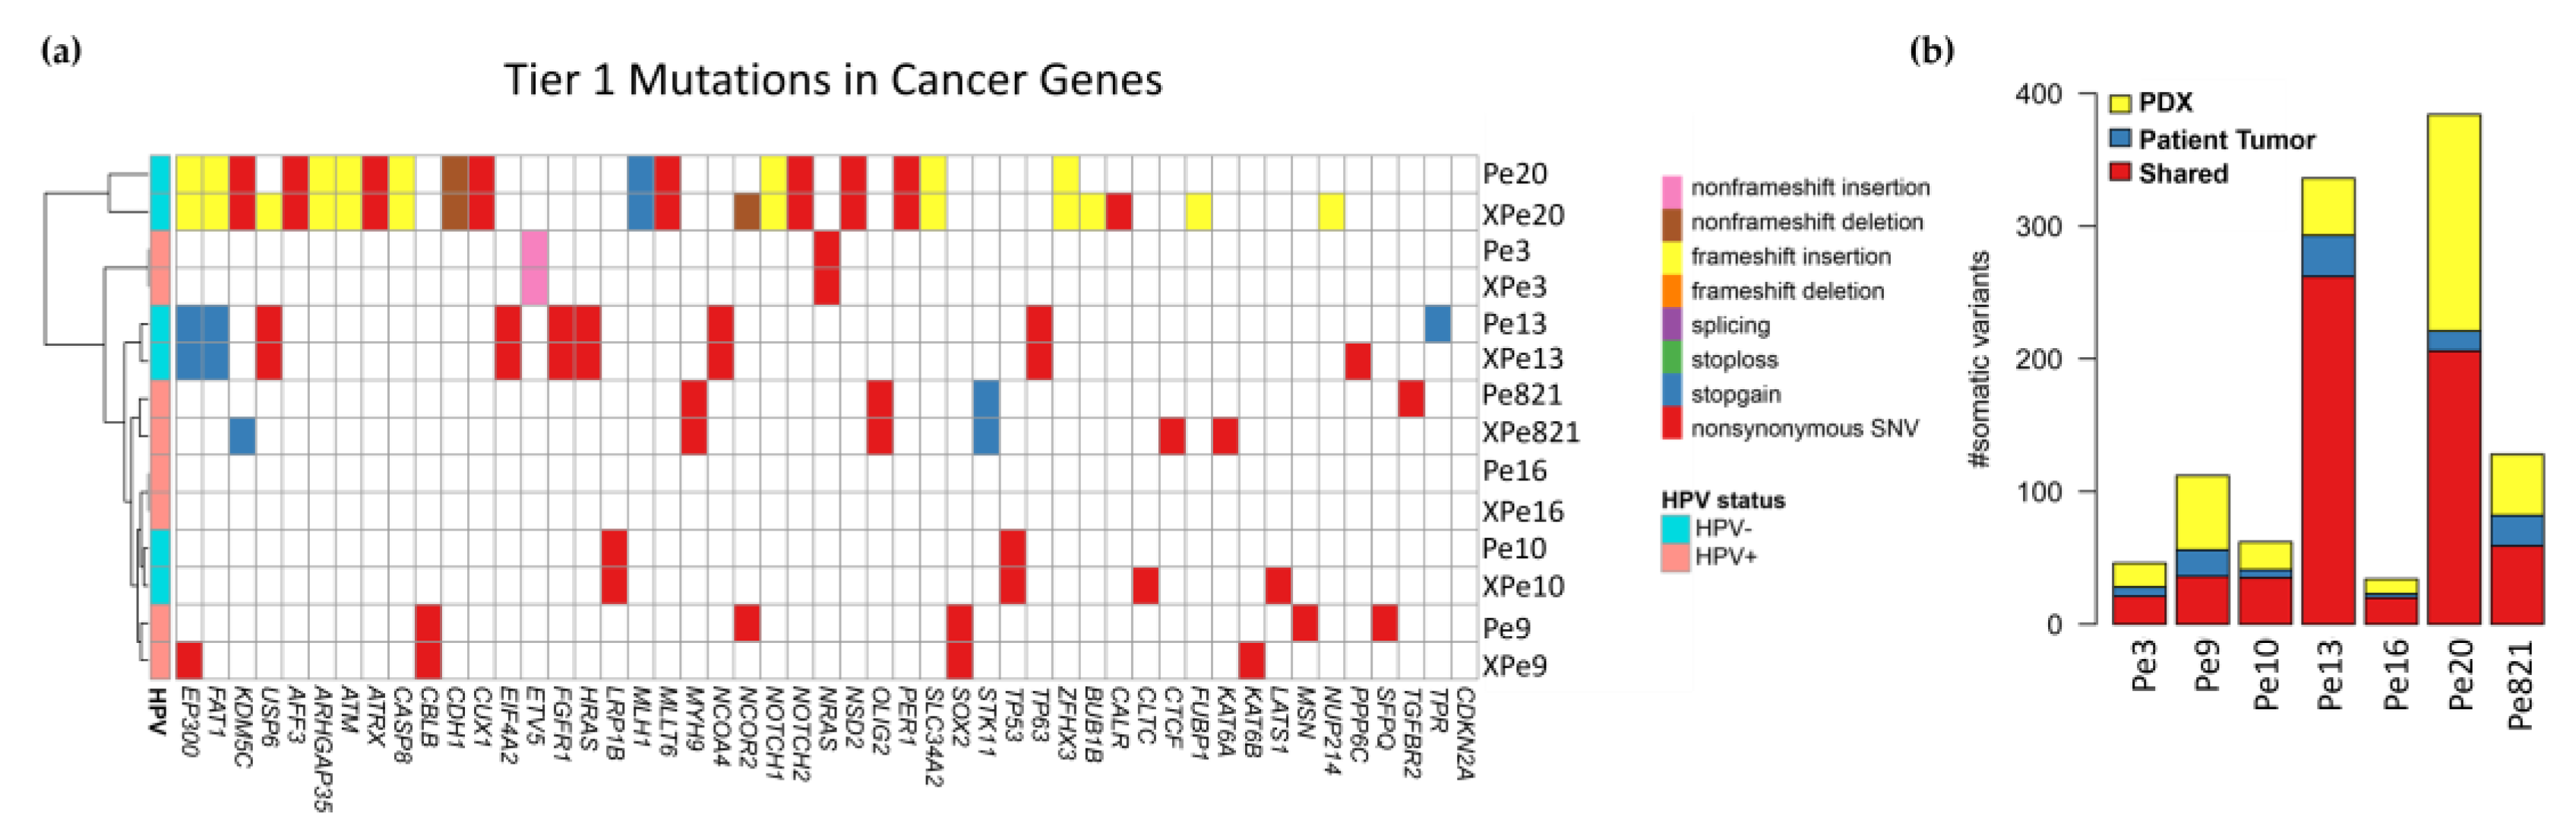
3.6. Genomics
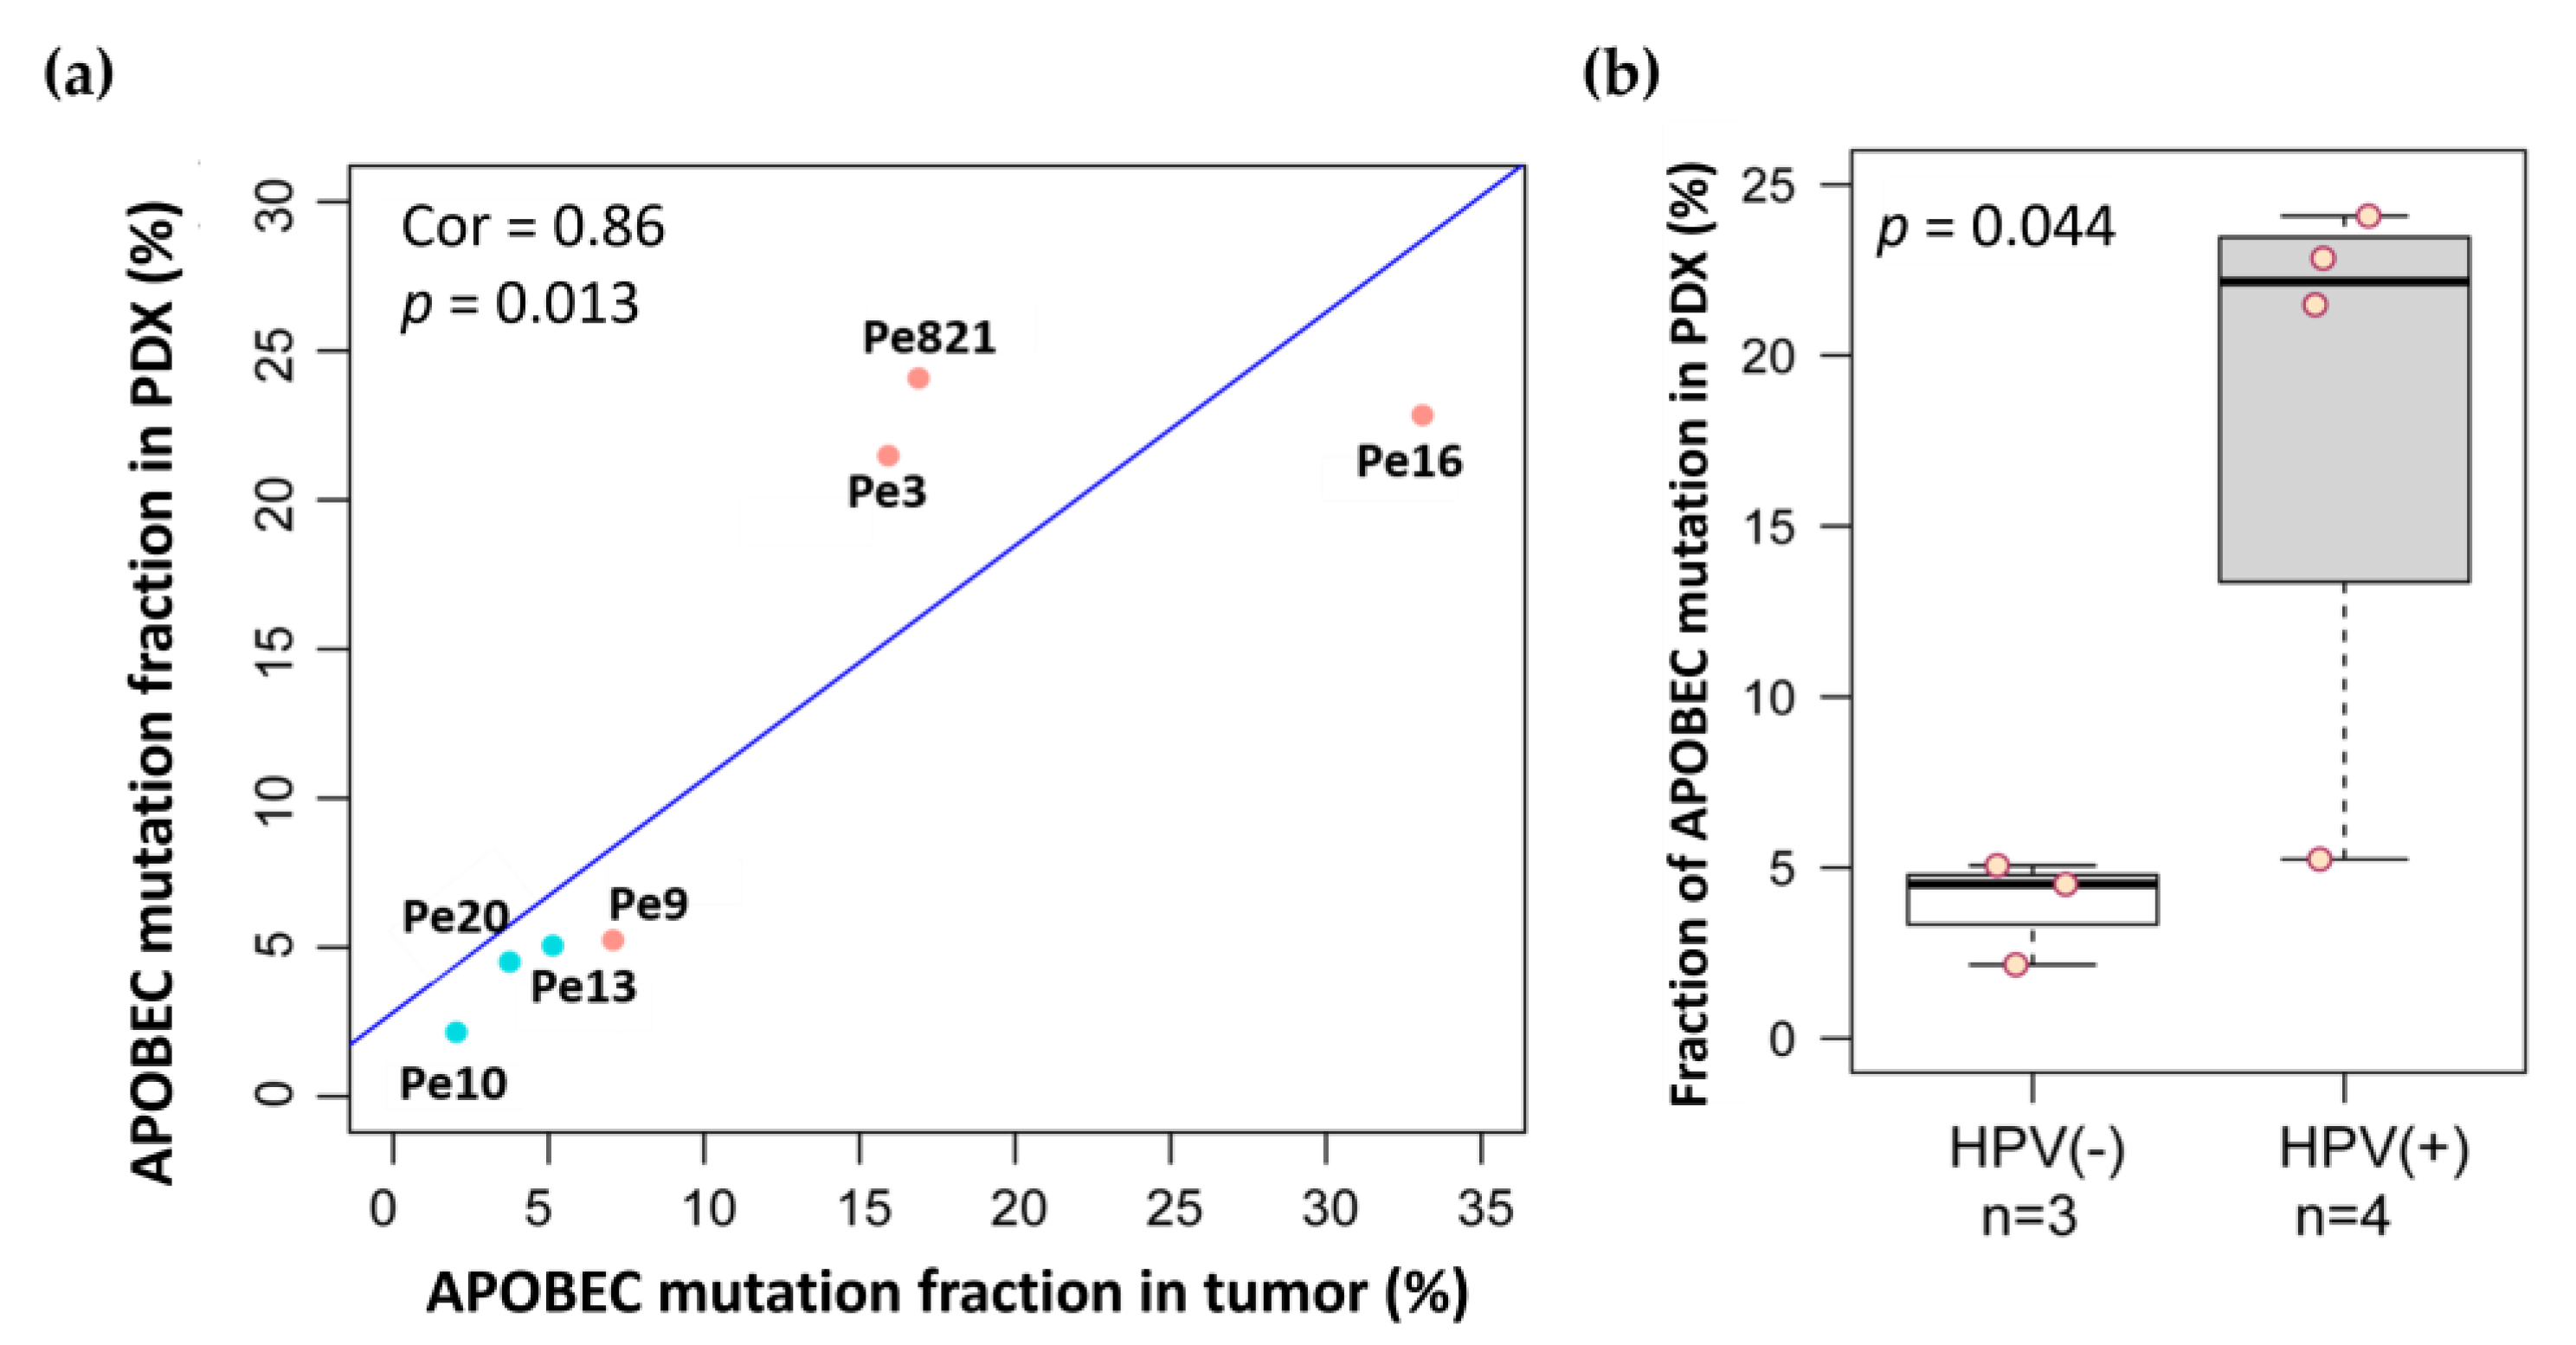
3.7. APOBEC Mutations
4. Discussion
5. Conclusions
Supplementary Materials
Author Contributions
Funding
Institutional Review Board Statement
Informed Consent Statement
Data Availability Statement
Conflicts of Interest
References
- Wang, J.; Pettaway, C.A.; Pagliaro, L.C. Treatment for Metastatic Penile Cancer After First-line Chemotherapy Failure: Analysis of Response and Survival Outcomes. Urology 2015, 85, 1104–1110. [Google Scholar] [CrossRef] [PubMed]
- Thomas, A.; Necchi, A.; Muneer, A.; Tobias-Machado, M.; Tran, A.T.H.; Van Rompuy, A.S.; Spiess, P.E.; Albersen, M. Penile cancer. Nat. Rev. Dis. Primers 2021, 7, 11. [Google Scholar] [CrossRef] [PubMed]
- Sand, F.L.; Rasmussen, C.L.; Frederiksen, M.H.; Andersen, K.K.; Kjaer, S.K. Prognostic Significance of HPV and p16 Status in Men Diagnosed with Penile Cancer: A Systematic Review and Meta-analysis. Cancer Epidemiol. Biomark. Prev. 2018, 27, 1123–1132. [Google Scholar] [CrossRef]
- zur Hausen, H. Papillomaviruses and cancer: From basic studies to clinical application. Nat. Rev. Cancer 2002, 2, 342–350. [Google Scholar] [CrossRef]
- Steinestel, J.; Al Ghazal, A.; Arndt, A.; Schnoeller, T.J.; Schrader, A.J.; Moeller, P.; Steinestel, K. The role of histologic subtype, p16(INK4a) expression, and presence of human papillomavirus DNA in penile squamous cell carcinoma. BMC Cancer 2015, 15, 220. [Google Scholar] [CrossRef]
- Langendijk, J.A.; Psyrri, A. The prognostic significance of p16 overexpression in oropharyngeal squamous cell carcinoma: Implications for treatment strategies and future clinical studies. Ann. Oncol. 2010, 21, 1931–1934. [Google Scholar] [CrossRef]
- Arsa, L.; Siripoon, T.; Trachu, N.; Foyhirun, S.; Pangpunyakulchai, D.; Sanpapant, S.; Jinawath, N.; Pattaranutaporn, P.; Jinawath, A.; Ngamphaiboon, N. Discrepancy in p16 expression in patients with HPV-associated head and neck squamous cell carcinoma in Thailand: Clinical characteristics and survival outcomes. BMC Cancer 2021, 21, 504. [Google Scholar] [CrossRef]
- Albers, A.E.; Qian, X.; Kaufmann, A.M.; Coordes, A. Meta analysis: HPV and p16 pattern determines survival in patients with HNSCC and identifies potential new biologic subtype. Sci. Rep. 2017, 7, 16715. [Google Scholar] [CrossRef]
- Mentrikoski, M.J.; Stelow, E.B.; Culp, S.; Frierson, H.F., Jr.; Cathro, H.P. Histologic and immunohistochemical assessment of penile carcinomas in a North American population. Am. J. Surg. Pathol. 2014, 38, 1340–1348. [Google Scholar] [CrossRef] [PubMed]
- Chahoud, J.; Zacharias, N.M.; Pham, R.; Qiao, W.; Guo, M.; Lu, X.; Alaniz, A.; Segarra, L.; Martinez-Ferrer, M.; Gleber-Netto, F.O.; et al. Prognostic Significance of p16 and Its Relationship with Human Papillomavirus Status in Patients with Penile Squamous Cell Carcinoma: Results of 5 Years Follow-Up. Cancers 2022, 14, 6024. [Google Scholar] [CrossRef] [PubMed]
- Parza, K.; Mustasam, A.; Ionescu, F.; Paravathaneni, M.; Sandstrom, R.; Safa, H.; Grass, G.D.; Johnstone, P.A.; Eschrich, S.A.; Chadha, J.; et al. The Prognostic Role of Human Papillomavirus and p16 Status in Penile Squamous Cell Carcinoma-A Systematic Review. Cancers 2023, 15, 3713. [Google Scholar] [CrossRef]
- Palanisamy, N.; Yang, J.; Shepherd, P.D.A.; Li-Ning-Tapia, E.M.; Labanca, E.; Manyam, G.C.; Ravoori, M.K.; Kundra, V.; Araujo, J.C.; Efstathiou, E.; et al. The MD Anderson Prostate Cancer Patient-derived Xenograft Series (MDA PCa PDX) Captures the Molecular Landscape of Prostate Cancer and Facilitates Marker-driven Therapy Development. Clin. Cancer Res. 2020, 26, 4933–4946. [Google Scholar] [CrossRef] [PubMed]
- Chaux, A.; Cubilla, A.L.; Haffner, M.C.; Lecksell, K.L.; Sharma, R.; Burnett, A.L.; Netto, G.J. Combining routine morphology, p16(INK4a) immunohistochemistry, and in situ hybridization for the detection of human papillomavirus infection in penile carcinomas: A tissue microarray study using classifier performance analyses. Urol. Oncol. 2014, 32, 171–177. [Google Scholar] [CrossRef] [PubMed]
- Cubilla, A.L.; Lloveras, B.; Alejo, M.; Clavero, O.; Chaux, A.; Kasamatsu, E.; Monfulleda, N.; Tous, S.; Alemany, L.; Klaustermeier, J.; et al. Value of p16(INK)(4)(a) in the pathology of invasive penile squamous cell carcinomas: A report of 202 cases. Am. J. Surg. Pathol. 2011, 35, 253–261. [Google Scholar] [CrossRef]
- Li, H.; Durbin, R. Fast and accurate long-read alignment with Burrows-Wheeler transform. Bioinformatics 2010, 26, 589–595. [Google Scholar] [CrossRef]
- Jardim-Perassi, B.V.; Alexandre, P.A.; Sonehara, N.M.; de Paula-Junior, R.; Reis Junior, O.; Fukumasu, H.; Chammas, R.; Coutinho, L.L.; Zuccari, D. RNA-Seq transcriptome analysis shows anti-tumor actions of melatonin in a breast cancer xenograft model. Sci. Rep. 2019, 9, 966. [Google Scholar] [CrossRef]
- Koboldt, D.C.; Zhang, Q.; Larson, D.E.; Shen, D.; McLellan, M.D.; Lin, L.; Miller, C.A.; Mardis, E.R.; Ding, L.; Wilson, R.K. VarScan 2: Somatic mutation and copy number alteration discovery in cancer by exome sequencing. Genome Res. 2012, 22, 568–576. [Google Scholar] [CrossRef]
- Yang, H.; Wang, K. Genomic variant annotation and prioritization with ANNOVAR and wANNOVAR. Nat. Protoc. 2015, 10, 1556–1566. [Google Scholar] [CrossRef] [PubMed]
- Sondka, Z.; Bamford, S.; Cole, C.G.; Ward, S.A.; Dunham, I.; Forbes, S.A. The COSMIC Cancer Gene Census: Describing genetic dysfunction across all human cancers. Nat. Rev. Cancer 2018, 18, 696–705. [Google Scholar] [CrossRef]
- Dobin, A.; Davis, C.A.; Schlesinger, F.; Drenkow, J.; Zaleski, C.; Jha, S.; Batut, P.; Chaisson, M.; Gingeras, T.R. STAR: Ultrafast universal RNA-seq aligner. Bioinformatics 2013, 29, 15–21. [Google Scholar] [CrossRef]
- Van Doorslaer, K.; Li, Z.; Xirasagar, S.; Maes, P.; Kaminsky, D.; Liou, D.; Sun, Q.; Kaur, R.; Huyen, Y.; McBride, A.A. The Papillomavirus Episteme: A major update to the papillomavirus sequence database. Nucleic Acids Res. 2017, 45, D499–D506. [Google Scholar] [CrossRef]
- Patro, R.; Duggal, G.; Love, M.I.; Irizarry, R.A.; Kingsford, C. Salmon provides fast and bias-aware quantification of transcript expression. Nat. Methods 2017, 14, 417–419. [Google Scholar] [CrossRef]
- Ritchie, M.E.; Phipson, B.; Wu, D.; Hu, Y.; Law, C.W.; Shi, W.; Smyth, G.K. limma powers differential expression analyses for RNA-sequencing and microarray studies. Nucleic Acids Res. 2015, 43, e47. [Google Scholar] [CrossRef]
- Robinson, M.D.; McCarthy, D.J.; Smyth, G.K. edgeR: A Bioconductor package for differential expression analysis of digital gene expression data. Bioinformatics 2010, 26, 139–140. [Google Scholar] [CrossRef]
- Leek, J.T.; Johnson, W.E.; Parker, H.S.; Jaffe, A.E.; Storey, J.D. The sva package for removing batch effects and other unwanted variation in high-throughput experiments. Bioinformatics 2012, 28, 882–883. [Google Scholar] [CrossRef] [PubMed]
- Becht, E.; Giraldo, N.A.; Lacroix, L.; Buttard, B.; Elarouci, N.; Petitprez, F.; Selves, J.; Laurent-Puig, P.; Sautes-Fridman, C.; Fridman, W.H.; et al. Estimating the population abundance of tissue-infiltrating immune and stromal cell populations using gene expression. Genome Biol. 2016, 17, 218. [Google Scholar] [CrossRef]
- Cathcart, A.M.; Smith, H.; Labrie, M.; Mills, G.B. Characterization of anticancer drug resistance by reverse-phase protein array: New targets and strategies. Expert. Rev. Proteomics 2022, 19, 115–129. [Google Scholar] [CrossRef] [PubMed]
- Shehwana, H.; Kumar, S.V.; Melott, J.M.; Rohrdanz, M.A.; Wakefield, C.; Ju, Z.; Siwak, D.R.; Lu, Y.; Broom, B.M.; Weinstein, J.N.; et al. RPPA SPACE: An R package for normalization and quantitation of Reverse-Phase Protein Array data. Bioinformatics 2022, 38, 5131–5133. [Google Scholar] [CrossRef] [PubMed]
- Tibes, R.; Qiu, Y.; Lu, Y.; Hennessy, B.; Andreeff, M.; Mills, G.B.; Kornblau, S.M. Reverse phase protein array: Validation of a novel proteomic technology and utility for analysis of primary leukemia specimens and hematopoietic stem cells. Mol. Cancer Ther. 2006, 5, 2512–2521. [Google Scholar] [CrossRef] [PubMed]
- Alexa, A.; Rahnenfuhrer, J.; Lengauer, T. Improved scoring of functional groups from gene expression data by decorrelating GO graph structure. Bioinformatics 2006, 22, 1600–1607. [Google Scholar] [CrossRef] [PubMed]
- Smith, N.J.; Fenton, T.R. The APOBEC3 genes and their role in cancer: Insights from human papillomavirus. J. Mol. Endocrinol. 2019, 62, R269–R287. [Google Scholar] [CrossRef]
- Thomas, A.; Vanthoor, J.; Himmelreich, U.; Cawthorne, C.; Deroose, C.M.; Gsell, W.; Spans, L.; Rizzotto, L.; Leucci, E.; Van Rompuy, A.S.; et al. Establishment, Characterization, and Imaging of a First Platinum-resistant Penile Cancer Patient-derived Xenograft in Nude Mice: A eUROGEN Project. Eur. Urol. 2020, 78, 294–296. [Google Scholar] [CrossRef]
- Elst, L.; Van Rompuy, A.S.; Roussel, E.; Spans, L.; Vanden Bempt, I.; Necchi, A.; Ross, J.; Jacob, J.M.; Baietti, M.F.; Leucci, E.; et al. Establishment and Characterization of Advanced Penile Cancer Patient-derived Tumor Xenografts: Paving the Way for Personalized Treatments. Eur. Urol. Focus. 2022, 8, 1787–1794. [Google Scholar] [CrossRef] [PubMed]
- He, Y.; Mei, J.; Hao, H.; Liu, F.; Yi, Y.; Hu, C.; Zou, F.; Lu, X. Selinexor demonstrates anti-tumor efficacy in paired patient-derived xenograft models and hydrogel-embedded histoculture drug sensitivity test of penile cancer. J. Cancer Res. Clin. Oncol. 2023, 149, 6931–6941. [Google Scholar] [CrossRef] [PubMed]
- Jung, J.; Seol, H.S.; Chang, S. The Generation and Application of Patient-Derived Xenograft Model for Cancer Research. Cancer Res. Treat. 2018, 50, 1–10. [Google Scholar] [CrossRef] [PubMed]
- Oswald, E.; Bug, D.; Grote, A.; Lashuk, K.; Bouteldja, N.; Lenhard, D.; Lohr, A.; Behnke, A.; Knauff, V.; Edinger, A.; et al. Immune cell infiltration pattern in non-small cell lung cancer PDX models is a model immanent feature and correlates with a distinct molecular and phenotypic make-up. J. Immunother. Cancer 2022, 10, e004412. [Google Scholar] [CrossRef] [PubMed]
- Suarez, E.; Gonzalez, L.; Perez-Mitchell, C.; Ortiz, A.P.; Ramirez-Sola, M.; Acosta, J.; Bernabe-Dones, R.D.; Gonzalez-Aquino, C.; Montes-Rodriguez, I.; Cadilla, C.L. Pathway Analysis using Gene-expression Profiles of HPV-positive and HPV-negative Oropharyngeal Cancer Patients in a Hispanic Population: Methodological Procedures. Puerto Rico Health Sci. J. 2016, 35, 3–8. [Google Scholar]
- Lohavanichbutr, P.; Houck, J.; Fan, W.; Yueh, B.; Mendez, E.; Futran, N.; Doody, D.R.; Upton, M.P.; Farwell, D.G.; Schwartz, S.M.; et al. Genomewide gene expression profiles of HPV-positive and HPV-negative oropharyngeal cancer: Potential implications for treatment choices. Arch Otolaryngol. Head Neck Surg. 2009, 135, 180–188. [Google Scholar] [CrossRef] [PubMed]
- Liggett, W.H., Jr.; Sidransky, D. Role of the p16 tumor suppressor gene in cancer. J. Clin. Oncol. 1998, 16, 1197–1206. [Google Scholar] [CrossRef] [PubMed]
- Wang, N.; Zhan, T.; Ke, T.; Huang, X.; Ke, D.; Wang, Q.; Li, H. Increased expression of RRM2 by human papillomavirus E7 oncoprotein promotes angiogenesis in cervical cancer. Br. J. Cancer 2014, 110, 1034–1044. [Google Scholar] [CrossRef]
- Wang, S.; Wang, X.L.; Wu, Z.Z.; Yang, Q.C.; Xiong, H.G.; Xiao, Y.; Li, H.; Sun, Z.J. Overexpression of RRM2 is related to poor prognosis in oral squamous cell carcinoma. Oral. Dis. 2021, 27, 204–214. [Google Scholar] [CrossRef]
- Liu, K.; Zheng, M.; Lu, R.; Du, J.; Zhao, Q.; Li, Z.; Li, Y.; Zhang, S. The role of CDC25C in cell cycle regulation and clinical cancer therapy: A systematic review. Cancer Cell Int. 2020, 20, 213. [Google Scholar] [CrossRef] [PubMed]
- Cybulska, M.; Olesinski, T.; Goryca, K.; Paczkowska, K.; Statkiewicz, M.; Kopczynski, M.; Grochowska, A.; Unrug-Bielawska, K.; Tyl-Bielicka, A.; Gajewska, M.; et al. Challenges in Stratifying the Molecular Variability of Patient-Derived Colon Tumor Xenografts. Biomed Res. Int. 2018, 2018, 2954208. [Google Scholar] [CrossRef] [PubMed]
- Richter-Pechanska, P.; Kunz, J.B.; Bornhauser, B.; von Knebel Doeberitz, C.; Rausch, T.; Erarslan-Uysal, B.; Assenov, Y.; Frismantas, V.; Marovca, B.; Waszak, S.M.; et al. PDX models recapitulate the genetic and epigenetic landscape of pediatric T-cell leukemia. EMBO Mol. Med. 2018, 10, e9443. [Google Scholar] [CrossRef] [PubMed]
- Wang, L.; Tsutsumi, S.; Kawaguchi, T.; Nagasaki, K.; Tatsuno, K.; Yamamoto, S.; Sang, F.; Sonoda, K.; Sugawara, M.; Saiura, A.; et al. Whole-exome sequencing of human pancreatic cancers and characterization of genomic instability caused by MLH1 haploinsufficiency and complete deficiency. Genome Res. 2012, 22, 208–219. [Google Scholar] [CrossRef] [PubMed]
- Gillison, M.L.; Akagi, K.; Xiao, W.; Jiang, B.; Pickard, R.K.L.; Li, J.; Swanson, B.J.; Agrawal, A.D.; Zucker, M.; Stache-Crain, B.; et al. Human papillomavirus and the landscape of secondary genetic alterations in oral cancers. Genome Res. 2019, 29, 1–17. [Google Scholar] [CrossRef]
- Chahoud, J.; Gleber-Netto, F.O.; McCormick, B.Z.; Rao, P.; Lu, X.; Guo, M.; Morgan, M.B.; Chu, R.A.; Martinez-Ferrer, M.; Eterovic, A.K.; et al. Whole-exome Sequencing in Penile Squamous Cell Carcinoma Uncovers Novel Prognostic Categorization and Drug Targets Similar to Head and Neck Squamous Cell Carcinoma. Clin. Cancer Res. 2021, 27, 2560–2570. [Google Scholar] [CrossRef] [PubMed]
- Medeiros-Fonseca, B.; Mestre, V.F.; Estevao, D.; Sanchez, D.F.; Canete-Portillo, S.; Fernandez-Nestosa, M.J.; Casaca, F.; Silva, S.; Brito, H.; Felix, A.; et al. HPV16 induces penile intraepithelial neoplasia and squamous cell carcinoma in transgenic mice: First mouse model for HPV-related penile cancer. J. Pathol. 2020, 251, 411–419. [Google Scholar] [CrossRef]
- Huang, T.; Cheng, X.; Chahoud, J.; Sarhan, A.; Tamboli, P.; Rao, P.; Guo, M.; Manyam, G.; Zhang, L.; Xiang, Y.; et al. Effective combinatorial immunotherapy for penile squamous cell carcinoma. Nat. Commun. 2020, 11, 2124. [Google Scholar] [CrossRef]


| Model Name | Age | Ethnicity | Tumor Site | HR-HPV | Histology | Path. Staging | Recurrence | Neoadj. Treatment |
|---|---|---|---|---|---|---|---|---|
| XPe821 | 68 | White | Penis | 16 | basaloid | rpT4NxM1 | yes | yes |
| XPe3 | 67 | White | Penis | 16 | basaloid | rpT2Nx | yes | |
| XPe9 | 33 | Latino | Lymph Node | 16 | SCC | pT3N3Mx | yes | yes |
| XPe10 | 80 | Latino | Penis | SCC | pT3N3Mx | yes | ||
| XPe13 | 67 | Latino | Penis | SCC | pT3Nx | |||
| XPe16 | 82 | White | Penis | 16 | basaloid | pT3N0 | ||
| XPe20 | 72 | Latino | Penis | SCC | pT3Nx |
| Tumor Tissue | CSF1PO | D13S317 | D16S539 | D18S51 | S21S11 | S5S818 | D7S820 | D8S1179 |
|---|---|---|---|---|---|---|---|---|
| Pe821 Donor | 10, 12 | 11 | 9, 10 | 15, 16 | 28, 29 | 11, 13 | 12 | 13, 14 |
| XPe821 P1 | 10, 12 | 11 | 9, 10 | 15, 16 | 28, 29 | 11, 13 | 12 | 13, 14 |
| XPe821 P5 | 10, 12 | 11 | 9, 10 | 15, 16 | 28, 29 | 11, 13 | 12 | 13, 14 |
| Pe3 Donor | 12 | 9, 11 | 9 | 12, 13 | 27, 33.2 | 11, 13 | 10, 12 | 13, 16 |
| XPe3 P1 | 12 | 9, 11 | 9 | 12, 13 | 27, 33.2 | 11, 13 | 10, 12 | 13, 16 |
| XPe3 P5 | 12 | 9, 11 | 9 | 12, 13 | 27, 33.2 | 11, 13 | 10, 12 | 13, 16 |
| Pe9 Donor | 7, 10 | 11 | 12 | 12, 14 | 29 | 11, 12 | 12 | 13 |
| XPe9 P1 | 7, 10 | 11 | 12 | 12, 14 | 29 | 11, 12 | 12 | 13 |
| XPe9 P5 | 7, 10 | 11 | 12 | 12, 14 | 29 | 11, 12 | 12 | 13 |
| Pe10 Donor | 11, 12 | 12 | 11, 12 | 12, 14 | 31, 32.2 | 11, 13 | 10, 12 | 12, 13 |
| XPe10 P1 | 11, 12 | 12 | 11, 12 | 12, 14 | 31, 32.2 | 11, 13 | 10, 12 | 12, 13 |
| XPe10 P5 | 11 | 12 | 11, 12 | 12, 14 | 32.2 | 11 | 10, 12 | 12, 13 |
| Pe13 Donor | 10, 12 | 9 | 10, 12 | 12, 15 | 30, 32 | 12 | 10, 12 | 11, 14 |
| XPe13 P1 | 10, 12 | 9 | 10, 12 | 12, 15 | 30, 32 | 12 | 10, 12 | 11, 14 |
| XPe13 P4 | 10, 12 | 9 | 10, 12 | 12, 15 | 30, 32 | 12 | 10, 12 | 11, 14 |
| Pe16 Donor | 11 | 11, 14 | 12, 13 | 12, 16 | 28, 29 | 9, 11 | 9, 10 | 12, 14 |
| XPe16 P1 | 11 | 11, 14 | 12, 13 | 12, 16 | 28, 29 | 9, 11 | 9, 10 | 12, 14 |
| XPe16 P5 | 11 | 14 | 12, 13 | 12 | 28, 29 | 9, 11 | 9, 10 | 12, 14 |
| Pe20 Donor | 12 | 9, 13,14 | 11, 12 | 16, 17 | 29, 30 | 7, 11 | 8, 11, 12 | 13, 15 |
| XPe20 P1 | 12 | 9, 14 | 11, 12 | 16 | 30 | 7, 11 | 8, 12 | 13, 15 |
| XPe20 P4 | 11, 12 | 9, 15 | 11 | 16 | 30, 31 | 7, 11 | 8, 12 | 14, 15 |
| Tumor Tissues | HPV16-E6 | HPV16-E6* | HPV16-E7 |
|---|---|---|---|
| XPe3 P3 | 319 | 1335 | 1402 |
| Pe9 Donor | 127 | 1200 | 524 |
| XPe9 P3 | 466 | 4049 | 2091 |
| Pe16 Donor | 379 | 1432 | 892 |
| XPe16 P2 | 329 | 1426 | 899 |
| XPe821 P2 | 377 | 3119 | 1367 |
| Pe10 Donor | 0 | 0 | 0 |
| XPe10 P3 | 0 | 0 | 0 |
| Pe13 Donor | 0 | 0 | 0 |
| XPe13 P3 | 0 | 0 | 0 |
| Donor Pe20 | 0 | 0 | 0 |
Disclaimer/Publisher’s Note: The statements, opinions and data contained in all publications are solely those of the individual author(s) and contributor(s) and not of MDPI and/or the editor(s). MDPI and/or the editor(s) disclaim responsibility for any injury to people or property resulting from any ideas, methods, instructions or products referred to in the content. |
© 2024 by the authors. Licensee MDPI, Basel, Switzerland. This article is an open access article distributed under the terms and conditions of the Creative Commons Attribution (CC BY) license (https://creativecommons.org/licenses/by/4.0/).
Share and Cite
Zacharias, N.M.; Segarra, L.; Akagi, K.; Fowlkes, N.W.; Chen, H.; Alaniz, A.; de la Cerda, C.; Pesquera, P.; Xi, Y.; Wang, J.; et al. Transcriptomic, Proteomic, and Genomic Mutational Fraction Differences Based on HPV Status Observed in Patient-Derived Xenograft Models of Penile Squamous Cell Carcinoma. Cancers 2024, 16, 1066. https://doi.org/10.3390/cancers16051066
Zacharias NM, Segarra L, Akagi K, Fowlkes NW, Chen H, Alaniz A, de la Cerda C, Pesquera P, Xi Y, Wang J, et al. Transcriptomic, Proteomic, and Genomic Mutational Fraction Differences Based on HPV Status Observed in Patient-Derived Xenograft Models of Penile Squamous Cell Carcinoma. Cancers. 2024; 16(5):1066. https://doi.org/10.3390/cancers16051066
Chicago/Turabian StyleZacharias, Niki M., Luis Segarra, Keiko Akagi, Natalie Wall Fowlkes, Huiqin Chen, Angelita Alaniz, Carolyn de la Cerda, Pedro Pesquera, Yuanxin Xi, Jing Wang, and et al. 2024. "Transcriptomic, Proteomic, and Genomic Mutational Fraction Differences Based on HPV Status Observed in Patient-Derived Xenograft Models of Penile Squamous Cell Carcinoma" Cancers 16, no. 5: 1066. https://doi.org/10.3390/cancers16051066
APA StyleZacharias, N. M., Segarra, L., Akagi, K., Fowlkes, N. W., Chen, H., Alaniz, A., de la Cerda, C., Pesquera, P., Xi, Y., Wang, J., Chahoud, J., Lu, X., Rao, P., Martinez-Ferrer, M., & Pettaway, C. A. (2024). Transcriptomic, Proteomic, and Genomic Mutational Fraction Differences Based on HPV Status Observed in Patient-Derived Xenograft Models of Penile Squamous Cell Carcinoma. Cancers, 16(5), 1066. https://doi.org/10.3390/cancers16051066