

Therapeutic Decision Making in Prevascular Mediastinal Tumors Using CT Radiomics and Clinical Features: Upfront Surgery or Pretreatment Needle Biopsy?
 , and
, and
Abstract
Simple Summary
Abstract
1. Introduction
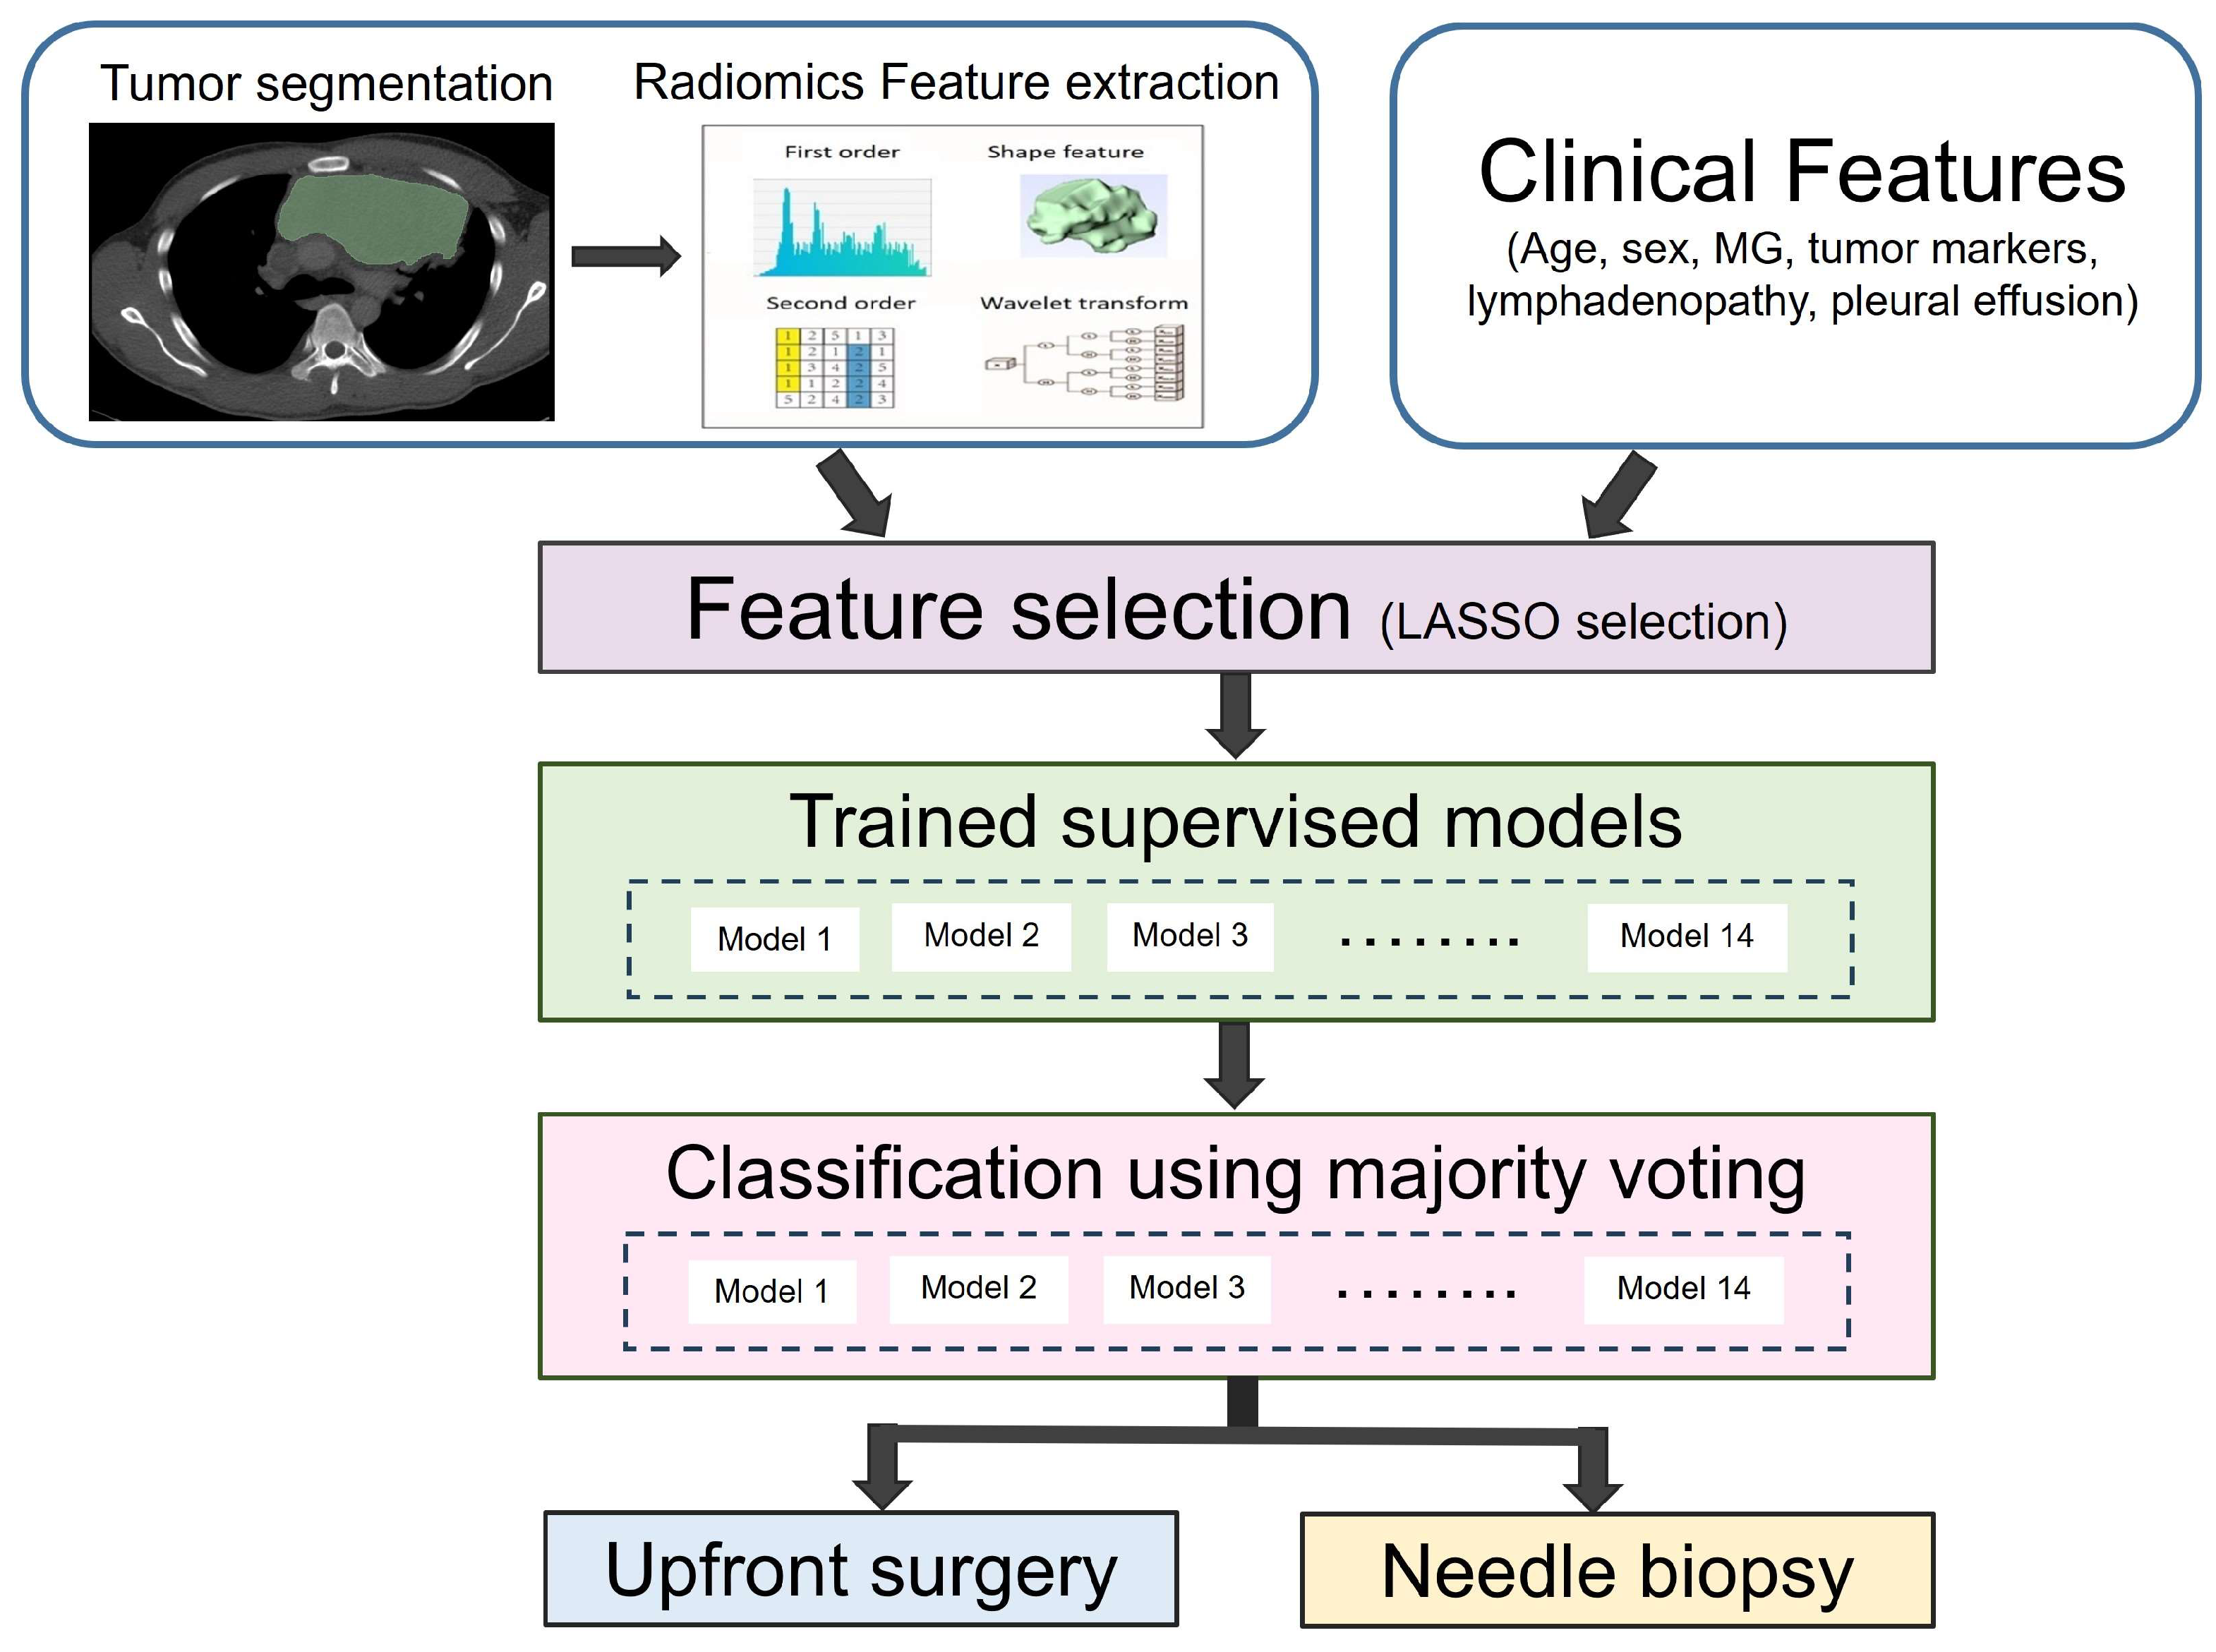
2. Methods
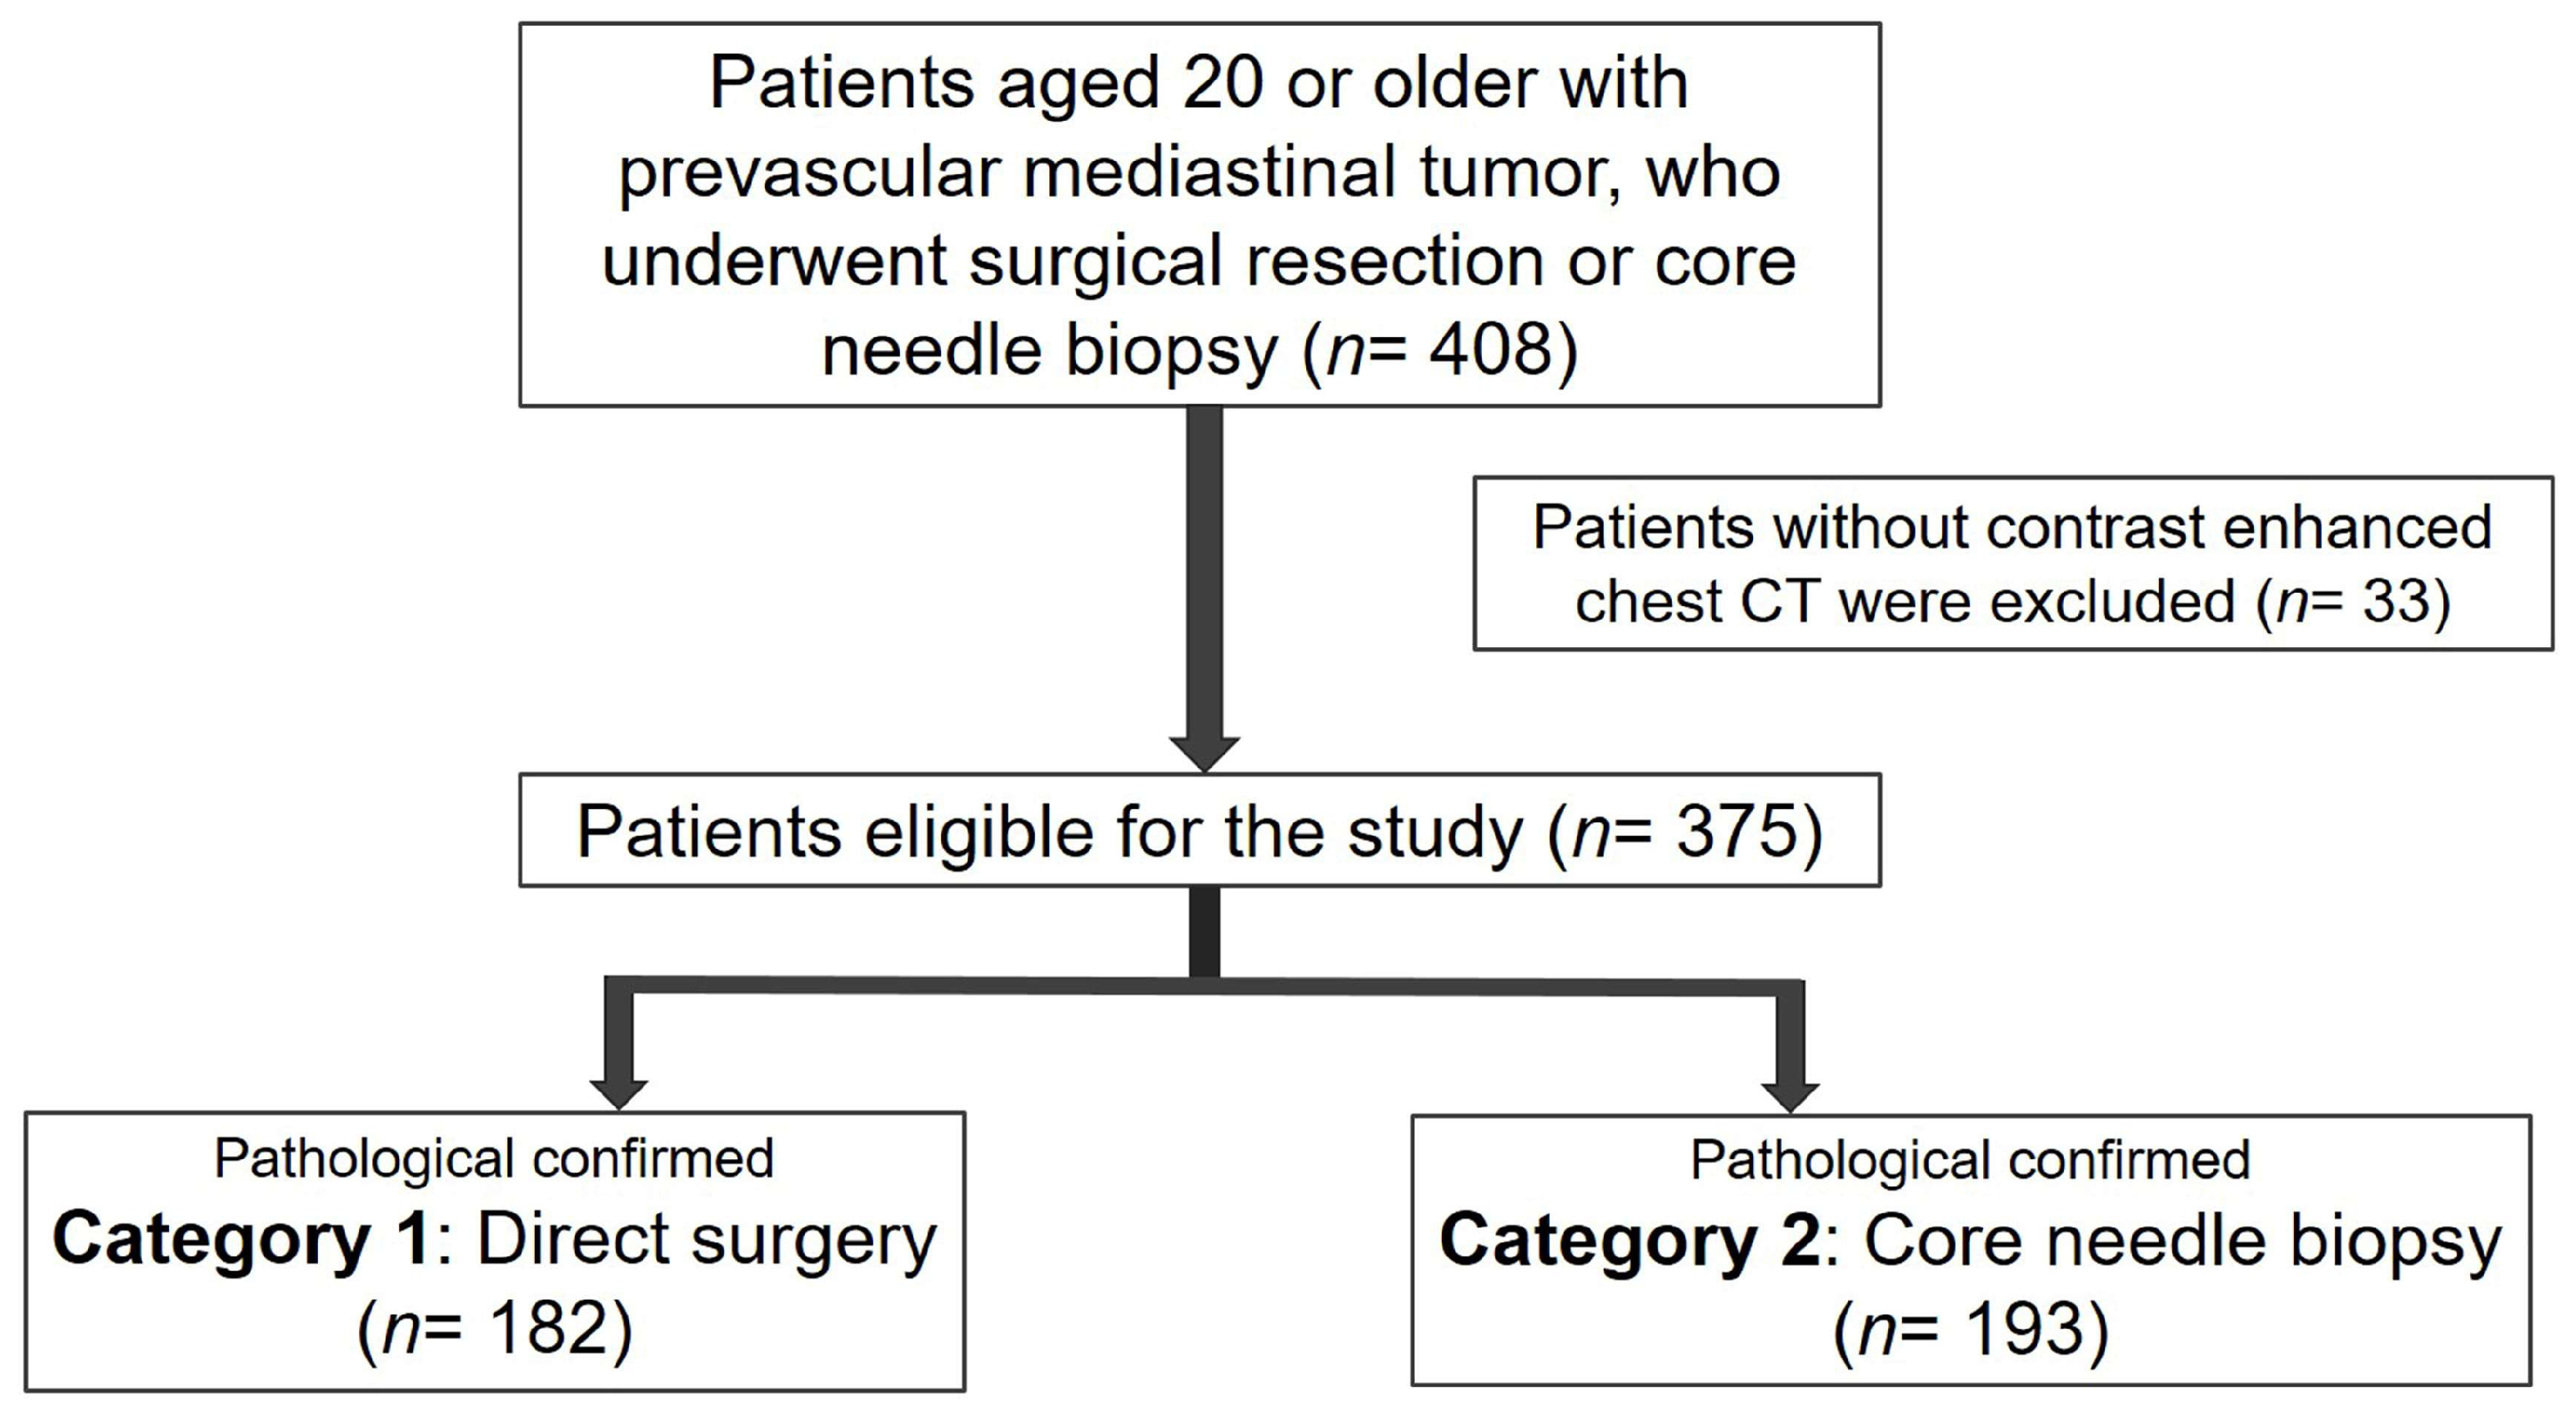
2.1. Patient Selection and Classification
2.2. Clinical Diagnosis and Clinical Data Collection
2.3. Image Acquisition and Preprocessing
2.4. Radiomic Feature Extraction and Selection
2.5. Machine Learning Model Building
2.6. Statistical Analyses
3. Results
3.1. Patient Selection and Grouping
3.2. Baseline Demographic and Clinical Characteristics
3.3. Classification Accuracy for Clinical Diagnosis
3.4. The Individual Machine Learning Model
3.5. Voting Ensemble Machine Learning Models
4. Discussion
5. Conclusions
Supplementary Materials
Author Contributions
Funding
Institutional Review Board Statement
Informed Consent Statement
Data Availability Statement
Conflicts of Interest
References
- Carter, B.W.; Benveniste, M.F.; Madan, R.; Godoy, M.C.; de Groot, P.M.; Truong, M.T.; Rosado-de-Christenson, M.L.; Marom, E.M. ITMIG Classification of Mediastinal Compartments and Multidisciplinary Approach to Mediastinal Masses. Radiographics 2017, 37, 413–436. [Google Scholar] [CrossRef]
- Araki, T.; Nishino, M.; Gao, W.; Dupuis, J.; Washko, G.R.; Hunninghake, G.M.; Murakami, T.; O’Connor, G.T.; Hatabu, H. Anterior Mediastinal Masses in the Framingham Heart Study: Prevalence and CT Image Characteristics. Eur. J. Radiol. Open 2015, 2, 26–31. [Google Scholar] [CrossRef]
- Yoon, S.H.; Choi, S.H.; Kang, C.H.; Goo, J.M. Incidental Anterior Mediastinal Nodular Lesions on Chest CT in Asymptomatic Subjects. J. Thorac. Oncol. 2018, 13, 359–366. [Google Scholar] [CrossRef] [PubMed]
- Miyazawa, R.; Matsusako, M.; Nozaki, T.; Kobayashi, D.; Kojima, F.; Bando, T.; Tateishi, U. Incidental mediastinal masses detected at low-dose CT screening: Prevalence and radiological characteristics. Jpn. J. Radiol. 2020, 38, 1150–1157. [Google Scholar] [CrossRef] [PubMed]
- Carter, B.W.; Benveniste, M.F.; Marom, E.M. Diagnostic approach to the anterior/prevascular mediastinum for radiologists. Mediastinum 2019, 3, 18. [Google Scholar] [CrossRef] [PubMed]
- Roden, A.C.; Fang, W.; Shen, Y.; Carter, B.W.; White, D.B.; Jenkins, S.M.; Spears, G.M.; Molina, J.R.; Klang, E.; Segni, M.D.; et al. Distribution of Mediastinal Lesions Across Multi-Institutional, International, Radiology Databases. J. Thorac. Oncol. 2020, 15, 568–579. [Google Scholar] [CrossRef] [PubMed]
- Pina-Oviedo, S. Mediastinal Lymphoproliferative Disorders. Adv. Anat. Pathol. 2021, 28, 307–334. [Google Scholar] [CrossRef] [PubMed]
- Nakazono, T.; Yamaguchi, K.; Egashira, R.; Mizuguchi, M.; Irie, H. Anterior mediastinal lesions: CT and MRI features and differential diagnosis. Jpn. J. Radiol. 2021, 39, 101–117. [Google Scholar] [CrossRef] [PubMed]
- Abramson, J.S. Hitting back at lymphoma: How do modern diagnostics identify high-risk diffuse large B-cell lymphoma subsets and alter treatment? Cancer 2019, 125, 3111–3120. [Google Scholar] [CrossRef]
- Conforti, F.; Pala, L.; Giaccone, G.; De Pas, T. Thymic epithelial tumors: From biology to treatment. Cancer Treat. Rev. 2020, 86, 102014. [Google Scholar] [CrossRef]
- Dreyling, M.; Thieblemont, C.; Gallamini, A.; Arcaini, L.; Campo, E.; Hermine, O.; Kluin-Nelemans, J.C.; Ladetto, M.; Le Gouill, S.; Iannitto, E.; et al. ESMO Consensus conferences: Guidelines on malignant lymphoma. part 2: Marginal zone lymphoma, mantle cell lymphoma, peripheral T-cell lymphoma. Ann. Oncol. Off. J. Eur. Soc. Med. Oncol. 2013, 24, 857–877. [Google Scholar] [CrossRef]
- Kattach, H.; Hasan, S.; Clelland, C.; Pillai, R. Seeding of stage I thymoma into the chest wall 12 years after needle biopsy. Ann. Thorac. Surg. 2005, 79, 323–324. [Google Scholar] [CrossRef]
- Di Crescenzo, V.; Vitale, M.; Valvano, L.; Napolitano, F.; Vatrella, A.; Zeppa, P.; De Rosa, G.; Amato, B.; Laperuta, P. Surgical management of cervico-mediastinal goiters: Our experience and review of the literature. Int. J. Surg. 2016, 28 (Suppl. 1), S47–S53. [Google Scholar] [CrossRef]
- Barrios, P.; Avella Patino, D. Surgical indications for mediastinal cysts—A narrative review. Mediastinum 2022, 6, 31. [Google Scholar] [CrossRef]
- Imbimbo, M.; Ottaviano, M.; Vitali, M.; Fabbri, A.; Leuzzi, G.; Fiore, M.; Franceschini, D.; Pasello, G.; Perrino, M.; Schiavon, M.; et al. Best practices for the management of thymic epithelial tumors: A position paper by the Italian collaborative group for ThYmic MalignanciEs (TYME). Cancer Treat. Rev. 2018, 71, 76–87. [Google Scholar] [CrossRef]
- Burgard, C.; Stahl, R.; de Figueiredo, G.N.; Dinkel, J.; Liebig, T.; Cioni, D.; Neri, E.; Trumm, C.G. Percutaneous CT Fluoroscopy-Guided Core Needle Biopsy of Mediastinal Masses: Technical Outcome and Complications of 155 Procedures during a 10-Year Period. Diagnostics 2021, 11, 781. [Google Scholar] [CrossRef] [PubMed]
- Lee, H.N.; Yun, S.J.; Kim, J.I.; Ryu, C.W. Diagnostic outcome and safety of CT-guided core needle biopsy for mediastinal masses: A systematic review and meta-analysis. Eur. Radiol. 2020, 30, 588–599. [Google Scholar] [CrossRef] [PubMed]
- Conci, N.; Grilli, G.; Dall’Olio, F.G. Principles of medical and oncological management of giant masses of the mediastinum: A narrative review. Mediastinum 2022, 6, 35. [Google Scholar] [CrossRef] [PubMed]
- Tartarone, A.; Lerose, R.; Lettini, A.R.; Tartarone, M. Current Treatment Approaches for Thymic Epithelial Tumors. Life 2023, 13, 1170. [Google Scholar] [CrossRef]
- Vulli, A.; Srinivasu, P.N.; Sashank, M.S.K.; Shafi, J.; Choi, J.; Ijaz, M.F. Fine-Tuned DenseNet-169 for Breast Cancer Metastasis Prediction Using FastAI and 1-Cycle Policy. Sensors 2022, 22, 2988. [Google Scholar] [CrossRef] [PubMed]
- Ahmad, I.; Merla, A.; Ali, F.; Shah, B.; AlZubi, A.A.; AlZubi, M.A. A deep transfer learning approach for COVID-19 detection and exploring a sense of belonging with Diabetes. Front. Public Health 2023, 11, 1308404. [Google Scholar] [CrossRef]
- Rao, G.E.; Rajitha, B.; Srinivasu, P.N.; Ijaz, M.F.; Woźniak, M. Hybrid framework for respiratory lung diseases detection based on classical CNN and quantum classifiers from chest X-rays. Biomed. Signal Process. Control. 2024, 88, 105567. [Google Scholar] [CrossRef]
- Praveen, S.P.; Srinivasu, P.N.; Shafi, J.; Wozniak, M.; Ijaz, M.F. ResNet-32 and FastAI for diagnoses of ductal carcinoma from 2D tissue slides. Sci. Rep. 2022, 12, 20804. [Google Scholar] [CrossRef] [PubMed]
- Kim, J.H.; Choe, J.; Kim, H.K.; Lee, H.Y. MRI-Based Stepwise Approach to Anterior Mediastinal Cystic Lesions for Diagnosis and Further Management. Korean J. Radiol. 2023, 24, 62–78. [Google Scholar] [CrossRef] [PubMed]
- Pang, J.; Xiu, W.; Ma, X. Application of Artificial Intelligence in the Diagnosis, Treatment, and Prognostic Evaluation of Mediastinal Malignant Tumors. J. Clin. Med. 2023, 12, 2818. [Google Scholar] [CrossRef] [PubMed]
- Liu, L.; Lu, F.; Pang, P.; Shao, G. Can computed tomography-based radiomics potentially discriminate between anterior mediastinal cysts and type B1 and B2 thymomas? Biomed. Eng. Online 2020, 19, 89. [Google Scholar] [CrossRef] [PubMed]
- Lin, C.Y.; Yen, Y.T.; Huang, L.T.; Chen, T.Y.; Liu, Y.S.; Tang, S.Y.; Huang, W.L.; Chen, Y.Y.; Lai, C.H.; Fang, Y.D.; et al. An MRI-Based Clinical-Perfusion Model Predicts Pathological Subtypes of Prevascular Mediastinal Tumors. Diagnostics 2022, 12, 889. [Google Scholar] [CrossRef]
- Shang, L.; Wang, F.; Gao, Y.; Zhou, C.; Wang, J.; Chen, X.; Chughtai, A.R.; Pu, H.; Zhang, G.; Kong, W. Machine-learning classifiers based on non-enhanced computed tomography radiomics to differentiate anterior mediastinal cysts from thymomas and low-risk from high-risk thymomas: A multi-center study. Front. Oncol. 2022, 12, 1043163. [Google Scholar] [CrossRef]
- Chang, C.C.; Tang, E.K.; Wei, Y.F.; Lin, C.Y.; Wu, F.Z.; Wu, M.T.; Liu, Y.S.; Yen, Y.T.; Ma, M.C.; Tseng, Y.L. Clinical radiomics-based machine learning versus three-dimension convolutional neural network analysis for differentiation of thymic epithelial tumors from other prevascular mediastinal tumors on chest computed tomography scan. Front. Oncol. 2023, 13, 1105100. [Google Scholar] [CrossRef]
- Garrana, S.H.; Rosado-de-Christenson, M.L. Imaging of the Anterior/Prevascular Mediastinum. Radiol. Clin. North Am. 2021, 59, 155–168. [Google Scholar] [CrossRef]
- Choe, J.; Lee, S.M.; Do, K.H.; Lee, G.; Lee, J.G.; Lee, S.M.; Seo, J.B. Deep Learning-based Image Conversion of CT Reconstruction Kernels Improves Radiomics Reproducibility for Pulmonary Nodules or Masses. Radiology 2019, 292, 365–373. [Google Scholar] [CrossRef]
- Sui, H.; Liu, L.; Li, X.; Zuo, P.; Cui, J.; Mo, Z. CT-based radiomics features analysis for predicting the risk of anterior mediastinal lesions. J. Thorac. Dis. 2019, 11, 1809–1818. [Google Scholar] [CrossRef]
- van Griethuysen, J.J.M.; Fedorov, A.; Parmar, C.; Hosny, A.; Aucoin, N.; Narayan, V.; Beets-Tan, R.G.H.; Fillion-Robin, J.C.; Pieper, S.; Aerts, H. Computational Radiomics System to Decode the Radiographic Phenotype. Cancer Res. 2017, 77, e104–e107. [Google Scholar] [CrossRef]
- Erickson, N.; Mueller, J.; Shirkov, A.; Zhang, H.; Larroy, P.; Li, M.; Smola, A. AutoGluon-Tabular: Robust and Accurate AutoML for Structured Data. arXiv 2020, arXiv:2003.06505. [Google Scholar]
- Abnoosian, K.; Farnoosh, R.; Behzadi, M.H. Prediction of diabetes disease using an ensemble of machine learning multi-classifier models. BMC Bioinform. 2023, 24, 337. [Google Scholar] [CrossRef]
- Janik, A.; Torrente, M.; Costabello, L.; Calvo, V.; Walsh, B.; Camps, C.; Mohamed, S.K.; Ortega, A.L.; Nováček, V.; Massutí, B.; et al. Machine Learning-Assisted Recurrence Prediction for Patients with Early-Stage Non-Small-Cell Lung Cancer. JCO Clin. Cancer Inform. 2023, 7, e2200062. [Google Scholar] [CrossRef]
- Shahab, M.; Zheng, G.; Khan, A.; Wei, D.; Novikov, A.S. Machine Learning-Based Virtual Screening and Molecular Simulation Approaches Identified Novel Potential Inhibitors for Cancer Therapy. Biomedicines 2023, 11, 2251. [Google Scholar] [CrossRef]
- Poola, R.G.; Pl, L. COVID-19 diagnosis: A comprehensive review of pre-trained deep learning models based on feature extraction algorithm. Results Eng. 2023, 18, 101020. [Google Scholar] [CrossRef] [PubMed]
- Flechner, L.; Tseng, T.Y. Understanding results: P-values, confidence intervals, and number need to treat. Indian J. Urol. IJU J. Urol. Soc. India 2011, 27, 532–535. [Google Scholar] [CrossRef]
- Bolboacă, S.D. Medical Diagnostic Tests: A Review of Test Anatomy, Phases, and Statistical Treatment of Data. Comput. Math. Methods Med. 2019, 2019, 1891569. [Google Scholar] [CrossRef] [PubMed]
- Le, V.H.; Kha, Q.H.; Minh, T.N.T.; Nguyen, V.H.; Le, V.L.; Le, N.Q.K. Development and Validation of CT-Based Radiomics Signature for Overall Survival Prediction in Multi-organ Cancer. J. Digit. Imaging 2023, 36, 911–922. [Google Scholar] [CrossRef] [PubMed]
- Kha, Q.H.; Le, V.H.; Hung, T.N.K.; Le, N.Q.K. Development and Validation of an Efficient MRI Radiomics Signature for Improving the Predictive Performance of 1p/19q Co-Deletion in Lower-Grade Gliomas. Cancers 2021, 13, 5398. [Google Scholar] [CrossRef] [PubMed]
- Prosch, H.; Röhrich, S.; Tekin, Z.N.; Ebner, L. The role of radiological imaging for masses in the prevascular mediastinum in clinical practice. J. Thorac. Dis. 2020, 12, 7591–7597. [Google Scholar] [CrossRef]
- Petranovic, M.; Gilman, M.D.; Muniappan, A.; Hasserjian, R.P.; Digumarthy, S.R.; Muse, V.V.; Sharma, A.; Shepard, J.A.; Wu, C.C. Diagnostic Yield of CT-Guided Percutaneous Transthoracic Needle Biopsy for Diagnosis of Anterior Mediastinal Masses. AJR. Am. J. Roentgenol. 2015, 205, 774–779. [Google Scholar] [CrossRef]
- Skretting, I.K.; Ruud, E.A.; Ashraf, H. Diagnostic yield, complications, pathology and anatomical features in CT-guided percutaneous needle biopsy of mediastinal tumours. PLoS ONE 2022, 17, e0277200. [Google Scholar] [CrossRef] [PubMed]
- Liu, K.; Li, Q.; Ma, J.; Zhou, Z.; Sun, M.; Deng, Y.; Tu, W.; Wang, Y.; Fan, L.; Xia, C.; et al. Evaluating a Fully Automated Pulmonary Nodule Detection Approach and Its Impact on Radiologist Performance. Radiol. Artif. Intell. 2019, 1, e180084. [Google Scholar] [CrossRef]
- Tomaszewski, M.R.; Gillies, R.J. The Biological Meaning of Radiomic Features. Radiology 2021, 298, 505–516. [Google Scholar] [CrossRef]
- Ghigna, M.R.; Thomas de Montpreville, V. Mediastinal tumours and pseudo-tumours: A comprehensive review with emphasis on multidisciplinary approach. Eur. Respir. Rev. 2021, 30, 200309. [Google Scholar] [CrossRef]
- Tewarie, I.A.; Senko, A.W.; Jessurun, C.A.C.; Zhang, A.T.; Hulsbergen, A.F.C.; Rendon, L.; McNulty, J.; Broekman, M.L.D.; Peng, L.C.; Smith, T.R.; et al. Predicting leptomeningeal disease spread after resection of brain metastases using machine learning. J. Neurosurg. 2022, 138, 1561–1569. [Google Scholar] [CrossRef]
- Gutman, R.; Aronson, D.; Caspi, O.; Shalit, U. What drives performance in machine learning models for predicting heart failure outcome? Eur. Heart J. Digit. Health 2023, 4, 175–187. [Google Scholar] [CrossRef]
- Erdemoglu, E.; Serel, T.A.; Karacan, E.; Köksal, O.K.; Turan, İ.; Öztürk, V.; Bozkurt, K.K. Artificial intelligence for prediction of endometrial intraepithelial neoplasia and endometrial cancer risks in pre- and postmenopausal women. AJOG Glob. Rep. 2023, 3, 100154. [Google Scholar] [CrossRef] [PubMed]
- Li, L.; Zhang, Z.; Zhou, L.; Zhang, Z.; Xiong, Y.; Hu, Z.; Yao, Y. Use of machine learning algorithms to predict life-threatening ventricular arrhythmia in sepsis. Eur. Heart J. Digit. Health 2023, 4, 245–253. [Google Scholar] [CrossRef] [PubMed]
- Park, C.; Mummaneni, P.V.; Gottfried, O.N.; Shaffrey, C.I.; Tang, A.J.; Bisson, E.F.; Asher, A.L.; Coric, D.; Potts, E.A.; Foley, K.T.; et al. Which supervised machine learning algorithm can best predict achievement of minimum clinically important difference in neck pain after surgery in patients with cervical myelopathy? A QOD study. Neurosurg. Focus 2023, 54, E5. [Google Scholar] [CrossRef]
- Karamti, H.; Alharthi, R.; Anizi, A.A.; Alhebshi, R.M.; Eshmawi, A.A.; Alsubai, S.; Umer, M. Improving Prediction of Cervical Cancer Using KNN Imputed SMOTE Features and Multi-Model Ensemble Learning Approach. Cancers 2023, 15, 4412. [Google Scholar] [CrossRef]
- Saidani, O.; Aljrees, T.; Umer, M.; Alturki, N.; Alshardan, A.; Khan, S.W.; Alsubai, S.; Ashraf, I. Enhancing Prediction of Brain Tumor Classification Using Images and Numerical Data Features. Diagnostics 2023, 13, 2544. [Google Scholar] [CrossRef]
- Sherazi, S.W.A.; Zheng, H.; Lee, J.Y. A Machine Learning-Based Applied Prediction Model for Identification of Acute Coronary Syndrome (ACS) Outcomes and Mortality in Patients during the Hospital Stay. Sensors 2023, 23, 1351. [Google Scholar] [CrossRef] [PubMed]
- Azour, L.; Moreira, A.L.; Washer, S.L.; Ko, J.P. Radiologic and pathologic correlation of anterior mediastinal lesions. Mediastinum 2020, 4, 5. [Google Scholar] [CrossRef] [PubMed]


| Characteristics | Total Population (n = 375) | Category 1 (n =182) | Category 2 (n = 193) | p-Value |
|---|---|---|---|---|
| Sex | 0.6387 | |||
| Female | 189 (50.4) | 94 (51.7) | 95 (49.2) | |
| Male | 186 (49.6) | 88 (48.3) | 98 (50.8) | |
| Age, median (Q1, Q3) | 59 (42, 69) | 61 (53, 70) | 54 (33, 68.5) | <0.0001 |
| MG symptoms | 57 (15.2) | 49 (26.9) | 8 (4.1) | <0.0001 |
| Pleural effusion | 87 (23.2) | 18 (9.9) | 69 (35.8) | <0.0001 |
| Mediastinal lymphadenopathy | 181 (48.3) | 39 (21.4) | 122 (63.2) | <0.0001 |
| Tumor markers | ||||
| † LDH (U/L) | 147 (39.2) | 31 | 116 | |
| Normal (≤225) | 68 | 22 | 46 | 0.0019 |
| Higher (>225) | 79 | 9 | 70 | |
| † AFP (mg/L) | 127 (33.9) | 45 | 82 | |
| Normal (≤20) | 117 | 45 | 72 | 0.0147 |
| Higher (>20) | 10 | 0 | 10 | |
| † HCG (IU/L) | 99 (26.4) | 31 | 68 | |
| Normal (≤7) | 92 | 31 | 61 | 0.0639 |
| Higher (>7) | 7 | 0 | 7 | |
| Diagnosis | ||||
| Resectable thymoma | 109 | |||
| Resectable thymic carcinoma | 20 | |||
| Thymic hyperplasia | 1 | |||
| Cyst | 32 | |||
| Teratoma | 14 | |||
| Thymolipoma | 5 | |||
| Lymphangioma | 1 | |||
| Unresectable thymoma | 23 | |||
| Unresectable thymic carcinoma | 77 | |||
| Lymphoma | 76 | |||
| Malignant germ cell tumor | 16 | |||
| Castleman disease | 1 |
| Algorithms | Macro F1-Score | Macro Precision | Macro Recall | Accuracy | AUROC |
|---|---|---|---|---|---|
| CatBoost | 0.8222 ± 0.0433 | 0.8253 ± 0.0428 | 0.8231 ± 0.0431 | 0.8227 ± 0.0430 | 0.8937 ± 0.0402 |
| ExtraTrees with Entropy | 0.7700 ± 0.0468 | 0.7717± 0.0465 | 0.7704 ± 0.0467 | 0.7707 ± 0.0465 | 0.8658 ± 0.0405 |
| ExtraTrees with Gini | 0.7637 ± 0.0458 | 0.7658 ± 0.0455 | 0.7642 ± 0.0458 | 0.7644 ± 0.0454 | 0.8628 ± 0.0393 |
| Kneighbors with Distance Weights | 0.6906 ± 0.0521 | 0.6940 ± 0.0501 | 0.6916 ± 0.0508 | 0.6924 ± 0.0511 | 0.7615 ± 0.0456 |
| Kneighbors with Uniform Weights | 0.6910 ± 0.0510 | 0.6945 ± 0.0488 | 0.6920 ± 0.0497 | 0.6929 ± 0.0499 | 0.7562 ± 0.0435 |
| LightGBM | 0.8040 ± 0.0408 | 0.8064 ± 0.0412 | 0.8048 ± 0.0412 | 0.8044 ± 0.0406 | 0.8792 ± 0.0379 |
| LightGBMLarge | 0.8131 ± 0.0434 | 0.8180 ± 0.0401 | 0.8141 ± 0.0429 | 0.8142 ± 0.0422 | 0.8962 ± 0.0318 |
| LightGBM with ExtraTrees | 0.8203 ± 0.0453 | 0.8231 ± 0.0444 | 0.8210 ± 0.0451 | 0.8209 ± 0.0449 | 0.8939 ± 0.0419 |
| NeuralNetFastAI | 0.7314 ± 0.0669 | 0.7472 ± 0.0578 | 0.7379 ± 0.0618 | 0.7342 ± 0.0634 | 0.8272 ± 0.0495 |
| NeuralNetTorch | 0.7837 ± 0.0525 | 0.7878 ± 0.0534 | 0.7848 ± 0.0525 | 0.7844 ± 0.0523 | 0.8658 ± 0.0475 |
| RandomForest with Entropy | 0.8036 ± 0.0456 | 0.8059 ± 0.0450 | 0.8045 ± 0.0455 | 0.8040 ± 0.0454 | 0.8779 ± 0.0393 |
| RandomForest with Gini | 0.8013 ± 0.0475 | 0.8038 ± 0.0465 | 0.8024 ± 0.0474 | 0.8018 ± 0.0472 | 0.8722 ± 0.0420 |
| WeightedEnsemble_L2 | 0.8128 ± 0.0459 | 0.8156 ± 0.0451 | 0.8136 ± 0.0457 | 0.8133 ± 0.0457 | 0.8901 ± 0.034 |
| XGBoost | 0.8186 ± 0.0420 | 0.8215 ± 0.0419 | 0.8194 ± 0.0422 | 0.8191 ± 0.0417 | 0.8927 ± 0.0337 |
| Lambda | Macro F1-Score | Macro Precision | Macro Recall | Accuracy | ROC-AUC | |
|---|---|---|---|---|---|---|
| Selection_1 | 0.048626 | 0.8183 ± 0.0441 | 0.8220 ± 0.0431 | 0.8188 ± 0.0443 | 0.8191 ± 0.0435 | 0.9061 ± 0.0345 |
| Selection_2 | 0.035112 | 0.8306 ± 0.0350 | 0.8327 ± 0.0348 | 0.8308 ± 0.0350 | 0.8311 ± 0.0347 | 0.9106 ± 0.0301 |
| Selection_3 | 0.025354 | 0.8417 ± 0.0426 | 0.8444 ± 0.0423 | 0.8422 ± 0.0427 | 0.8422 ± 0.0423 | 0.9114 ± 0.0324 |
| Selection_4 | 0.018307 | 0.8305 ± 0.0447 | 0.8327 ± 0.0448 | 0.8307 ± 0.0447 | 0.8311 ± 0.0445 | 0.9095 ± 0.0356 |
| Selection_5 | 0.013219 | 0.8300 ± 0.0471 | 0.8325 ± 0.0471 | 0.8302 ± 0.0471 | 0.8307 ± 0.0467 | 0.9092 ± 0.0352 |
| Selection_6 | 0.009545 | 0.8264 ± 0.0380 | 0.8296 ± 0.0387 | 0.8266 ± 0.0380 | 0.8271 ± 0.0378 | 0.9027 ± 0.0350 |
| Selection_7 | 0.006893 | 0.8305 ± 0.0499 | 0.8334 ± 0.0491 | 0.8309 ± 0.0498 | 0.8311 ± 0.0496 | 0.8971 ± 0.0450 |
| Selection_8 | 0.004977 | 0.8385 ± 0.0329 | 0.8419 ± 0.0326 | 0.8389 ± 0.0329 | 0.8391 ± 0.0326 | 0.9064 ± 0.0301 |
| Selection_9 | 0.003594 | 0.8347 ± 0.0366 | 0.8372 ± 0.0371 | 0.8353 ± 0.0363 | 0.8351 ± 0.0366 | 0.9086 ± 0.0304 |
| Selection_10 | 0.002595 | 0.8365 ± 0.0465 | 0.8391 ± 0.0466 | 0.8374 ± 0.0463 | 0.8369 ± 0.0464 | 0.9030 ± 0.0423 |
| Selection_11 | 0.001874 | 0.8315 ± 0.0436 | 0.8346 ± 0.0429 | 0.8325 ± 0.0436 | 0.8320 ± 0.0433 | 0.9025 ± 0.0293 |
| Selection_12 | 0.001353 | 0.8315 ± 0.0439 | 0.8344 ± 0.0448 | 0.8318 ± 0.0437 | 0.8320 ± 0.0440 | 0.9023 ± 0.0408 |
| Selection_13 | 0.000977 | 0.8274 ± 0.0426 | 0.8303 ± 0.0436 | 0.8278 ± 0.0427 | 0.8280 ± 0.0425 | 0.9034 ± 0.0375 |
| Selection_14 | 0.000705 | 0.8319 ± 0.0362 | 0.8349 ± 0.0366 | 0.8324 ± 0.0361 | 0.8324 ± 0.0360 | 0.9066 ± 0.0336 |
| Selection_15 | 0.000509 | 0.8275 ± 0.0479 | 0.8304 ± 0.0481 | 0.8281 ± 0.0481 | 0.8280 ± 0.0478 | 0.8978 ± 0.0341 |
| Selection_16 | 0.000368 | 0.8284 ± 0.0419 | 0.8303 ± 0.0420 | 0.8286 ± 0.0419 | 0.8289 ± 0.0417 | 0.8981 ± 0.0430 |
| Selection_17 | 0.000266 | 0.8311 ± 0.0443 | 0.8335 ± 0.0445 | 0.8316 ± 0.0442 | 0.8316 ± 0.0442 | 0.9016 ± 0.0408 |
| Selection_18 | 0.000192 | 0.8319 ± 0.0407 | 0.8348 ± 0.0402 | 0.8326 ± 0.0406 | 0.8324 ± 0.0405 | 0.9034 ± 0.0353 |
| Selection_19 | 0.000138 | 0.8352 ± 0.0438 | 0.8377 ± 0.0447 | 0.8357 ± 0.0436 | 0.8356 ± 0.0438 | 0.9030 ± 0.0422 |
| Selection_20 | 0.000100 | 0.8238 ± 0.0636 | 0.8263 ± 0.0626 | 0.8243 ± 0.0632 | 0.8244 ± 0.0630 | 0.8920 ± 0.0497 |
| All | - | 0.8222 ± 0.0433 | 0.8253 ± 0.0428 | 0.8231 ± 0.0431 | 0.8227 ± 0.0430 | 0.8937 ± 0.0402 |
| LASSO Selection | Model Count | Macro F1-Score | Macro Precision | Macro Recall | Accuracy | ROC-AUC |
|---|---|---|---|---|---|---|
| Selection_3 | 3 | 0.8606 ± 0.0580 | 0.8620 ± 0.0567 | 0.8638 ± 0.0579 | 0.8614 ± 0.0577 | 0.8977 ± 0.0476 |
| Selection_3 | 5 | 0.8530 ± 0.0597 | 0.8618 ± 0.0503 | 0.8542 ± 0.0587 | 0.8561 ± 0.0565 | 0.9170 ± 0.0368 |
| Selection_3 | 7 | 0.8799 ± 0.0358 | 0.8800 ± 0.0355 | 0.8831 ± 0.0358 | 0.8804 ± 0.0358 | 0.9250 ± 0.0353 |
| Selection_3 | 9 | 0.8790 ± 0.0361 | 0.8795 ± 0.0358 | 0.8810 ± 0.0366 | 0.8798 ± 0.0362 | 0.9296 ± 0.0343 |
| All | 3 | 0.8229 ± 0.0494 | 0.8248 ± 0.0490 | 0.8257 ± 0.0488 | 0.8239 ± 0.0492 | 0.8706 ± 0.0390 |
| All | 5 | 0.8094 ± 0.0423 | 0.8176 ± 0.0427 | 0.8095 ± 0.0423 | 0.8128 ± 0.0416 | 0.8872 ± 0.0338 |
| All | 7 | 0.8341 ± 0.0412 | 0.8358 ± 0.0407 | 0.8369 ± 0.0404 | 0.8350 ± 0.0412 | 0.8950 ± 0.0310 |
| All | 9 | 0.8254 ± 0.0396 | 0.8285 ± 0.0406 | 0.8265 ± 0.0393 | 0.8271 ± 0.0401 | 0.8995 ± 0.0294 |
Disclaimer/Publisher’s Note: The statements, opinions and data contained in all publications are solely those of the individual author(s) and contributor(s) and not of MDPI and/or the editor(s). MDPI and/or the editor(s) disclaim responsibility for any injury to people or property resulting from any ideas, methods, instructions or products referred to in the content. |
© 2024 by the authors. Licensee MDPI, Basel, Switzerland. This article is an open access article distributed under the terms and conditions of the Creative Commons Attribution (CC BY) license (https://creativecommons.org/licenses/by/4.0/).
Share and Cite
Chang, C.-C.; Lin, C.-Y.; Liu, Y.-S.; Chen, Y.-Y.; Huang, W.-L.; Lai, W.-W.; Yen, Y.-T.; Ma, M.-C.; Tseng, Y.-L. Therapeutic Decision Making in Prevascular Mediastinal Tumors Using CT Radiomics and Clinical Features: Upfront Surgery or Pretreatment Needle Biopsy? Cancers 2024, 16, 773. https://doi.org/10.3390/cancers16040773
Chang C-C, Lin C-Y, Liu Y-S, Chen Y-Y, Huang W-L, Lai W-W, Yen Y-T, Ma M-C, Tseng Y-L. Therapeutic Decision Making in Prevascular Mediastinal Tumors Using CT Radiomics and Clinical Features: Upfront Surgery or Pretreatment Needle Biopsy? Cancers. 2024; 16(4):773. https://doi.org/10.3390/cancers16040773
Chicago/Turabian StyleChang, Chao-Chun, Chia-Ying Lin, Yi-Sheng Liu, Ying-Yuan Chen, Wei-Li Huang, Wu-Wei Lai, Yi-Ting Yen, Mi-Chia Ma, and Yau-Lin Tseng. 2024. "Therapeutic Decision Making in Prevascular Mediastinal Tumors Using CT Radiomics and Clinical Features: Upfront Surgery or Pretreatment Needle Biopsy?" Cancers 16, no. 4: 773. https://doi.org/10.3390/cancers16040773
APA StyleChang, C.-C., Lin, C.-Y., Liu, Y.-S., Chen, Y.-Y., Huang, W.-L., Lai, W.-W., Yen, Y.-T., Ma, M.-C., & Tseng, Y.-L. (2024). Therapeutic Decision Making in Prevascular Mediastinal Tumors Using CT Radiomics and Clinical Features: Upfront Surgery or Pretreatment Needle Biopsy? Cancers, 16(4), 773. https://doi.org/10.3390/cancers16040773