Article

Using Flavonoid Substitution Status to Predict Anticancer Effects in Human Melanoma Cancers: An In Vitro Study

by
Katarzyna Jakimiuk
1,*,
Łukasz Szoka
2,
Arkadiusz Surażyński
2 and
Michał Tomczyk
1
1
Department of Pharmacognosy, Faculty of Pharmacy with the Division of Laboratory Medicine, Medical University of Białystok, ul. Mickiewicza 2a, 15-230 Białystok, Poland
2
Department of Medicinal Chemistry, Euroregional Center of Pharmacy, Faculty of Pharmacy with the Division of Laboratory Medicine, Medical University of Białystok, ul. Mickiewicza 2d, 15-222 Białystok, Poland
*
Author to whom correspondence should be addressed.
Cancers 2024, 16(3), 487; https://doi.org/10.3390/cancers16030487
Submission received: 12 December 2023 / Revised: 19 January 2024 / Accepted: 22 January 2024 / Published: 23 January 2024
(This article belongs to the Special Issue Natural Compounds in Cancers)

Abstract

:

Simple Summary

The rising incidence of skin cancer, particularly melanoma, over the last few decades requires natural-product-based treatments with a lack of side effects. To evaluate the anticancer potential of 37 structurally diverse flavonoids, cytotoxic tests, DNA biosynthesis inhibition levels, and apoptosis pathways involved in cell death were investigated in A375 and C32 melanoma cells. Compounds 1, 6, 15, and 37 reduced the viability of cell lines via the intrinsic (caspase-9) and extrinsic (caspase-8) pathways of apoptosis, where 16 and 17 mainly influenced DNA biosynthesis in cancer cells. In our study, we performed an anticancer analysis of compound 15 (5,6-dihydroxyflavone) for the first time. Although our data provide new insights into the molecular mechanisms of flavonoid-induced toxicity, in vivo studies are needed to assess their anti-cancer activities, especially flavonoid-core-containing hydroxyl groups.

Abstract

Skin cancers are a dominant type of cancer that impacts millions per year. Cancer is a heterogeneous disease triggered by the irreversible impairment of cellular homeostasis and function. In this study, we investigated the activity of 37 structurally diverse flavonoids to find potentially active substances using two melanoma cell lines: C32 and A375. First, the cytotoxic potential and DNA biosynthesis inhibition of flavonoids were tested to determine the most active compounds in cancer and normal cells. Second, the molecular mechanism of the anticancer activity of flavonoids was elucidated using Western blot and immunofluorescence analyses. Compounds 1, 6, 15, and 37 reduced the viability of A375 and C32 cell lines via the intrinsic and extrinsic pathways of apoptosis, whereas 16 and 17 acted in a higher degree via the inhibition of DNA biosynthesis. In our experiment, we demonstrated the anticancer activity of compound 15 (5,6-dihydroxyflavone) for the first time. The in vitro studies pointed out the importance of the flavonoid core in hydroxyl groups in the search for potential drugs for amelanotic melanoma.

1. Introduction

The most extensive organ of the human body is the skin, and skin cancers are a dominant type of cancer that impacts millions of people per year. Over the last few decades, the rising incidence of skin cancer has prompted the search for natural-product-based treatments, which might be the basis for producing synthetic and semi-synthetic drugs. This is particularly important in the case of melanoma, which is the most deadly skin cancer [1]. Malignant melanoma is one of the most aggressive malignant tumors and its extensive spread makes the mortality rate of patients with human malignant melanoma very high [2]. Although the surgical excision of the lesion followed by adjuvant treatment (chemotherapy and immunotherapy) are the two primary methods used in the treatment of malignant melanoma, both generate off-target outcomes that meaningfully reduce the quality of life of patients [3,4]. Therefore, experimental strategies concentrate on new therapies that avoid the undesirable effects of a drug (e.g., fotemustine, docetaxel, cisplatin) or medical treatment [5,6]. Nowadays, various preparations available on the market contain naturally derived compounds for use in the treatment of skin cancer or pre-cancerous conditions, such as Curaderm®, Cansema®, or birch bark ointment [7]. It has been recognized that both in vitro and in vivo studies have demonstrated that flavonoids can prevent carcinogenesis and might inhibit the growth of cancer cells. Flavonoids are low-molecular-weight secondary metabolites composed of two benzene rings and one heterocyclic ring and remain one of the most extensively studied polyphenolic compounds for their anticancer activity [8,9]. For example, flavonoids reduce the proliferation of cancer cells or mitochondrial membrane potential and increase autophagy, intracellular ROS (reactive oxygen species), and the expression of caspases, including caspase-3, -8, -9, and -10 [1]. The general activity of polyphenols is connected with the reactivity of their hydroxyl groups. The OH groups are able to dissociate to negatively charged phenolate ions and interact with proteins by forming hydrogen bridges or ionic bonds with positively charged molecules [10]. Flavonoids’ anticancer activity has been attributed to their ability to modulate oxidative stress through chelating with transition metals (Fe2+, Fe3+, Cu2+), which are involved in reactions generating free radicals [11,12]. Thus, in this study, we investigated the activity of 37 structurally diverse flavonoids (137) to find potentially active substances using two melanoma cell lines: primary human malignant amelanotic melanoma (A375 and C32) cells and normal skin fibroblasts. Extensive biological in vitro studies led to identifying which flavonoid substitution patterns play a crucial role in their anticancer activity, which allowed for the demonstration of the structure–activity relationships (SARs). Thus, in this study, we investigated the anti-cancer potential of 37 flavonoids to identify active compounds: apigenin (1), apigenin 8-C-glucoside (vitexin) (2), apigenin 7-O-glucoside (3), apigenin 7-O-glucuronide (4), apigenin 7-O-rutinoside (5), luteolin (6), luteolin 7-O-glucoside (cynaroside) (7), luteolin 7-O-glucuronide (8), luteolin 7-O-sambubioside (9), 5,7,3′-trihydroxy-4′-acetoxy-flavone-8-C-xyloside-2″-O-glucoside (scleranthoside A) (10), 5,7,3′-trihydroxy-4′-methoxyflavone-8-C-xyloside-2″-O-glucoside (scleranthoside B) (11), 5,7-dihydroxy-3′-methoxy-4′-acetoxyflavone-8-C-xyloside-2″-O-(4‴-acetoxy)-glucoside (scleranthoside C) (12), 5,7-dihydroxy-3′-methoxy-4′-acetoxyflavone-8-C-arabinoside-2″-O-(4‴-acetoxy)-glucoside (scleranthoside D) (13), chrysin (14), 5,6-dihydroxyflavone (15), 7,8-dihydroxyflavone (16), zapotin (17), kaempferol (18), 8-methoxykaempferol (19), kaempferol 3-O-glucoside (astragalin) (20), kaempferol 3-O-glucuronide (21), kaempferol 3-O-galactoside (hyperoside) (22), icariin (23), quercetin (24), 7-methoxyquercetin (rhamnetin) (25), 3′-methoxyquercetin (isorhamnetin) (26), quercetin 3-O-glucuronide (27), quercetin 3-O-rutinoside (rutin) (28), quercetin 3-O-rutinoside-7-O-glucoside (29), myricetin (30), tricin (31), robinetin (32), hesperetin (33), hesperetin 7-O-rutinoside (hesperidin) (34), hesperetin 7-O-neohesperidoside (neohesperidin) (35), daidzein (36), and genistein (37). The chemical and biological properties of flavonoids and their derivatives are linked with their structure and the position of different substitutions on the molecule. The position of the heterocyclic pyran ring in the structure, as well as the presence of hydroxyl groups and double bonds, allows for division into groups. Following this, compounds 117 belong to flavones, 1832 belong to flavonols (additional OH group at C3), 3335 belong to flavanols (lack of the double bond between C2 and C3), and 36, 37 belong to isoflavones (heterocyclic pyran ring is attached at C3). In our study, first, cytotoxic potential and DNA biosynthesis inhibition were tested to determine the most active substances using A375 and C32 lines. Second, the molecular mechanism of the anticancer activity mediated by flavonoids was elucidated using Western blot and immunofluorescence analyses.

2. Materials and Methods

2.1. Chemicals and General Experimental Procedures

Compounds 1 (CAS number: 520-36-5), 2 (CAS number: 3681-93-4), 14 (CAS number: 480-40-0), 18 (CAS number: 520-18-3), 24 (CAS number: 6151-25-3), 25 (CAS number: 90-19-7), 26 (CAS number: 480-19-3), 30 (CAS number: 529-44-2), 33 (CAS number: 69097-99-0), and 37 (CAS number: 446-72-0) were purchased from Carl Roth (Karlsruhe, Germany); 15 (CAS number: 6665-66-3) was obtained from ThermoFisher Scientific (Waltham, MA, USA); 8 (CAS number: 29741-10-4), 16 (CAS number: 38183-03-8), 23 (CAS number: 489-32-7), 35 (CAS number: 13241-33-3), and 36 (CAS number: 552-66-9) were obtained from Cayman Chemical (Ann Arbor, MI, USA); and 4 was obtained from AmBeed (Arlington, IL, USA). Flavonoids 3 [13], 6 [14], 7, 9 [15], 1012 [16], 13 [17], 19 [18], 20, 28 [19], 22, and 29 [20] were isolated and identified in the Department of Pharmacognosy at the Medical University of Białystok (Poland). Compounds 5 (CAS number: 77298-67-0), 17 (CAS number: 14813-19-5), and 31 (CAS number: 520-32-1) were obtained from Biosynth Carbosynth (London, UK); 21 (CAS number: 22688-78-4) and 27 (CAS number: 22688-79-5) were purchased from Extrasynthese (Genay, France); and 32 (CAS number: 490-31-3) and 34 (CAS number: 520-26-3) were obtained from Fluka Analysis (St. Louis, MO, USA). The cell viability and proliferation assays were performed on the melanoma cell lines C32 (CRL-1585) and A375 (CRL-1619) and human skin fibroblasts (CCD25Sk). The cells were obtained from ATCC (American Type Culture Collection, Manassas, VA, USA) and cultured in DMEM (Dulbecco’s Modified Eagle’s Medium, ThermoFisher Scientific, 41966029) supplemented with 10% FBS (fetal bovine serum, ThermoFisher Scientific, 10270106), 100 U/mL penicillin, and 100 U/mL streptomycin (ThermoFisher Scientific, 15140122). The cells were incubated at 37 °C in the air with 5% CO2. PBS (phosphate-buffered saline, 14190136), the Dead Cell Apoptosis Kit for flow cytometry (#V13242), a protease and phosphatase inhibitor cocktail (#78440), and neutral red (N3246) were purchased from ThermoFisher Scientific. MTT (3-(4,5-dimethyl-2-thiazolyl)-2,5-diphenyl-2H-tetrazolium bromide) (M5655), SDS (sodium dodecyl sulfate, L3771), NaOH (sodium hydroxide, 655104), anti-actin antibody (#A2066, 1:2000), skim milk (anti-mouse IgG-HRP, #A9044, 1:5000 or anti-rabbit IgG-HRP, #A9169, 1:5000), and cisplatin (cPt), which was used as a positive control (P4394), were purchased from Sigma-Aldrich (Saint Louis, MO, USA). The [3H]-thymidine (#MT6037) was obtained from Hartmann Analytic for the proliferation assay. The Mini-Protean Tetra Cell system, nitrocellulose membranes, and Mini Trans-Blot Cell wet blotting system were purchased from Bio-Rad (Hercules, CA, USA). The Cell Lysis Buffer (#9803), anti-caspase-9 antibody (#9508), anti-caspase-8 antibody (#9746), anti-caspase-3 antibody (#9662), anti-caspase-7 antibody (#12827), anti-PARP antibody (anti-poly-(ADP-ribose) polymerases antibody) (#9542), anti-RSK2 antibody (rabbit polyclonal antibody) (#5528), and anti-pSer386-RSK2 antibody (#11989) were obtained from Cell Signaling Technology (Danvers, MA, USA). The ECL-HRP substrate (enhanced chemiluminescence-horseradish peroxidase substrate) was obtained from GE Healthcare (Chicago, IL, USA).

2.2. Cell Viability Assays

2.2.1. 3-(4,5-Dimethyl-2-thiazolyl)-2,5-diphenyl-2H-tetrazolium Bromide (MTT) Assay

The MTT colorimetric assay was performed as a preliminary evaluation of the cytotoxicity of the selected flavonoids according to the method described and validated by Strawa et al. [21]. Briefly, melanoma cells and fibroblasts were seeded in 96-well microplates at a density of 1 × 10⁴ cells per well. Fibroblasts were used as a control cell line in order to assess the selectivity of the compounds. Following 24 h of incubation (at 37 °C with 5% CO2), the cells were exposed to different concentrations of compounds 137 and cisplatin (6.25, 12.5, 25, 50, 100, or 200 μM) for 24, 48, and 72 h. Subsequently, the cells were washed with PBS, incubated with MTT solution for 2 h, and lysed with dimethyl sulfoxide (DMSO) supplemented with 1% (v/v) Sorensen’s glycine buffer. The absorbance was measured using a microplate reader (EPOCH 2, BioTek, Winooski, VT, USA) at a wavelength of 570 nm. The compounds were used at a final DMSO concentration of no more than 0.1% (v/v) in each well. The results were generated from at least three independent experiments. Cisplatin (cPt) was used as a positive control. The IC50 values were calculated with GraphPad Prism 9 software (GraphPad Software, San Diego, CA, USA).

2.2.2. Neutral Red Uptake (NRU) Assay

The NRU (neutral red uptake) was conducted as previously described by Szoka and co-workers, with some modifications [22]. Briefly, melanoma cells and fibroblasts were seeded in microplates at the density of 1 × 10⁴ cells per well and allowed to adhere for 24 h. Then, cells were incubated with different concentrations of compounds 137 and cPt (6.25, 12.5, 25, 50, 100, or 200 μM) for 24, 48, and 72 h. After treatment, the culture medium was replaced with a neutral red solution (40 µg/mL). An additional 2 h of incubation was performed. The neutral red solution was then removed and the neutral red accumulated in the cells was dissolved in 50% EtOH with 1% of the glacial acetic acid. The absorbance was estimated at 540 nm and IC50 values were calculated using GraphPad Prism software (GraphPad Software, San Diego, CA, USA).

2.3. Proliferation Assay

The inhibition of DNA biosynthesis was evaluated using [3H]-thymidine incorporation into the DNA of melanoma cells (C32, A375) and fibroblasts treated with the studied compounds [21]. The cells were briefly seeded in 24-well plates (1 × 10⁵ cells per well) and allowed to adhere for 24 h. Subsequently, the studied cells were treated with 1 mL of DMEM with 0.5 µCi [3H]-thymidine (6.7 Ci/mmol) and various concentrations (6.25–200 µM) of the most active compounds. Cisplatin (cPt) was used as a positive control. After incubation for 24, 48, and 72 h, the cells were rinsed three times with PBS. Then, cells were lysed in 1 mL of 0.1 M NaOH containing 1% SDS. The cell lysate was moved into scintillation vials containing scintillation liquid, and the radioactivity of the samples was measured using a liquid scintillation analyzer (Perkin-Elmer, Waltham, MA, USA).

2.4. Apoptosis Assay

The apoptosis assay was conducted as described before [22]. Firstly, cells were placed in 6-well plates at a density of 1 × 10⁵ cells per well and allowed to adhere for 24 h. Then, cells were treated with 25 µM, 50 µM, and 100 μM of the selected flavonoids (1, 6, 15, 16, 17, 37) and incubated for 48 h. Floating and adherent cells were collected and assayed using the manufacturer’s protocol supported by the Dead Cell Apoptosis Kit for flow cytometry. Concisely, 100 μL of an annexin-binding buffer containing a 5 μL annexin V-FITC conjugate solution and 1 μg/mL PI (propidium iodide) was used to disperse the cells. After 15 min of incubation, an additional 400 μL of the mentioned buffer was added. The cells were analyzed with a DxFLEX flow cytometer (Beckman Coulter, Brea, CA, USA).

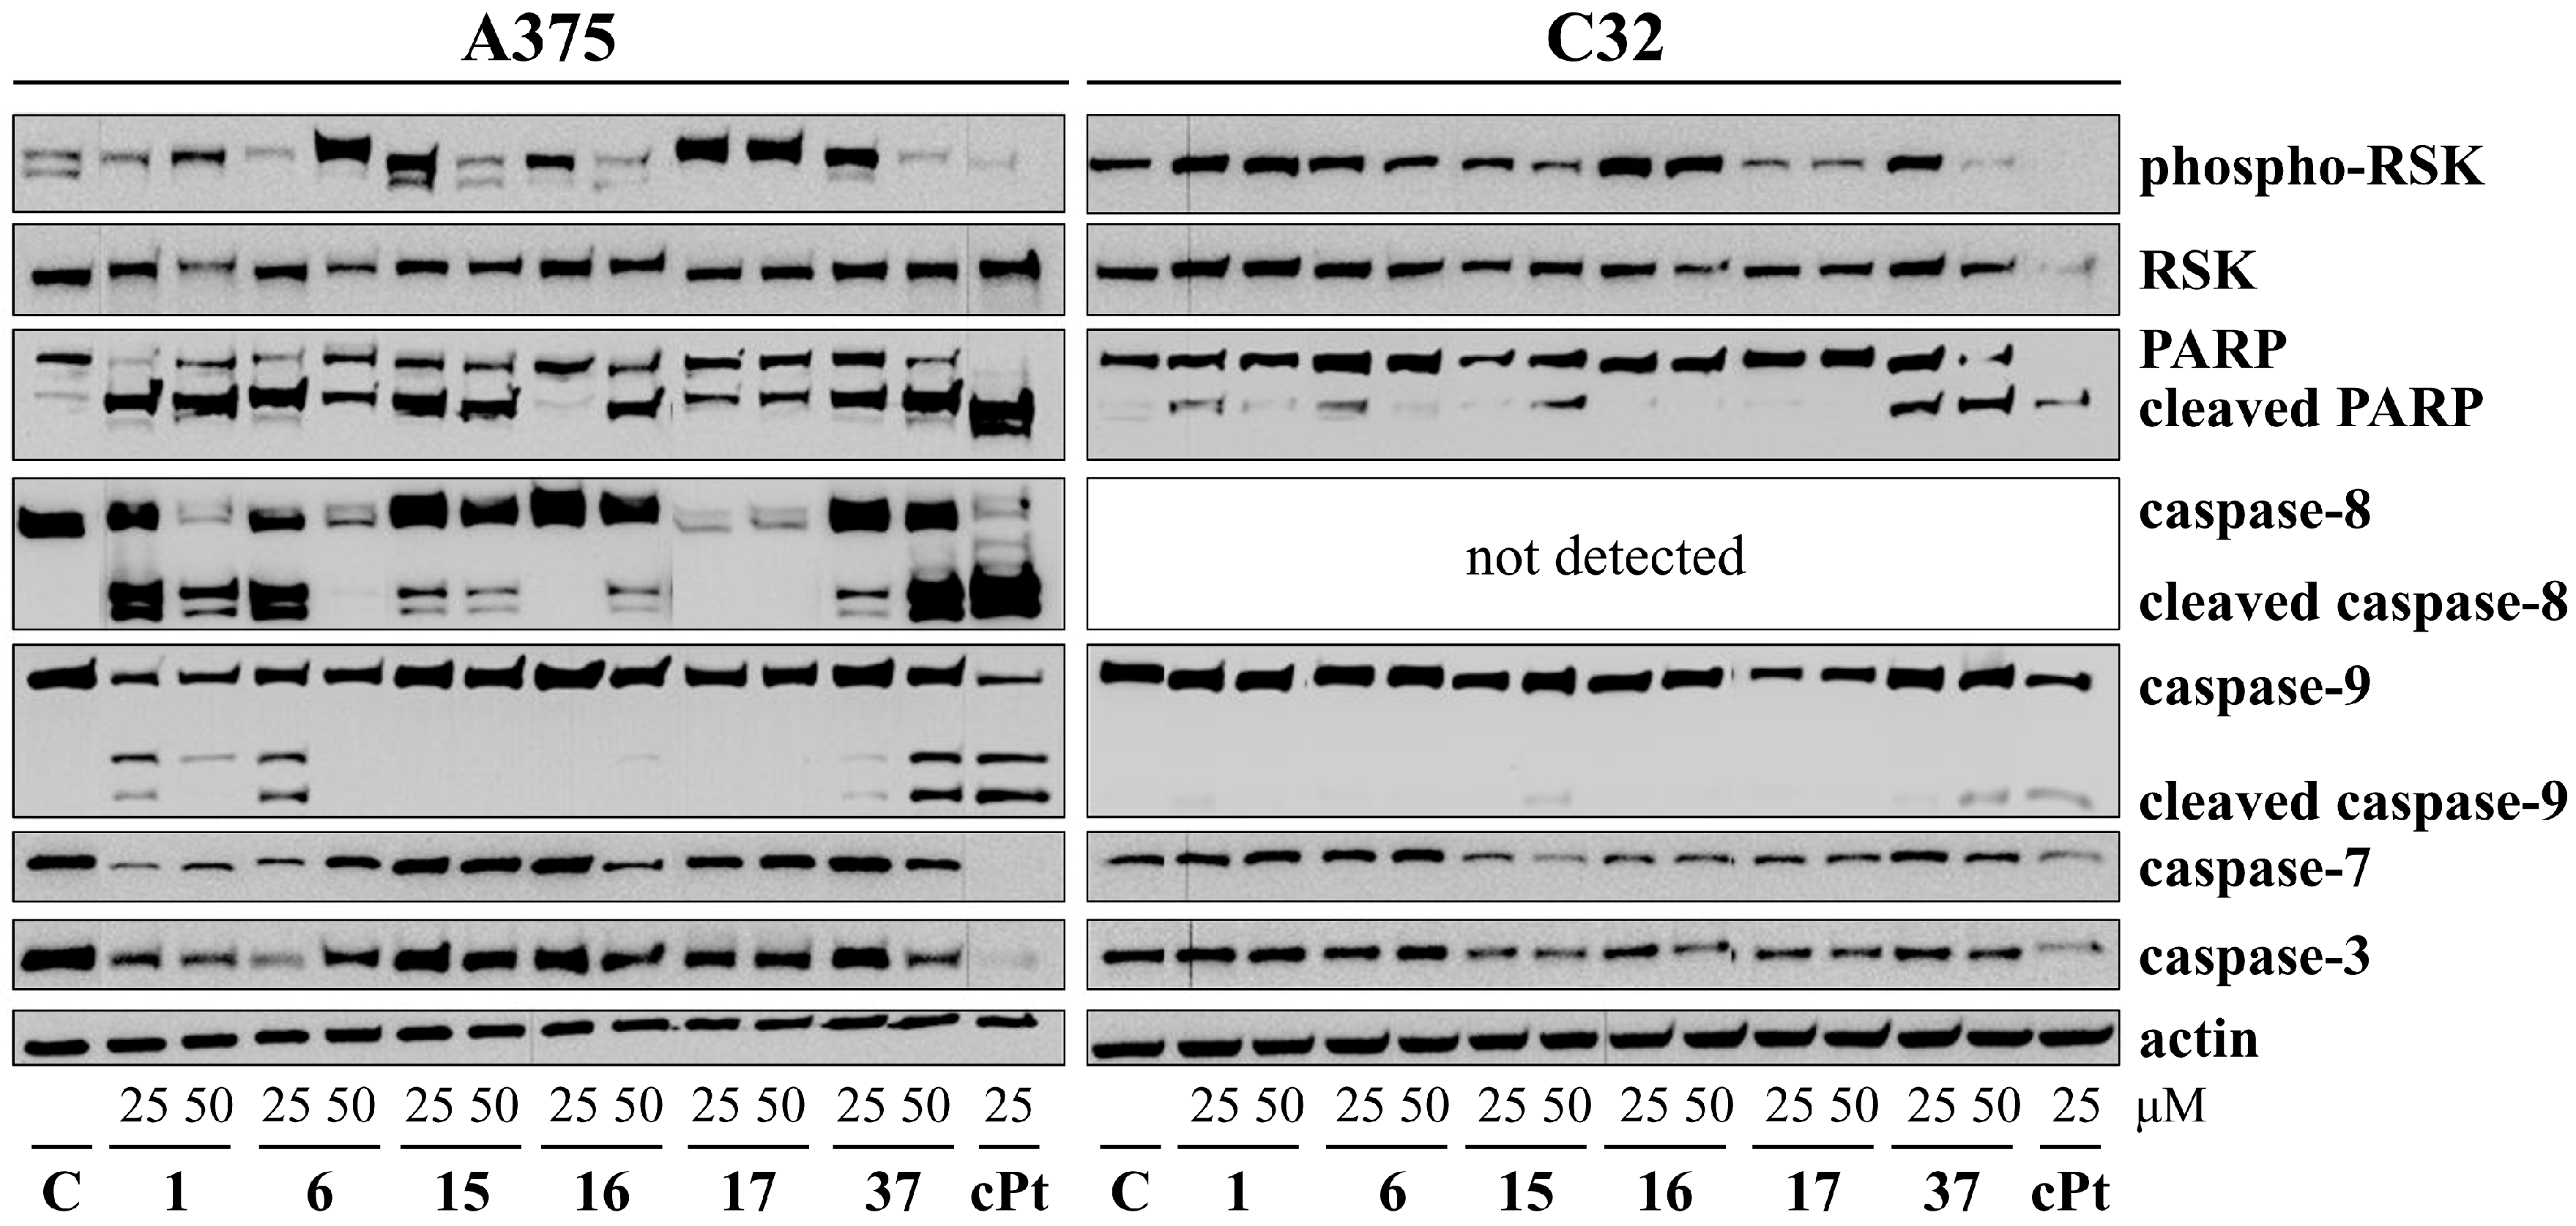
2.5. Western Immunoblot

Floating cells were harvested by centrifugation of the conditioned media (300× g, 5 min). Cell pellet and adherent cells were lysed in a cell lysis buffer supplemented with inhibitors of proteases and phosphatases. The cell lysate was sonicated (2 × 10 s) on ice with an ultrasonic homogenizer (UP200S, Hielscher Ultrasonics GmbH, Teltow, Germany) and centrifuged for 10 min at 10,000× g. The supernatant was collected and stored in a freezer at −70 °C. Protein concentrations in the cell supernatants were determined using a Lowry assay. Obtained proteins were dissolved on SDS-PAGE gels (7.5%, 10%, or 12%) using the Mini-Protean Tetra system. The proteins were transferred to nitrocellulose membranes using the Mini Trans-Blot Cell wet blotting system. The 5% skim milk was used to block membranes. Then, membranes were probed for 24 h at 4 °C with the following antibodies: anti-phospho-RSK, anti-RSK, anti-PARP, anti-cleaved PARP, anti-caspase-8, anti-caspase-9, anti-caspase-7, anti-caspase-3, and anti-actin. Membranes were incubated with an ECL-HRP (enhanced chemiluminescence-horseradish peroxidase) substrate, and the signal was spotted using the BioSpectrum Imaging System and VisionWorks LS software 7.0 (Ultra-Violet Products, Ltd., San Gabriel, CA, USA). The intensity of the bands was quantified by densitometric analysis using UVIBand software, version 15.08d (Uvitec Ltd., Cambridge, UK).

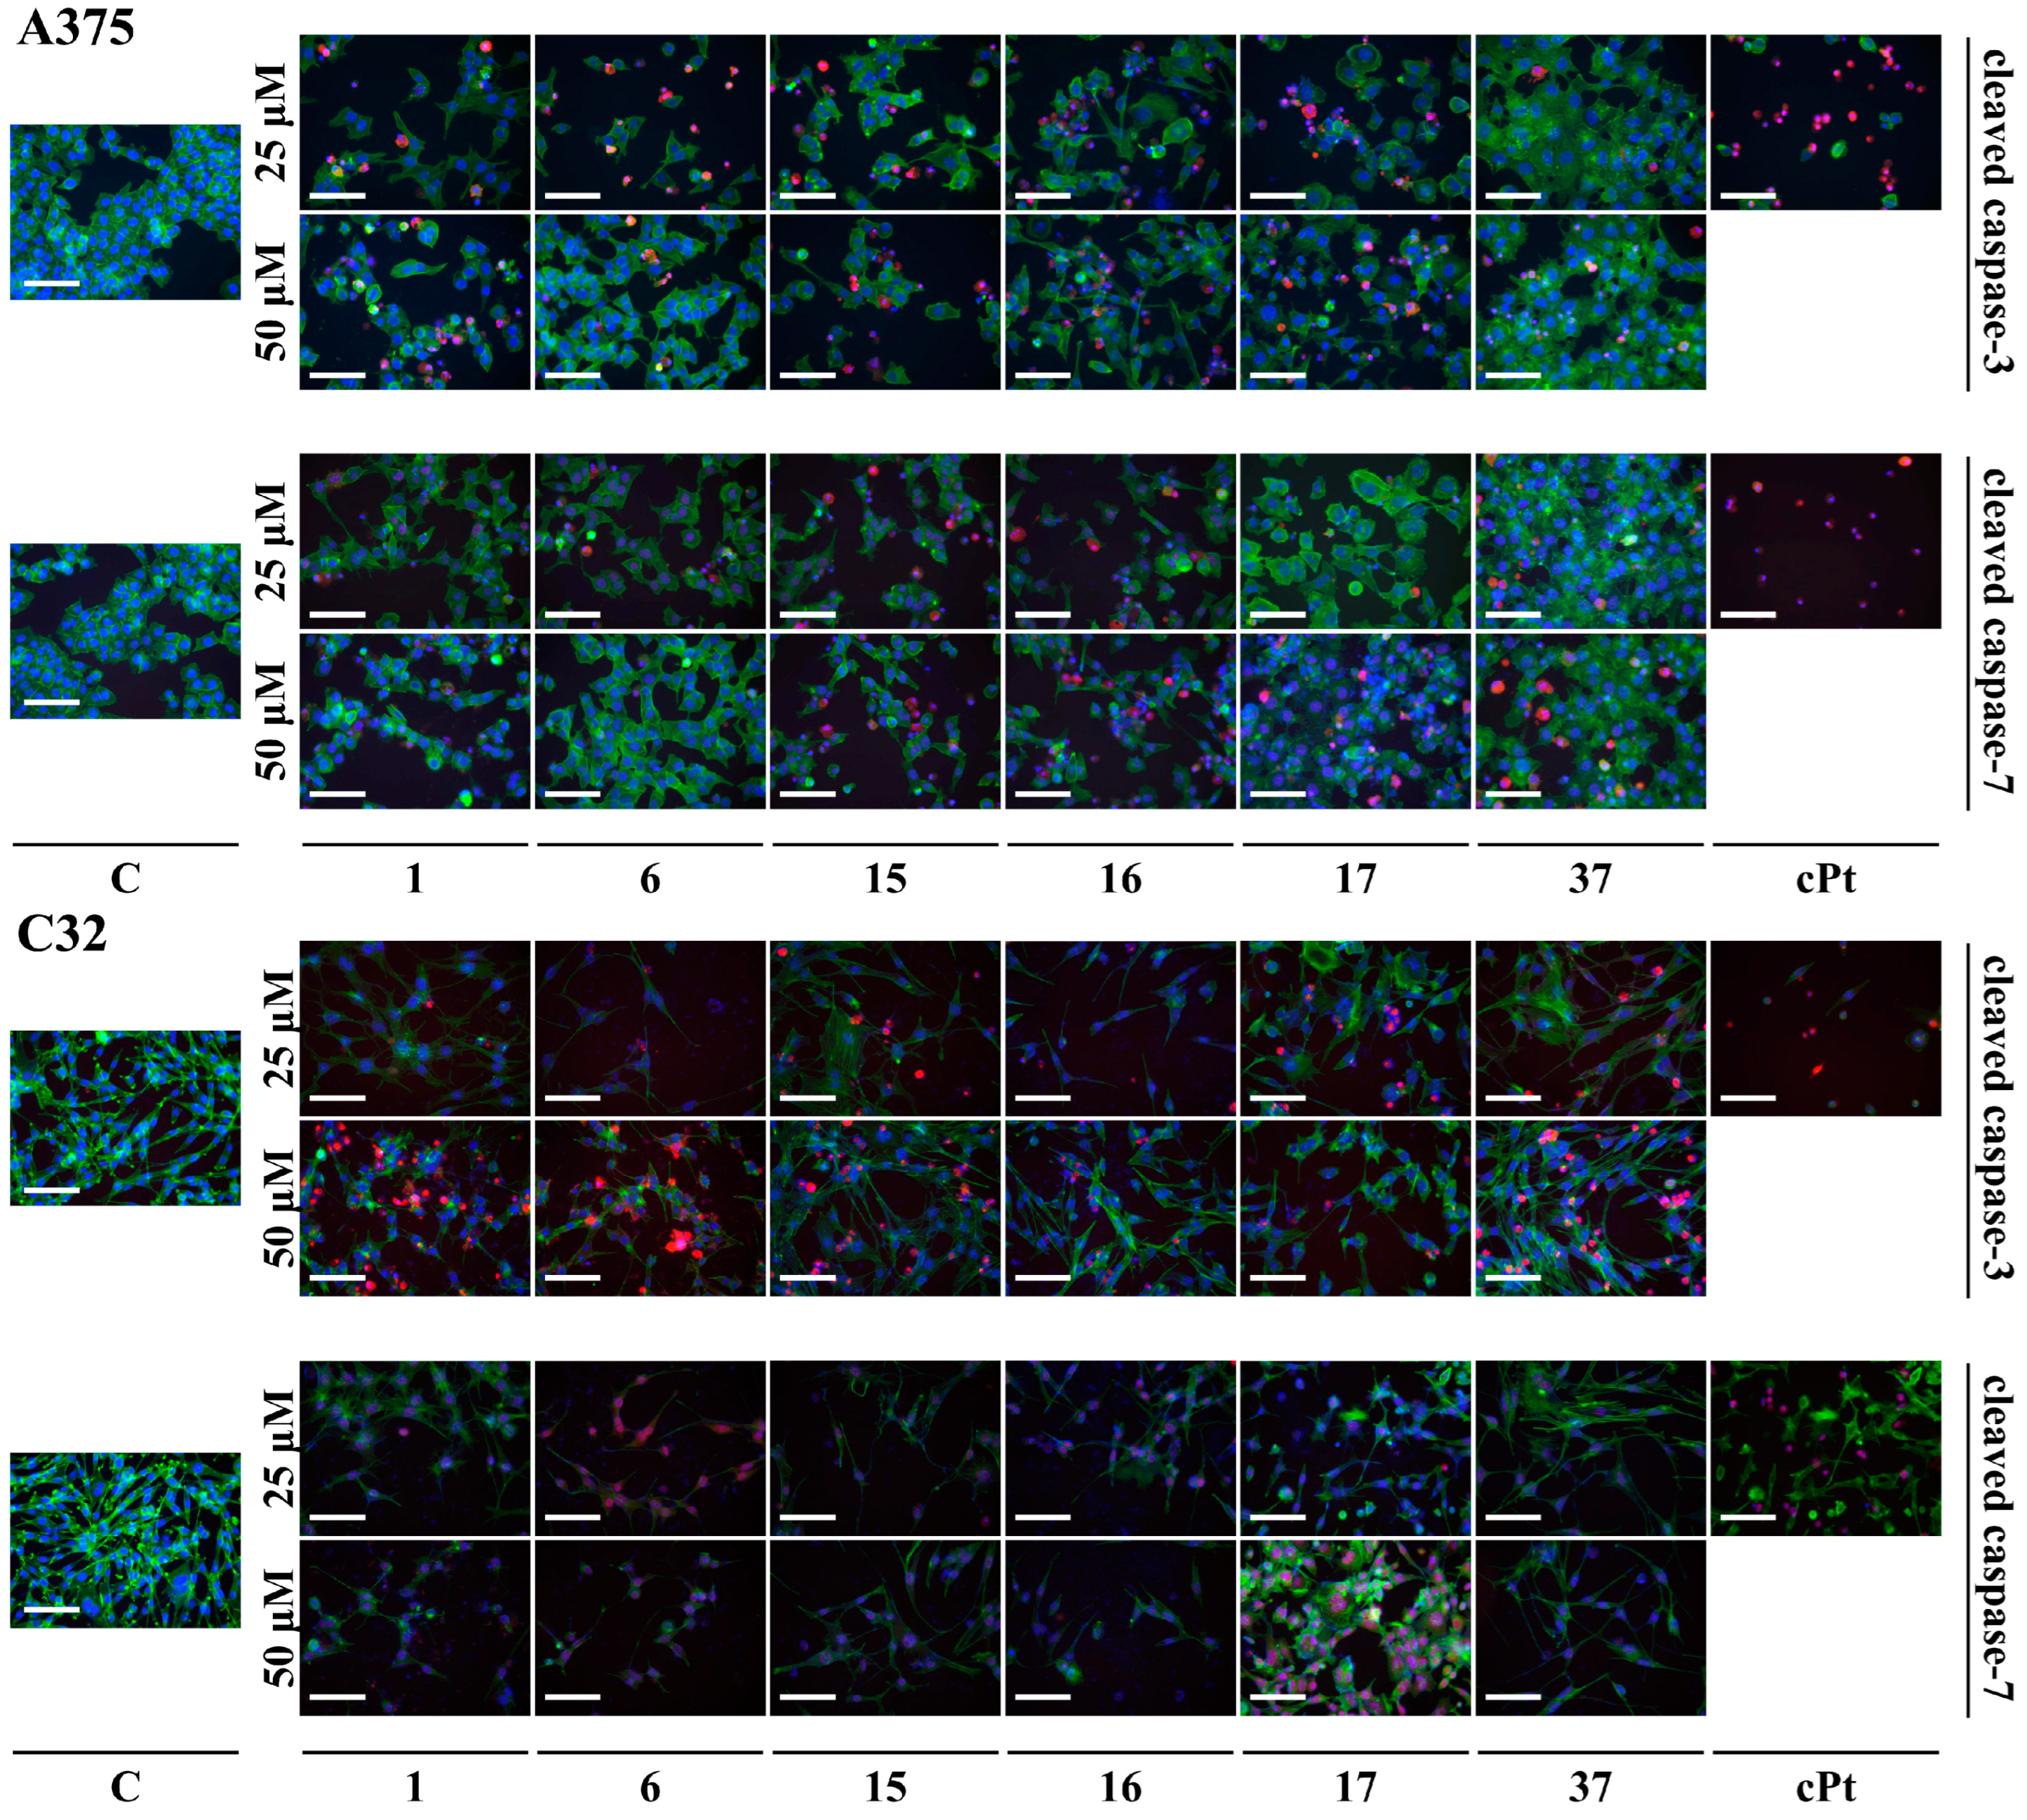
2.6. Immunofluorescence Microscopy

Firstly, to examine fluorescent signals, cells were placed in the bottom of 96-well black plates at 1 × 10⁴ cells per well and permitted to adhere for 24 h. Subsequently, the cells were treated with compounds 1, 6, 1517, and 37 at concentrations of 25 μM, 50 μM, or 25 μM cPt for 48 h. After incubating and removing the medium, cells were fixed in 4% paraformaldehyde for 15 min. Later, cells were rinsed three times with PBS and permeabilized with 0.1% Triton X-100 for 5 min at room temperature. The 10% heat-inactivated goat serum in the PBS was used to block non-specific binding. Subsequently, cells were treated with the following antibodies overnight: anti-cleaved caspase 3 and anti-cleaved caspase-7. Next, cells were incubated with the Alexa Fluor 594 conjugated antibody for 1 h in a dark place. Cell nuclei were stained with Hoechst 33342 and F-actin was stained with Phalloidin-Atto 488. Fluorescent signals were captured using a BD Pathway 855 confocal microscope (Becton Dickinson, Franklin Lakes, NJ, USA). The mean fluorescence intensity was calculated using ImageJ software (National Institutes of Health, Bethesda, Rockville, MD, USA).

2.7. Statistical Analysis

The statistical analysis for the IC50 calculations was performed using nonlinear regression using GraphPad Prism 9 software (GraphPad Software, San Diego, CA, USA) and MS Excel 2019 software (Microsoft, Washington, DC, USA). All data were received as mean ± SD (from at least three independent replicates), and the significance of differences was determined using ANOVA.

3. Results

3.1. Cell Viability Assays

In the first step, the potential cytotoxic effect of different concentrations of the selected flavonoids (Table 1, Figure 1) and cPt, a well-known anticancer agent, was studied using MTT and NRU tests on A375 and C32 melanoma cell lines and fibroblasts (Table 2 and Table 3, Figures S1 and S2).
An MTT assay was carried out separately for each sample for a preliminary evaluation of the cytotoxic effects of all samples on the viability of A375, C32, and fibroblast cells after 24, 48, and 72 h of incubation. The cytotoxic potential was expressed as a median inhibitory concentration (IC50) value. At this point, six compounds showed the highest activity in both A375 and C32 cell lines: 1, 6, 15, 16, 17, and 37. Compound 17 (zapotin) displayed the strongest and a selective effect among all tested compounds after 48 h of incubation, where the IC50 reached values of 31.1 ± 2.9, 26.5 ± 1.3, and 78.0 ± 5.2 µM for A375, C32, and normal cells, respectively. The cytotoxic activity of the most active compounds increased when the incubation time was increased from 24 h to 48 h. Nevertheless, this effect was not consistent when treatment was increased further from 48 h to 72 h. On the other hand, sixteen compounds (2, 3, 813, 2123, 27, 29, 3436) did not indicate any activity, even at the highest used concentration (200 µM).
Despite the fact that the MTT test is the most common method for the evaluation of cell viability, several studies have revealed inaccuracies that are inherent in this method. Some experiments demonstrate that flavonoids are redox-active against tetrazolium salt even in the absence of cells, which interferes with the MTT test [15]. Thus, we performed an NRU assay to confirm the reliability of the obtained results with the MTT method. The data obtained from the NRU analysis indicate a strong activity of the six compounds mentioned in MTT test. After 48 h of exposure, in both A375 and C32 cells, the IC50 of 17 (14.7 ± 1.2 and 14.7 ± 1.1 µM, respectively) showed comparable cytotoxicity to cPt (14.4 ± 1.1 and 15.0 ± 1.2 µM). Importantly, 5,6-dihydroxyflavone (15), 7,8-dihydroxyflavone (16), and zapotin (17) were more active in cancer cells than in fibroblasts.

3.2. Proliferation Assay

The observed decrease in cancer cell viability could have been the result of an impaired cell proliferation rate. Therefore, based on the cytotoxic tests, we selected the most active flavonoids (1, 6, 1517, 37) and performed a proliferation assay (Table 4). Treatment with 17 showed a significant decrease in [3H]-thymidine incorporation into newly synthesized DNA after 48 h of incubation in both A375 and C32 cell lines (IC50 = 6.0 ± 0.2 and 9.1 ± 1.2 µM, respectively). It is worth mentioning that 17 affected DNA biosynthesis more in cancer cells than in normal cell lines.

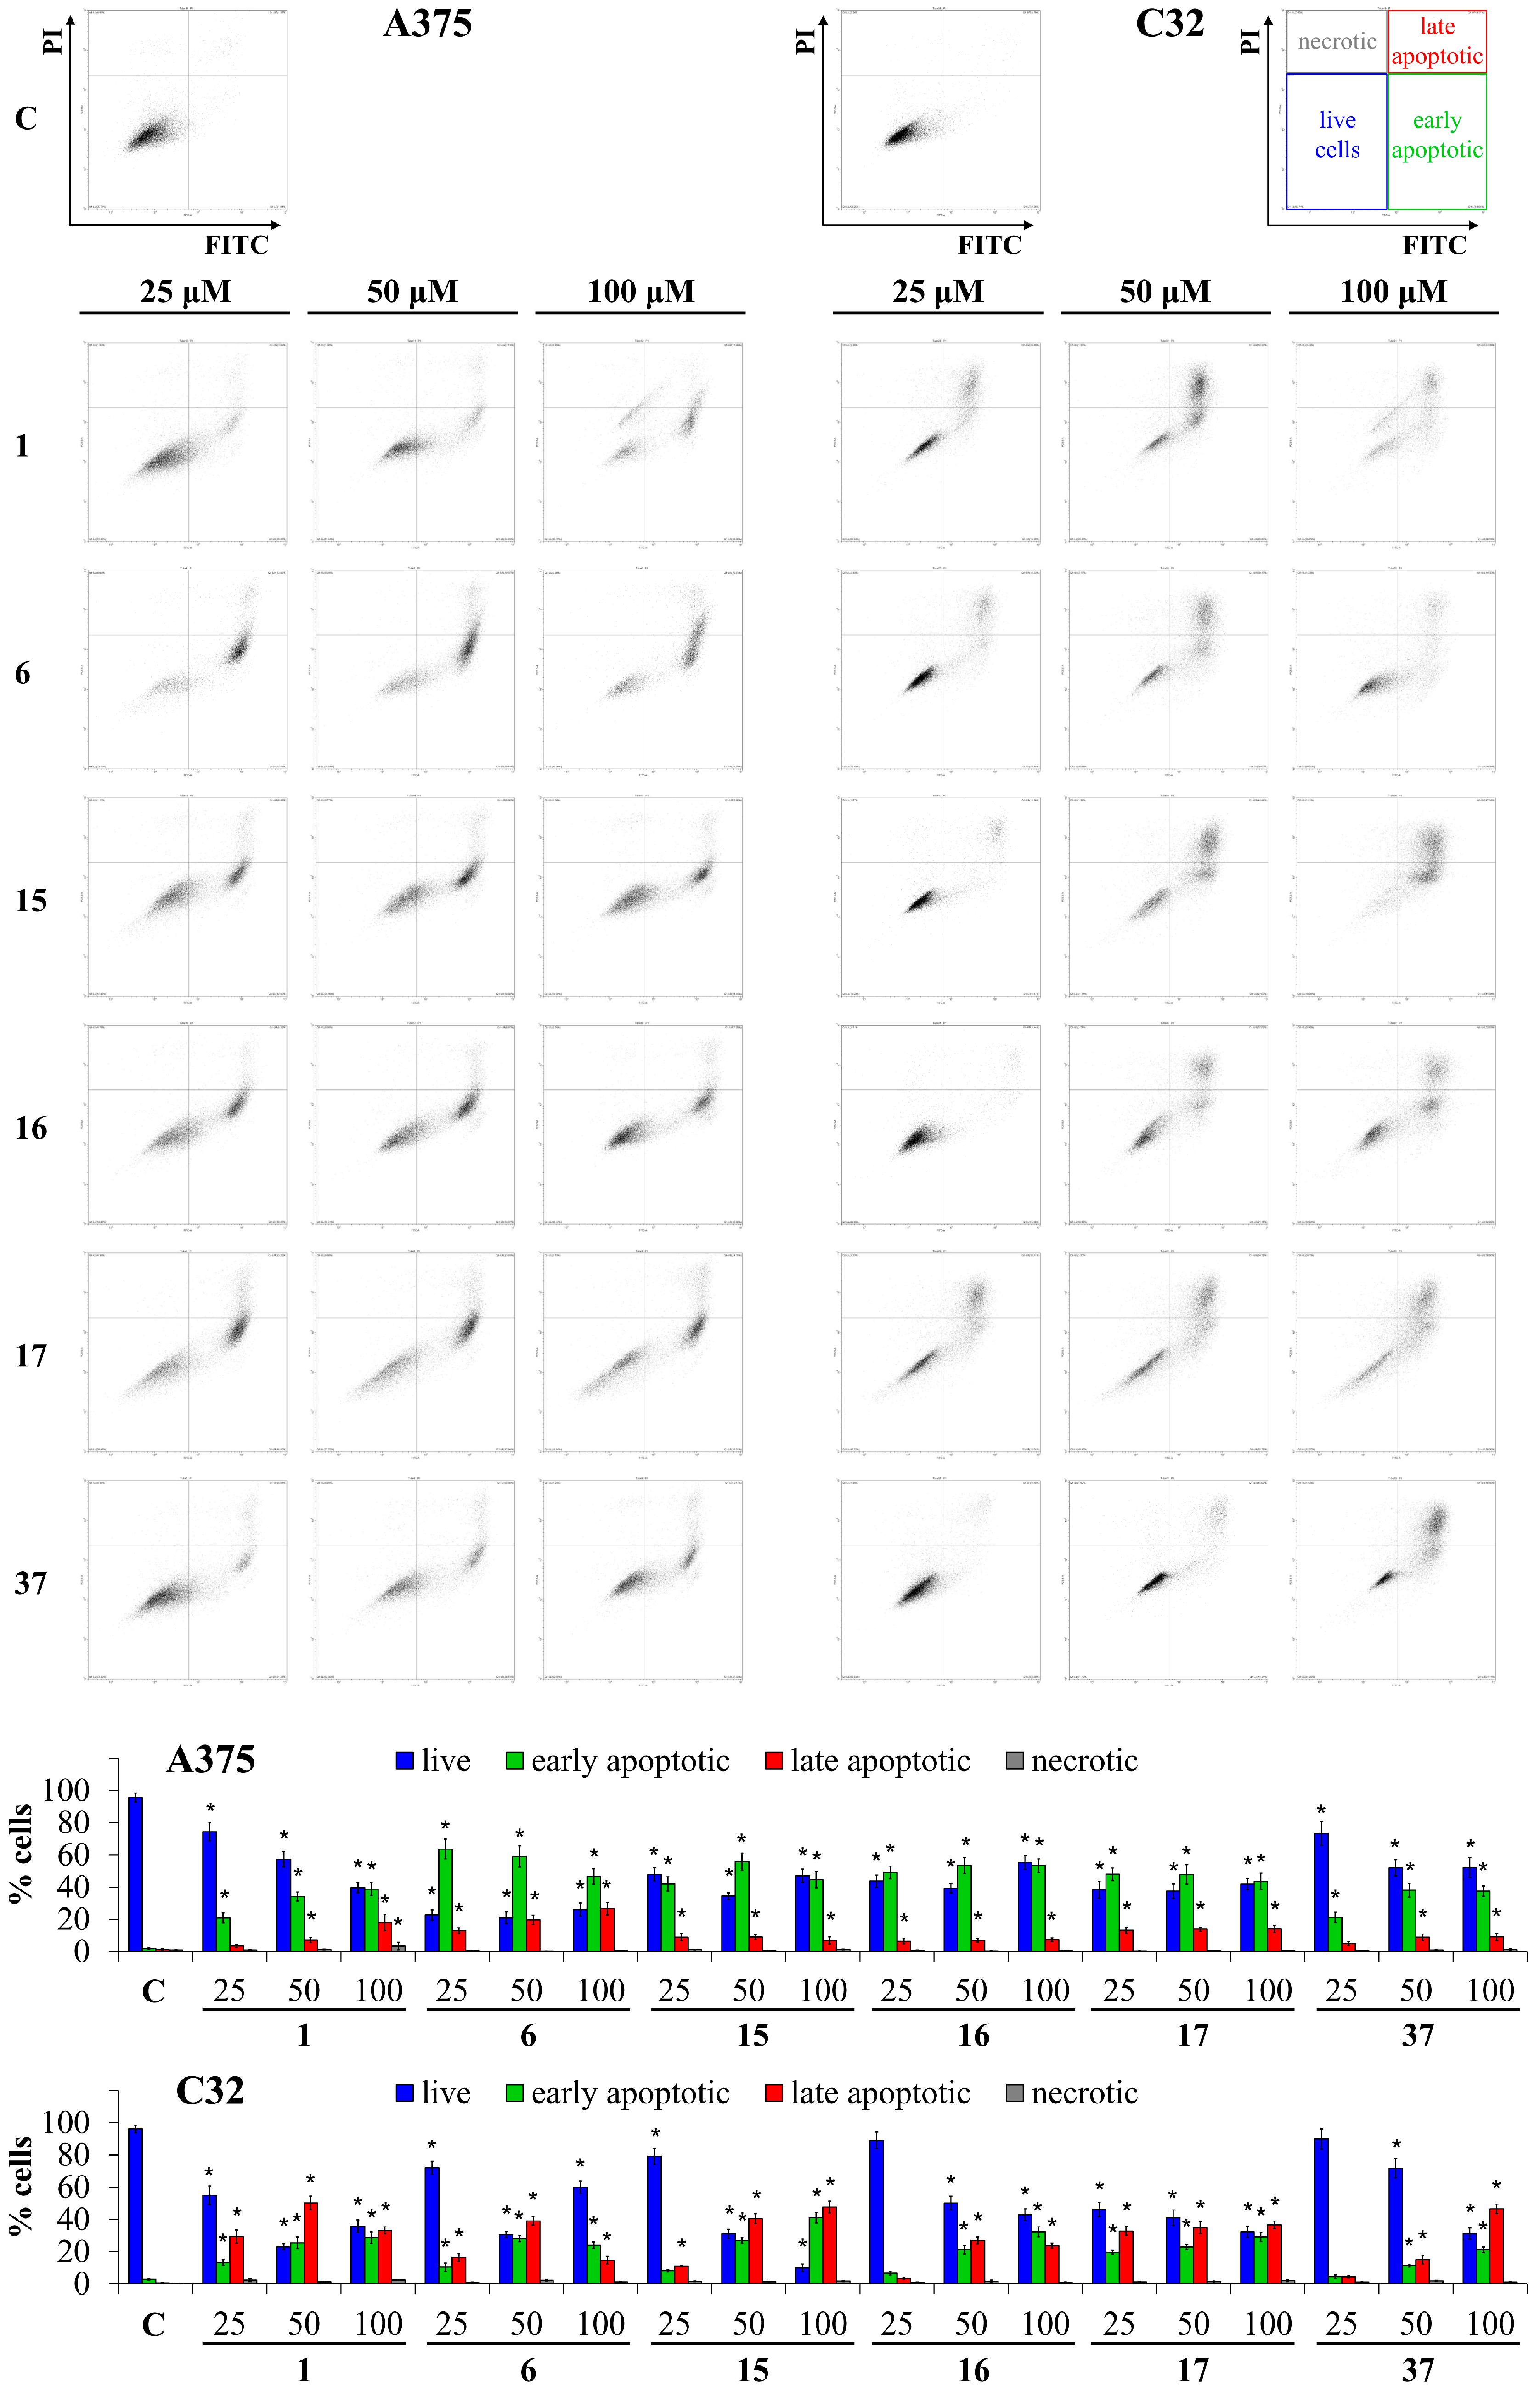
3.3. Apoptosis Assay

To further explore the mechanism by which these compounds affect cell viability, dual staining with annexin V and propidium iodide followed by flow cytometry was performed after 48 h of treatment of melanoma cells with compounds 1, 6, 1517, and 37 at concentrations of 25, 50, and 100 µM (Figure 2). The data showed that these flavonoids induced apoptosis in melanoma cells. Among them, 6, 15, 16, and 17, even at the lowest concentration (25 µM), highly increased the levels of early and late apoptotic cells to 63.6 ± 6.1% and 13.0 ± 1.8% (6), 42.0 ± 4.5% and 8.9 ± 2.2% (15), 49.1 ± 3.9% and 6.4 ± 1.5% (16), and 48.0 ± 3.9% and 13.2 ± 1.9% (17), respectively. Further, the 50 µM level of early and late apoptotic cells was elevated after using 1 and 37 to 34.2 ± 2.8% and 7.1 ± 1.6% (1) and 38.1 ± 4.2% and 8.9 ± 1.9% (37). Thus, the percentage of apoptotic A375 cells increased as follows: 137 < 151617 < 6. On the other hand, in the C32 melanoma cell line, the most significant increase in the percentage of early and late apoptotic cells after treatment with a 25 µM concentration was observed for 17 and 1: 19.7 ± 1.6% and 32.8 ± 2.4% (17) and 13.3 ± 2.4% and 29.4 ± 3.3% (1). Therefore, the rise in the percentage of apoptotic C32 cells increased as follows: 3716 < 615 < 117.
In the next step, the levels of the essential mediators of apoptosis were analyzed by the Western blot method (Figure 3, Figures S3 and S5–S18). The treatment of A375 cells with 1, 6, 37, and cPt for 48 h resulted in the cleavage of both initiator caspases, caspase-9 and caspase-8, and decreased levels of the caspases-3 and -7 zymogens. However, compound 6’s action was inversely proportional to the used concentration. Treatment with compounds 15 and 16 increased the expression of cleaved caspase-8, but 16 induced a weak cleavage of caspase-9. On the other hand, after using 17, there were no visible signs of active initiator caspases. However, the expression of caspase-8 pro-form was significantly downregulated. Compounds 16 and 37, at higher concentrations, and cPt impaired the phosphorylation of the RSK protein (ribosomal kinase).
In the C32 cell line, flavonoids 1, 6, 15, and 37 and cPt generated cleaved PARP and caspase-9. The expression of caspase-8 zymogen was below the limit of detection in these cells. Furthermore, 17, 37, and cPt inhibited the phosphorylation of RSK.
In Figure 4 and Figure S4, the expression of cleaved caspase-3 and cleaved caspase-7 revealed by immunofluorescent staining in both melanoma cell lines is presented. In the A375 cell line, 48 h of treatment with 1 and 6 slightly increased the level of cleaved caspase-3. Furthermore, 1, 6, 15, and 37 notably extended caspase-3 expression in the C32 cells. Also, the level of the cleaved caspase-7 slightly increased in C32 cells after treatment with 6, 16, and 17.

4. Discussion

Despite the fact that surgery, radiation therapy, and chemotherapy are conventionally used to treat cancers, there is undoubtedly a great need to investigate natural products that may reduce the frequency of cancer incidences or the side effects of synthetic drugs [23].
The results available in the literature that describe the anticancer activity of flavonoids are diverse and sometimes contradictory. This dissimilarity may be connected with various experimental conditions (e.g., concentrations of substrates or conditions of incubation) or the limited number of compounds included in such studies. Thus, in this study, we tested a large set of flavonoid compounds for their cytotoxic, antiproliferative, and apoptotic effects under the same conditions to obtain values that are as close to those in the real world as possible. Compound 1 (apigenin), which may be considered the major flavone in the plant kingdom, is also one of the most studied phytoconstituents for its anticancer activity. Zhao and co-workers investigated the cytotoxic effect of apigenin using MTT assays. According to their results, apigenin at a concentration of 40 µM decreased A375 cell viability [24], which is in agreement with our results after 48 h of incubation (IC50 = 31.9 ± 1.0 µM). On the other hand, Cao et al. implied that apigenin at 10 and 20 μM significantly inhibited A375 cell motility and invasion in a dose-dependent manner [25]. Even though MTT seems to be the most common test for detecting cytotoxicity, no data are available for the C32 cell line using this method thus far. Nevertheless, the SRB test showed that 1 is a more potent cytotoxic compound against C32 cells than against A375 cells [26]. These results follow our NRU assays. To determine structure–activity relationships as predictors of cytotoxicity, we compared the cytotoxic effects of closely related compounds. Another widely distributed flavone aglycone in plants is luteolin (6), which possesses one more OH group in the B-ring. According to our data, it affected A375 and C32 cell viability in both MTT (IC50 = 38.23 and 42.10 µM, respectively, after 48 h of incubation) and NRU (IC50 = 25.70 and 13.11 µM, respectively, after 48 h of incubation) tests; hence, 6 is a powerful cancer-inhibiting compound. In previous studies, luteolin possessed IC50 values that reached 18.6 µg/mL (IC50 = 65.0 μM, A375, 48 h of incubation) and 95.1 µg/mL (IC50 = 332.5 μM, C32, 24 h of incubation) [1]. In our study, luteolin (6) treatment for 48 h decreased A375 cell viability, with IC50 values of 38.2 μM and 25.7 μM, as determined by MTT and NRU assays, respectively. The IC50 values for 6 in C32 cells after 24 h treatment were very diverse depending on the assay used, reaching >200 μM in the MTT test and 41.3 μM in the NRU assay. Nevertheless, comparing compounds 15, 16, and 17 seems particularly promising for further stages of research. In our experiment, we demonstrated the anticancer activity of 15 (5,6-dihydroxyflavone) for the first time. This is extremely important because the hydroxyl groups in the A-ring of flavonoids may be responsible for their activity as well as for sharing the unsubstituted B ring, which was also confirmed by the high activity of 16 (7,8-dihydroxyflavone) (Table 2 and Table 3). In contrast to 15, flavonoid 16 has already been reported as an anticancer agent in two human malignant melanoma cell lines (SK-MEL-2 and G-361). In the MTS test, the inhibition of the viability by 7,8-dihydroxyflavone (16) was significant in both melanoma cell lines (IC50 values were in the range of 200–250 µM) [27]. Moreover, 17, selected in our survey as the most active in the cell viability test, is mentioned in only a few studies for its anticancer activity (e.g., HeLa, SCC, MCF-7, U251N, and PANC-1 cell lines) [21,28,29,30]. It is worth mentioning that increasing activity against cancer cells with 1517 is not connected to higher toxic effects against normal cells. Compound 37 differs in its structural structure from other active flavonoids; it belongs to the group of isoflavones that have the B-ring attached to the C-ring in position 3 [31]. Genistein (37) was a formerly mentioned inhibitor of the growth of another melanoma cell line (OCM-1) and in many other cancers, such as leukemia, lymphoma, ovarian, cervical, leiomyoma, melanoma, neuroblastoma, gastric, pancreatic, breast, and prostate cancer cells [32,33,34].
Reviewing the results obtained from the MTT and NRU tests, we concluded that flavonoid acetylation or glycosylation in carbons in the B-ring (e.g., 1013) and benzo-γ-pyrane ring (e.g., 25, 2729) reduce their activity in melanoma cells. Our conclusions are consistent with the available literature data regarding flavonoids and their derivative biological activities. In silico molecular docking analysis and ligand–active site interactions were studied by Nile et al. using inter alia quercetin, quercetin glycoside, quercetin 3,4′-O-diglucoside and α-glucosidase, tyrosinase, and xanthine oxidase enzymes. Their results show that docked quercetin is active against glucosidase, tyrosinase, and xanthine oxidase, which is consistent with our in vitro study [35].
Furthermore, the methylation of hydroxyls is a typical modification found in flavonoid metabolites. Based on previous studies, higher methoxylated compounds are significantly more toxic than less methoxylated molecules. It was found that 7-methoxy-baicalein is more cytotoxic than baicalein. It is also assumed that the overall number of OH groups negatively correlates with the cytotoxic potential of the molecule (apigenin vs. quercetin) [36]. Nevertheless, it seems that the overall number of OH groups in the C- and B-rings unfavorably influences the cytotoxic potential of the compounds. There is a lack of information about the A-ring. According to our results, the appearance of free hydroxyls in the A ring (15, 16) or the methylation of OH groups in the B-ring (17) increased their function as potential anticancer agents.
In the next step of our experiment, we evaluated the inhibition of DNA biosynthesis by measuring [3H]-thymidine incorporation into the DNA of C32, A375, and normal cells. Thymidylate deficiency and fluctuations in cellular nucleotide pools slow tumor growth by impairing DNA replication and repair [37,38]. Again, using 17 caused the most notable decrease in the assay after 48 h of incubation for both A375 and C32 cell lines (IC50 = 6.0 ± 0.2 and 5.3 ± 0.4 µM, respectively), with very low toxic effects against normal cells. Recently, Strawa and co-workers noticed that 17 evokes DNA biosynthesis inhibition in an oral squamous carcinoma (SCC-25) cell line [21].
In cancers, like many other diseases, an imbalance in apoptotic mechanisms occurs. Flavonoids are known as substances that can be aspirants for the ancillary therapy of cancer via modulating apoptotic pathways [39,40]. A summarized scheme of action by 1, 6, 1617, and 37 in A375 and C32 cells is given in Figure 5. A graphical representation of the substitutions and chemical groups relevant to the cytotoxic activity of these flavonoids is shown in Figure 6. It was previously reported that treatment with apigenin (1) induces the intrinsic and extrinsic pathways of apoptosis. As Bo et al. presented, increased levels of active caspase-3 and caspase-9 and the cleavage product of poly-(ADP-ribose) polymerase (cPARP) are present in human colon carcinoma HCT-116 cells treated with apigenin [41]. However, 1 activates kinase RSK, which is responsible for the inactivation of cytosolic pro-apoptotic proteins and the activation of transcription factors that mediate their synthesis [42,43]. This phenomenon may become one of the mechanisms by which melanoma cells defend themselves to evade apoptosis. In our study, 1 provoked the activation of caspases-8, -7, -9, and -3 in the A375 cells and caspase-3 in the C32 cells. Compound 6, which differs from apigenin by the presence of a hydroxyl group at C4′, caused a dose-dependent activation of caspases in the A375 cell line. The lower concentration (25 µM) induced extrinsic (cleavage of caspase-8) and intrinsic (cleavage of caspase-3, -7, and -9) pathways of apoptosis. However, the presence of cleaved initiator caspases was not found in cells treated with a higher concentration of 6. Also, in C32 cells, treatment with 6 did not cause an increase in the cleavage of initiator caspases. In contrast, it induced the processing of caspase-3 and caspase-7 and promoted apoptosis but inhibited RSK proteins. These results may suggest that 6 shows two dose-dependent mechanisms of action subsequent to cell death at the appointed time of incubation (48 h). Another study demonstrated the activation of caspases-3 and -9 in non-small-cell lung cancer cells A549 and H460 or oral squamous cancer cells SCC-4 [44,45,46]. Flavonoid 15, a non-studied till now compound, induced caspase-8 activation in A375 melanoma cells. Furthermore, it possessed a bi-directional and dose-dependent action on RSK proteins, suppressing their phosphorylation at higher concentrations. On the other hand, 15 activated the intrinsic apoptosis pathway by the induction of caspase-9 in C32 cells. A previous investigation indicated that 16 is an activator of caspase-3 and c-PARP in SK-MEL-2 and G-361 melanoma cells [27]. Consistent with these findings, 16 induced apoptosis in both A375 and C32 cell lines. This has been formerly shown by Western blot analysis, in which 17 degraded PARP-1, a substrate of caspase 3, in HeLaPKCεA/E cells [47]. According to our immunofluorescence and Western blot results, treatment with 17 increased cleaved caspases-3 and -7 levels and led to the processing of PARP. The flow cytometric analysis of C32 melanoma cells showed that 17 (at 25 µM) caused the most significant increase in the percentage of early apoptotic cells (19.7 ± 1.6%) and the percentage of late apoptotic cells (32.8 ± 2.4%). However, 17 induced a massive RSK phosphorylation in A375 cells while inhibiting it in C32 cells. To summarize, the anticancer potential of 17 is most probably based on DNA biosynthesis inhibition (in both A375 and C32) and the inhibition of RSK activity (C32). As previous studies reported, genistein (37) acts on cancer progression mainly by targeting the NF-κB, Akt, and caspase pathways [48,49,50]. Based on our investigation, 37 led to apoptosis by the activation of caspases-3, -7, -8, and -9. Other studies of this compound reported that it could induce apoptosis in various human cancer cells (e.g., HT-29) via caspase-3 activation [34,51,52]. This may prove the importance of the B-ring attached to the C-ring in position 3 for cytotoxic activity. Indeed, in our study, the anticancer effects and their mechanism for compounds 37 and 1, which differ in the positioning of the 4-hydroxyphenyl group, were similar. However, 37 and 1 inversely affected the phosphorylation of RSK.
In sum, the hydroxylation of the B-ring in the 3′ position does not seem to affect the strength and mechanism of the anticancer action of flavonoids (1; 5,7,3′-hydroxyflavone vs. 6; 5,7,3′,4′-tetrahydroxyflavone). Our conclusions agree with those of previous studies [53]. Notably, many reports have provided evidence of the influence of flavonoid glycosylation on their activity [46]. Glycosylated flavonoids (6 vs. 1013 or 1 vs. 2, 3) possess weaker cytotoxic activity than aglycones. The weak antiproliferative effects of flavonoid glycosides might be derived from steric blocking involved in cell entry and receptor binding [47]. Flavonoid A-ring poly-O-methylation contributed to enhancing their biological activity [46], which is also consistent with our scores (e.g., 25 vs. 24). It is worth noting that 5-OH seems to play a crucial role in membrane-dependent processes associated with the bioactivity of flavonoids [48]. In the present experiment, the most potent compounds have a hydroxyl group in the A rings at the C5 position (1, 6, 15, and 37). However, further explanations should be provided.

5. Conclusions

The data presented above highlight the structure—activity relationship determination of the chemical substitutions of flavonoid compounds responsible for anticancer effects. The in vitro studies highlight the importance of the flavonoid core in hydroxyl groups. In conclusion, our results indicate that apigenin, luteolin, 5,6-dihydroxyflavone, and genistein reduce the viability of amelanotic melanoma A375 and C32 cell lines via the intrinsic and extrinsic pathways of apoptosis. On the other hand, 7,8-dihydroxyflavone and zapotin likely act after the inhibition of DNA biosynthesis. Our studies also indicate that the RSK pathway is involved in the response of melanoma cells to cytotoxic concentrations of certain flavonoids, which may provide a basis for studies on the combined use of flavonoids with inhibitors of RSK kinases. Nevertheless, additional investigations using in vivo assays to test these anticancer effects are required to fully understand their mechanism of action.

Supplementary Materials

The following supporting information can be downloaded at https://www.mdpi.com/article/10.3390/cancers16030487/s1: Figure S1. Viability of A375 and C32 melanoma cells and dermal fibroblasts treated with compounds 137 or cisplatin for 24, 48, and 72 h, determined by MTT assay; Figure S2. Viability of A375 and C32 melanoma cells and dermal fibroblasts treated with compounds 137 or cisplatin for 24, 48, and 72 h, determined by neutral red uptake assay; Figure S3. Quantitative analysis of Western immunoblot images; Figure S4. Quantitative analysis of immunofluorescence images; Figures S5–S19. Separate Western blot images.

Author Contributions

Conceptualization, K.J.; methodology, K.J. and Ł.S; formal analysis, K.J. and M.T.; investigation, K.J. and Ł.S.; resources, K.J. and M.T.; data curation, K.J. and Ł.S.; writing—original draft preparation, K.J. and Ł.S.; writing—review and editing, A.S. and M.T.; visualization, K.J.; supervision, K.J. and Ł.S.; project administration, K.J. and Ł.S.; funding acquisition, K.J. and M.T. All authors have read and agreed to the published version of the manuscript.

Funding

This study was funded by the Medical University of Białystok (Poland), grant number B.SUB.23.390.

Institutional Review Board Statement

Not applicable.

Informed Consent Statement

Not applicable.

Data Availability Statement

The data presented in this study are available in this article and supplementary material.

Acknowledgments

The authors express thanks to J.W. Strawa from the Medical University of Białystok (Poland) and A.M. Juszczak for providing the isolates for this biological study.

Conflicts of Interest

The authors declare no conflicts of interest.

References

  1. Orthaber, K.; Pristovnik, M.; Skok, K.; Perić, B.; Maver, U. Skin Cancer and Its Treatment: Novel Treatment Approaches with Emphasis on Nanotechnology. J. Nanomater. 2017, 2017, 1–20. [Google Scholar] [CrossRef]
  2. Liu, X.Y.; Fang, H.; Yang, Z.G.; Wang, X.Y.; Ruan, L.M.; Fang, D.R.; Ding, Y.G.; Wang, Y.N.; Zhang, Y.; Jiang, X.L.; et al. Matrine inhibits invasiveness and metastasis of human malignant melanoma cell line A375 in vitro. Int. J. Dermatol. 2008, 47, 448–456. [Google Scholar] [CrossRef]
  3. Atkinson, V. Recent advances in malignant melanoma. Intern. Med. J. 2017, 47, 1114–1121. [Google Scholar] [CrossRef]
  4. Yuan, R.; Hou, Y.; Sun, W.; Yu, J.; Liu, X.; Niu, Y.; Lu, J.J.; Chen, X. Natural products to prevent drug resistance in cancer chemotherapy: A review. Ann. N. Y. Acad. Sci. 2017, 1401, 19–27. [Google Scholar] [CrossRef]
  5. Szlasa, W.; Supplitt, S.; Drąg-Zalesińska, M.; Przystupski, D.; Kotowski, K.; Szewczyk, A.; Kasperkiewicz, P.; Saczko, J.; Kulbacka, J. Effects of curcumin based PDT on the viability and the organization of actin in melanotic (A375) and amelanotic melanoma (C32)– in vitro studies. Biomed. Pharmacother. 2020, 132, 12. [Google Scholar] [CrossRef]
  6. Mouawad, R.; Sebert, M.; Michels, J.; Bloch, J.; Spano, J.P.; Khayat, D. Treatment for metastatic malignant melanoma: Old drugs and new strategies. Crit. Rev. Oncol. Hematol. 2010, 74, 27–39. [Google Scholar] [CrossRef]
  7. Ijaz, S.; Akhtar, N.; Khan, M.S.; Hameed, A.; Irfan, M.; Arshad, M.A.; Ali, S.; Asrar, M. Plant derived anticancer agents: A green approach towards skin cancers. Biomed. Pharmacother. 2018, 103, 1643–1651. [Google Scholar] [CrossRef]
  8. Kopustinskiene, D.M.; Jakstas, V.; Savickas, A.; Bernatoniene, J. Flavonoids as Anticancer Agents. Nutrients 2020, 12, 457. [Google Scholar] [CrossRef]
  9. Gutiérrez-Venegas, G.; Sánchez-Carballido, M.A.; Delmas Suárez, C.; Gómez-Mora, J.A.; Bonneau, N. Effects of flavonoids on tongue squamous cell carcinoma. Cell Biol. Int. 2020, 44, 686–720. [Google Scholar] [CrossRef]
  10. Wink, M. Modes of action of herbal medicines and plant secondary metabolites. Medicines 2015, 2, 251–286. [Google Scholar] [CrossRef]
  11. Slika, H.; Mansour, H.; Wehbe, N.; Nasser, S.A.; Iratni, R.; Nasrallah, G.; Shaito, A.; Ghaddar, T.; Kobeissy, F.; Eid, A.H. Therapeutic Potential of flavonoids in cancer: ROS-mediated mechanisms. Biomed. Pharmacother. 2022, 146, 112442. [Google Scholar] [CrossRef]
  12. Malešev, D.; Kuntić, V. Investigation of metal-flavonoid chelates and the determination of flavonoids via metal-flavonoid complexing reactions. J. Serbian Chem. Soc. 2007, 72, 921–939. [Google Scholar] [CrossRef]
  13. Nazaruk, J.; Jakoniuk, P. Flavonoid composition and antimicrobial activity of Cirsium rivulare (Jacq.) all. flowers. J. Ethnopharmacol. 2005, 102, 208–212. [Google Scholar] [CrossRef]
  14. Strawa, J.; Wajs-Bonikowska, A.; Jakimiuk, K.; Waluk, M.; Poslednik, M.; Nazaruk, J.; Tomczyk, M. Phytochemical examination of woolly burdock Arctium tomentosum leaves and flower heads. Chem. Nat. Compd. 2020, 56, 345–347. [Google Scholar] [CrossRef]
  15. Juszczak, A.M.; Czarnomysy, R.; Strawa, J.W.; Končić, M.Z.; Bielawski, K.; Tomczyk, M. In vitro anticancer potential of Jasione montana and its main components against human amelanotic melanoma cells. Int. J. Mol. Sci. 2021, 22, 3345. [Google Scholar] [CrossRef]
  16. Jakimiuk, K.; Strawa, J.W.; Granica, S.; Tomczyk, M. New flavone C-glycosides from Scleranthus perennis and their anti-collagenase activity. Molecules 2021, 26, 5631. [Google Scholar] [CrossRef]
  17. Jakimiuk, K.; Strawa, J.W.; Granica, S.; Locatelli, M.; Tartaglia, A.; Tomczyk, M. Determination of flavonoids in selected Scleranthus species and their anti-collagenase and antioxidant potential. Molecules 2022, 27, 2015. [Google Scholar] [CrossRef]
  18. Tomczyk, M. Secondary metabolites from Potentilla recta L. and Drymocallis rupestris (L.) Soják (syn. Potentilla rupestris L.) (Rosaceae). Biochem. Syst. Ecol. 2011, 39, 893–896. [Google Scholar] [CrossRef]
  19. Gudej, J.; Tomczyk, M. Polyphenolic compounds from flowers of Ficaria verna Huds. Acta Pol. Pharm. Drug Res. 1999, 56, 475–476. [Google Scholar]
  20. Tomczyk, M.; Gudej, J. Quercetin and kaempferol glycosides from Ficaria verna flowers and their structure studied by 2D NMR spectroscopy. Pol. J. Chem. 2002, 76, 1601–1605. [Google Scholar]
  21. Carmichael, J.; DeGraff, W.G.; Gazdar, A.F.; Minna, J.D.; Mitchell, J.B. Evaluation of a tetrazolium-based semiautomated colorimetric assay: Assessment of chemosensitivity testing. Cancer Res. 1987, 47, 936–942. [Google Scholar]
  22. Rodgers, E.H.; Grant, M.H. The effect of the flavonoids, quercetin, myricetin and epicatechin on the growth and enzyme activities of MCF7 human breast cancer cells. Chem. Biol. Interact. 1998, 116, 213–228. [Google Scholar] [CrossRef]
  23. Sanders, K.; Moran, Z.; Shi, Z.; Paul, R.; Greenlee, H. Natural products for cancer prevention: Clinical update 2016. Semin. Oncol. Nurs. 2016, 32, 215–240. [Google Scholar] [CrossRef]
  24. Zhao, G.; Han, X.; Cheng, W.; Ni, J.; Zhang, Y.; Lin, J.; Song, Z. Apigenin inhibits proliferation and invasion, and induces apoptosis and cell cycle arrest in human melanoma cells. Oncol. Rep. 2017, 37, 2277–2285. [Google Scholar] [CrossRef]
  25. Cao, H.H.; Chu, J.H.; Kwan, H.Y.; Su, T.; Yu, H.; Cheng, C.Y.; Fu, X.Q.; Guo, H.; Li, T.; Tse, A.K.W.; et al. Inhibition of the STAT3 signaling pathway contributes to apigenin-mediated anti-metastatic effect in melanoma. Sci. Rep. 2016, 6, 21731. [Google Scholar] [CrossRef]
  26. Said, A.; Tundis, R.; Hawas, U.W.; El-kousy, S.M. In vitro antioxidant and antiproliferative activities of flavonoids from Ailanthus excelsa (Roxb.) (Simaroubaceae) leaves. Z. Naturforsh. C 2010, 65c, 180–186. [Google Scholar] [CrossRef]
  27. Ju, W.S.; Seo, S.Y.; Mun, S.-E.; Kim, K.; Yu, J.O.; Ryu, J.-S.; Kim, J.-S.; Choo, Y.-K. 7,8-Dihydroxyflavone induces mitochondrial apoptosis and down-regulates the expression of ganglioside GD3 in malignant melanoma cells. Discov. Oncol. 2023, 14, 13. [Google Scholar] [CrossRef]
  28. Toton, E.; Romaniuk, A.; Budzianowski, J.; Hofmann, J.; Rybczynska, M. Zapotin (5,6,2′,6′-tetramethoxyflavone) modulates the crosstalk between autophagy and apoptosis pathways in cancer cells with overexpressed constitutively active PKCϵ. Nutr. Cancer 2016, 68, 290–304. [Google Scholar] [CrossRef]
  29. Ya-Ming, X.U.; Ramirez-Ahumada, M.D.C.; Valeriote, F.A.; Gunatilaka, A.L. Solid tumor inhibitory and other constituents of Casimiroa tetrameria. Chin. J. Nat. Med. 2011, 9, 334–337. [Google Scholar] [CrossRef]
  30. Strawa, J.W.; Jakimiuk, K.; Tomczyk, M. Zapotin, a polymethoxyflavone, with potential therapeutic attributes. Int. J. Mol. Sci. 2021, 22, 13227. [Google Scholar] [CrossRef]
  31. Heim, K.E.; Tagliaferro, A.R.; Bobilya, D.J. Flavonoid antioxidants: Chemistry, metabolism and structure-activity relationships. J. Nutr. Biochem. 2002, 13, 572–584. [Google Scholar] [CrossRef]
  32. Record, I.R.; Broadbent, J.L.; King, R.A.; Dreosti, I.E.; Head, R.J.; Tonkin, A.L. Genistein inhibits growth of B16 melanoma cells in vivo and in vitro and promotes differentiation in vitro. Int. J. Cancer 1997, 72, 860–864. [Google Scholar] [CrossRef]
  33. Casagrande, F.; Darbon, J.M. p21(CIP1) is dispensable for the G2 arrest caused by genistein in human melanoma cells. Exp. Cell Res. 2000, 258, 101–108. [Google Scholar] [CrossRef]
  34. Banerjee, S.; Li, Y.; Wang, Z.; Sarkar, F.H. Multi-targeted therapy of cancer by genistein. Cancer Lett. 2008, 269, 226–242. [Google Scholar] [CrossRef]
  35. Nile, A.; Gansukh, E.; Park, G.S.; Kim, D.H.; Hariram Nile, S. Novel insights on the multi-functional properties of flavonol glucosides from red onion (Allium cepa L.) solid waste—In vitro and in silico approach. Food Chem. 2021, 335, 127650. [Google Scholar] [CrossRef]
  36. Plochmann, K.; Korte, G.; Koutsilieri, E.; Richling, E.; Riederer, P.; Rethwilm, A.; Schreier, P.; Scheller, C. Structure-activity relationships of flavonoid-induced cytotoxicity on human leukemia cells. Arch. Biochem. Biophys. 2007, 460, 1–9. [Google Scholar] [CrossRef]
  37. Wilson, P.M.; Danenberg, P.V.; Johnston, P.G.; Lenz, H.J.; Ladner, R.D. Standing the test of time: Targeting thymidylate biosynthesis in cancer therapy. Nat. Rev. Clin. Oncol. 2014, 11, 282–298. [Google Scholar] [CrossRef]
  38. Chu, E.; Callender, M.A.; Farrell, M.P.; Schmitz, J.C. Thymidylate synthase inhibitors as anticancer agents: From bench to bedside. Cancer Chemother. Pharmacol. Suppl. 2003, 52, 80–89. [Google Scholar] [CrossRef]
  39. Prasher, P.; Sharma, M.; Singh, S.K.; Gulati, M.; Chellappan, D.K.; Zacconi, F.; De Rubis, G.; Gupta, G.; Sharifi-Rad, J.; Cho, W.C. Luteolin: A flavonoid with a multifaceted anticancer potential. Cancer Cell Int. 2022, 22, 386. [Google Scholar] [CrossRef]
  40. Abotaleb, M.; Samuel, S.M.; Varghese, E.; Varghese, S.; Kubatka, P.; Liskova, A.; Büsselberg, D. Flavonoids in cancer and apoptosis. Cancers 2019, 11, 28. [Google Scholar] [CrossRef]
  41. Bo, W.; Zhao, X.H. Apigenin induces both intrinsic and extrinsic pathways of apoptosis in human colon carcinoma HCT-116 cells. Oncol. Rep. 2017, 37, 1132–1140. [Google Scholar] [CrossRef]
  42. Xifró, X.; Anglada-Huguet, M.; Rué, L.; Saavedra, A.; Pérez-Navarro, E.; Alberch, J. Increased 90-kDa ribosomal S6 kinase (RSK) activity is protective against mutant huntingtin toxicity. Mol. Neurodegener. 2011, 6, 74. [Google Scholar] [CrossRef] [PubMed]
  43. Houles, T.; Roux, P.P. Defining the role of the RSK isoforms in cancer. Semin. Cancer Biol. 2018, 48, 53–61. [Google Scholar] [CrossRef]
  44. Cai, X.; Ye, T.; Liu, C.; Lu, W.; Lu, M.; Zhang, J.; Wang, M.; Cao, P. Luteolin induced G2 phase cell cycle arrest and apoptosis on non-small cell lung cancer cells. Toxicol. Vitr. 2011, 25, 1385–1391. [Google Scholar] [CrossRef] [PubMed]
  45. Park, S.H.; Park, H.S.; Lee, J.H.; Chi, G.Y.; Kim, G.Y.; Moon, S.K.; Chang, Y.C.; Hyun, J.W.; Kim, W.J.; Choi, Y.H. Induction of endoplasmic reticulum stress-mediated apoptosis and non-canonical autophagy by luteolin in NCI-H460 lung carcinoma cells. Food Chem. Toxicol. 2013, 56, 100–109. [Google Scholar] [CrossRef]
  46. Yang, S.-F.; Yang, W.-E.; Chang, H.-R.; Chu, S.-C.; Hsieh, Y.-S. Luteolin induces apoptosis in oral squamous cancer cells. J. Dent. Res. 2008, 87, 401–406. [Google Scholar] [CrossRef]
  47. Toton, E.; Lisiak, N.; Rubis, B.; Budzianowski, J.; Gruber, P.; Hofmann, J.; Rybczynska, M. The tetramethoxyflavone zapotin selectively activates protein kinase C epsilon, leading to its down-modulation accompanied by Bcl-2, c-Jun and c-Fos decrease. Eur. J. Pharmacol. 2012, 682, 21–28. [Google Scholar] [CrossRef]
  48. Ullah, M.F.; Ahmad, A.; Zubair, H.; Khan, H.Y.; Wang, Z.; Sarkar, F.H.; Hadi, S.M. Soy isoflavone genistein induces cell death in breast cancer cells through mobilization of endogenous copper ions and generation of reactive oxygen species. Mol. Nutr. Food Res. 2011, 55, 553–559. [Google Scholar] [CrossRef]
  49. Szliszka, E.; Krol, W. Soy isoflavones augment the effect of TRAIL-mediated apoptotic death in prostate cancer cells. Oncol. Rep. 2011, 26, 533–541. [Google Scholar] [CrossRef]
  50. Solomon, L.A.; Ali, S.; Banerjee, S.; Munkarah, A.R.; Morris, R.T.; Sarkar, F.H. Sensitization of ovarian cancer cells to cisplatin by genistein: The role of NF-kappaB. J. Ovarian Res. 2008, 1, 9–11. [Google Scholar] [CrossRef]
  51. Qin, J.; Teng, J.; Zhu, Z.; Chen, J.; Huang, W.J. Genistein induces activation of the mitochondrial apoptosis pathway by inhibiting phosphorylation of Akt in colorectal cancer cells. Pharm. Biol. 2016, 54, 74–79. [Google Scholar] [CrossRef] [PubMed]
  52. Tophkhane, C.; Yang, S.; Bales, W.; Archer, L.; Osunkoya, A.; Thor, A.D.; Yang, X. Bcl-2 overexpression sensitizes MCF-7 cells to genistein by multiple mechanisms. Int. J. Oncol. 2007, 31, 867–874. [Google Scholar] [CrossRef]
  53. Krych, J.; Gebicka, L. Catalase is inhibited by flavonoids. Int. J. Biol. Macromol. 2013, 58, 148–153. [Google Scholar] [CrossRef]
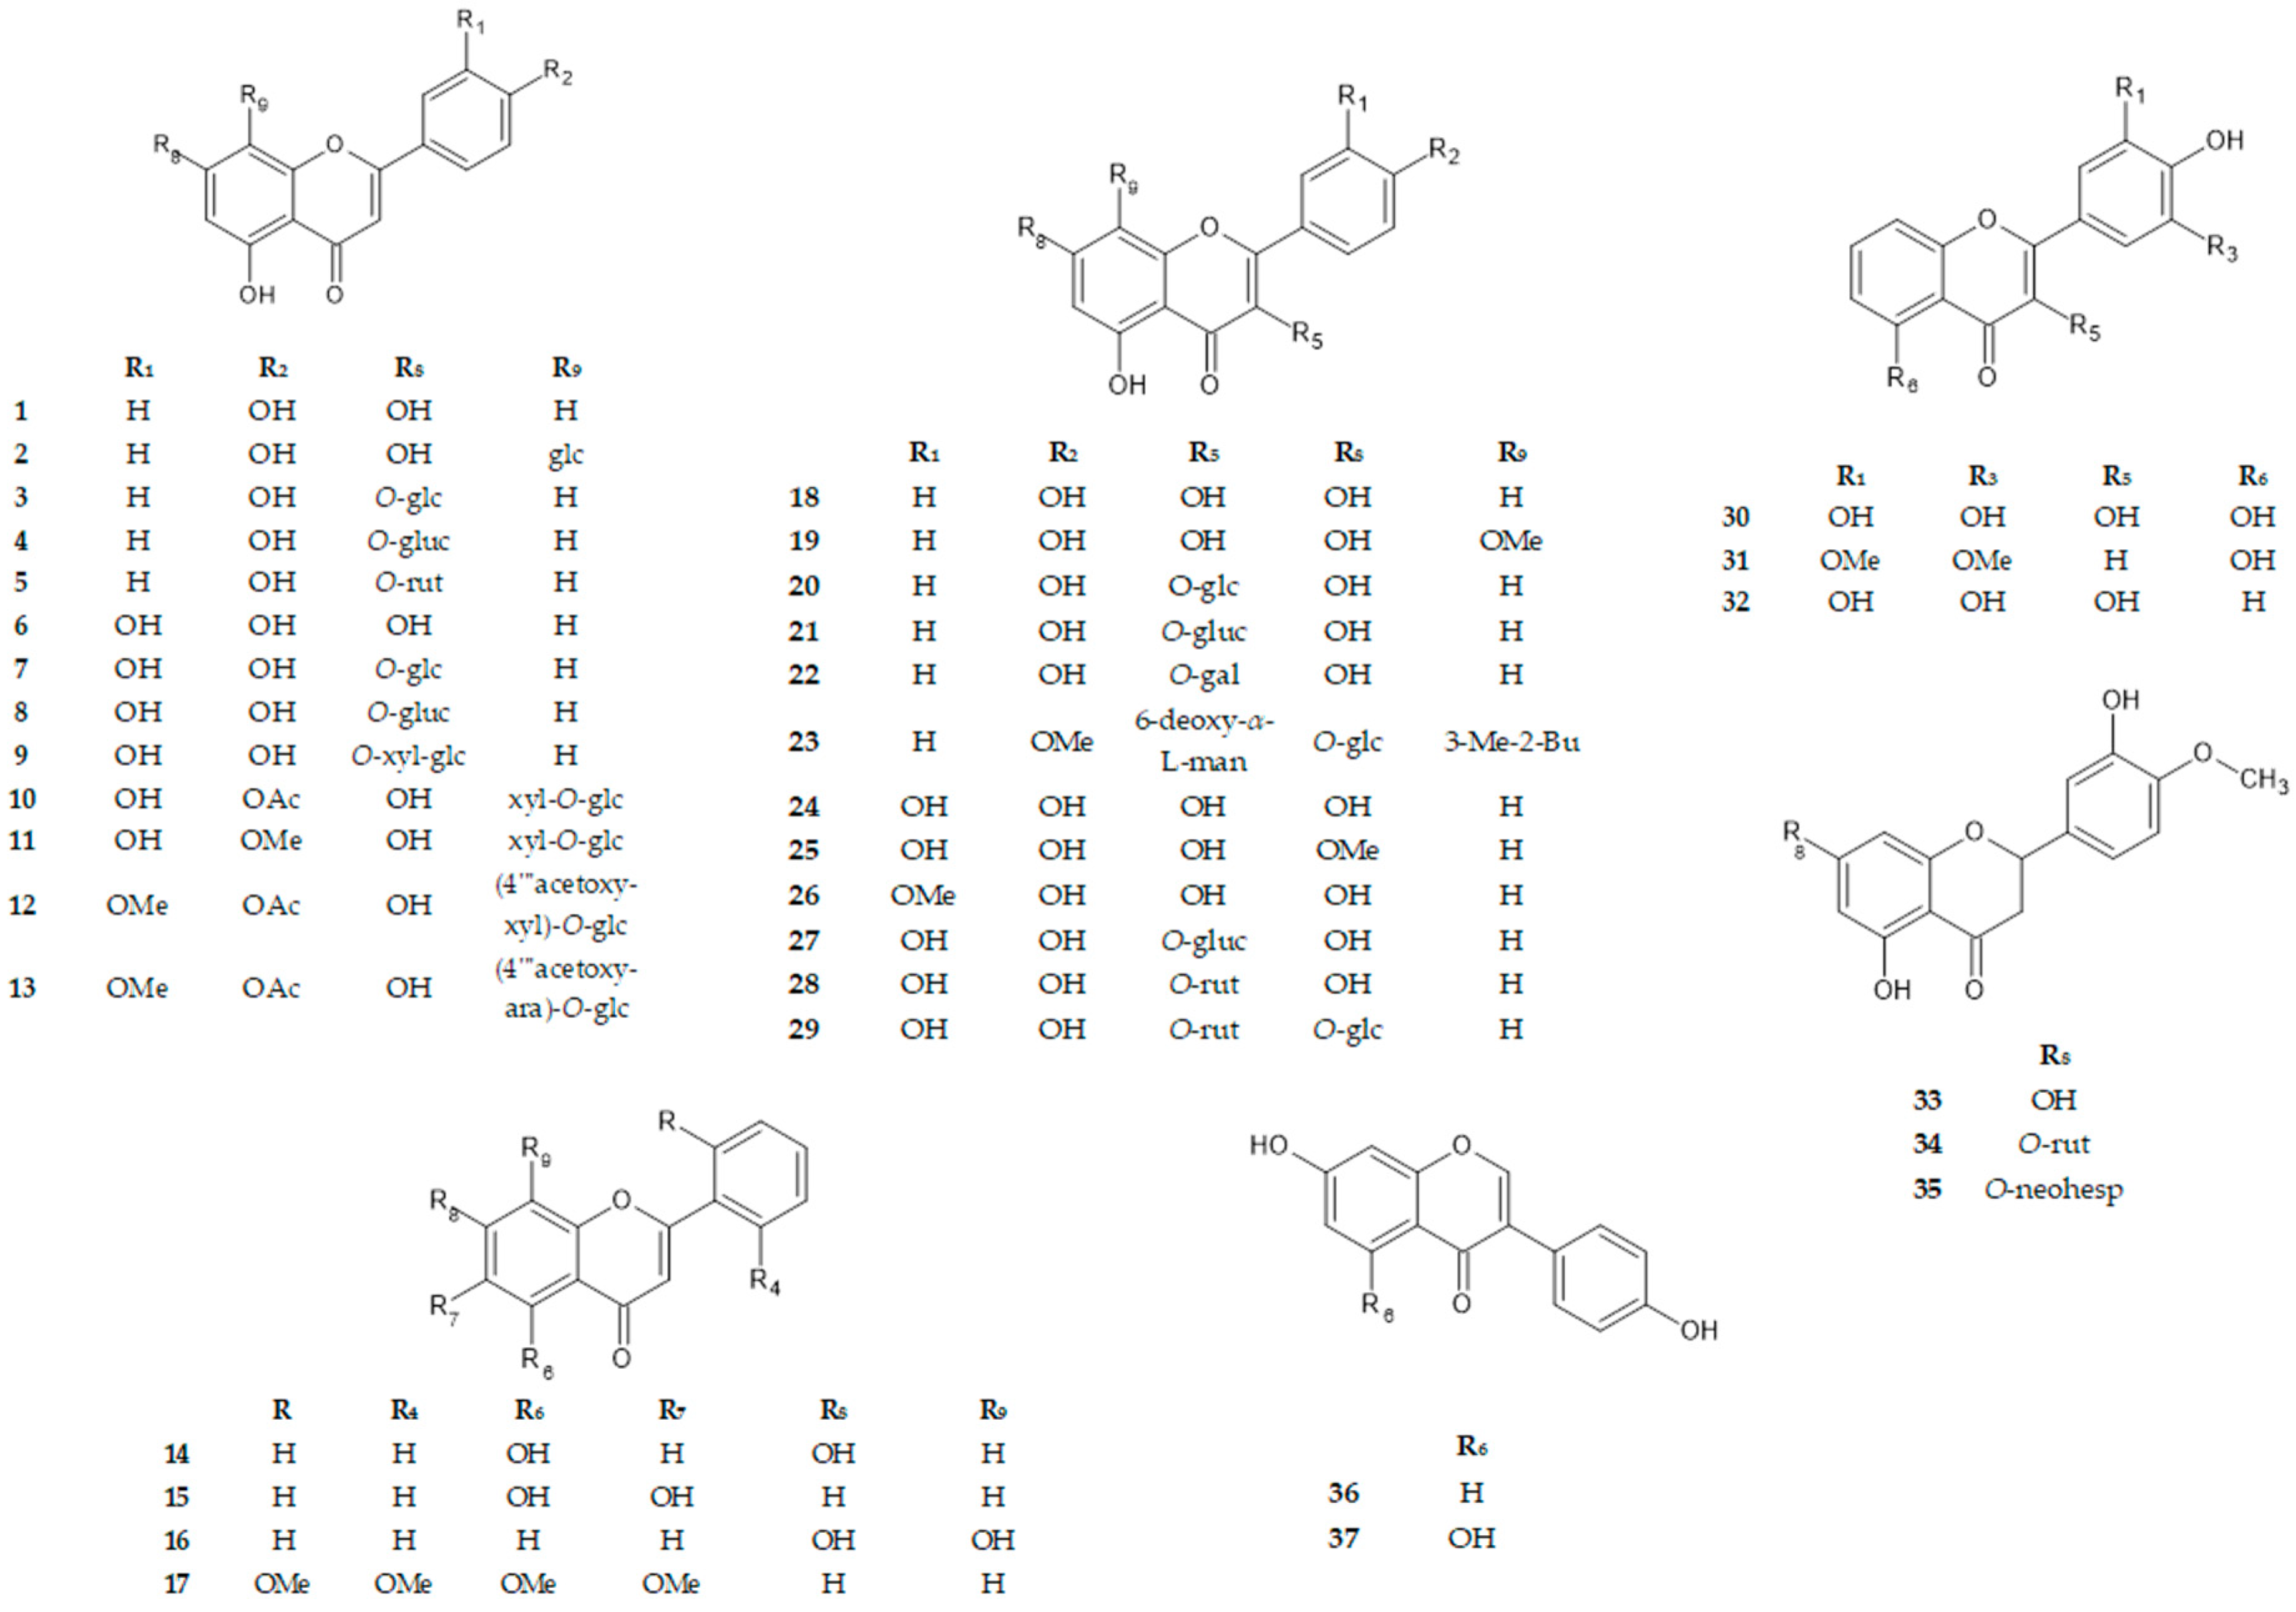
Figure 1. Molecular structures of the tested compounds. Me—methyl; Bu—butenyl; Ac—acetyl; glc—glucose; gluc—glucuronide; ara—arabinoside; man—mannose; rut—rutinose; xyl—xylose; neohesp—neohesperidoside.
Cancers 16 00487 g001
Figure 2. Flow cytometric analysis of A375 and C32 melanoma cells after incubation with compounds 1, 6, 1517, and 37 (25, 50, 100 µM) for 48 h and subsequent staining with annexin V-fluorescein isothiocyanate (x-axis) and PI (y-axis), C-control (cells treated with 0.1% DMSO). * p < 0.05, when compared to the control group.
Cancers 16 00487 g002
Figure 3. Western blot analysis of phospho-RSK, RSK, PARP, caspase-8, caspase-9, caspase-7, and caspase-3 in A375 and C32 cells treated with 1, 6, 1517, 37, and cPt for 48 h. Actin served as a control for protein loading. C—control cells treated with 0.1% DMSO. The uncropped blots are shown in Figures S5–S19.
Cancers 16 00487 g003
Figure 4. Immunofluorescence imaging of cleaved caspase-3 and cleaved caspase-7 (red fluorescence) in A375 and C32 cells treated with 1, 6, 1517, 37, and cPt for 48 h. Cell nuclei were stained with Hoechst 33342 (blue fluorescence) and F-actin was stained with Phalloidin-Atto 488 (green fluorescence). Objective ×20. Scale bar 100 μm. C—control (cells treated with 0.1% DMSO).
Cancers 16 00487 g004
Figure 5. Proposed scheme of action by 1, 6, 1617, and 37 in A375 and C32 melanoma cells.
Cancers 16 00487 g005
Figure 6. Chemical groups responsible for flavonoid activity (SAR, structure–activity relationship).
Cancers 16 00487 g006
Table 1. Substitution pattern of compounds 137.
No.π C2-C3B-RingBenzo-γ-Pyrane Ring
C2′
(R)
r
(R)
C3′
(R1)
C4′
(R2)
C5′
(R3)
C6′
(R4)
C3
(R5)
C5
(R6)
C6
(R7)
C7
(R8)
C8
(R9)
1+HHOHHHHOHHOHH
2+HHOHHHHOHHOHglc
3+HHOHHHHOHHO-glcH
4+HHOHHHHOHHO-glucH
5+HHOHHHHOHHO-rutH
6+HOHOHHHHOHHOHH
7+HOHOHHHHOHHO-glcH
8+HOHOHHHHOHHO-glucH
9+HOHOHHHHOHHO-xyl-glcH
10+hOHOAcHHHOHHOHxyl-O-glc
11+hOHOMeHHHOHHOHxyl-O-glc
12+HOMeOAcHHHOHHOH(4‴acetoxy-xyl)-O-glc
13+HOMeOAcHHHOHHOH(4‴acetoxy-ara)-O-glc
14+HHHHHHOHHOHH
15+HHHHHHOHOHHH
16+HHHHHHHHOHOH
17+OMeHHHOMeHOMeOMeHH
18+HHOHHHOHOHHOHH
19+HHOHHHOHOHhOHOMe
20+HHOHHHO-glcOHHOHH
21+HHOHHHO-glucOHHOHH
22+HHOHHHO-galOHHOHH
23+HHOMeHH6-deoxy-α-L-manOHHO-glc3-Me-2-Bu
24+HOHOHHHOHOHHOHH
25+HOHOHHHOHoHHOMeH
26+HOMeOHHHOHOHHOHH
27+HOHOHHHO-glucOHHOHH
28+HOHOHHHO-rutOHHOHH
29+HOHOHHHO-rutOHHO-glcH
30+HOHOHOHHOHOHHOHH
31+HOMeOHOMeHHOHHOHH
32+HOHOHOHHOHHHOHH
33hOHOMeHHHOHHOHH
34hOHOMeHHHOHHO-rutH
35hOHOMeHHHOHHO-neohespH
36+HHOHHH4-HpHHOHH
37+HHOHHH4-HpOHHOHH
+/− in the column π C2-C3 means presence or absence of double bond; Me—methyl; Bu—butenyl; Ac—acetyl; glc—glucose; gluc—glucuronide; ara—arabinoside; man—mannose; rut—rutinose; xyl—xylose; neohesp—neohesperidoside; 4-Hp—4-hydroxyphenyl.
Table 2. Cytotoxic activity of compounds 137 measured using MTT test. IC50 values are expressed as μM.
No.A375C32Normal Cells
24 h48 h72 h24 h48 h72 h24 h48 h72 h
1>20031.9 ± 3.020.7 ± 1.5>20063.1 ± 4.731.8 ± 2.5>200>200100–200
2>200>200>200>200>200>200>200>200>200
3>200>200>200>200>200>200>200>200>200
4>200>200>200>200>200>200>200>200>200
5>200>200>200>200>200>200>200>200>200
6>20038.2 ± 4.124.6 ± 1.6>20042.1 ± 3.513.1 ± 1.3>20069.7 ± 5.220.1 ± 1.4
7>200>20037.1 ± 3.0>20060.5 ± 4.640.7 ± 2.9>200>200>200
8>200>200>200>200>200>200>200>200>200
9>200>200>200>200>200>200>200>200>200
10>200>200>200>200>200>200>200>200>200
11>200>200>200>200>200>200>200>200>200
12>200>200>200>200>200>200>200>200>200
13>200>200>200>200>200>200>200>200>200
14100–20066.4 ± 4.534.4 ± 2.8100–20096.4 ± 7.058.9 ± 4.5>200>20071.2 ± 4.5
1586.0 ± 6.336.4 ± 2.026.4 ± 1.2100–20047.5 ± 3.523.5 ± 1.9>200>200>200
16100–20033.16 ± 3.220.5 ± 2.2100–20039.2± 2.626.2 ± 2.8>200100–20093.3 ± 8.0
1797.9 ± 7.331.1 ± 2.920.5 ± 1.9100–20026.5 ± 1.313.9 ± 1.2>20078.0 ± 5.253.9 ± 3.6
18100–200100–20075.8 ± 5.8100–200100–20058.4 ± 3.5100–200100–20055.8 ± 4.5
19100–200100–20061.8 ± 3.1100–200100–200100–200>200>200100–200
2094.2 ± 6.946.9 ± 3.521.5 ± 2.2>200>200>200>200>200>200
21>200>200>200>200>200>200>200>200>200
22>200>200>200>200>200>200>200>200>200
23>200>200>200>200>200>200>200>200>200
24>200>20074.4 ± 5.0>200>20068.1 ± 4.6>200>20036.1 ± 2.0
25100–20042.1 ± 3.025.1 ± 2.3>200100–20037.7 ± 2.5100–20045.3 ± 2.335.7 ± 2.9
2686.30 ± 5.968.5 ± 3.950.8 ± 4.0>200100–20049.3 ± 3.6100–20068.5 ± 5.446.2 ± 3.3
27>200>200>200>200>200>200>200>200>200
28>20057.0 ± 3.157.8 ± 4.8>200>200>200>200>200>200
29>200>200>200>200>200>200>200>200>200
30>200>20075.3 ± 4.8>200>200>200>200>200>200
31>200100–200100–200>200100–200100–200100–20080.3 ± 6.656.4 ± 4.7
32>200>200>100–200>200>200>200>200>200>200
33100–200100–20074.5 ± 6.4>200100–20076.5 ± 6.3>200>200>200
34>200>200>200>200>200>200>200>200>200
35>200>200>200>200>200>200>200>200>200
36>200>200>200>200>200>200>200>200>200
3793.1 ± 5.860.9 ± 4.224.2 ± 2.6>200>20051.1 ± 3.5>200100–20056.8 ± 4.1
cPt A15.6 ± 2.38.1 ± 1.18.8 ± 1.118.3 ± 2.36.6 ± 1.16.2 ± 1.1100–20040.4 ± 4.524.5 ± 1.5
Values are expressed as µM and represented as the mean ± standard deviation (SD) from at least three independent measurements; A: cPt–cisplatin used as positive control.
Table 3. Cytotoxic activity of compounds 137 measured using NRU assay. IC50 values are expressed as μM.
No.A375C32Normal Cells
24 h48 h72 h24 h48 h72 h24 h48 h72 h
164.5 ± 4.324.7 ± 2.421.2 ± 1.4100–20025.7 ± 1.622.4 ± 1.5>20087.8 ± 5.858.0 ± 3.2
2>200>200>200>200>200>200>200>200>200
3>200>200>200>200>200>200>200>200>200
4>200>200>200>200>200>200>200>200>200
5>200>200>200>200>200>200>200>200>200
658.1 ± 4.225.7 ± 1.523.9 ± 0.2341.3 ± 3.813.1 ± 0.1112.6 ± 1.2>20045.2 ± 2.621.4 ± 1.7
7>20056.7 ± 3.841.5 ± 3.3>20029.6 ± 2.023.0 ± 2.1>200100–200100–200
8>200>200>200>200>200>200>200>200>200
9>200>200>200>200>200>200>200>200>200
10>200>200>200>200>200>200>200>200>200
11>200>200>200>200>200>200>200>200>200
12>200>200>200>200>200>200>200>200>200
13>200>200>200>200>200>200>200>200>200
1452.4 ± 3.534.5 ± 2.333.1 ± 2.889.2 ± 7.844.7 ± 3.925.6 ± 2.4100–20065.7 ± 4.276.3 ± 4.7
1553.3 ± 4.616.0 ± 1.113.6 ± 1.172.6 ± 5.518.2 ± 2.115.4 ± 1.1>200100–200100–200
16100–20036.0 ± 3.527.4 ± 2.4>20019.9 ± 1.216.5 ± 2.1>200100–20072.9 ± 5.6
1742.6 ± 3.214.7 ± 1.214.6 ± 1.2>20014.7 ± 2.213.9 ± 2.1>20059.4 ± 5.243.5 ± 2.9
18100–20057.4 ± 4.647.7 ± 3.9>20062.8 ± 3.534.4 ± 2.9>20069.8 ± 5.851.1 ± 3.2
19100–200100–200100–200100–20088.8 ± 7.071.9 ± 7.0>200>20064.8 ± 5.0
20>200>200>200>200>200>200>200>200>200
21>200>200>200>200>200>200>200>200>200
22>200>200>200>200>200>200>200>200>200
23>200>200>200>200>200>200>200>200>200
24100–20084.7 ± 6.579.2 ± 7.3>20058.0 ± 3.547.5 ± 4.3>20092.6 ± 4.236.4 ± 0.23
25>20063.4 ± 4.843.7 ± 3.5>20055.4 ± 4.328.4 ± 2.5>20066.3 ± 5.638.4 ± 3.4
26>200100–20078.1 ± 6.5>200100–20065.1 ± 4.0>20078.7 ± 5.569.2 ± 4.6
27>200>200>200>200>200100–200>200>200>200
28>200>200>200>200>200>200>200>200>200
29>200>200>200>200>200>200>200>200>200
30>200>200>200>200>200>200>200>200>200
31>200>200>200>200>200>200>200>200>200
32>200>200>200>200>200>200>200>200>200
33100–200100–200100–20069.0 ± 5.158.3 ± 5.653.7 ± 4.0>200>200100–200
34>200>200>200>200>200>200>200>200>200
35>200>200>200>200>200>200>200>200>200
36>200>200>200>200>200>200>200>200>200
3749.2 ± 3.232.3 ± 3.519.3 ± 2.2100–20031.5 ± 2.814.4 ± 2.1>20057.8 ± 4.038.6 ± 3.7
cPt A16.6 ± 2.114.4 ± 1.19.9 ± 1.115.7 ± 1.215.0 ± 1.213.8 ± 1.5100–20047.5 ± 4.924.4 ± 3.5
Values are expressed as µM and represented as the mean ± standard deviation (SD) from at least three independent measurements; A: cPt—cisplatin as a positive control.
Table 4. The effect of compounds 1, 6, 1517, and 37 on DNA biosynthesis. IC50 values are expressed as μM.
A375C32Normal Cells
24 h48 h72 h24 h48 h72 h24 h48 h72 h
187.7 ± 4.228.6 ± 1.823.4 ± 1.6>20027.0 ± 1.422.5 ± 1.2187.5 ± 8.1188.6 ± 9.5>200
6>20038.5 ± 2.930.9 ± 1.8>20030.9 ± 2.224.5 ± 1.81>200>200>200
15>20032.4 ± 2.431.4 ± 1.7>20020.0 ± 1.920.3 ± 1.2174.9 ± 7.6>200>200
1662.1 ± 3.929.7 ± 1.620.5 ± 2.238.1 ± 1.518.4 ± 1.412.8 ± 0.981.6 ± 5.864.6 ± 2.837.0 ± 2.5
17>2006.0 ± 0.25.34 ± 0.458.7 ± 3.89.1 ± 1.25.8 ± 3.1>200>20087.9 ± 4.0
37153.5 ± 10.828.0 ± 0.824.2 ± 1.525.4 ± 1.318.5 ± 0.719.1 ± 0.3>200>200>200
cPt3.8 ± 0.23.9 ± 0.53.4 ± 0.36.8 ± 0.45.7 ± 0.34.4 ± 0.47.1 ± 0.96.1 ± 0.56.1 ± 0.8
Values are expressed as µM and represented as the mean ± standard deviation (SD) from at least three independent measurements; cPt—cisplatin as positive control.
Disclaimer/Publisher’s Note: The statements, opinions and data contained in all publications are solely those of the individual author(s) and contributor(s) and not of MDPI and/or the editor(s). MDPI and/or the editor(s) disclaim responsibility for any injury to people or property resulting from any ideas, methods, instructions or products referred to in the content.

