
Enhancement of Stopping Power Ratio (SPR) Estimation Accuracy through Image-Domain Dual-Energy Computer Tomography for Pencil Beam Scanning System: A Simulation Study

 , ,
, ,  ,
,  and
and
Abstract
Simple Summary
Abstract
1. Introduction
2. Materials and Methods
2.1. Revisit of the Hünemohr Model
2.2. Study Design
3. Results
4. Discussion
5. Conclusions
Author Contributions
Funding
Institutional Review Board Statement
Informed Consent Statement
Data Availability Statement
Conflicts of Interest
References
- Paganetti, H. Range Uncertainties in Proton Therapy and the Role of Monte Carlo Simulations. Phys. Med. Biol. 2012, 57, R99. [Google Scholar] [CrossRef]
- Paganetti, H.; Beltran, C.; Both, S.; Dong, L.; Flanz, J.; Furutani, K.; Grassberger, C.; Grosshans, D.R.; Knopf, A.C.; Langendijk, J.A.; et al. Roadmap: Proton Therapy Physics and Biology. Phys. Med. Biol. 2021, 66, 05RM01. [Google Scholar] [CrossRef]
- Schneider, U.; Pedroni, E.; Lomax, A. The Calibration of CT Hounsfield Units for Radiotherapy Treatment Planning. Phys. Med. Biol. 1996, 41, 111–124. [Google Scholar] [CrossRef]
- Han, D.; Siebers, J.V.; Williamson, J.F. A Linear, Separable Two-Parameter Model for Dual Energy CT Imaging of Proton Stopping Power Computation. Med. Phys. 2016, 43, 600–612. [Google Scholar] [CrossRef] [PubMed]
- Taasti, V.T.; Petersen, J.B.B.; Muren, L.P.; Thygesen, J.; Hansen, D.C. A Robust Empirical Parametrization of Proton Stopping Power Using Dual Energy CT. Med. Phys. 2016, 43, 5547–5560. [Google Scholar] [CrossRef] [PubMed]
- Bär, E.; Lalonde, A.; Royle, G.; Lu, H.M.; Bouchard, H. The Potential of Dual-Energy CT to Reduce Proton Beam Range Uncertainties. Med. Phys. 2017, 44, 2332–2344. [Google Scholar] [CrossRef] [PubMed]
- Hünemohr, N.; Krauss, B.; Dinkel, J.; Gillmann, C.; Ackermann, B.; Jäkel, O.; Greilich, S. Ion Range Estimation by Using Dual Energy Computed Tomography. Z. Med. Phys. 2013, 23, 300–313. [Google Scholar] [CrossRef]
- Wohlfahrt, P.; Möhler, C.; Hietschold, V.; Menkel, S.; Greilich, S.; Krause, M.; Baumann, M.; Enghardt, W.; Richter, C. Clinical Implementation of Dual-Energy CT for Proton Treatment Planning on Pseudo-Monoenergetic CT Scans. Int. J. Radiat. Oncol. Biol. Phys. 2017, 97, 427–434. [Google Scholar] [CrossRef]
- Li, B.; Lee, H.C.; Duan, X.; Shen, C.; Zhou, L.; Jia, X.; Yang, M. Comprehensive Analysis of Proton Range Uncertainties Related to Stopping-Power-Ratio Estimation Using Dual-Energy CT Imaging. Phys. Med. Biol. 2017, 62, 7056–7074. [Google Scholar] [CrossRef]
- Bazalova, M.; Carrier, J.-F.; Beaulieu, L.; Verhaegen, F. Dual-Energy CT-Based Material Extraction for Tissue Segmentation in Monte Carlo Dose Calculations. Phys. Med. Biol. 2008, 53, 2439–2456. [Google Scholar] [CrossRef]
- Landry, G.; Seco, J.; Gaudreault, M.; Verhaegen, F. Deriving Effective Atomic Numbers from DECT Based on a Parameterization of the Ratio of High and Low Linear Attenuation Coefficients. Phys. Med. Biol. 2013, 58, 6851–6866. [Google Scholar] [CrossRef] [PubMed]
- Bethe, H. Zur Theorie Des Durchgangs Schneller Korpuskularstrahlen Durch Materie. Ann. Phys. 1930, 397, 325–400. [Google Scholar] [CrossRef]
- Yang, M.; Virshup, G.; Clayton, J.; Zhu, X.R.; Mohan, R.; Dong, L. Theoretical Variance Analysis of Single- and Dual-Energy Computed Tomography Methods for Calculating Proton Stopping Power Ratios of Biological Tissues. Phys. Med. Biol. 2010, 55, 1343–1362. [Google Scholar] [CrossRef]
- Almeida, I.P.; Schyns, L.E.J.R.; Öllers, M.C.; van Elmpt, W.; Parodi, K.; Landry, G.; Verhaegen, F. Dual-Energy CT Quantitative Imaging: A Comparison Study between Twin-Beam and Dual-Source CT Scanners. Med. Phys. 2017, 44, 171–179. [Google Scholar] [CrossRef] [PubMed]
- Zhang, S.; Han, D.; Politte, D.G.; Williamson, J.F.; O’Sullivan, J.A. Impact of Joint Statistical Dual-Energy CT Reconstruction of Proton Stopping Power Images: Comparison to Image- and Sinogram-Domain Material Decomposition Approaches. Med. Phys. 2018, 45, 2129–2142. [Google Scholar] [CrossRef]
- Zhang, S.; Han, D.; Williamson, J.F.; Zhao, T.; Politte, D.G.; Whiting, B.R.; O’Sullivan, J.A. Experimental Implementation of a Joint Statistical Image Reconstruction Method for Proton Stopping Power Mapping from Dual-Energy CT Data. Med. Phys. 2019, 46, 273–285. [Google Scholar] [CrossRef]
- Centers for Disease Control and Prevention. CDC Data Table of Infant Head Circumference-for-Age Charts; Center Disease Control and Prevention: Atlanta, GA, USA, 2014; pp. 3–4. [Google Scholar]
- Peters, N.; Wohlfahrt, P.; Hofmann, C.; Möhler, C.; Menkel, S.; Tschiche, M.; Krause, M.; Troost, E.G.C.; Enghardt, W.; Richter, C. Reduction of Clinical Safety Margins in Proton Therapy Enabled by the Clinical Implementation of Dual-Energy CT for Direct Stopping-Power Prediction. Radiother. Oncol. 2022, 166, 71–78. [Google Scholar] [CrossRef]
- Tanaka, S.; Noto, Y.; Utsunomiya, S.; Yoshimura, T.; Matsuura, T.; Saito, M. Proton Dose Calculation Based on Converting Dual-Energy CT Data to Stopping Power Ratio (DEEDZ-SPR): A Beam-Hardening Assessment. Phys. Med. Biol. 2020, 65, 235046. [Google Scholar] [CrossRef]
- Alvarez, R.E.; Macovski, A. Energy-Selective Reconstructions in X-Ray Computerized Tomography. Phys. Med. Biol. 1976, 21, 733–744. [Google Scholar] [CrossRef]
- Hünemohr, N.; Krauss, B.; Tremmel, C.; Ackermann, B.; Jäkel, O.; Greilich, S. Experimental Verification of Ion Stopping Power Prediction from Dual Energy CT Data in Tissue Surrogates. Phys. Med. Biol. 2014, 59, 83–96. [Google Scholar] [CrossRef]
- ICRU. ICRU Tissue Substitutes in Radiation Dosimetry and Measurement; International Commission on Radiation Units and Measurements: Bethesda, MD, USA, 1989; ISBN 44. [Google Scholar]
- Evans, J.D.; Whiting, B.R.; Politte, D.G.; O’Sullivan, J.A.; Klahr, P.F.; Williamson, J.F. Experimental Implementation of a Polyenergetic Statistical Reconstruction Algorithm for a Commercial Fan-Beam CT Scanner. Phys. Medica 2013, 29, 500–512. [Google Scholar] [CrossRef] [PubMed]
- Yang, M.; Wohlfahrt, P.; Shen, C.; Bouchard, H. Dual- and Multi-Energy CT for Particle Stopping-Power Estimation: Current State, Challenges and Potential. Phys. Med. Biol. 2023, 68, 04TR01. [Google Scholar] [CrossRef] [PubMed]


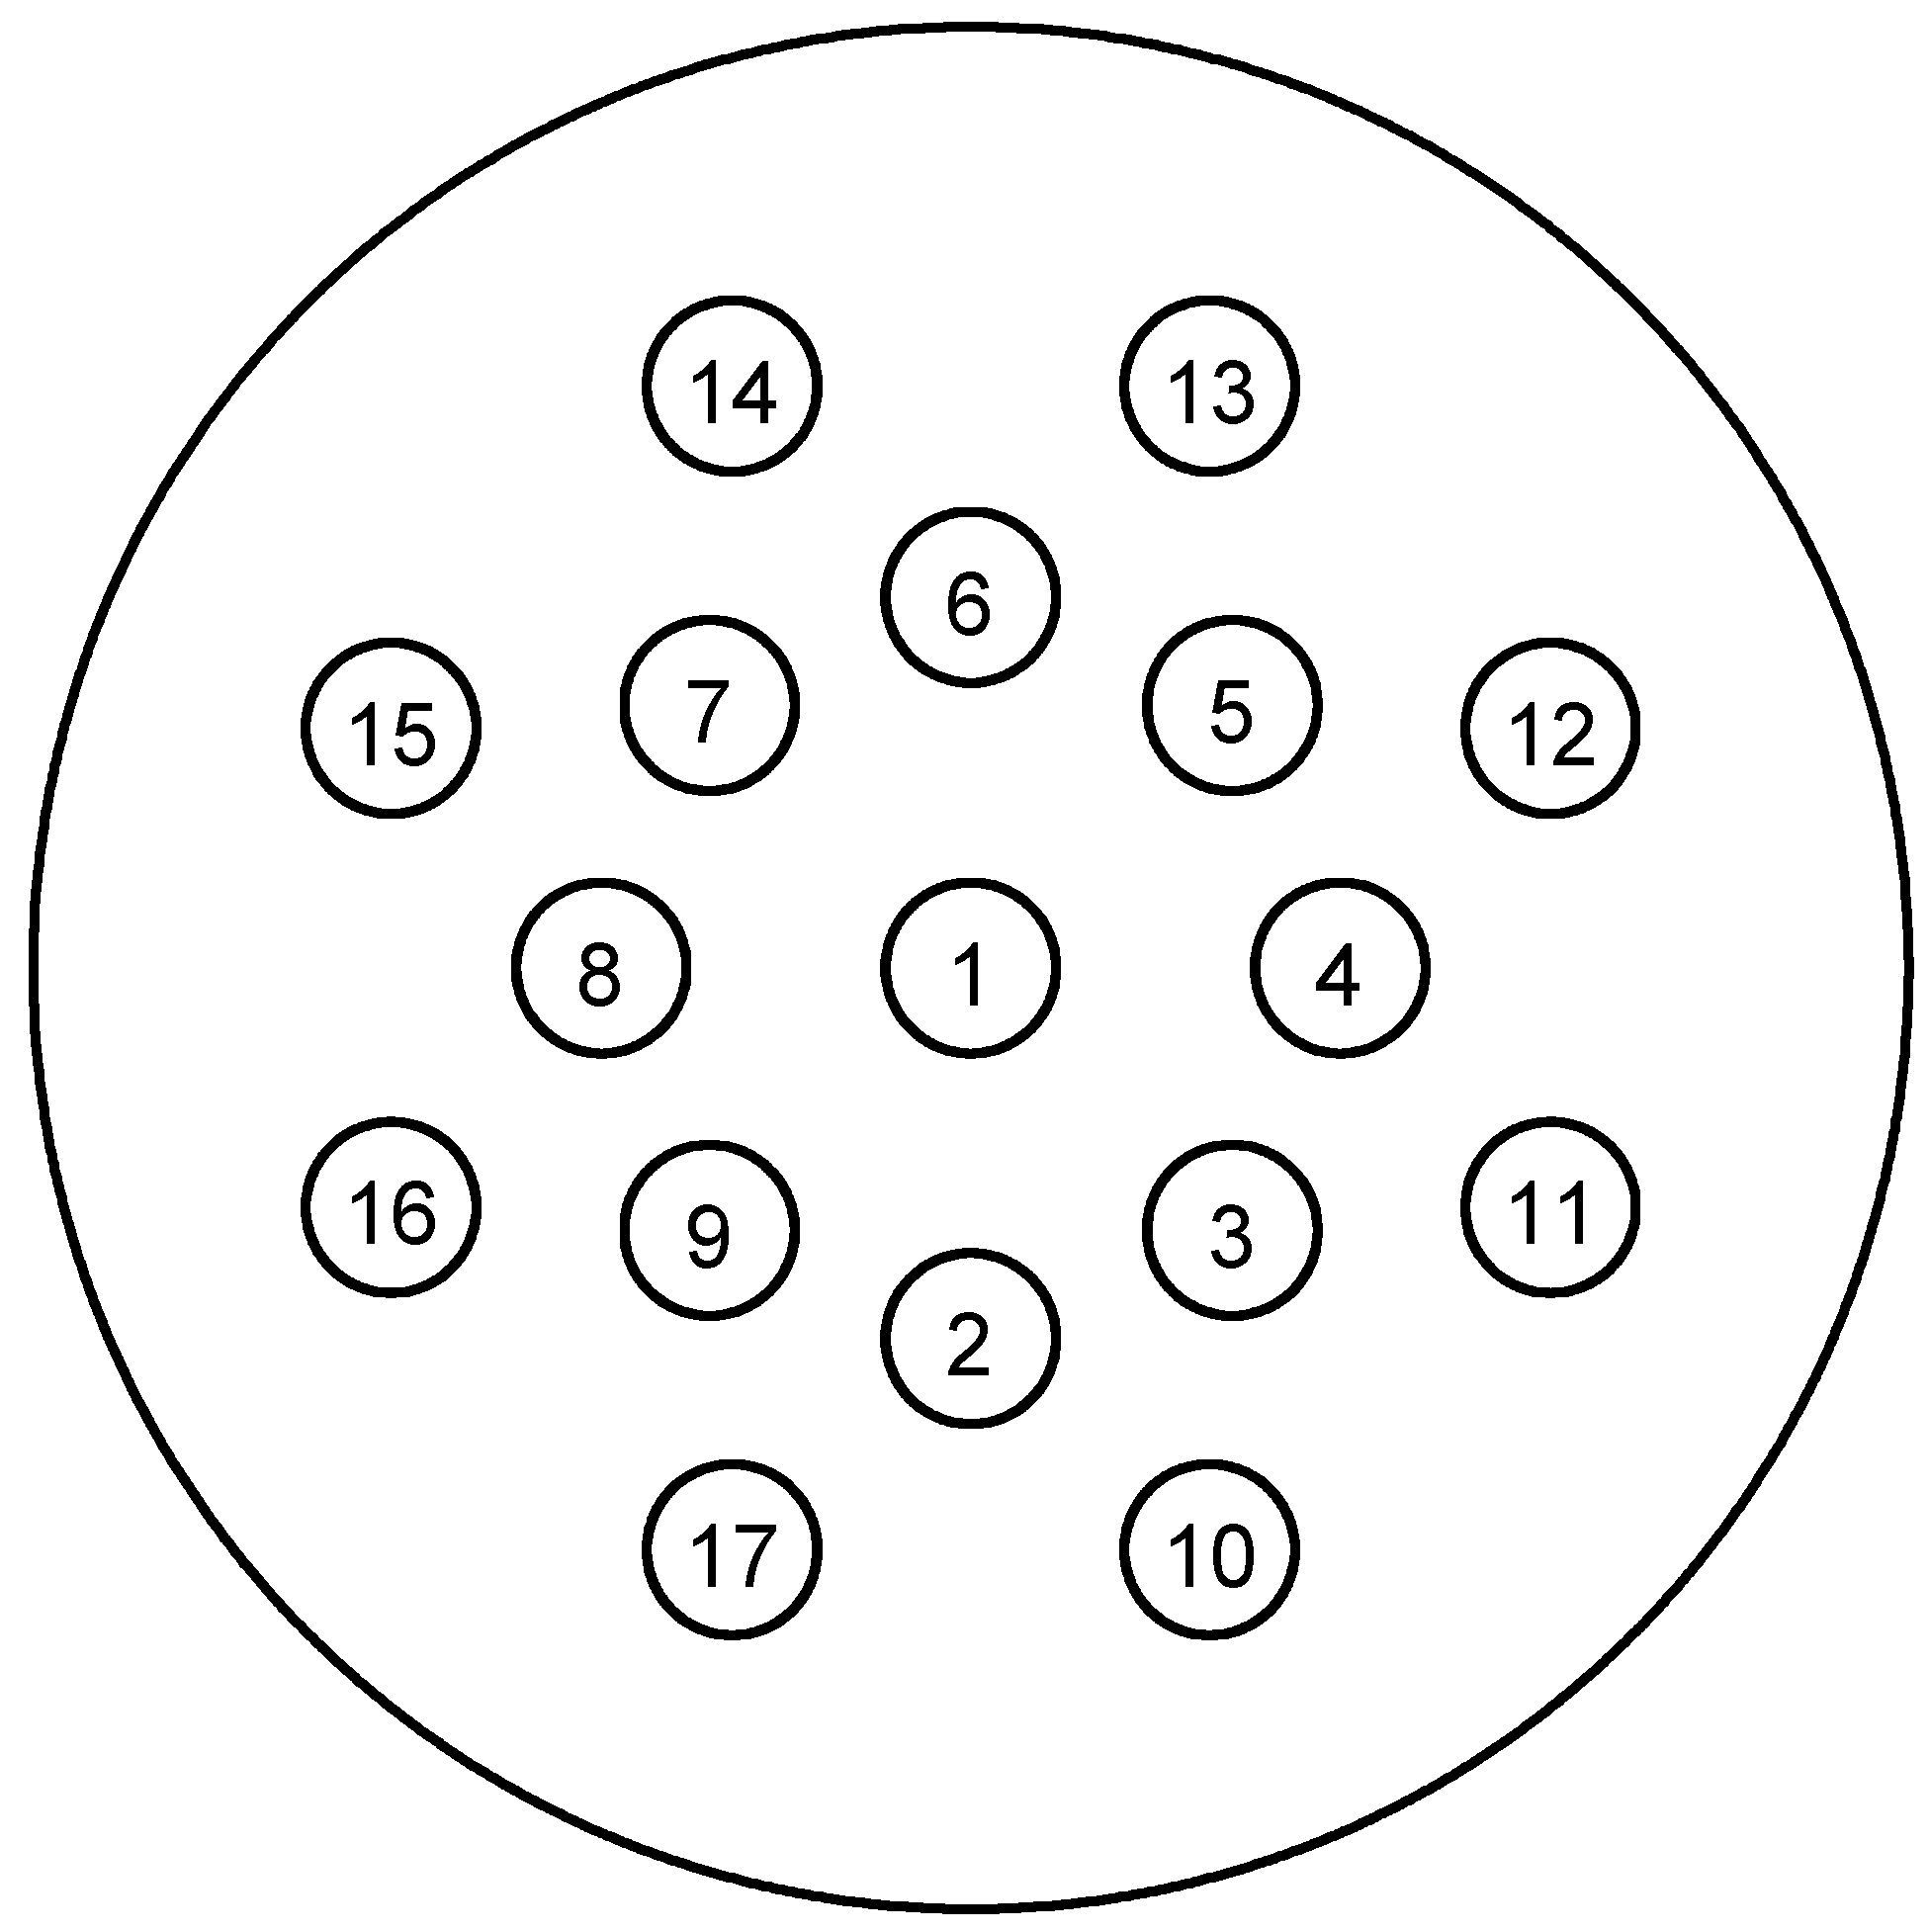
| Inserts | Gammex | Test Phantom | Test Phantom |
|---|---|---|---|
| 1 | CT solid water | Adipose | Brain |
| 2 | CT solid water | Blood | Cell |
| 3 | CB2 50% CaCO3 | Breast | Lung (deflated) |
| 4 | AP6 adipose | Eye lens | GI tract |
| 5 | SR2 brain | Heart | Kidney |
| 6 | SB3 cortical bone | Liver 2 | Lymph |
| 7 | BR12 breast | Muscle | Ovary |
| 8 | Water | Pancreas | Spleen |
| 9 | CB2 30% CaCO3 | Red marrow | Thyroid |
| 10 | CT solid water | Skin | Red marrow |
| 11 | IB3 inner bone | Femur | Yellow marrow |
| 12 | CT solid water | Mandible | Cartilage |
| 13 | LN300 lung | Sacrum | Cortical bone |
| 14 | CT solid water | Testis | Cranium |
| 15 | LN450 lung | Spongiosa | Humerus |
| 16 | B200 mineral bone | Vertebral D6/L3 | Ribs (2nd, 6th) |
| 17 | LV1 liver | Vertebral C4 | Ribs (10th) |
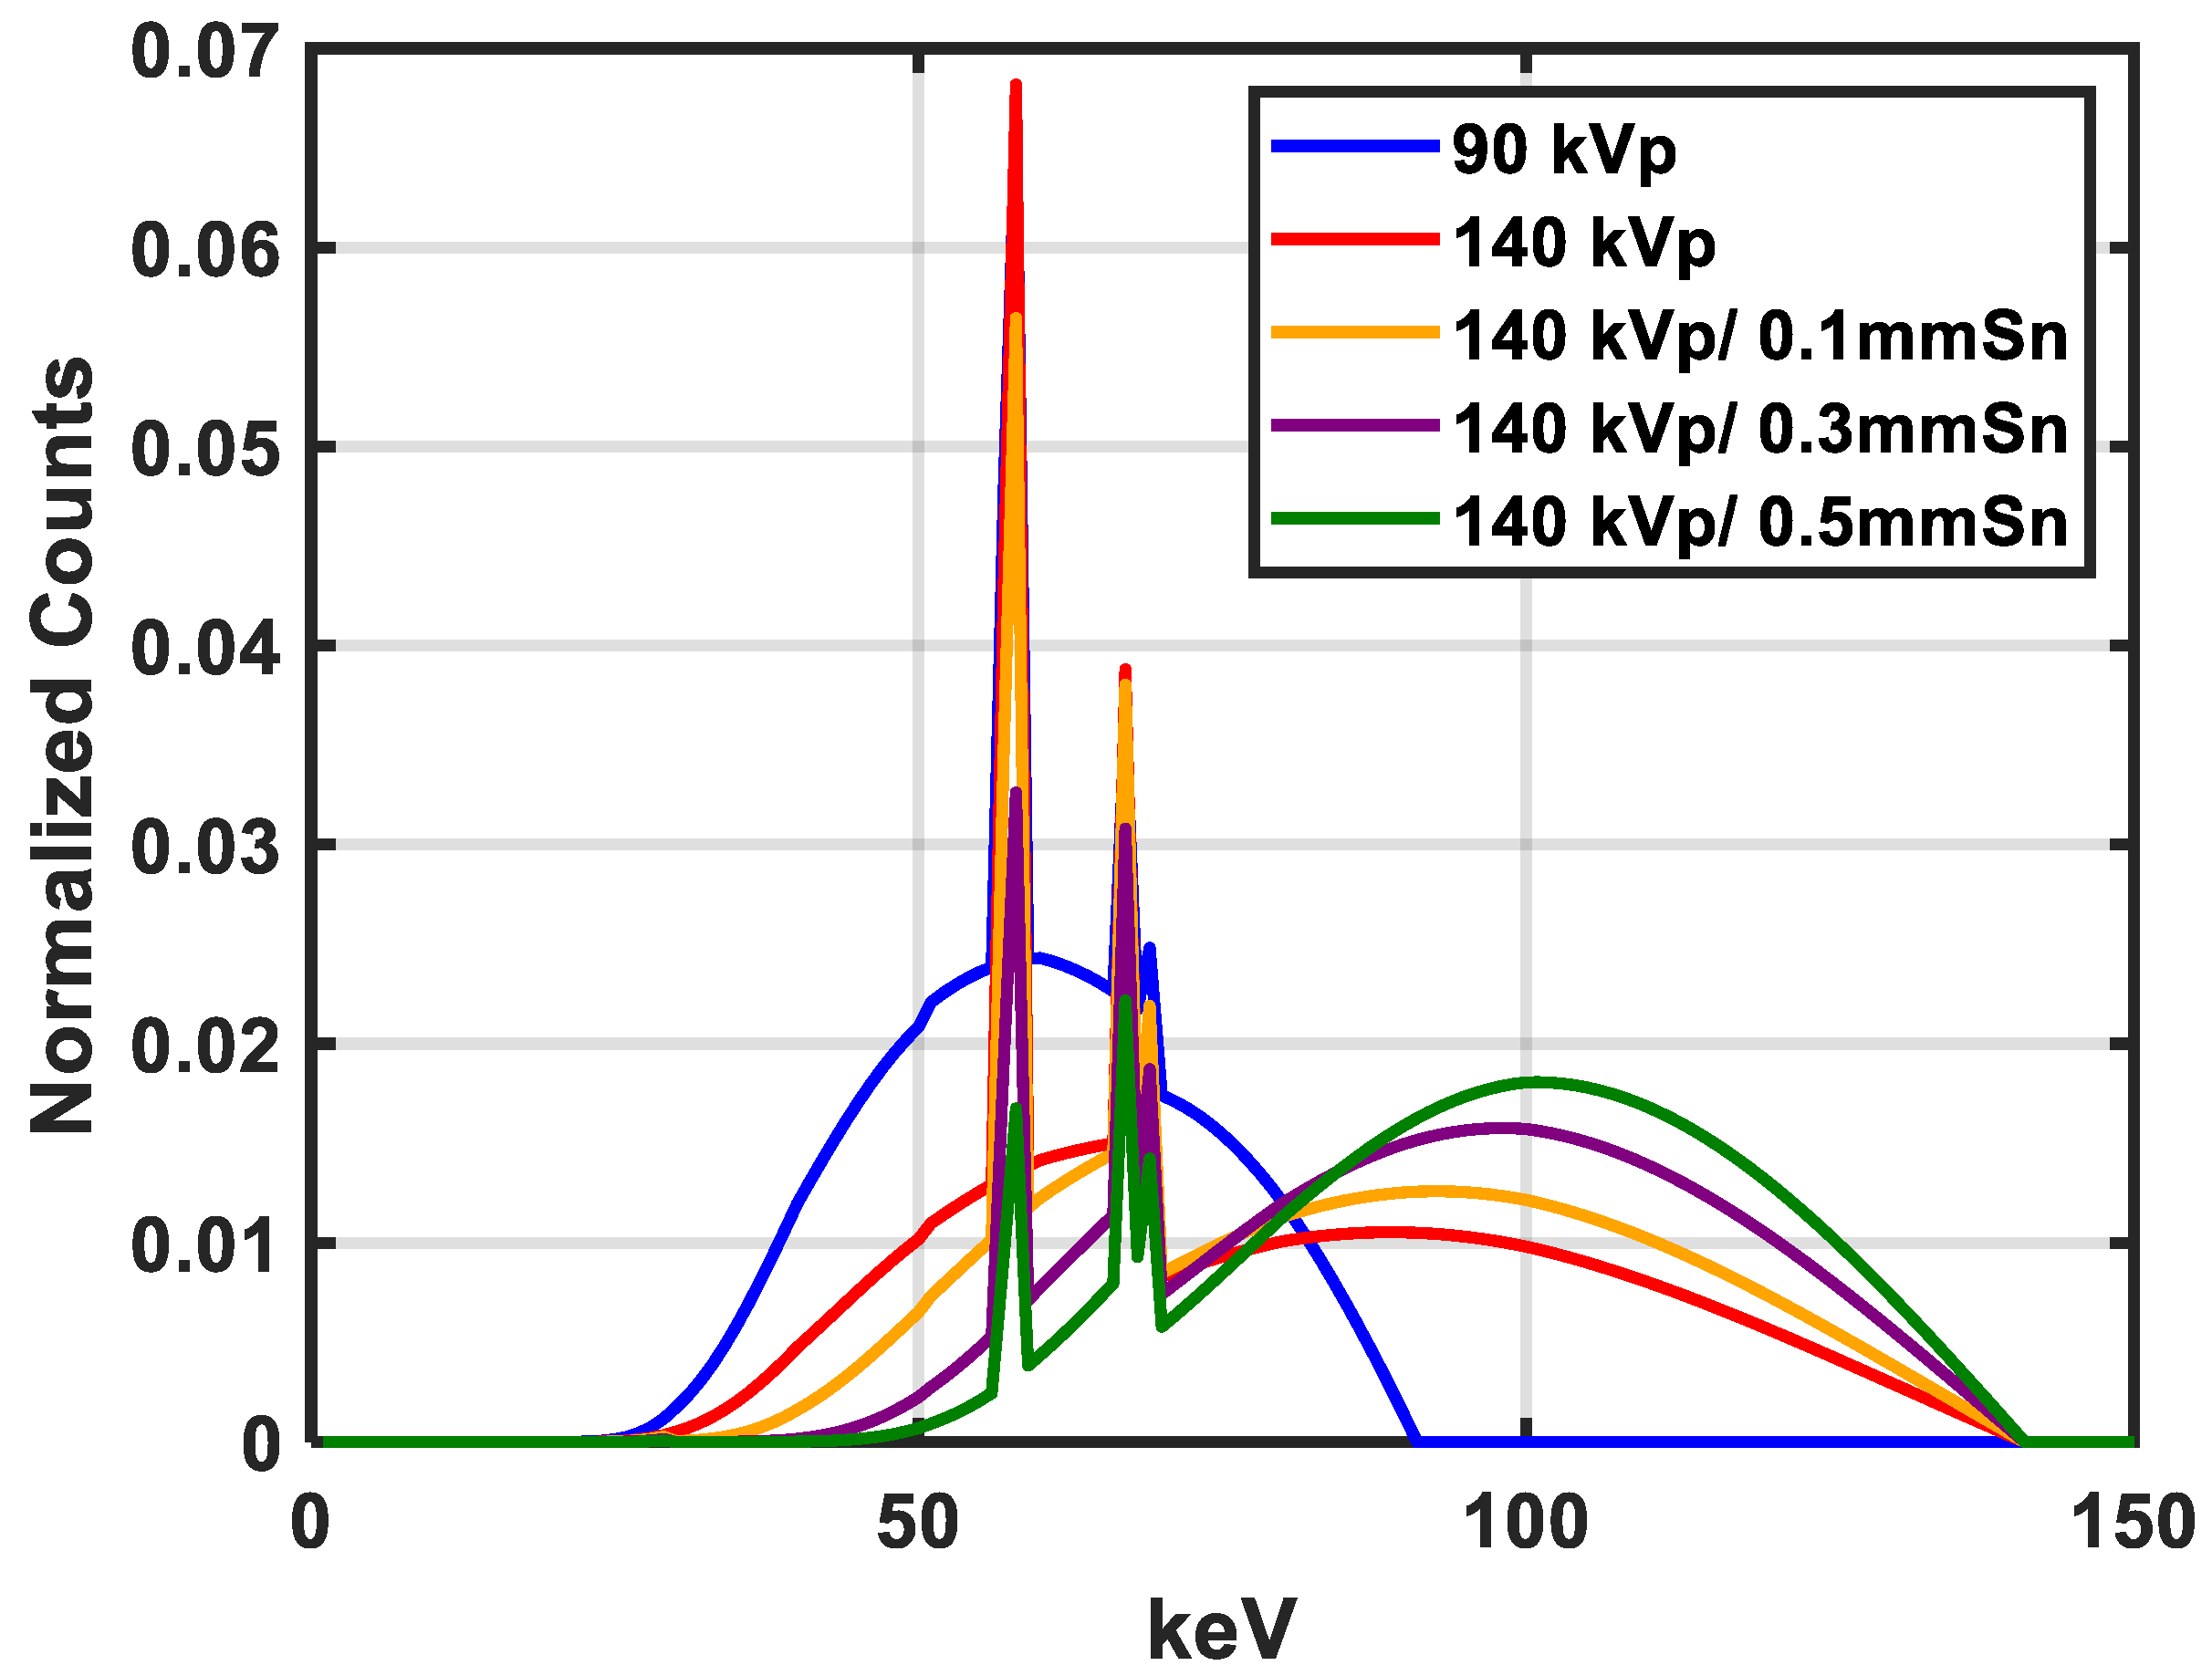
| Spectra Pair | kVp (Sn Filter Thickness) |
|---|---|
| 1 | 90/140 (0 mm) |
| 2 | 90/140 (0.1 mm) |
| 3 | 90/140 (0.3 mm) |
| 4 | 90/140 (0.5 mm) |
| Spectrum (kVp) | keV |
|---|---|
| 90 | 56.8 |
| 140 | 71.6 |
| 140 (0.1 mm Sn) | 83.6 |
| 140 (0.3 mm Sn) | 91.6 |
| 140 (0.5 mm Sn) | 97.1 |
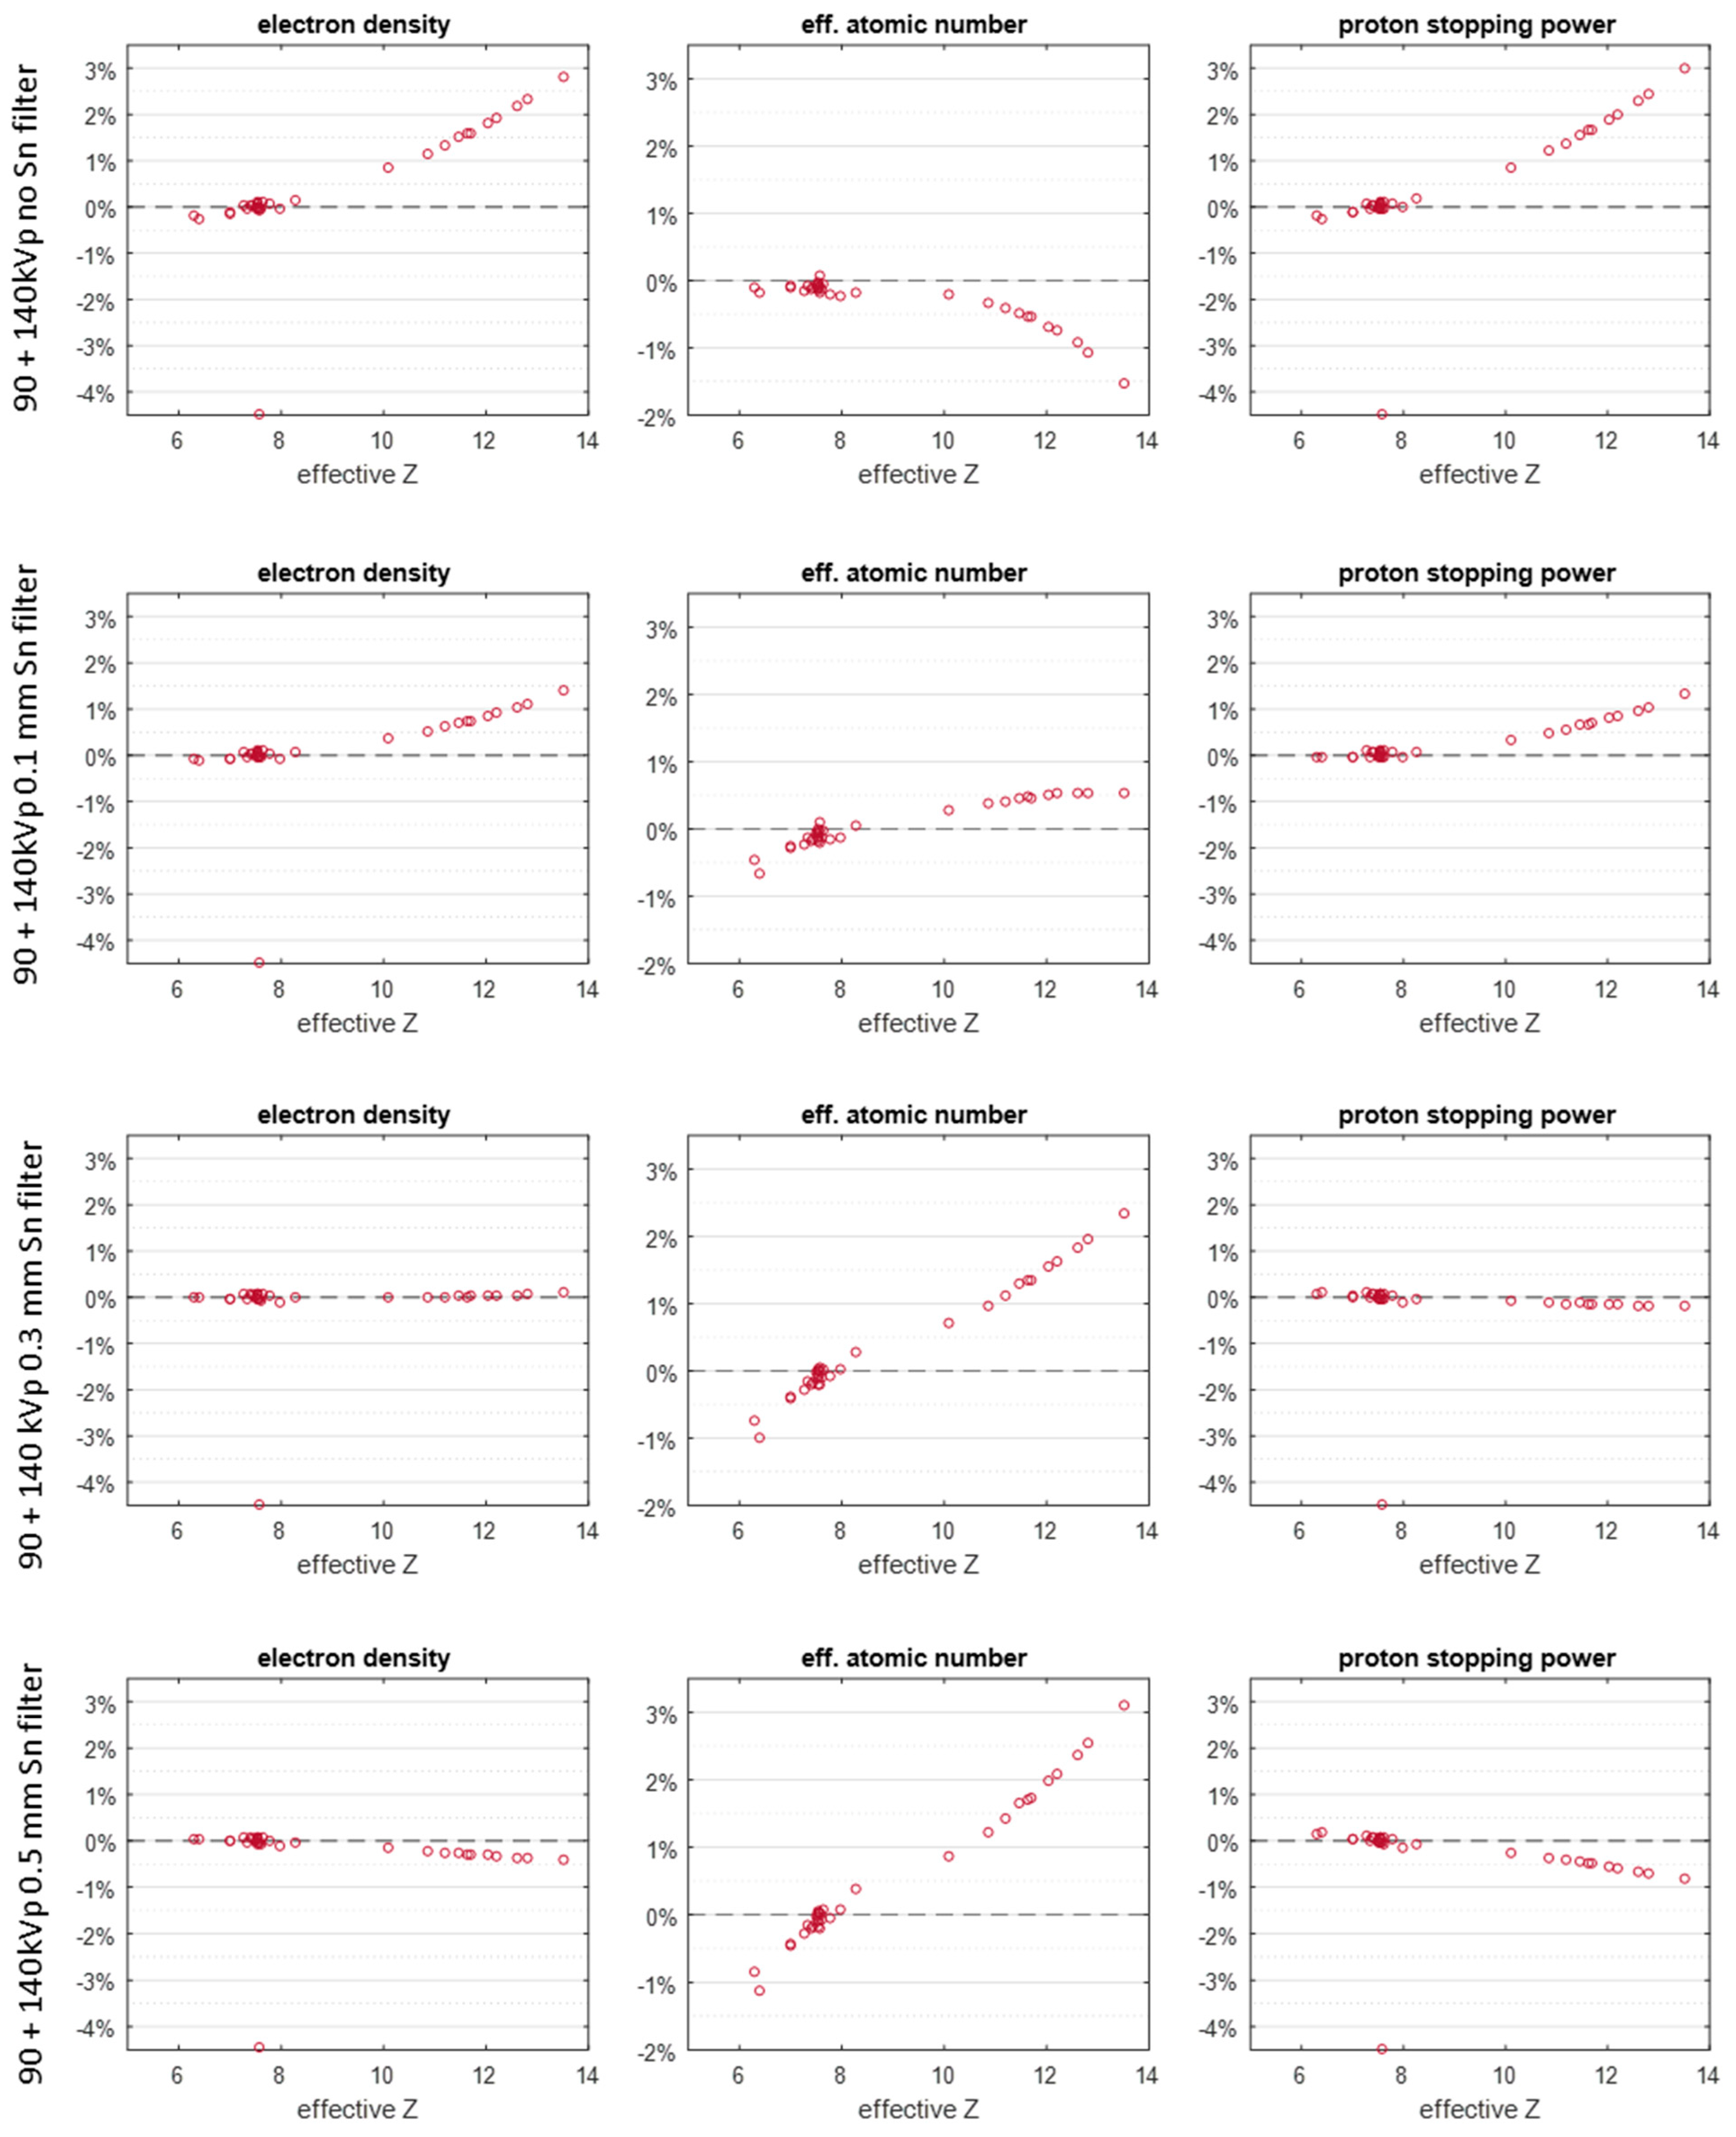
| kVp (Sn Filter Thickness) | RMSAE (%) |
|---|---|
| 90 + 140 kVp (0 mm) | 1.35 |
| 90 + 140 kVp (0.1 mm) | 0.62 |
| 90 + 140 kVp (0.3 mm) | 0.12 |
| 90 + 140 kVp (0.5 mm) | 0.4 |
Disclaimer/Publisher’s Note: The statements, opinions and data contained in all publications are solely those of the individual author(s) and contributor(s) and not of MDPI and/or the editor(s). MDPI and/or the editor(s) disclaim responsibility for any injury to people or property resulting from any ideas, methods, instructions or products referred to in the content. |
© 2024 by the authors. Licensee MDPI, Basel, Switzerland. This article is an open access article distributed under the terms and conditions of the Creative Commons Attribution (CC BY) license (https://creativecommons.org/licenses/by/4.0/).
Share and Cite
Han, D.; Zhang, S.; Chen, S.; Hooshangnejad, H.; Yu, F.; Ding, K.; Lin, H. Enhancement of Stopping Power Ratio (SPR) Estimation Accuracy through Image-Domain Dual-Energy Computer Tomography for Pencil Beam Scanning System: A Simulation Study. Cancers 2024, 16, 467. https://doi.org/10.3390/cancers16020467
Han D, Zhang S, Chen S, Hooshangnejad H, Yu F, Ding K, Lin H. Enhancement of Stopping Power Ratio (SPR) Estimation Accuracy through Image-Domain Dual-Energy Computer Tomography for Pencil Beam Scanning System: A Simulation Study. Cancers. 2024; 16(2):467. https://doi.org/10.3390/cancers16020467
Chicago/Turabian StyleHan, Dong, Shuangyue Zhang, Sixia Chen, Hamed Hooshangnejad, Francis Yu, Kai Ding, and Haibo Lin. 2024. "Enhancement of Stopping Power Ratio (SPR) Estimation Accuracy through Image-Domain Dual-Energy Computer Tomography for Pencil Beam Scanning System: A Simulation Study" Cancers 16, no. 2: 467. https://doi.org/10.3390/cancers16020467
APA StyleHan, D., Zhang, S., Chen, S., Hooshangnejad, H., Yu, F., Ding, K., & Lin, H. (2024). Enhancement of Stopping Power Ratio (SPR) Estimation Accuracy through Image-Domain Dual-Energy Computer Tomography for Pencil Beam Scanning System: A Simulation Study. Cancers, 16(2), 467. https://doi.org/10.3390/cancers16020467