
Quantitative Biomarkers Derived from a Novel, Contrast-Free Ultrasound, High-Definition Microvessel Imaging for Differentiating Choroidal Tumors

 , , , and
Abstract
Simple Summary
Abstract
1. Introduction
2. Materials and Methods
2.1. Ethical Statement
2.2. Participants
2.3. Clinical Multimodal Imaging
2.4. High-Definition Microvasculature Imaging and Vessel Extraction
2.5. HDMI Quantification and Quantitative Biomarkers
2.6. Statistical Analysis Methods
3. Results
3.1. Clinical Multimodal Ophthalmic Imaging Features
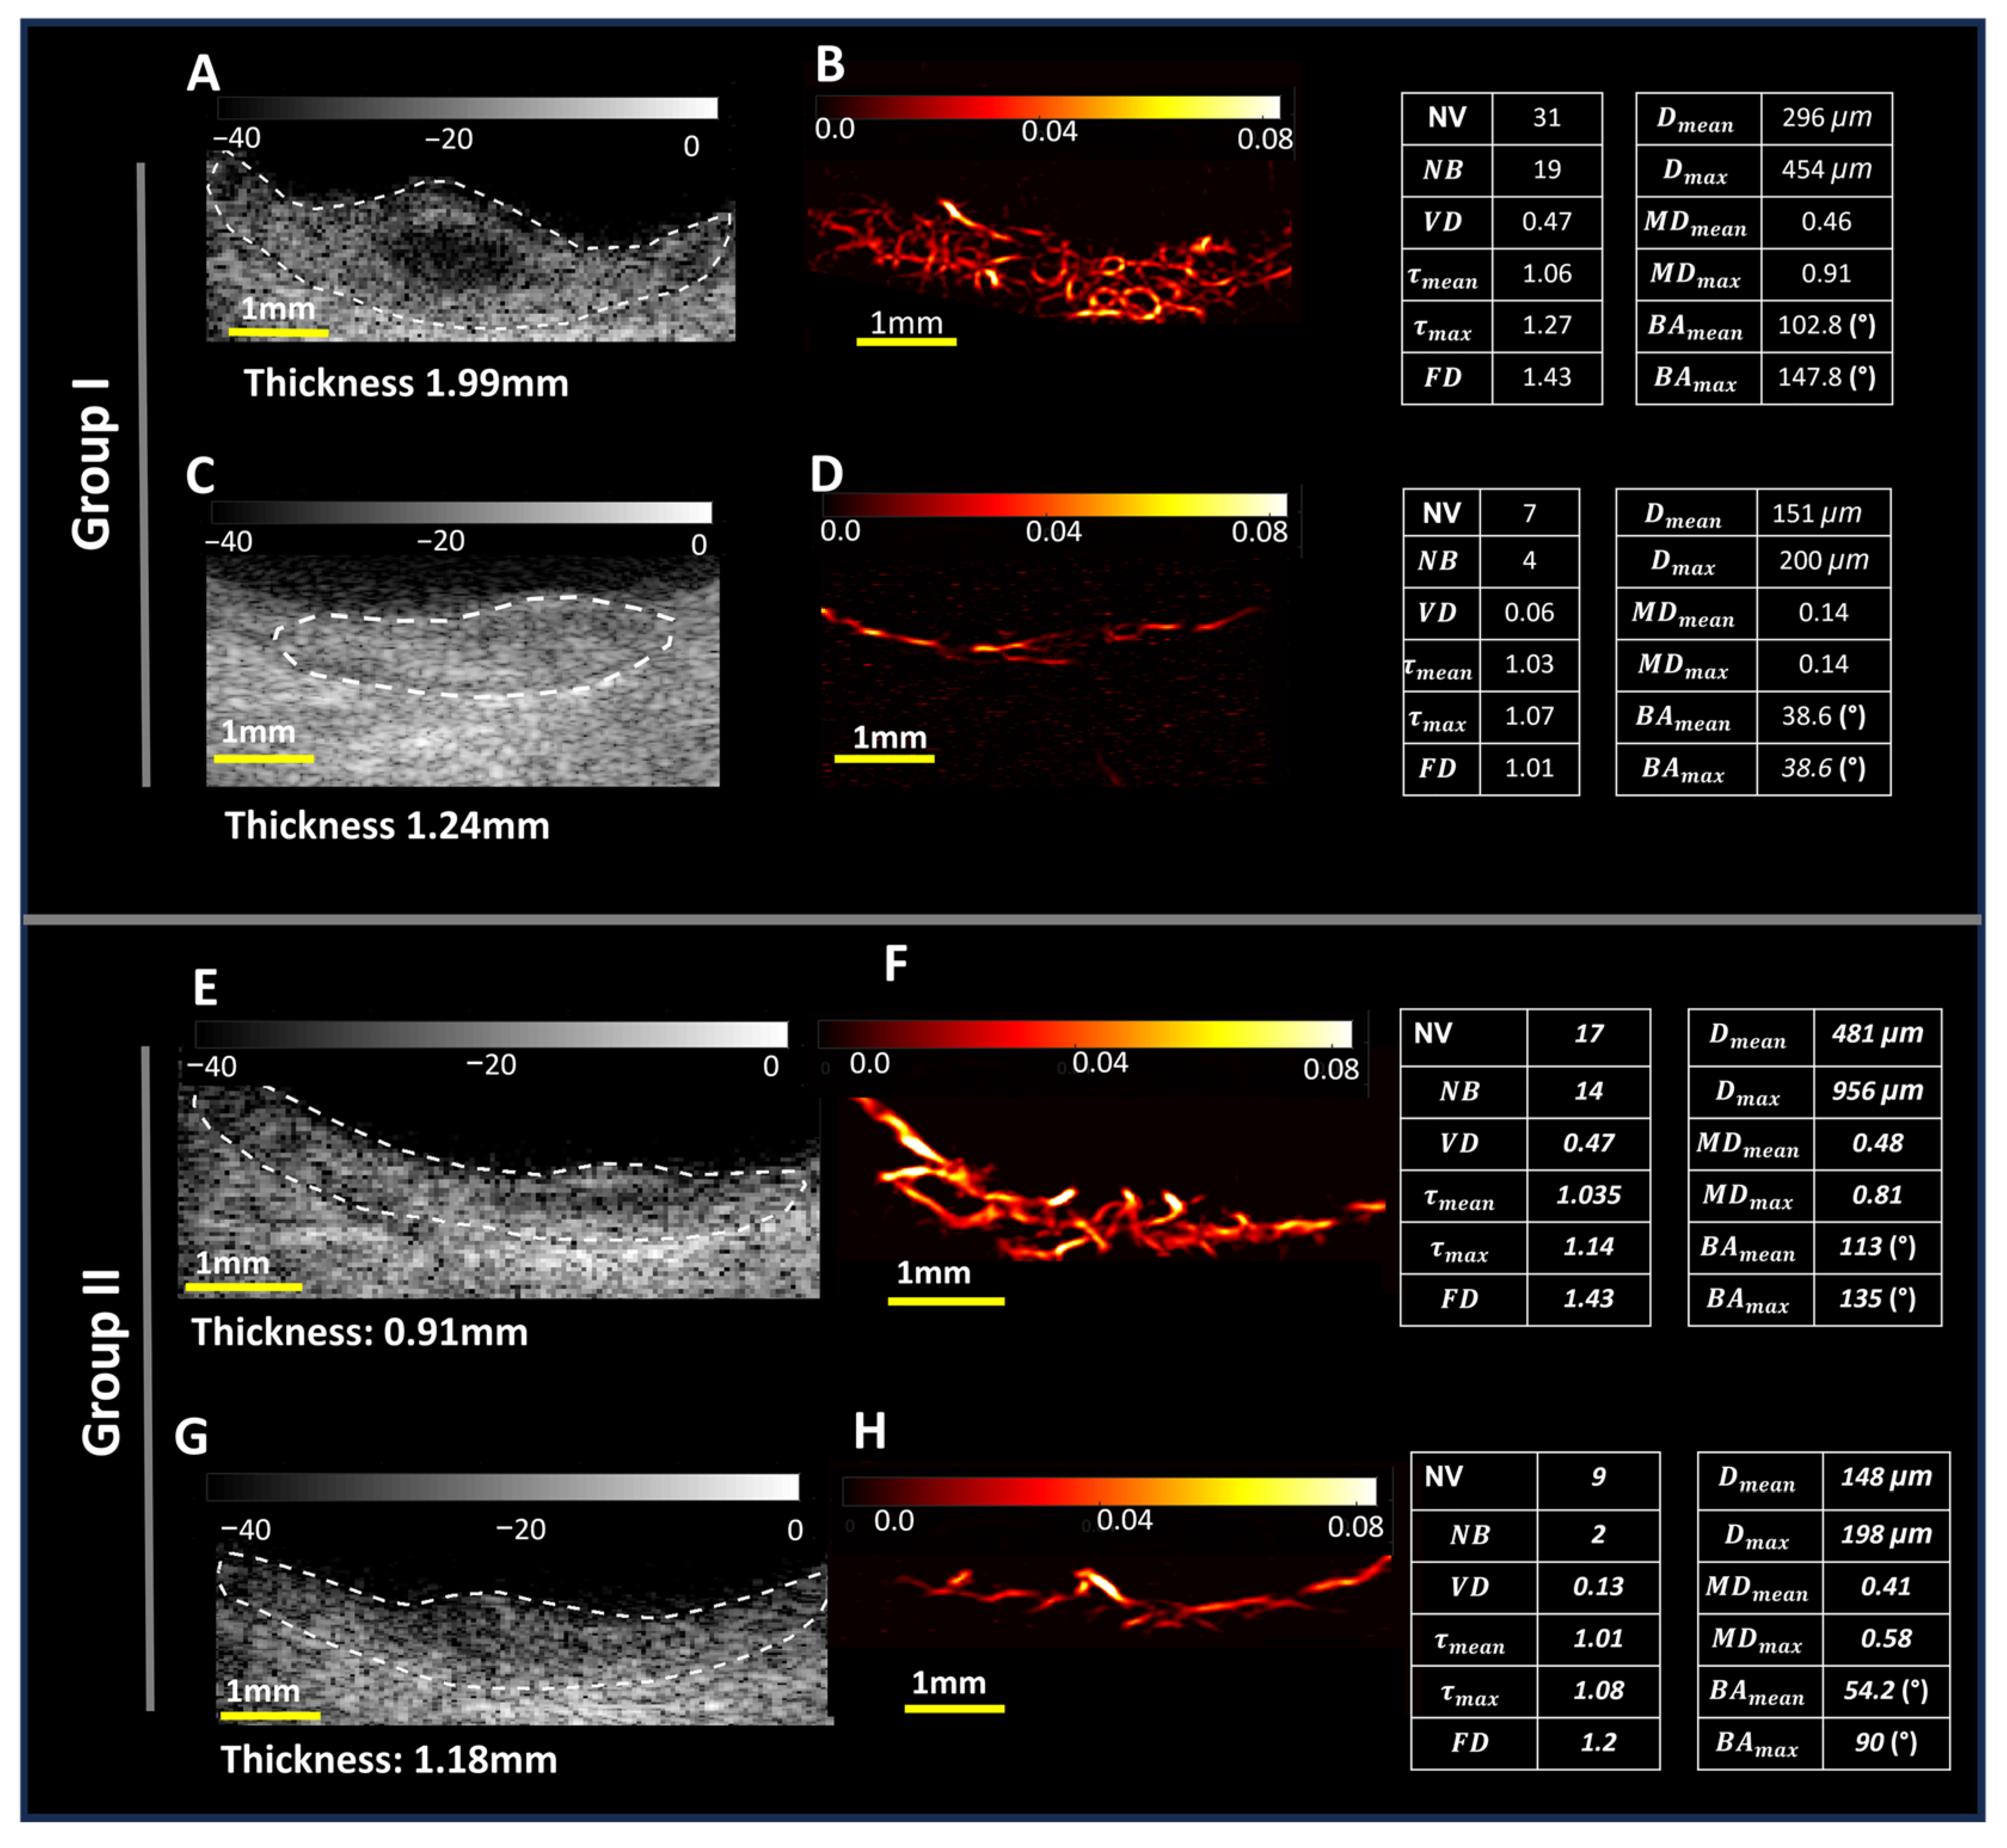
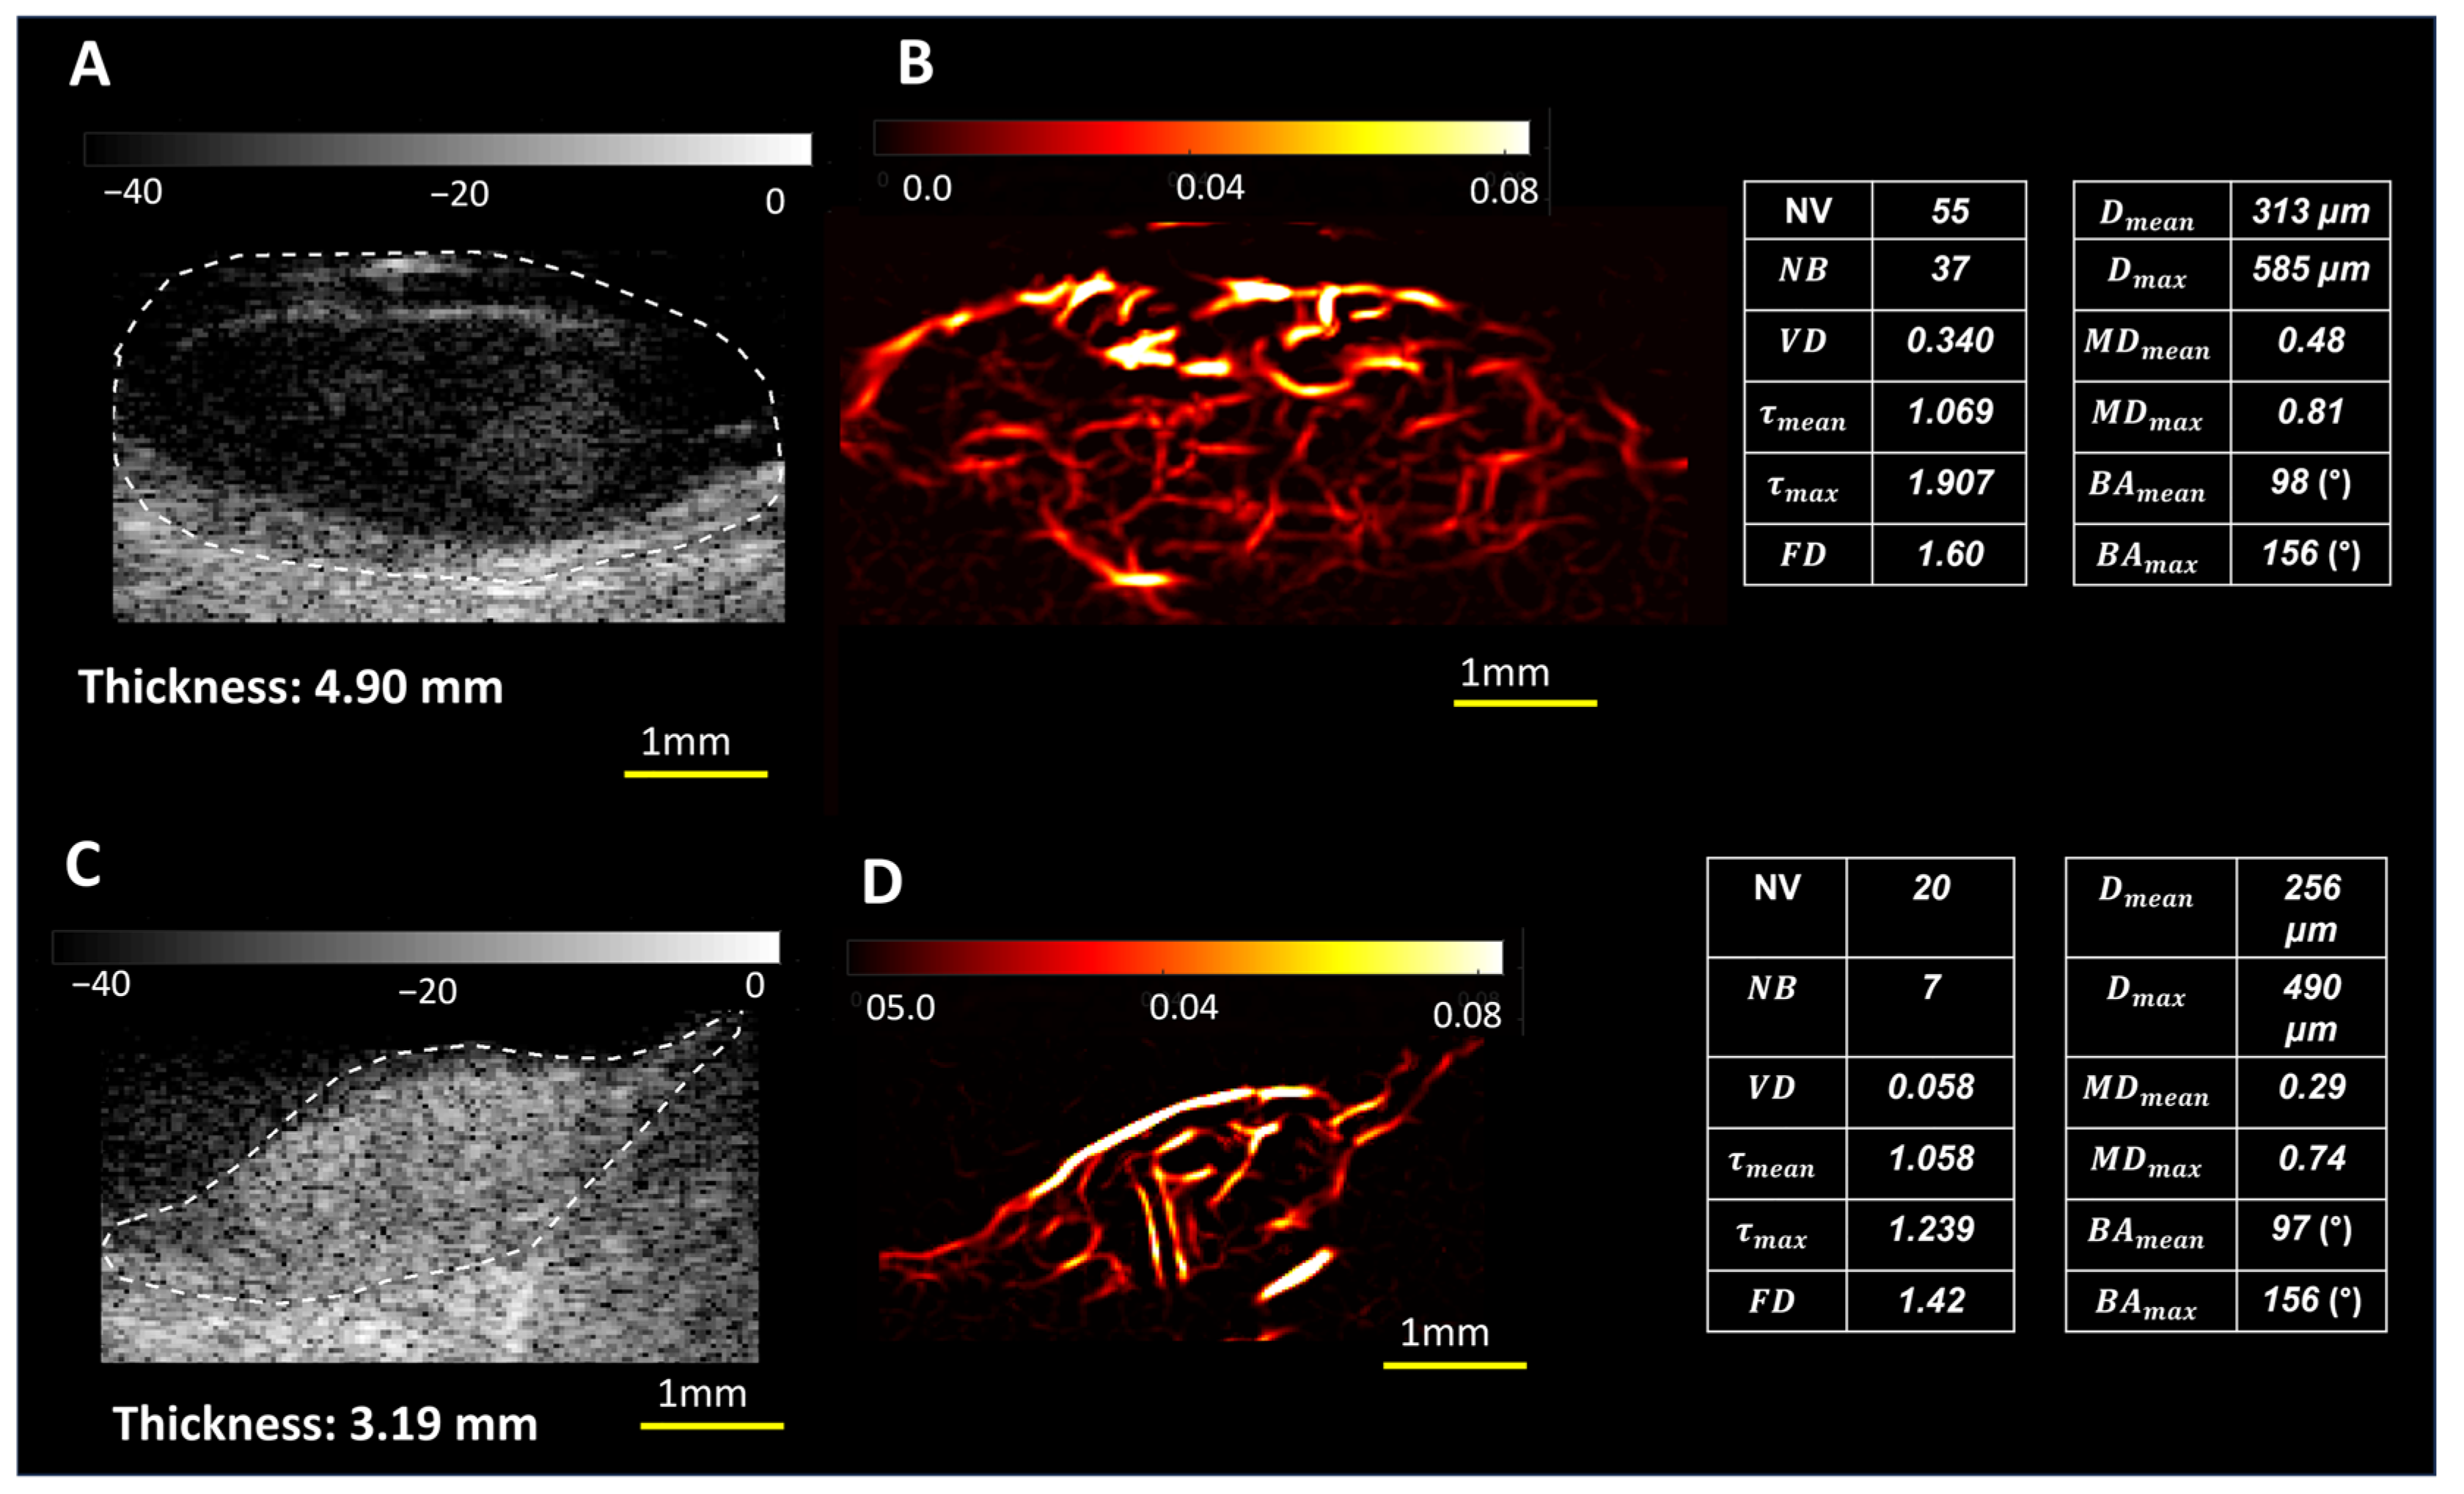
3.2. Microvessel Visualization and Quantification
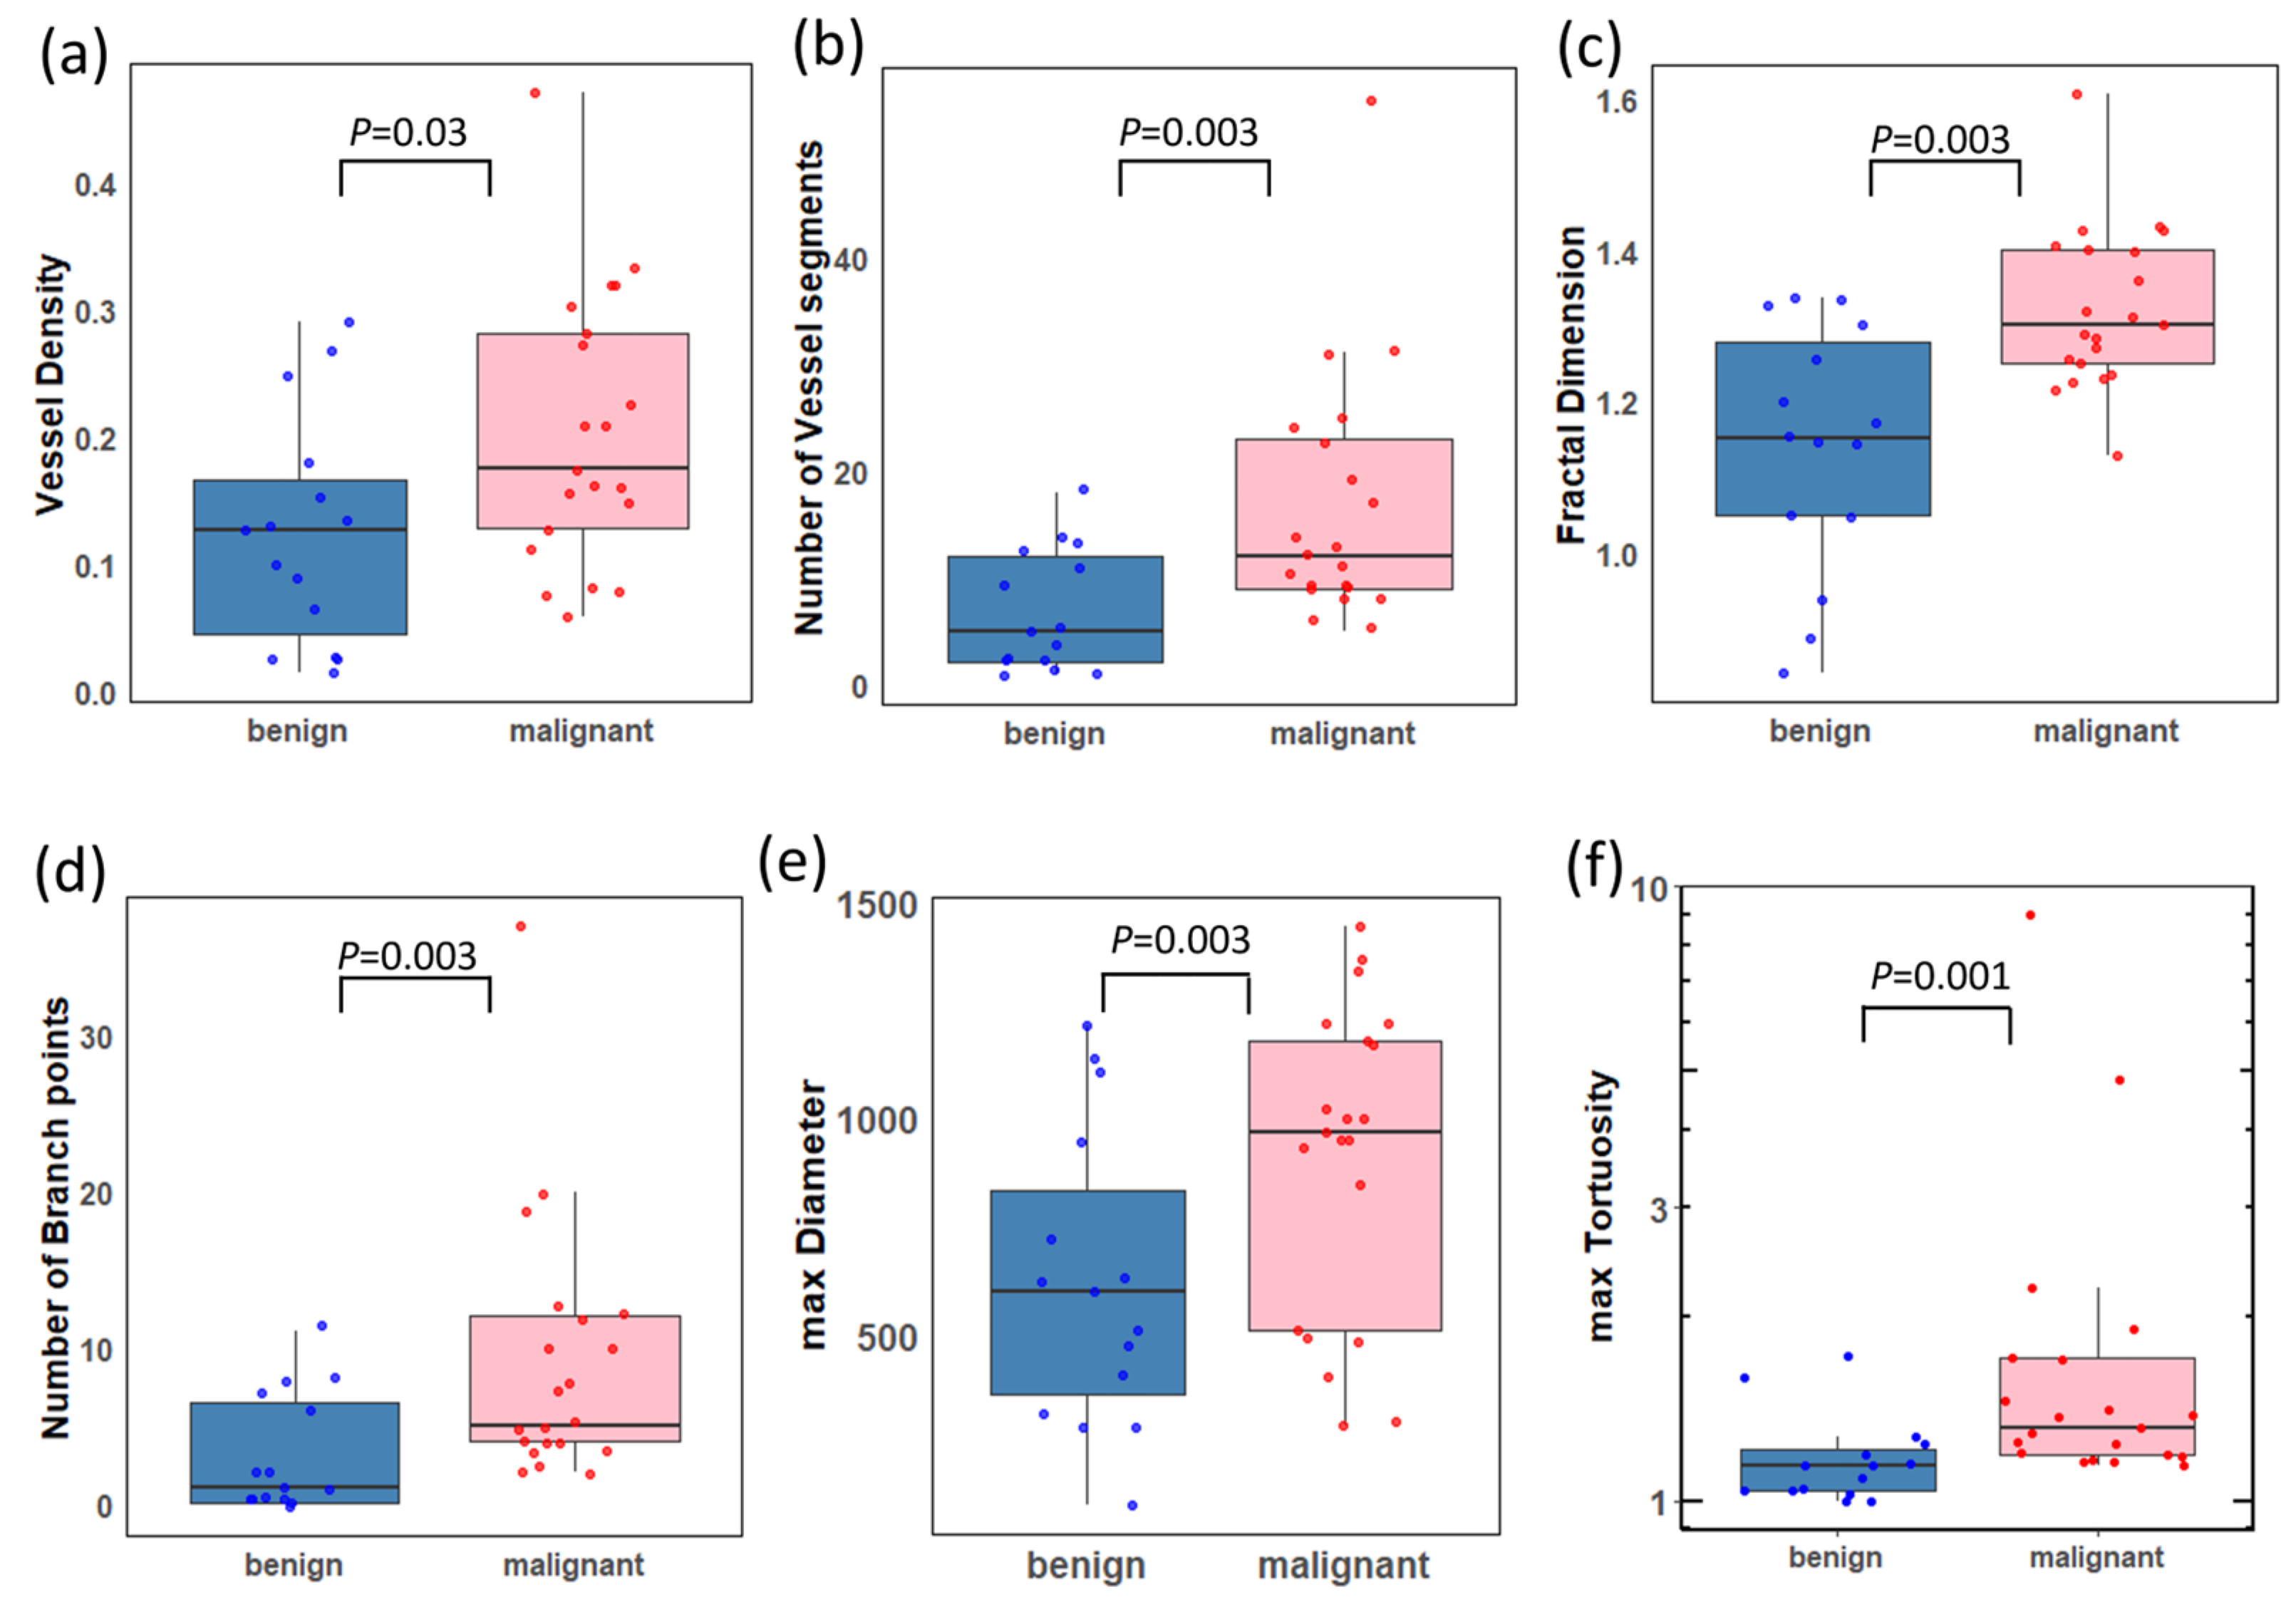
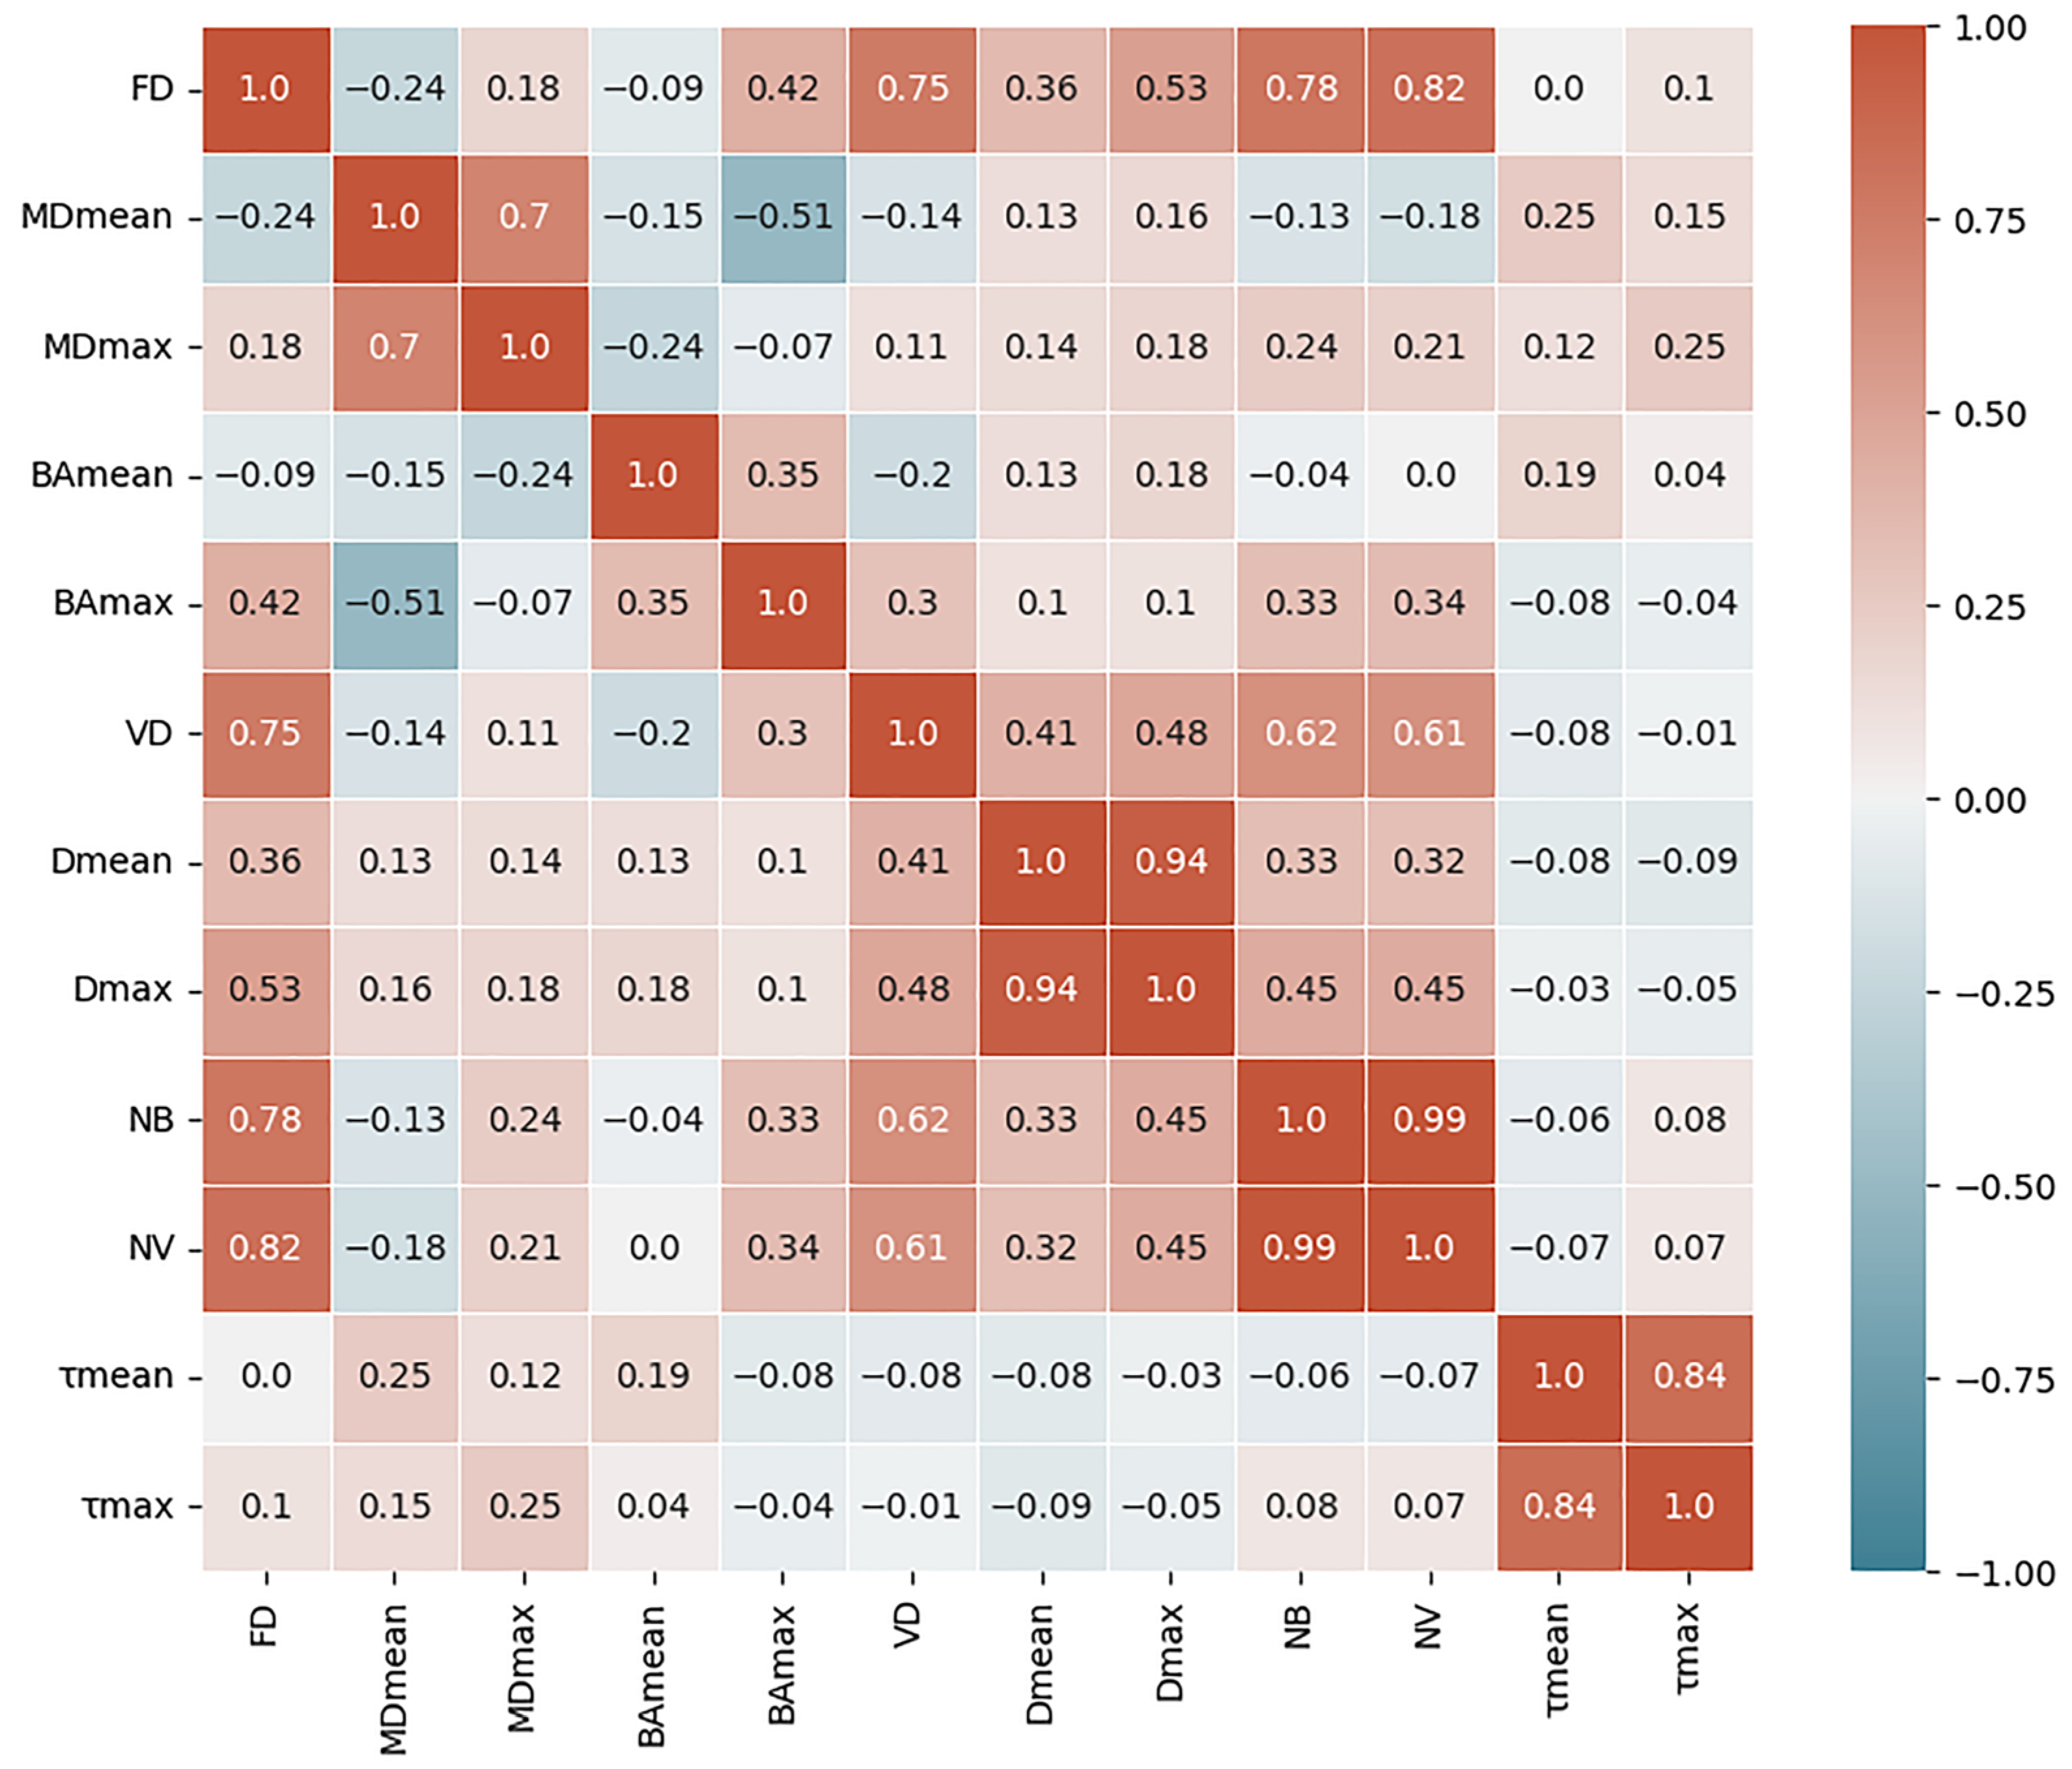
3.3. Statistical Analysis
4. Discussion
5. Conclusions
6. Patents
Author Contributions
Funding
Institutional Review Board Statement
Informed Consent Statement
Data Availability Statement
Acknowledgments
Conflicts of Interest
References
- Singh, M.; Durairaj, P.; Yeung, J. Uveal melanoma: A review of the literature. Oncol. Ther. 2018, 6, 87–104. [Google Scholar] [CrossRef]
- Chien, J.L.; Sioufi, K.; Surakiatchanukul, T.; Shields, J.A.; Shields, C.L. Choroidal nevus: A review of prevalence, features, genetics, risks, and outcomes. Curr. Opin. Ophthalmol. 2017, 28, 228–237. [Google Scholar] [CrossRef]
- Turgut, B.; Çatak, O.; Demir, T. Discriminator and Diagnostic Features for Choroidal Malignant Melanoma and Choroidal Nevus. US Ophthalmic Rev. 2018, 11, 47. [Google Scholar] [CrossRef]
- Frizziero, L.; Midena, E.; Trainiti, S.; Londei, D.; Bonaldi, L.; Bini, S.; Parrozzani, R. Uveal melanoma biopsy: A review. Cancers 2019, 11, 1075. [Google Scholar] [CrossRef] [PubMed]
- Kaliki, S.; Shields, C.L. Uveal melanoma: Relatively rare but deadly cancer. Eye 2017, 31, 241–257. [Google Scholar] [CrossRef]
- Dalvin, L.A.; Shields, C.L.; Ancona-Lezama, D.A.; Michael, D.Y.; Di Nicola, M.; Williams Jr, B.K.; Lucio-Alvarez, J.A.; Ang, S.M.; Maloney, S.M.; Welch, R.J. Combination of multimodal imaging features predictive of choroidal nevus transformation into melanoma. Br. J. Ophthalmol. 2019, 103, 1441–1447. [Google Scholar] [PubMed]
- Folberg, R.; Mehaffey, M.; Gardner, L.M.; Meyer, M.; Rummelt, V.; Pe’er, J. The microcirculation of choroidal and ciliary body melanomas. Eye 1997, 11, 227–238. [Google Scholar] [CrossRef]
- Brouwer, N.J.; Gezgin, G.; Wierenga, A.P.; Bronkhorst, I.H.; Marinkovic, M.; Luyten, G.P.; Versluis, M.; Kroes, W.G.; van der Velden, P.A.; Verdijk, R.M. Tumour angiogenesis in uveal melanoma is related to genetic evolution. Cancers 2019, 11, 979. [Google Scholar] [CrossRef]
- Nagy, J.; Chang, S.H.; Dvorak, A.M.; Dvorak, H.F. Why are tumour blood vessels abnormal and why is it important to know? Br. J. Cancer 2009, 100, 865–869. [Google Scholar] [CrossRef] [PubMed]
- Cennamo, G.; Rosa, N.; Vallone, G.; Smaltino, F. First experience with a new echographic contrast agent. Br. J. Ophthalmol. 1994, 78, 823–826. [Google Scholar] [CrossRef] [PubMed][Green Version]
- Kaak, C.; Kakkassery, V.; Scheef, B.O.; Zschoche, M.; Rommel, F.; Hildebrandt, G.; Emmert, S.; Junghanß, C.; Guthoff, R.F.; Jünemann, A.M. Evaluation of choroidal melanoma vascularization by color Doppler flow imaging: An option for follow-up tumor control assessment after Cyberknife®? Medicina 2021, 57, 553. [Google Scholar] [CrossRef] [PubMed]
- Li, D.; Wang, Z.; Chen, W.; Zhao, Q.; Li, Y.; Cui, R.; Shen, L.; Liu, Q.; Cao, K.; Liu, Y. Quantitative analysis of perfusion characteristics using contrast-enhanced ultrasound in patients with choroidal metastasis. Ophthalmic Res. 2022, 65, 86–93. [Google Scholar] [CrossRef] [PubMed]
- Quan, B.; Liu, X.; Zhao, S.; Chen, X.; Zhang, X.; Chen, Z. Detecting Early Ocular Choroidal Melanoma Using Ultrasound Localization Microscopy. Bioengineering 2023, 10, 428. [Google Scholar] [CrossRef] [PubMed]
- Kollmann, C.; Jenderka, K.-V.; Moran, C.M.; Draghi, F.; Diaz, J.J.; Sande, R. EFSUMB clinical safety statement for diagnostic ultrasound—(2019 revision). Ultraschall Med.-Eur. J. Ultrasound 2020, 41, 387–389. [Google Scholar] [CrossRef]
- Bayat, M.; Fatemi, M.; Alizad, A. Background removal and vessel filtering of noncontrast ultrasound images of microvasculature. IEEE Trans. Biomed. Eng. 2018, 66, 831–842. [Google Scholar] [CrossRef]
- Ghavami, S.; Bayat, M.; Fatemi, M.; Alizad, A. Quantification of morphological features in non-contrast-enhanced ultrasound microvasculature imaging. IEEE Access 2020, 8, 18925–18937. [Google Scholar] [CrossRef]
- Ternifi, R.; Wang, Y.; Polley, E.C.; Fazzio, R.T.; Fatemi, M.; Alizad, A. Quantitative biomarkers for cancer detection using contrast-free ultrasound high-definition microvessel imaging: Fractal dimension, murray’s deviation, bifurcation angle & spatial vascularity pattern. IEEE Trans. Med. Imaging 2021, 40, 3891–3900. [Google Scholar] [PubMed]
- Ternifi, R.; Wang, Y.; Gu, J.; Polley, E.C.; Carter, J.M.; Pruthi, S.; Boughey, J.C.; Fazzio, R.T.; Fatemi, M.; Alizad, A. Ultrasound high-definition microvasculature imaging with novel quantitative biomarkers improves breast cancer detection accuracy. Eur. Radiol. 2022, 32, 7448–7462. [Google Scholar] [CrossRef]
- Gu, J.; Ternifi, R.; Larson, N.B.; Carter, J.M.; Boughey, J.C.; Stan, D.L.; Fazzio, R.T.; Fatemi, M.; Alizad, A. Hybrid high-definition microvessel imaging/shear wave elastography improves breast lesion characterization. Breast Cancer Res. 2022, 24, 16. [Google Scholar] [CrossRef]
- Gu, J.; Ternifi, R.; Sabeti, S.; Larson, N.B.; Carter, J.M.; Fazzio, R.T.; Fatemi, M.; Alizad, A. Volumetric imaging and morphometric analysis of breast tumor angiogenesis using a new contrast-free ultrasound technique: A feasibility study. Breast Cancer Res. 2022, 24, 85. [Google Scholar] [CrossRef]
- Ferroni, G.; Sabeti, S.; Abdus-Shakur, T.; Scalise, L.; Carter, J.M.; Fazzio, R.T.; Larson, N.B.; Fatemi, M.; Alizad, A. Noninvasive prediction of axillary lymph node breast cancer metastasis using morphometric analysis of nodal tumor microvessels in a contrast-free ultrasound approach. Breast Cancer Res. 2023, 25, 65. [Google Scholar] [CrossRef] [PubMed]
- Kurti, M.; Sabeti, S.; Robinson, K.A.; Scalise, L.; Larson, N.B.; Fatemi, M.; Alizad, A. Quantitative biomarkers derived from a novel contrast-free ultrasound high-definition microvessel imaging for distinguishing thyroid nodules. Cancers 2023, 15, 1888. [Google Scholar] [CrossRef] [PubMed]
- Sabeti, S.; Ternifi, R.; Larson, N.B.; Olson, M.C.; Atwell, T.D.; Fatemi, M.; Alizad, A. Morphometric analysis of tumor microvessels for detection of hepatocellular carcinoma using contrast-free ultrasound imaging: A feasibility study. Front. Oncol. 2023, 13, 1121664. [Google Scholar] [CrossRef]
- Bjærum, S.; Torp, H.; Kristoffersen, K. Clutter filter design for ultrasound color flow imaging. IEEE Trans. Ultrason. Ferroelectr. Freq. Control 2002, 49, 204–216. [Google Scholar] [CrossRef]
- Demené, C.; Deffieux, T.; Pernot, M.; Osmanski, B.-F.; Biran, V.; Gennisson, J.-L.; Sieu, L.-A.; Bergel, A.; Franqui, S.; Correas, J.-M. Spatiotemporal clutter filtering of ultrafast ultrasound data highly increases Doppler and fUltrasound sensitivity. IEEE Trans. Med. Imaging 2015, 34, 2271–2285. [Google Scholar] [CrossRef] [PubMed]
- Sabo, E.; Boltenko, A.; Sova, Y.; Stein, A.; Kleinhaus, S.; Resnick, M.B. Microscopic analysis and significance of vascular architectural complexity in renal cell carcinoma. Clin. Cancer Res. 2001, 7, 533–537. [Google Scholar]
- Lemke, A.J.; Hosten, N.; Richter, M.; Bechrakis, N.E.; Foerster, P.; Puls, R.; Gutberlet, M.; Felix, R. Contrast-enhanced color Doppler sonography of uveal melanomas. J. Clin. Ultrasound 2001, 29, 205–211. [Google Scholar] [CrossRef]
- Qian, X.; Kang, H.; Li, R.; Lu, G.; Du, Z.; Shung, K.K.; Humayun, M.S.; Zhou, Q. In vivo visualization of eye vasculature using super-resolution ultrasound microvessel imaging. IEEE Trans. Biomed. Eng. 2020, 67, 2870–2880. [Google Scholar] [CrossRef]
- Kujala, E.; Makitie, T.; Kivelä, T. Very long-term prognosis of patients with malignant uveal melanoma. Investig. Ophthalmol. Vis. Sci. 2003, 44, 4651–4659. [Google Scholar] [CrossRef]
- Dalvin, L.A.; Zhang, Q.; Hamershock, R.A.; Chang, M.; Michael, D.Y.; Mashayekhi, A.; Shields, C.L. Nomogram for visual acuity outcome after iodine-125 plaque radiotherapy and prophylactic intravitreal bevacizumab for uveal melanoma in 1131 patients. Br. J. Ophthalmol. 2020, 104, 697–702. [Google Scholar] [CrossRef]
- Chen, C.; He, Z.-C.; Shi, Y.; Zhou, W.; Zhang, X.; Xiao, H.-L.; Wu, H.-B.; Yao, X.-H.; Luo, W.-C.; Cui, Y.-H. Microvascular fractal dimension predicts prognosis and response to chemotherapy in glioblastoma: An automatic image analysis study. Lab. Investig. 2018, 98, 924–934. [Google Scholar] [CrossRef] [PubMed]
- Foss, A.J.; Alexander, R.A.; Jefferies, L.W.; Hungerford, J.L.; Harris, A.L.; Lightman, S. Microvessel count predicts survival in uveal melanoma. Cancer Res. 1996, 56, 2900–2903. [Google Scholar] [PubMed]
- Makitie, T.; Summanen, P.; Tarkkanen, A.; Kivela, T. Microvascular density in predicting survival of patients with choroidal and ciliary body melanoma. Investig. Ophthalmol. Vis. Sci. 1999, 40, 2471–2480. [Google Scholar]
- Toivonen, P.i.; Mäkitie, T.; Kujala, E.; Kivelä, T. Microcirculation and tumor-infiltrating macrophages in choroidal and ciliary body melanoma and corresponding metastases. Investig. Ophthalmol. Vis. Sci. 2004, 45, 1–6. [Google Scholar] [CrossRef] [PubMed]
- Nayak, R.; Kumar, V.; Webb, J.; Gregory, A.; Fatemi, M.; Alizad, A. Non-contrast agent based small vessel imaging of human thyroid using motion corrected power Doppler imaging. Sci. Rep. 2018, 8, 15318. [Google Scholar] [CrossRef]
- Nayak, R.; MacNeill, J.; Flores, C.; Webb, J.; Fatemi, M.; Alizad, A. Quantitative assessment of ensemble coherency in contrast-free ultrasound microvasculature imaging. Med. Phys. 2021, 48, 3540–3558. [Google Scholar] [CrossRef]
- Pawar, K.; Chen, Z.; Shah, N.J.; Egan, G.F. Motion correction in MRI using deep convolutional neural network. In Proceedings of the ISMRM Scientific Meeting & Exhibition, Paris, France, 16–21 June 2018. [Google Scholar]
- Küstner, T.; Armanious, K.; Yang, J.; Yang, B.; Schick, F.; Gatidis, S. Retrospective correction of motion-affected MR images using deep learning frameworks. Magn. Reson. Med. 2019, 82, 1527–1540. [Google Scholar] [CrossRef]


| Characteristics | Malignant (21) | Benign (15) |
|---|---|---|
| Demographics | ||
| Sex (male) | 14 (67%) | 7 (47%) |
| Sex (female) | 7 (33%) | 8 (53%) |
| Age (years) | 60.48 ± 15.75 | 67.47 ± 14.31 |
| White non-Hispanic (race and ethnicity) | 21 (100%) | 15 (100%) |
| Clinical multimodal imaging features | ||
| Tumor thickness, mm (US) | 3.81 ± 2.63 | 1.70 ± 0.40 |
| Tumor basal diameter, mm (US) | 10.45 ± 3.82 | 7.78 ± 1.50 |
| Vascular irregularity over lesion (OCTA) | 5 (24%) | 9 (60%) |
| Low internal reflectivity (US) | 10 (48%) | 5 (33%) |
| Subretinal fluid (US) | 5 (24%) | 0 (0%) |
| Orange pigment (FA) | 15 (71%) | 8 (53%) |
| HDMI Biomarkers | Malignant n = 21 | Benign n = 15 | p-Value | AUC [95% CI] |
|---|---|---|---|---|
| VD | 0.20 ± 0.11 | 0.12 ± 0.09 | 0.03 | 0.72 [0.51, 0.88] |
| (µm) | 459.89 ± 174.46 | 381.83 ± 176.38 | 0.39 | 0.59 [0.39, 0.78] |
| (µm) | 908.56 ± 359.09 | 624.32 ± 341.80 | 0.003 | 0.71 [0.50, 0.88] |
| NV | 16.57 ± 11.84 | 6.73 ± 5.74 | 0.003 | 0.79 [0.47, 0.93] |
| mvFD | 1.32 ± 0.11 | 1.14 ± 0.16 | 0.002 | 0.81 [0.63, 0.95] |
| NB | 8.90 ± 8.33 | 3.07 ± 3.81 | 0.003 | 0.78 [0.39, 0.94] |
| 1.14 ± 0.21 | 1.05 ± 0.03 | 0.14 | 0.65 [0.45, 0.83] | |
| 1.91 ± 1.81 | 1.18 ± 0.21 | 0.001 | 0.82 [0.64, 0.95] |
| HDMI Branching-Based Biomarkers. | Malignant n = 21 | Benign n = 15 | p-Value | ||
|---|---|---|---|---|---|
| N w/NB > 0 (%) | Mean ± SD * | N w/NB > (%) | Mean ± SD * | ||
| (°) | 21 (100%) | 99.53 ± 17.72 | 8 (53%) | 99.74 ± 32.92 | 0.002 † |
| (°) | 21 (100%) | 141.25 ± 28.57 | 8 (53%) | 140.28 ± 35.24 | 0.002 † |
| 21 (100%) | 0.40 ± 0.18 | 8 (53%) | 0.40 ± 0.18 | 0.002 † | |
| 21 (100%) | 0.70 ± 0.26 | 8 (53%) | 0.66 ± 0.22 | 0.002 † | |
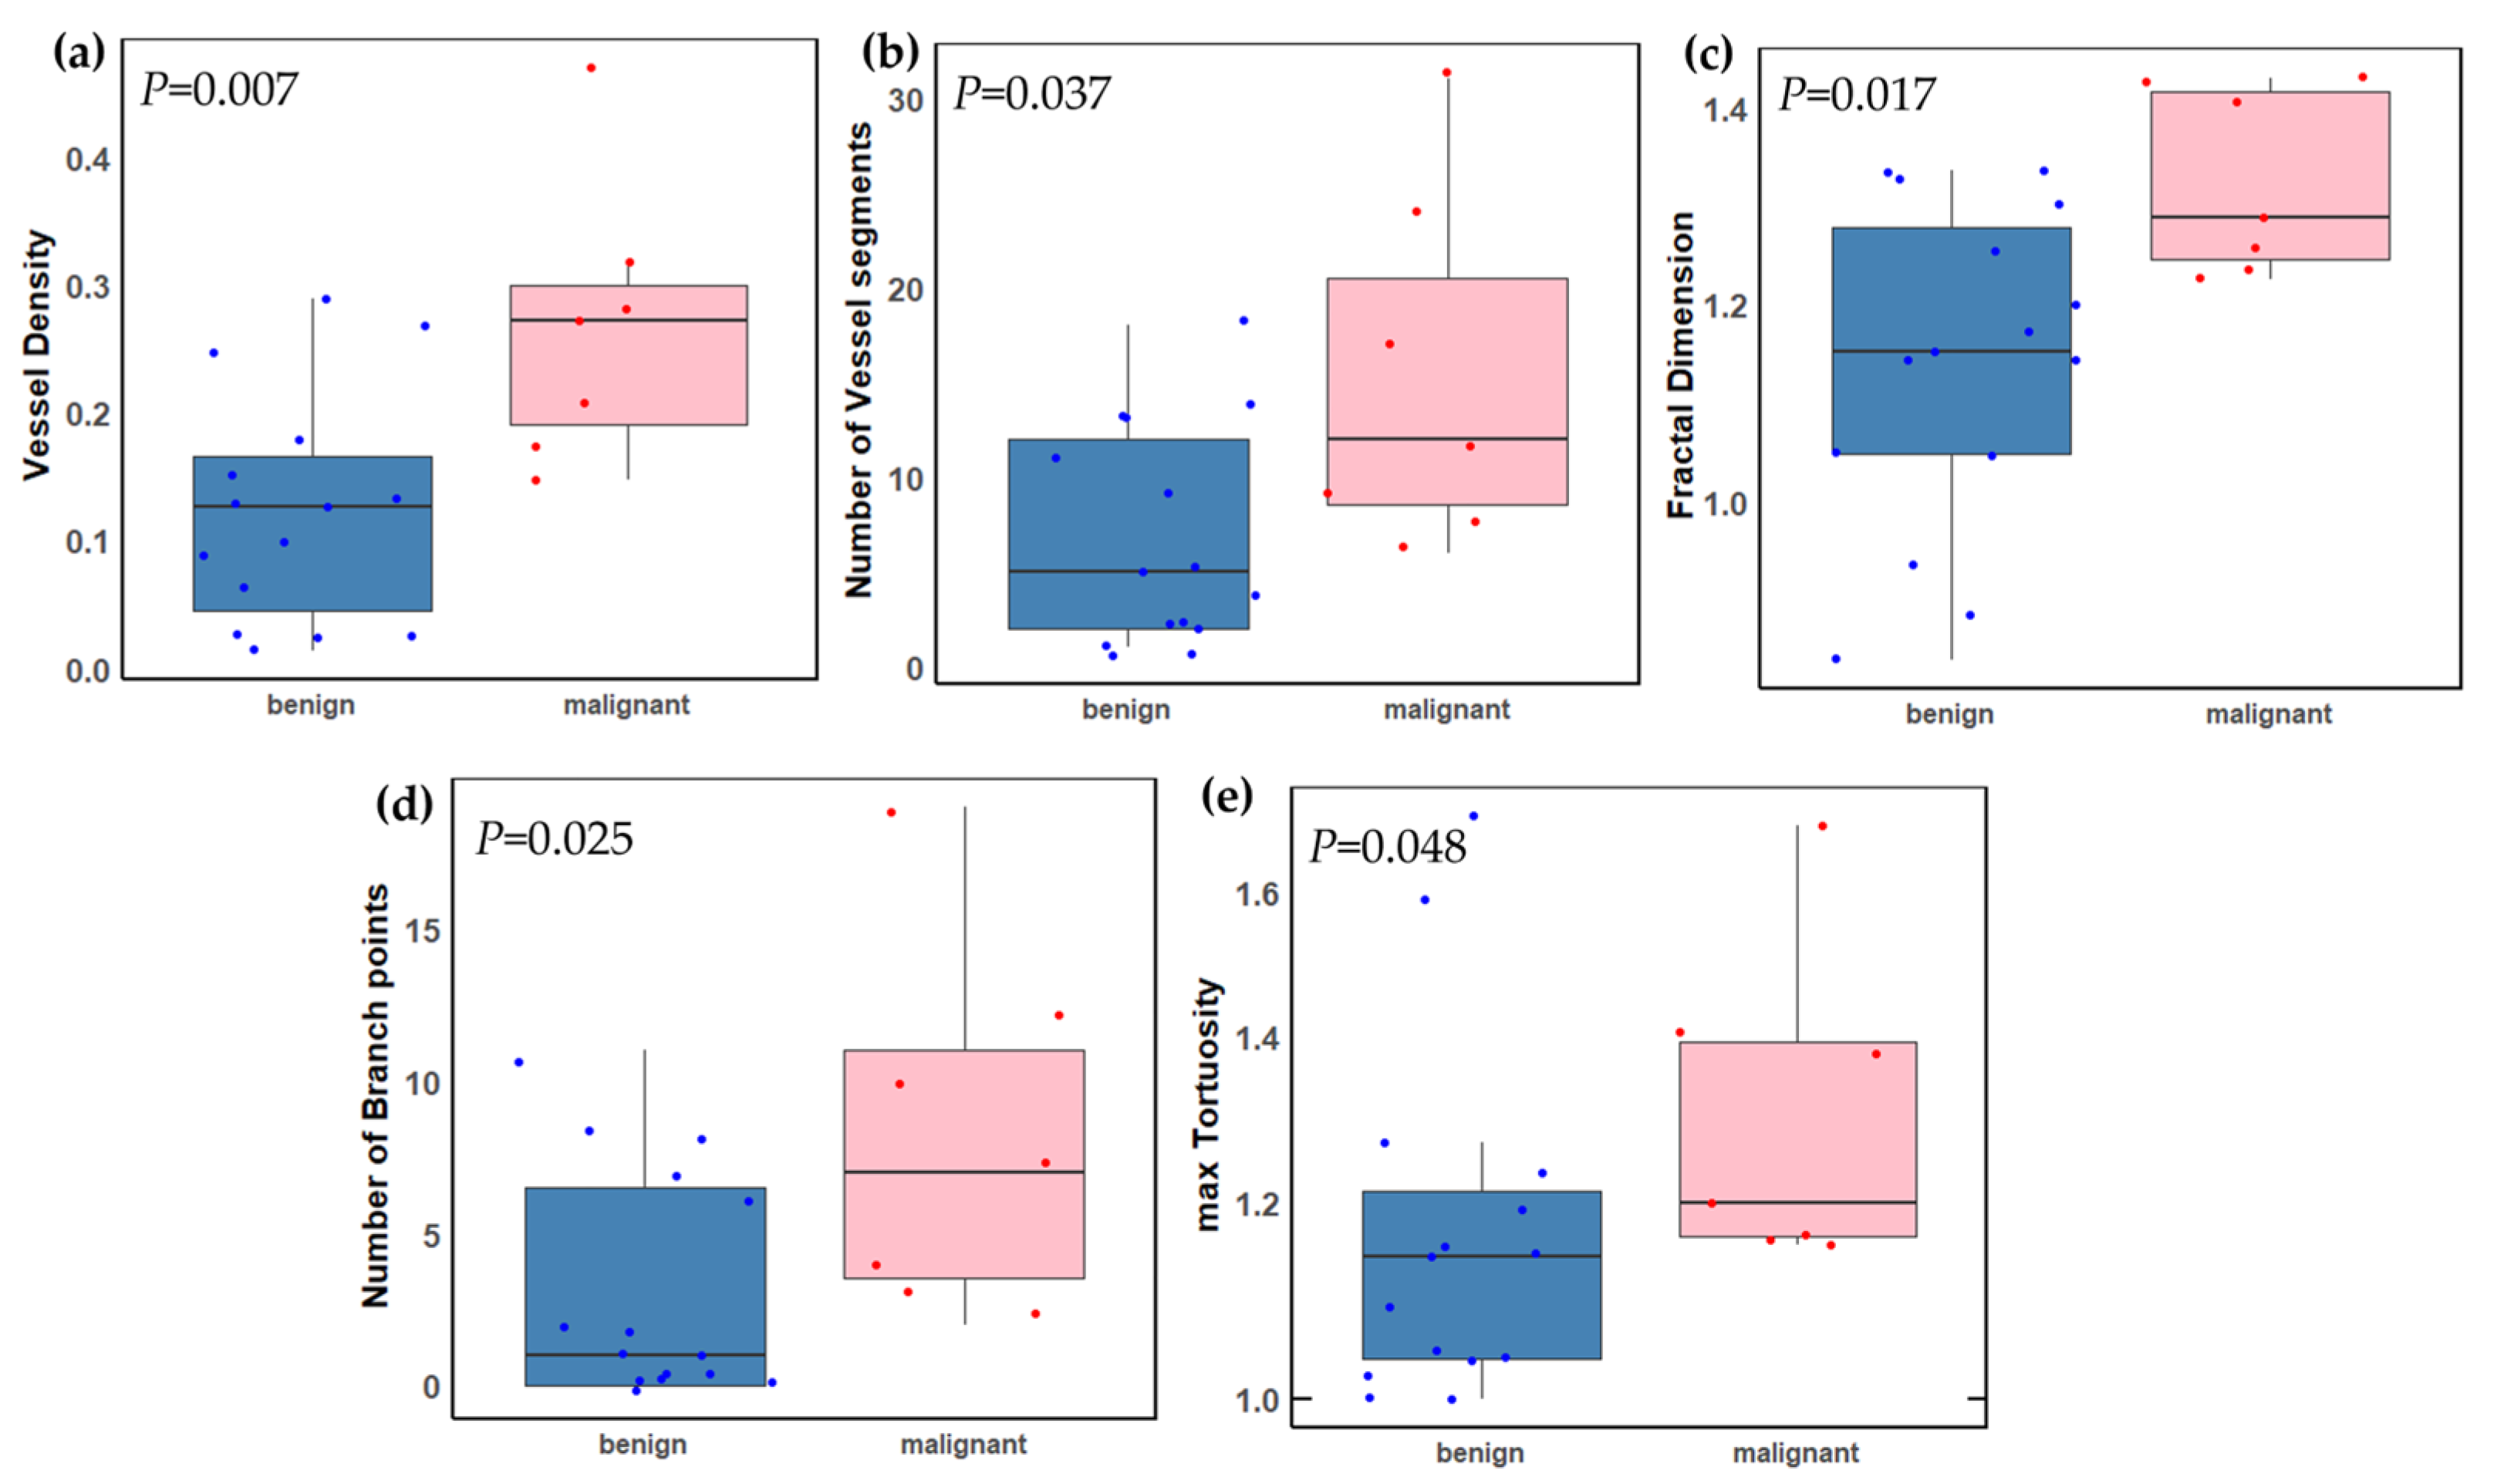
| Malignant n = 7 | Benign, n = 15 | p-Value | |
|---|---|---|---|
| Tumor thickness | 1.74 ± 0.45) | 1.70 ± 0.41 | 0.778 |
| HDMI biomarkers | |||
| VD | 0.27 ± 0.11 | 0.12 ± 0.09 | 0.007 |
| (µm) | 405.48 ± 254.82 | 381.83 ± 176.38 | >0.99 |
| (µm) | 752.63 ± 499.35 | 624.32 ± 341.80 | 0.724 |
| NV | 15.29 ± 9.27 | 6.73 ± 5.74 | 0.037 |
| mvFD | 1.32 ± 0.10 | 1.14 ± 0.16 | 0.017 |
| NB | 8.14 ± 6.04 | 3.07 ± 3.81 | 0.025 |
| 1.07 ± 0.04 | 1.05 ± 0.03 | 0.622 | |
| 1.31 ± 0.20 | 1.18 ± 0.21 | 0.048 | |
Disclaimer/Publisher’s Note: The statements, opinions and data contained in all publications are solely those of the individual author(s) and contributor(s) and not of MDPI and/or the editor(s). MDPI and/or the editor(s) disclaim responsibility for any injury to people or property resulting from any ideas, methods, instructions or products referred to in the content. |
© 2024 by the authors. Licensee MDPI, Basel, Switzerland. This article is an open access article distributed under the terms and conditions of the Creative Commons Attribution (CC BY) license (https://creativecommons.org/licenses/by/4.0/).
Share and Cite
Adusei, S.A.; Sabeti, S.; Larson, N.B.; Dalvin, L.A.; Fatemi, M.; Alizad, A. Quantitative Biomarkers Derived from a Novel, Contrast-Free Ultrasound, High-Definition Microvessel Imaging for Differentiating Choroidal Tumors. Cancers 2024, 16, 395. https://doi.org/10.3390/cancers16020395
Adusei SA, Sabeti S, Larson NB, Dalvin LA, Fatemi M, Alizad A. Quantitative Biomarkers Derived from a Novel, Contrast-Free Ultrasound, High-Definition Microvessel Imaging for Differentiating Choroidal Tumors. Cancers. 2024; 16(2):395. https://doi.org/10.3390/cancers16020395
Chicago/Turabian StyleAdusei, Shaheeda A., Soroosh Sabeti, Nicholas B. Larson, Lauren A. Dalvin, Mostafa Fatemi, and Azra Alizad. 2024. "Quantitative Biomarkers Derived from a Novel, Contrast-Free Ultrasound, High-Definition Microvessel Imaging for Differentiating Choroidal Tumors" Cancers 16, no. 2: 395. https://doi.org/10.3390/cancers16020395
APA StyleAdusei, S. A., Sabeti, S., Larson, N. B., Dalvin, L. A., Fatemi, M., & Alizad, A. (2024). Quantitative Biomarkers Derived from a Novel, Contrast-Free Ultrasound, High-Definition Microvessel Imaging for Differentiating Choroidal Tumors. Cancers, 16(2), 395. https://doi.org/10.3390/cancers16020395