Simple Summary
Synchronous oligometastatic non-small cell lung cancer (NSCLC) represents an intermediate state of metastatic disease with a limited number of metastases. It has been suggested that adding local radical treatment (LRT) in this setting may improve the survival outcomes, but there are no validated tools to better select those patients who are most likely to benefit from LRT. The presence of cachexia and sarcopenia at diagnosis seems to be linked to poorer outcomes in local or advanced NSCLC, but it is not clear if these factors can be used to guide the treatment decisions in oligometastatic NSCLC and to preclude a possible radical treatment in patients with baseline cachexia or sarcopenia. For this reason, we evaluated the impact of cachexia and sarcopenia on survival outcomes and toxicities in a group of patients with synchronous oligometastatic NSCLC on an intention-to-treat basis. Considering the different definitions of sarcopenia used among different studies, we used the Psoas Muscle Index (PMI) as a surrogate of sarcopenia. Progression-free survival was longer for patients without cachexia and sarcopenia compared to those with cachexia and/or sarcopenia.
Abstract
Among patients with advanced NSCLC, there is a group of patients with synchronous oligometastatic disease (sOMD), defined as a limited number of metastases detected at the time of diagnosis. As cachexia and sarcopenia are linked to poor survival, incorporating this information could assist clinicians in determining whether a radical treatment should be administered. In a retrospective multicenter study, including all patients with adequately staged (FDG-PET, brain imaging) sOMD according to the EORTC definition, we aimed to assess the relationship between cachexia and/or sarcopenia and survival. Of the 439 patients that were identified between 2015 and 2021, 234 met the criteria for inclusion and were included. The median age of the cohort was 67, 52.6% were male, and the median number of metastasis was 1. Forty-six (19.7%) patients had cachexia, thirty-four (14.5%) had sarcopenia and twenty-one (9.0%) had both. With a median follow-up of 49.7 months, median PFS and OS were 8.6 and 17.3 months, respectively. Moreover, a trend toward longer PFS was found in patients without cachexia and sarcopenia compared to those with cachexia and/or sarcopenia. In multivariate analysis, cachexia and sarcopenia were not associated with an inferior survival, irrespective of receiving radical treatment. High CRP was associated with inferior survival and could be a prognostic factor, helping the decision of clinicians in selecting patients who may benefit from the addition of LRT. However, despite the homogeneous definition of oligometastatic disease and the adequate staging, our subgroups were small. Therefore, further studies are needed to better understand our hypothesis and generating findings.
1. Introduction
Non-small cell lung carcinoma (NSCLC) is the primary cause of death related to cancer, mainly because patients present with advanced disease due to the late onset of symptoms [1]. Within the spectrum of limited and advanced NSCLC, there is a group of patients (approximately 20–50%) presenting with synchronous oligometastatic disease, defined as a limited number of metastases (usually three to five in a maximum of three organs) detected at the time of first NSCLC diagnosis [2,3]. Oligometastatic disease (OMD) is a unique subgroup of stage IV disease, as some patients with OMD can benefit from adding local radical therapy (LRT, i.e., minimal invasive surgery or stereotactic radiation therapy (SRT)) to systemic treatment, with a possibility of long-term disease control or even cure [4,5,6,7]. The addition of LRT to NSCLC responding to systemic therapy in OMD is advised in clinical guidelines, though this is based on limited evidence [8,9,10]. Moreover, immune checkpoint inhibitors (ICI)- and tyrosine kinase inhibitors (TKI)-based treatments are now the preferred first-line treatment strategies and these drugs could be beneficial to patients with OMD treated with radical intent. Preclinically, ICI acts synergistically with SRT because of the immunomodulatory effects of this combination [11,12]. Indeed, in a single-arm phase II study (n = 51) evaluating pembrolizumab after LRT, an improvement in PFS was seen compared with historical data [11,13]. Furthermore, in a phase III trial (n = 133, NCT02893332) evaluating the efficacy of first-generation epidermal growth factor receptor (EGFR) TKI with or without radiation therapy in synchronous oligometastatic EGFR-mutated NSCLC, a positive impact on survival was suggested when radiotherapy was added to the TKI [14]. A limitation of this trial and others is the selection bias due to not fully staged patients and in most trials the enrollment of only patients with favorable prognostic or predictive characteristics (e.g., only those responding to systemic therapy or only those with a single metastasis without nodal involvement) [15].
Cachexia and sarcopenia both correlate independently with a decline in prognosis [16,17,18]. Cachexia is linked to systemic inflammation with patients showing loss of skeletal muscle mass that cannot be reversed by nutritional support. This can lead to functional impairment and poorer performance status (PS), and it can reduce the effect of chemotherapy [18]. It is also proposed that cachexia and its related changes in inflammatory parameters have a negative effect on the efficacy of ICI [19]. Additionally, sarcopenia might be associated with poor survival in patients treated with either first-line ICI or EGFR-TKI [20]. In patients with both limited as well as advanced NSCLC the prevalence of cachexia is high and is associated with poor survival outcomes (Table 1) [16,17,18,21]. Of note, in these studies, different approaches to measuring and defining sarcopenia or cachexia were used. Moreover, data are lacking for synchronous oligometastatic NSCLC, and especially for intention-to-treat cohorts.

Table 1.
Effect of cachexia or sarcopenia on survival rates in different stages of NSCLC in recent studies.
If cachexia and sarcopenia are also associated with poor outcomes (survival, toxicity) in the treatment of synchronous OMD (sOMD), the incorporation of this information could help clinicians decide whether to pursue a radical treatment or not. Therefore, we evaluated the relation of cachexia and sarcopenia with survival and toxicity outcomes in a fully staged, intention-to-treat cohort of patients with sOMD.
2. Materials and Methods
2.1. Patient Inclusion and Study Design
We performed a retrospective study in two Dutch hospitals (Maastricht UMC+ and Zuyderland MC) including all newly diagnosed patients with synchronous oligometastatic NSCLC. All weekly thoracic oncology multidisciplinary meetings (MDTs) were reviewed in the period of January 2015 to December 2021. As all patients newly diagnosed with NSCLC have to be discussed at the MDT, no patients will have been missed. We defined sOMD according to the consensus published by the European Organization for Research and Treatment of Cancer (EORTC) stating that sOMD NSCLC has a maximum number of five metastases involving a maximum of three organs, based on baseline fluodeoxyglucose–positron emission tomography-computed tomography (FDG-PET-CT) and brain imaging (magnetic resonance imaging (MRI) preferred). Additionally, patients had to be 18 years or older at the time of diagnosis. All patients for whom the MDT recommended an oligometastatic approach (regardless of received treatment), had no other malignancy within 5 years of NSCLC diagnosis (except tumor in-situ), had no second primary NSCLC, and did not participate in a clinical trial during first-line treatment were included.
The following baseline characteristics were collected from the digital medical files: age, gender, World Health Organization performance status (WHO-PS), weight at diagnosis, weight loss in the last 6 months before diagnosis, length, smoking status and pack years, data on histology, biochemical data within 30 days before the start of treatment or at the date of the first pathological confirmed NSCLC diagnosis, molecular and programmed death-ligand 1 (PD-L1) testing, TNM stage based on the eighth edition of the American Joint Committee on Cancer (AJCC) including the number and location of metastases, the decision of the MDT whether the patient was classified as oligometastatic NSCLC, whether LRT was recommended, and information on first-line systemic therapy. Response after finishing treatment was established according to Response Evaluation Criteria in Solid Tumors 1.1 (RECIST 1.1) [33]. Further data collected were: whether patients actually received LRT, treatment toxicity as documented in the medical files, graded according to the Common Terminology Criteria for Adverse Events (CTCAE version 5.0), date of disease progression, subsequent treatment strategies, and date of last contact/death. The regular definition of cachexia was used: cachexia was defined as an involuntary loss of more than 5% body weight in the past six months or more than 2% body weight loss in patients with a body mass index (BMI) ≤ 20 kg/m2 [34].
Sarcopenia is defined as low muscle strength, mass, and function, which could be caused by cachexia or ageing [35]. Sarcopenia is reversible and influenced by multiple factors; therefore, we have chosen to divide cachexia and sarcopenia into groups to truly distinguish their impact on survival as separate entities. The European Working Group on Sarcopenia in Older People (EWGSOP) stated in their consensus paper that the measure of the musculature at L3 can be used as a surrogate marker to define sarcopenia [36]. It was also mentioned that a muscle mass of two standard deviations below healthy adults can be used as a definition of sarcopenia [37]. The PMI was calculated as the cross-sectional area of the psoas muscle (cm2) divided by the height (m2) [38]. For this reason, in our work we used the PMI as a surrogate of sarcopenia. Using the diagnostic CT if available and otherwise the low-dose CT, the cross-sectional area of the psoas muscle at the inferior aspect of the third lumbar vertebra (L3) was used for calculating the PMI. Due to the absence of validated cut-off values for PMI at the L3 level, we used the unbiased sex-specific lower 25th percentile of the PMI in our cohort of patients, which was 6.05 mm2/m2 for men and 4.20 mm2/m2 for women.
2.2. Statistical Analysis
Statistical analysis was performed using IBM SPSS version 28 (Chicago, IL, USA). Baseline characteristics were analyzed using descriptive statistics and the groups were compared using the Chi-square test for categorical variables and the one-way ANOVA for continuous variables. PFS and OS were calculated from the date of pathological diagnosis and estimated using the Kaplan–Meier method. The median follow-up was estimated using the reversed Kaplan–Meier method and patients without event were censored at the last follow-up date. Univariate and multivariate analysis of the one-year PFS and OS was performed using the logistic regression model. A p < 0.05 was considered as statistically significant.
3. Results
3.1. Baseline Characteristics of Patients
In total, 439 patients with sOMD NSCLC were identified. Of these patients, 205 were excluded because of: no intention of radical treatment (n = 84), another primary malignancy (n = 59), no adequate staging (n = 32), clinical trial participation (n = 25), and no follow-up because of subsequent treatment in another hospital (n = 5). Patient selection is depicted in Figure 1. Reasons for the MDT to not advise radical treatment for these 84 patients were: poor clinical condition (n = 55), tumor load being too large for radical treatment (n = 20), or the patient’s wish for no further treatment after diagnosis (n = 9). Three patients had a WHO-PS of 3 at NSCLC diagnosis due to symptomatic cerebral edema from brain metastases, but their clinical condition rapidly improved after treatment with steroids and therefore they were deemed candidates for LRT by the MDT. Of the 234 patients with adequately staged sOMD and an MDT recommendation to treat with radical intent, 142 (60.7%) patients actually proceeded to LRT after a response to induction systemic therapy. Reasons for not proceeding to LRT were: progressive disease after induction systemic therapy (n = 46), deterioration of the clinical condition during induction therapy resulting in no response evaluation (n = 43), and complete response to induction therapy (n = 3).
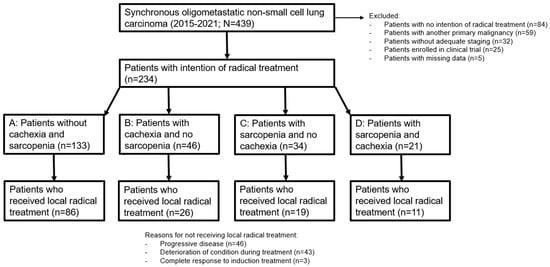
Figure 1.
Flowchart of patient inclusion and selection.
We analyzed the influence of cachexia and sarcopenia by dividing the patients into groups stratified by the presence of cachexia and/or sarcopenia (Figure 1). Group A consisted of patients without cachexia and without sarcopenia, group B contained patients with only cachexia, group C had patients with only sarcopenia, and group D consisted of patients with both cachexia and sarcopenia. The baseline clinical characteristics of the 234 included patients stratified by cachexia and sarcopenia are shown in Table 2. Except for the differences in BMI, PMI, and weight loss, statistically significant differences were found between the groups for WHO PS, smoking status, serum albumin level, and type of systemic therapy.
Table 2.
Baseline clinical characteristics.
3.2. Survival Analysis
The median follow-up was 49.7 months (95% CI, 42.4–57.1) for all included patients. The median PFS was 8.6 months (95% CI, 7.2–9.9) and the median OS was 17.3 months (95% CI, 13.9–20.7) (Figure 2).
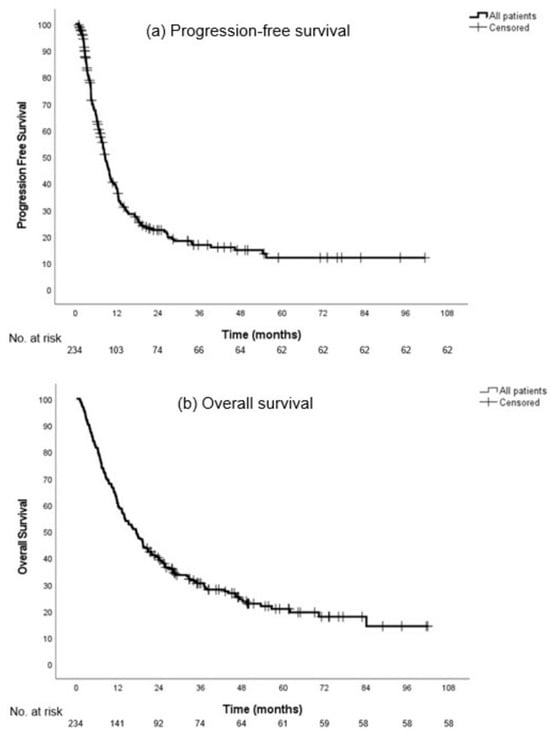
Figure 2.
Progression-free survival (a) and overall survival (b) in all patients.
The median follow-up in groups A, B, C, and D was 49.7 (95% CI, 39.9–59.6), 47.0 (95% CI, 42.2–51.8), 43.1 (95% CI, 29.1–57.2), and 57.8 months (95% CI, 37.6–77.9), respectively (p = 0.92). Disease progression occurred in respectively 95 (71.4%), 37 (80.4%), 24 (70.6%), and 17 (81.0%) patients. Subsequently, 96 (72.2%), 39 (84.8%), 26 (76.5%), and 15 (71.4%) patients died, respectively.
The median PFS in groups A, B, C, and D was not significantly different with 9.7 (95% CI, 8.2–11.1), 6.1 (CI 95%, 3.4–8.7), 11.4 (95% CI, 7.8–15.0), and 8.1 months (95% CI, 4.9–11.2), respectively (p = 0.18, hazard ratio (HR) 1.1; 95% CI 1.0–1.3) (Figure 3a).
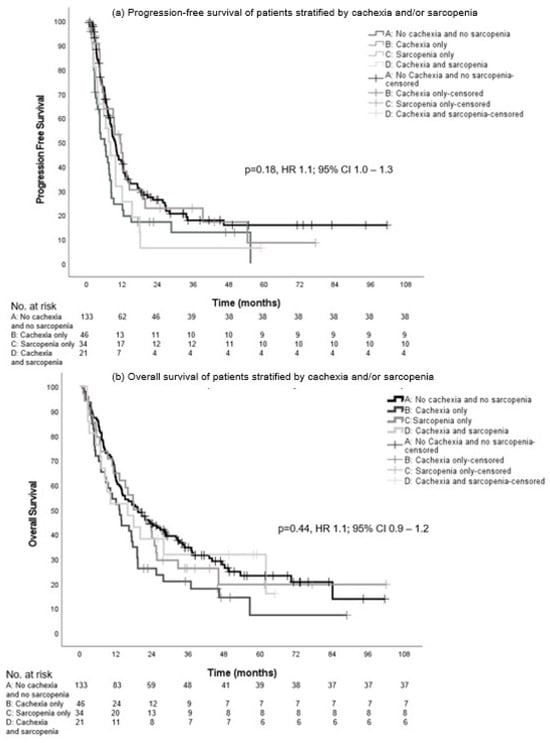
Figure 3.
Progression-free survival (a) and overall survival (b) in patients with intention of LRT stratified by cachexia and/or sarcopenia.
There was no statistical significance in the median OS between the groups: 19.3 (95% CI, 12.3–26.2), 13.1 (95% CI, 9.0–17.2), 17.9 (95% CI, 9.2–26.6), and 15.9 months (95% CI, 2.7–29.1), respectively (p = 0.44, HR 1.1; 95% CI 0.9–1.2) (Figure 3b).
We further analyzed the patients by selecting the patients who eventually proceeded to LRT after response to induction systemic therapy.
In our patient cohort, only 60.5% proceeded to LRT after response to induction systemic therapy. Compared with the 64.7% of patients proceeding to LRT in group A (no cachexia and no sarcopenia), a smaller percentage of patients with cachexia only (56.5%), sarcopenia only (55.9%), and both cachexia and sarcopenia (52.4%) proceeded to LRT, although this difference did not reach statistical significance.
The median PFS in the groups was not significantly different with 12.3 (95% CI, 10.1–14.6), 7.6 (95% CI, 5.5–9.7), 13.6 (95% CI, 10.8–16.3), and 9.8 months (95% CI, 7.3–12.3), respectively (p = 0.14, HR 1.2; 95% CI, 1.0–1.4) (Figure 4a).
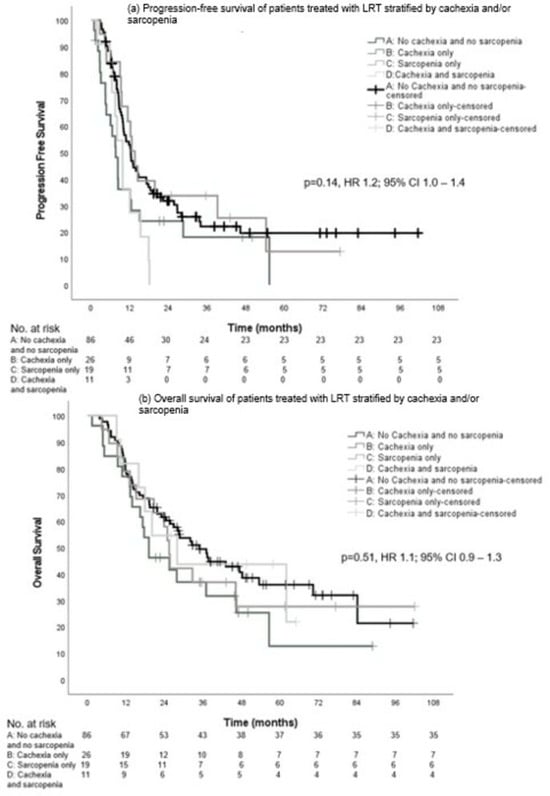
Figure 4.
Progression-free survival (a) and overall survival (b) in patients who received LRT stratified by cachexia and sarcopenia.
Although numerically higher for group A, there was no significant difference in median OS between the groups: 34.9 (95% CI, 25.3–44.4), 19.1 (95% CI, 9.3–28.9), 25.4 (95% CI, 22.8–28.0), and 27.9 months (95% CI, 12.7–43.1), respectively (p = 0.51, HR 1.1; 95% CI, 0.9–1.3) (Figure 4b).
Finally, we also compared PFS and OS between patients of group A (without cachexia and without sarcopenia) versus patients with cachexia and/or sarcopenia (groups B, C, and D combined). Although there was a trend toward a longer PFS, the median PFS in group A was not significantly different from the other groups with 9.7 months (95% CI, 8.2–11.1) versus 7.5 months (95% CI, 5.9–9.2), respectively (HR 0.7, 0.6–1.0, p = 0.05). The median OS was not different between group A and groups B, C, and D combined: 19.3 months (95% CI, 12.3–26.2) versus 15.9 months (95% CI, 11.9–19.9) (HR 0.8, 95% CI, 0.6–1.1, p = 0.10), respectively (Figure 5).
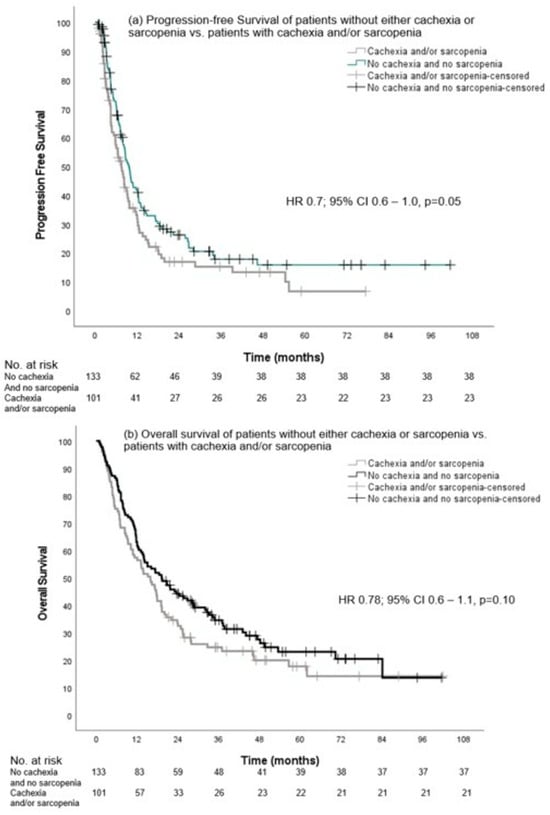
Figure 5.
Progression-free survival and overall survival of patients without either cachexia or sarcopenia vs. patients with cachexia and/or sarcopenia.
A univariate and multivariate logistic regression analysis was performed to further evaluate the association of cachexia and sarcopenia and survival both in the total group of patients and subsequently in the group of patients who received LRT after induction systemic therapy. In the total group, in univariate analysis, older age at diagnosis (≥75 years) and male gender were associated with inferior survival, and squamous histology was associated with better survival. In multivariate analysis, only older age at diagnosis was associated with inferior survival (Table 3).
Table 3.
Logistic regression analysis for one-year overall survival for all patients.
For PFS, univariate analysis showed that male gender and high CRP were associated with inferior survival. In multivariate analysis, high CRP was associated with inferior PFS (Table 4).
Table 4.
Logistic regression analysis for one-year progression-free survival for all patients.
In the group of patients receiving LRT we also evaluated TRAE and the best response to induction systemic therapy (Table 5 and Table 6). High CRP (>5 mg/L) was in both univariate and multivariate analysis associated with decreased PFS (Table 6).
Table 5.
Logistic regression analysis for one-year overall survival for patients who received LRT.
Table 6.
Logistic regression analysis for one-year progression-free survival for patients who received LRT.
3.3. Safety Profile
No statistically significant difference in the number of toxicities per grade was observed between the four groups (Table S1a,b).
4. Discussion
According to clinical guidelines, patients with sOMD should receive systemic therapy followed by LRT to all visible disease sites upon disease response [8,9,10]. However, different baseline factors, such as cachexia and sarcopenia, may influence the outcome of patients with sOMD. Although several studies have evaluated the impact of sarcopenia and cachexia on patients with limited or advanced NSCLC, to the best of our knowledge, studies regarding sOMD are not available. Therefore, we evaluated the effect of sarcopenia and cachexia on the survival outcomes (and toxicities) of patients with adequately staged sOMD, treated on an intention-to-treat basis in this preliminary report. In our analysis, we divided the patients into four different subgroups according to the presence of cachexia and sarcopenia in the different possible combinations. Although the definition of sarcopenia is related to cachexia, we decided to consider these conditions as separate entities in our group because other factors such as ageing could have an impact on the presence of sarcopenia [35]. In fact, sarcopenia can be reversible, differently from cachexia, and we supposed that those conditions may had a different impact on the prognosis of these patients. As even in the best prognostic group only two thirds of patients proceeded to LRT, the need for baseline prognostic factors that can help in selecting patient candidates for LRT still remains. The presence of cachexia and/or sarcopenia per se should not preclude patients from a radical treatment approach. This is also reflected in the fact that although patients with cachexia and/or sarcopenia had a numerically shorter median PFS and OS, both factors were not associated with survival in univariate and multivariate analysis, stressing the finding that other factors such as response to induction therapy are more important. Also, the comparison between patients without cachexia and sarcopenia (group A) and patients with cachexia and/or sarcopenia (group B-C-D) did not show significant results.
The small impact of cachexia on the survival in sOMD could be due to the recent implementation of ICI and TKI in the treatment strategies and the beneficial effect of ICI and TKI on survival [11,13,14]. Current studies on the effect of cachexia on the efficacy of ICI in advanced NSCLC have been inconsistent and a clear correlation between cachexia and the efficacy of ICI has not been established yet [19,23,24].
Also, studies on the impact of sarcopenia on advanced NSCLC patients treated with ICI and TKI have demonstrated no differences in survival outcomes according to the presence or not of sarcopenia [19,39,40,41,42,43].
However, to the best of our knowledge, we are the first to also evaluate possible prognostic factors in a group of patients with sOMD on an intention-to-treat basis. In fact, even if in our univariate and multivariate analyses, cachexia and sarcopenia were not significant prognostic factors for survival; in the multivariate analysis we found that older age at diagnosis (≥75 years) was associated with inferior OS. Finally, the multivariate analysis for PFS showed elevated levels of CRP as a significant factor associated with poorer PFS the high CRP. Although both cachexia and sarcopenia are also linked to elevated levels of CRP and IL-6 [19], these results may more likely be explained considering that elevated levels of CRP, LDH, and IL-6 seem to be associated with poor survival in different studies and with diminishing the effect of ICI due to their ability to modulate antitumor immune responses [44,45].
The analysis of all the patients with intention of LRT compared with only patients who received LRT showed similar median PFS and OS in patients with both cachexia and sarcopenia and in patients without cachexia and sarcopenia. This highlights the discussion on how big the impact of cachexia and sarcopenia is in patients with a good WHO-PS and that this specific group of patients with cachexia and/or sarcopenia should be selected for receiving LRT (Table 2). Otherwise, cachexia seems to be more common in patients with poor PS, as the presence of cachexia impacts different aspects of the daily life of the patients, thus conditioning their PS. In fact, different studies have shown a correlation between cachexia and poorer PS, but most of the studies available on cachexia and/or sarcopenia enrolled patients with a good PS [46,47]. Further studies are needed to understand whether cachexia or sarcopenia have an inferior prognostic impact on patients with poor PS.
Regarding the role of the ICI in our group, patients in the cachexia and sarcopenia group received significantly more ICI as induction systemic therapy and this could be a possible explanation for the relatively good survival in this group of patients despite the potential poor prognostic impact of cachexia and sarcopenia [11,13]. As earlier mentioned, the effects of cachexia and sarcopenia on the efficacy of ICI and TKI have been inconsistent, and more and larger data on homogenous groups are needed. Of note, serum albumin could be a possible prognostic factor, as it is suggested that low serum albumin levels could be an indicator of adverse outcomes in ICI therapy due to their effect on systemic inflammation [48,49]. This could be of importance in patients with cachexia, as low serum albumin levels are associated with a low nutritional status and thus cachexia, and larger studies on the correlation between low serum albumin levels and the efficacy of ICI are warranted. However, as we collected patients from 2015 to 2021 (in part before the introduction of ICIs), in our population only 15% of patients received treatment with ICIs and 10% of patients received treatment with TKI. This may represent a relevant limitation for the application of our study in the current clinical scenario. In fact, for patients who are candidates to receive ICIs, immunotherapy represents a safe and with long-term tumor-control potential treatment strategy. For this reason, future research on the impact of cachexia and sarcopenia in patients with NSCLC should also focus on the different treatment schedules now available. Further analyses including the comparison of survival of patients who have received chemotherapy versus immunotherapy with cachexia and/or sarcopenia are needed to better suit the current clinical landscape.
Recent studies have suggested that cachexia and sarcopenia increase toxicity in patients treated with chemotherapy [18,50]. Yet, in patients treated with either TKI or ICI, there were mixed results on the effect of cachexia and sarcopenia on toxicity [20,43,51]. Our results demonstrated that toxicity was similar in patients with or without cachexia and/or sarcopenia, indicating that a radical intent treatment strategy in patients with cachexia and/or sarcopenia at baseline could be deemed as a safe option.
Our study is to our knowledge the first to explore the impact of cachexia and sarcopenia on survival in patients with sOMD NSCLC including a large and well-defined cohort of patients on an intention-to-treat basis.
Nonetheless, our study has some limitations; for example, even if we used the EORTC consensus for the definition of OMD to make our population homogeneous, information regarding the tumor volume is lacking. The study of the variability of both primary tumor volume and metastases volume may represent a useful prognostic biomarker and needs to be evaluated in future studies. Although our patients were homogeneous for their oligometastatic state and intention-to-treat basis, they have different oncogenic drivers and they received different treatment schedules. These factors may impact the survival, representing a weakness of our results. Other limitations of our study are the retrospective nature and the lack of an external validation for the classification of cachexia and for the measurement of sarcopenia. In fact, a consensus regarding the optimal way to evaluate those factors still does not exist, making it difficult to compare results. Also, PMI was used as a surrogate for sarcopenia and sarcopenia was not based on SMI, and muscle strength and function (i.e., handgrip strength), which are validated by the EWGSOP [35]. Specific cut-offs and standardized methods to evaluate sarcopenia are still lacking; for this reason, we used the unbiased sex-specific lower 25th percentile as a cut-off, but a better standardization, such as an external validation, is mandatory in the future. Furthermore, patients in our cohort were in relatively good clinical condition, as most patients had a WHO-PS of 0–1 (89.9%). Therefore, we could not compare the detrimental effect of WHO-PS ≥2 in comparison with cachexia and sarcopenia as other studies have shown [23,25]. Additionally, response to induction systemic therapy, serum CRP level, and older age at diagnosis (≥75 years) could be used as a prognostic factor instead of cachexia or sarcopenia, and in turn they could play a fundamental role in selecting patients with sOMD fit for radical treatment. Finally, the different subgroups of patients classified according to the presence or absence of sarcopenia and cachexia are small. Therefore our results are still preliminary and larger studies are needed to confirm these hypothesis-generating data, even if our analysis on an intention-to-treat basis represents an important strength of our results despite the small subgroups.
5. Conclusions
Cachexia and sarcopenia, either separately or combined, were not associated with an inferior survival in patients with sOMD NSCLC, irrespective of receiving LRT. High CRP and older age at diagnosis (≥75 years) were associated with inferior survival and could be potential prognostic factors, helping the decision-making process of clinicians in selecting the patients who may benefit from the addition of LRT. Further research and prospective studies should evaluate highly needed potential biomarkers, to better identify those patients who are most likely to benefit from the addition of LRT at the diagnosis in a homogenous population.
Supplementary Materials
The following supporting information can be downloaded at: https://www.mdpi.com/article/10.3390/cancers16010230/s1, Table S1: (a) Toxicities in patients with the intention of radical treatment stratified by cachexia and sarcopenia, (b) Toxicities in patients with sOMD NSCLC with the intention of radical treatment.
Author Contributions
Conceptualization, L.E.L.H. and D.K.M.d.R.; methodology, L.E.L.H. and D.K.M.d.R.; software, V.B. and M.J.; validation, W.R.P.H.v.d.W., R.L., J.D., L.E.L.H. and D.K.M.d.R.; formal analysis, V.B., M.J., L.E.L.H. and D.K.M.d.R.; investigation, V.B. and M.J.; resources, V.B., M.J., L.E.L.H. and D.K.M.d.R.; data curation, V.B., M.J., L.E.L.H. and D.K.M.d.R.; writing—original draft preparation, V.B. and M.J.; writing—review and editing, V.B., M.J., L.E.L.H. and D.K.M.d.R.; visualization, V.B., M.J., L.E.L.H. and D.K.M.d.R.; supervision, L.E.L.H. and D.K.M.d.R.; project administration, L.E.L.H. and D.K.M.d.R. All authors have read and agreed to the published version of the manuscript.
Funding
Hendriks received funding from the Wassink Hesp Foundation (no grant number) and from Pfizer (grant number #88250917).
Institutional Review Board Statement
This study was approved by the Maastricht UMC institutional review board (2021-2973, date of approval: 18 October 2021) and the Zuyderland medical ethics committee (Z2021168, date of approval: 21 June 2022).
Informed Consent Statement
Patients who were still alive signed informed consent (informed consent was waived for deceased patients by the ethics committee) and patients with a registered objection against the use of their data for research were excluded.
Data Availability Statement
The data presented in this study are available upon request from the corresponding author.
Conflicts of Interest
Wouter van de Worp: received funds paid to the institution from Danone Nutricia Research. Lizza Hendriks: outside of this manuscript personal fees as an invited speaker from Benecke, Medtalks, Medimix and VJOncology; personal fees for participation in mentorship programme funded by AstraZeneca; personal fees for travel support from Roche; personal fees as member of the committee that revised the Dutch guidelines on NSCLC, brain metastases and leptomeningeal metastases; fees paid to her institution for an educational webinar from Janssen; fees paid to her institution for advisory board membership from Advisory boards: Amgen, Boehringer Ingelheim, Lilly, Novartis, Pfizer, Takeda, Merck, Janssen, MSD, Anheart; fees paid to her institution as an invited speaker from AstraZeneca, Bayer, high5oncology, Lilly and Merck Sharp & Dohme (MSD); fees paid to her institution for interview sessions from Roche; fees paid to her institution for podcast appearance from Takeda; institutional research grants from Roche Genentech, AstraZeneca, Boehringer Ingelheim, Takeda, Merck, Pfizer, Novartis. Gilead under negotiation; institutional funding as a local principal investigator (PI) from AstraZeneca, GSK, Novartis, Merck, Roche, Takeda, Blueprint, Mirati, Abbvie, Gilead, MSD, Merck; non-remunerated roles as chair for metastatic NSCLC of the lung cancer group for EORTC (European Organisation for Research and Treatment of Cancer) and as the secretary of the studies foundation for NVALT (Nederlandse Vereniging van Artsen voor Longziekten en Tuberculose). Dirk de Ruysscher: outside of this manuscript research grant/support/Advisory Board: Institutional financial interests (no personal financial interests) from AstraZeneca, BMS, Beigene, Philips, Olink and Advisory Board: Institutional financial interests (no personal financial interests) for Eli-Lilly. Valentina Bartolomeo, Mandy Jongbloed, Ramon Langen, and Juliette Degens declare no conflict of interest.
References
- Siegel, R.L.; Miller, K.D.; Wagle, N.S.; Jemal, A. Cancer statistics, 2023. CA Cancer J. Clin. 2023, 73, 17–48. [Google Scholar] [CrossRef] [PubMed]
- Dingemans, A.-M.C.; Hendriks, L.E.L.; Berghmans, T.; Levy, A.; Hasan, B.; Faivre-Finn, C.; Giaj-Levra, M.; Giaj-Levra, N.; Girard, N.; Greillier, L.; et al. Definition of Synchronous Oligometastatic Non–Small Cell Lung Cancer—A Consensus Report. J. Thorac. Oncol. 2019, 14, 2109–2119. [Google Scholar] [CrossRef] [PubMed]
- Hendriks, L.E.L.; Dooms, C.; Berghmans, T.; Novello, S.; Levy, A.; De Ruysscher, D.; Hasan, B.; Giaj Levra, M.; Giaj Levra, N.; Besse, B.; et al. Defining oligometastatic non-small cell lung cancer: A simulated multidisciplinary expert opinion. Eur. J. Cancer 2019, 123, 28–35. [Google Scholar] [CrossRef] [PubMed]
- Hellman, S.; Weichselbaum, R.R. Oligometastases. J. Clin. Oncol. 1995, 13, 8–10. [Google Scholar] [CrossRef] [PubMed]
- Gomez, D.R.; Tang, C.; Zhang, J.; Blumenschein, G.R., Jr.; Hernandez, M.; Lee, J.J.; Ye, R.; Palma, D.A.; Louie, A.V.; Camidge, D.R.; et al. Local Consolidative Therapy vs. Maintenance Therapy or Observation for Patients with Oligometastatic Non-Small-Cell Lung Cancer: Long-Term Results of a Multi-Institutional, Phase II, Randomized Study. J. Clin. Oncol. 2019, 37, 1558–1565. [Google Scholar] [CrossRef] [PubMed]
- Iyengar, P.; Wardak, Z.; Gerber, D.E.; Tumati, V.; Ahn, C.; Hughes, R.S.; Dowell, J.E.; Cheedella, N.; Nedzi, L.; Westover, K.D.; et al. Consolidative Radiotherapy for Limited Metastatic Non-Small-Cell Lung Cancer: A Phase 2 Randomized Clinical Trial. JAMA Oncol. 2018, 4, e173501. [Google Scholar] [CrossRef] [PubMed]
- De Ruysscher, D.; Wanders, R.; Hendriks, L.E.; van Baardwijk, A.; Reymen, B.; Houben, R.; Bootsma, G.; Pitz, C.; van Eijsden, L.; Dingemans, A.C. Progression-Free Survival and Overall Survival beyond 5 Years of NSCLC Patients with Synchronous Oligometastases Treated in a Prospective Phase II Trial (NCT 01282450). J. Thorac. Oncol. 2018, 13, 1958–1961. [Google Scholar] [CrossRef]
- Hendriks, L.E.; Kerr, K.M.; Menis, J.; Mok, T.S.; Nestle, U.; Passaro, A.; Peters, S.; Planchard, D.; Smit, E.F.; Solomon, B.J.; et al. Oncogene-addicted metastatic non-small-cell lung cancer: ESMO Clinical Practice Guideline for diagnosis, treatment and follow-up. Ann. Oncol. 2023, 34, 339–357. [Google Scholar] [CrossRef]
- National Comprehensive Cancer Network. Non-Small Cell Lung Cancer. Version 3.2023. 2023. Available online: https://www.nccn.org/guidelines/guidelines-detail?category=1&id=1450 (accessed on 26 October 2023).
- Iyengar, P.; All, S.; Berry, M.F.; Boike, T.P.; Bradfield, L.; Dingemans, A.C.; Feldman, J.; Gomez, D.R.; Hesketh, P.J.; Jabbour, S.K.; et al. Treatment of Oligometastatic Non-Small Cell Lung Cancer: An ASTRO/ESTRO Clinical Practice Guideline. Pract. Radiat. Oncol. 2023, 13, 393–412. [Google Scholar] [CrossRef]
- Bauml, J.M.; Mick, R.; Ciunci, C.; Aggarwal, C.; Davis, C.; Evans, T.; Deshpande, C.; Miller, L.; Patel, P.; Alley, E.; et al. Pembrolizumab after Completion of Locally Ablative Therapy for Oligometastatic Non-Small Cell Lung Cancer: A Phase 2 Trial. JAMA Oncol. 2019, 5, 1283–1290. [Google Scholar] [CrossRef]
- Remon, J.; Menis, J.; Levy, A.; De Ruysscher, D.K.M.; Hendriks, L.E.L. How to optimize the incorporation of immunotherapy in trials for oligometastatic non-small cell lung cancer: A narrative review. Transl. Lung Cancer Res. 2021, 10, 3486–3502. [Google Scholar] [CrossRef] [PubMed]
- Deutsch, E.; Chargari, C.; Galluzzi, L.; Kroemer, G. Optimising efficacy and reducing toxicity of anticancer radioimmunotherapy. Lancet Oncol. 2019, 20, e452–e463. [Google Scholar] [CrossRef] [PubMed]
- Wang, X.-S.; Bai, Y.-F.; Verma, V.; Yu, R.-L.; Tian, W.; Ao, R.; Deng, Y.; Zhu, X.-Q.; Liu, H.; Pan, H.-X.; et al. Randomized Trial of First-Line Tyrosine Kinase Inhibitor with or without Radiotherapy for Synchronous Oligometastatic EGFR-Mutated Non-Small Cell Lung Cancer. JNCI J. Natl. Cancer Inst. 2022, 115, 742–748. [Google Scholar] [CrossRef] [PubMed]
- Giaj-Levra, N.; Giaj-Levra, M.; Durieux, V.; Novello, S.; Besse, B.; Hasan, B.; Hendriks, L.E.; Levy, A.; Dingemans, A.C.; Berghmans, T. Defining Synchronous Oligometastatic Non-Small Cell Lung Cancer: A Systematic Review. J. Thorac. Oncol. 2019, 14, 2053–2061. [Google Scholar] [CrossRef] [PubMed]
- Nakamura, R.; Inage, Y.; Tobita, R.; Yoneyama, S.; Numata, T.; Ota, K.; Yanai, H.; Endo, T.; Inadome, Y.; Sakashita, S.; et al. Sarcopenia in Resected NSCLC: Effect on Postoperative Outcomes. J. Thorac. Oncol. 2018, 13, 895–903. [Google Scholar] [CrossRef] [PubMed]
- Morita-Tanaka, S.; Yamada, T.; Takayama, K. The landscape of cancer cachexia in advanced non-small cell lung cancer: A narrative review. Transl. Lung Cancer Res. 2023, 12, 168–180. [Google Scholar] [CrossRef]
- Srdic, D.; Plestina, S.; Sverko-Peternac, A.; Nikolac, N.; Simundic, A.-M.; Samarzija, M. Cancer cachexia, sarcopenia and biochemical markers in patients with advanced non-small cell lung cancer—Chemotherapy toxicity and prognostic value. Support. Care Cancer 2016, 24, 4495–4502. [Google Scholar] [CrossRef]
- Madeddu, C.; Busquets, S.; Donisi, C.; Lai, E.; Pretta, A.; López-Soriano, F.J.; Argilés, J.M.; Scartozzi, M.; Macciò, A. Effect of Cancer-Related Cachexia and Associated Changes in Nutritional Status, Inflammatory Status, and Muscle Mass on Immunotherapy Efficacy and Survival in Patients with Advanced Non-Small Cell Lung Cancer. Cancers 2023, 15, 1076. [Google Scholar] [CrossRef]
- Lyu, J.; Yang, N.; Xiao, L.; Nie, X.; Xiong, J.; Liu, Y.; Zhang, M.; Zhang, H.; Tang, C.; Pan, S.; et al. Prognostic value of sarcopenia in patients with lung cancer treated with epidermal growth factor receptor tyrosine kinase inhibitors or immune checkpoint inhibitors. Front. Nutr. 2023, 10, 1113875. [Google Scholar] [CrossRef]
- Chen, X.; Hou, L.; Shen, Y.; Wu, X.; Dong, B.; Hao, Q. The Role of Baseline Sarcopenia Index in Predicting Chemotherapy-Induced Undesirable Effects and Mortality in Older People with Stage III or IV Non-Small Cell Lung Cancer. J. Nutr. Health Aging 2021, 25, 878–882. [Google Scholar] [CrossRef]
- Argilés, J.M.; Betancourt, A.; Guàrdia-Olmos, J.; Peró-Cebollero, M.; López-Soriano, F.J.; Madeddu, C.; Serpe, R.; Busquets, S. Validation of the CAchexia SCOre (CASCO). Staging cancer patients: The use of miniCASCO as a simplified tool. Front. Physiol. 2017, 8, 92. [Google Scholar] [CrossRef] [PubMed]
- Matsuo, N.; Azuma, K.; Murotani, K.; Murata, D.; Matama, G.; Kawahara, A.; Kojima, T.; Tokito, T.; Hoshino, T. Prognostic effect of cachexia in patients with non-small cell lung cancer receiving immune checkpoint inhibitors. Thorac. Cancer 2023, 14, 1362–1367. [Google Scholar] [CrossRef] [PubMed]
- Morimoto, K.; Uchino, J.; Yokoi, T.; Kijima, T.; Goto, Y.; Nakao, A.; Hibino, M.; Takeda, T.; Yamaguchi, H.; Takumi, C.; et al. Impact of cancer cachexia on the therapeutic outcome of combined chemoimmunotherapy in patients with non-small cell lung cancer: A retrospective study. Oncoimmunology 2021, 10, 1950411. [Google Scholar] [CrossRef] [PubMed]
- Burtin, C.; Bezuidenhout, J.; Sanders, K.J.C.; Dingemans, A.C.; Schols, A.; Peeters, S.T.H.; Spruit, M.A.; De Ruysscher, D.K.M. Handgrip weakness, low fat-free mass, and overall survival in non-small cell lung cancer treated with curative-intent radiotherapy. J. Cachexia Sarcopenia Muscle 2020, 11, 424–431. [Google Scholar] [CrossRef] [PubMed]
- Cederholm, T.; Jensen, G.L.; Correia, M.; Gonzalez, M.C.; Fukushima, R.; Higashiguchi, T.; Baptista, G.; Barazzoni, R.; Blaauw, R.; Coats, A.J.S.; et al. GLIM criteria for the diagnosis of malnutrition—A consensus report from the global clinical nutrition community. J Cachexia Sarcopenia Muscle 2019, 10, 207–217. [Google Scholar] [CrossRef]
- Spruit, M.A.; Sillen, M.J.; Groenen, M.T.; Wouters, E.F.; Franssen, F.M. New normative values for handgrip strength: Results from the UK Biobank. J. Am. Med. Dir. Assoc. 2013, 14, 775.E5–775.E11. [Google Scholar] [CrossRef]
- Bolte, F.J.; McTavish, S.; Wakefield, N.; Shantzer, L.; Hubbard, C.; Krishnaraj, A.; Novicoff, W.; Gentzler, R.D.; Hall, R.D. Association of sarcopenia with survival in advanced NSCLC patients receiving concurrent immunotherapy and chemotherapy. Front. Oncol. 2022, 12, 986236. [Google Scholar] [CrossRef]
- Hasenauer, A.; Forster, C.; Hungerbühler, J.; Perentes, J.Y.; Abdelnour-Berchtold, E.; Koerfer, J.; Krueger, T.; Becce, F.; Gonzalez, M. CT-Derived Sarcopenia and Outcomes after Thoracoscopic Pulmonary Resection for Non-Small Cell Lung Cancer. Cancers 2023, 15, 790. [Google Scholar] [CrossRef]
- Karaman, E.; Hursoy, N.; Goksel, S. The Effect of Sarcopenia and Metabolic PET-CT Parameters on Survival in Locally Advanced Non-Small Cell Lung Carcinoma. Nutr. Cancer 2023, 75, 286–295. [Google Scholar] [CrossRef]
- Katsui, K.; Ogata, T.; Sugiyama, S.; Yoshio, K.; Kuroda, M.; Hiraki, T.; Kiura, K.; Maeda, Y.; Toyooka, S.; Kanazawa, S. Sarcopenia is associated with poor prognosis after chemoradiotherapy in patients with stage III non-small-cell lung cancer: A retrospective analysis. Sci. Rep. 2021, 11, 11882. [Google Scholar] [CrossRef]
- Yuan, H.; Tan, X.; Sun, X.; He, L.; Li, D.; Jiang, L. Role of 18F-FDG PET/CT and sarcopenia in untreated non-small cell lung cancer with advanced stage. Jpn. J. Radiol. 2023, 41, 521–530. [Google Scholar] [CrossRef] [PubMed]
- Eisenhauer, E.A.; Therasse, P.; Bogaerts, J.; Schwartz, L.H.; Sargent, D.; Ford, R.; Dancey, J.; Arbuck, S.; Gwyther, S.; Mooney, M.; et al. New response evaluation criteria in solid tumours: Revised RECIST guideline (version 1.1). Eur. J. Cancer 2009, 45, 228–247. [Google Scholar] [CrossRef] [PubMed]
- Fearon, K.; Strasser, F.; Anker, S.D.; Bosaeus, I.; Bruera, E.; Fainsinger, R.L.; Jatoi, A.; Loprinzi, C.; MacDonald, N.; Mantovani, G.; et al. Definition and classification of cancer cachexia: An international consensus. Lancet Oncol. 2011, 12, 489–495. [Google Scholar] [CrossRef] [PubMed]
- Cruz-Jentoft, A.J.; Bahat, G.; Bauer, J.; Boirie, Y.; Bruyère, O.; Cederholm, T.; Cooper, C.; Landi, F.; Rolland, Y.; Sayer, A.A.; et al. Sarcopenia: Revised European consensus on definition and diagnosis. Age Ageing 2018, 48, 16–31. [Google Scholar] [CrossRef] [PubMed]
- Portal, D.; Hofstetter, L.; Eshed, I.; Dan-Lantsman, C.; Sella, T.; Urban, D.; Onn, A.; Bar, J.; Segal, G. L3 skeletal muscle index (L3SMI) is a surrogate marker of sarcopenia and frailty in non-small cell lung cancer patients. Cancer Manag. Res. 2019, 11, 2579–2588. [Google Scholar] [CrossRef] [PubMed]
- Cruz-Jentoft, A.J.; Baeyens, J.P.; Bauer, J.M.; Boirie, Y.; Cederholm, T.; Landi, F.; Martin, F.C.; Michel, J.P.; Rolland, Y.; Schneider, S.M.; et al. Sarcopenia: European consensus on definition and diagnosis: Report of the European Working Group on Sarcopenia in Older People. Age Ageing 2010, 39, 412–423. [Google Scholar] [CrossRef] [PubMed]
- Gomez-Perez, S.L.; Haus, J.M.; Sheean, P.; Patel, B.; Mar, W.; Chaudhry, V.; McKeever, L.; Braunschweig, C. Measuring Abdominal Circumference and Skeletal Muscle from a Single Cross-Sectional Computed Tomography Image. J. Parenter. Enter. Nutr. 2016, 40, 308–318. [Google Scholar] [CrossRef]
- Minami, S.; Ihara, S.; Tanaka, T.; Komuta, K. Sarcopenia and Visceral Adiposity Did Not Affect Efficacy of Immune-Checkpoint Inhibitor Monotherapy for Pretreated Patients with Advanced Non-Small Cell Lung Cancer. World J. Oncol. 2020, 11, 9–22. [Google Scholar] [CrossRef]
- Haik, L.; Gonthier, A.; Quivy, A.; Gross-goupil, M.; Veillon, R.; Frison, E.; Ravaud, A.; Domblides, C.; Daste, A. The impact of sarcopenia on the efficacy and safety of immune checkpoint inhibitors in patients with solid tumours. Acta Oncol. 2021, 60, 1597–1603. [Google Scholar] [CrossRef]
- Nishioka, N.; Naito, T.; Notsu, A.; Mori, K.; Kodama, H.; Miyawaki, E.; Miyawaki, T.; Mamesaya, N.; Kobayashi, H.; Omori, S.; et al. Unfavorable impact of decreased muscle quality on the efficacy of immunotherapy for advanced non-small cell lung cancer. Cancer Med. 2021, 10, 247–256. [Google Scholar] [CrossRef]
- Roch, B.; Coffy, A.; Jean-Baptiste, S.; Palaysi, E.; Daures, J.-P.; Pujol, J.-L.; Bommart, S. Cachexia—Sarcopenia as a determinant of disease control rate and survival in non-small lung cancer patients receiving immune-checkpoint inhibitors. Lung Cancer 2020, 143, 19–26. [Google Scholar] [CrossRef] [PubMed]
- Nie, X.; Zhang, P.; Gao, J.-Y.; Cheng, G.; Liu, W.; Li, L. Sarcopenia as a predictor of initial administration dose of afatinib in patients with advanced non-small cell lung cancer. Thorac. Cancer 2021, 12, 1824–1830. [Google Scholar] [CrossRef] [PubMed]
- Naqash, A.R.; McCallen, J.D.; Mi, E.; Iivanainen, S.; Marie, M.A.; Gramenitskaya, D.; Clark, J.; Koivunen, J.P.; Macherla, S.; Jonnalagadda, S.; et al. Increased interleukin-6/C-reactive protein levels are associated with the upregulation of the adenosine pathway and serve as potential markers of therapeutic resistance to immune checkpoint inhibitor-based therapies in non-small cell lung cancer. J. Immunother. Cancer 2023, 11, e007310. [Google Scholar] [CrossRef] [PubMed]
- Diker, O.; Olgun, P.; Balyemez, U.; Sigit Ikiz, S. Development of a Novel Predictive-Prognostic Scoring Index for Immune Checkpoint Inhibitors in Advanced Non-small Cell Lung Cancer. Cureus 2023, 15, e33234. [Google Scholar] [CrossRef]
- Antoun, S.; Morel, H.; Souquet, P.J.; Surmont, V.; Planchard, D.; Bonnetain, F.; Foucher, P.; Egenod, T.; Krakowski, I.; Gaudin, H.; et al. Staging of nutrition disorders in non-small-cell lung cancer patients: Utility of skeletal muscle mass assessment. J. Cachexia Sarcopenia Muscle 2019, 10, 782–793. [Google Scholar] [CrossRef]
- Cong, M.; Song, C.; Xu, H.; Song, C.; Wang, C.; Fu, Z.; Ba, Y.; Wu, J.; Xie, C.; Chen, G.; et al. The patient-generated subjective global assessment is a promising screening tool for cancer cachexia. BMJ Support. Palliat. Care 2022, 12, e39–e46. [Google Scholar] [CrossRef]
- Minichsdorfer, C.; Gleiss, A.; Aretin, M.B.; Schmidinger, M.; Fuereder, T. Serum parameters as prognostic biomarkers in a real world cancer patient population treated with anti PD-1/PD-L1 therapy. Ann. Med. 2022, 54, 1339–1349. [Google Scholar] [CrossRef]
- Menekse, S.; Kut, E.; Almuradova, E. Elevated serum lactate dehydrogenase to albumin ratio is a useful poor prognostic predictor of nivolumab in patients with non-small cell lung cancer. Eur. Rev. Med. Pharmacol. Sci. 2023, 27 (Suppl. S5), 86–94. [Google Scholar]
- Bozzetti, F. Forcing the vicious circle: Sarcopenia increases toxicity, decreases response to chemotherapy and worsens with chemotherapy. Ann. Oncol. 2017, 28, 2107–2118. [Google Scholar] [CrossRef]
- Deng, H.-Y.; Chen, Z.-J.; Qiu, X.-M.; Zhu, D.-X.; Tang, X.-J.; Zhou, Q. Sarcopenia and prognosis of advanced cancer patients receiving immune checkpoint inhibitors: A comprehensive systematic review and meta-analysis. Nutrition 2021, 90, 111345. [Google Scholar] [CrossRef]
Disclaimer/Publisher’s Note: The statements, opinions and data contained in all publications are solely those of the individual author(s) and contributor(s) and not of MDPI and/or the editor(s). MDPI and/or the editor(s) disclaim responsibility for any injury to people or property resulting from any ideas, methods, instructions or products referred to in the content. |
© 2024 by the authors. Licensee MDPI, Basel, Switzerland. This article is an open access article distributed under the terms and conditions of the Creative Commons Attribution (CC BY) license (https://creativecommons.org/licenses/by/4.0/).