

The Subtype Identity of Testicular Cancer Cells Determines Their Immunostimulatory Activity in a Coculture Model

 and
and 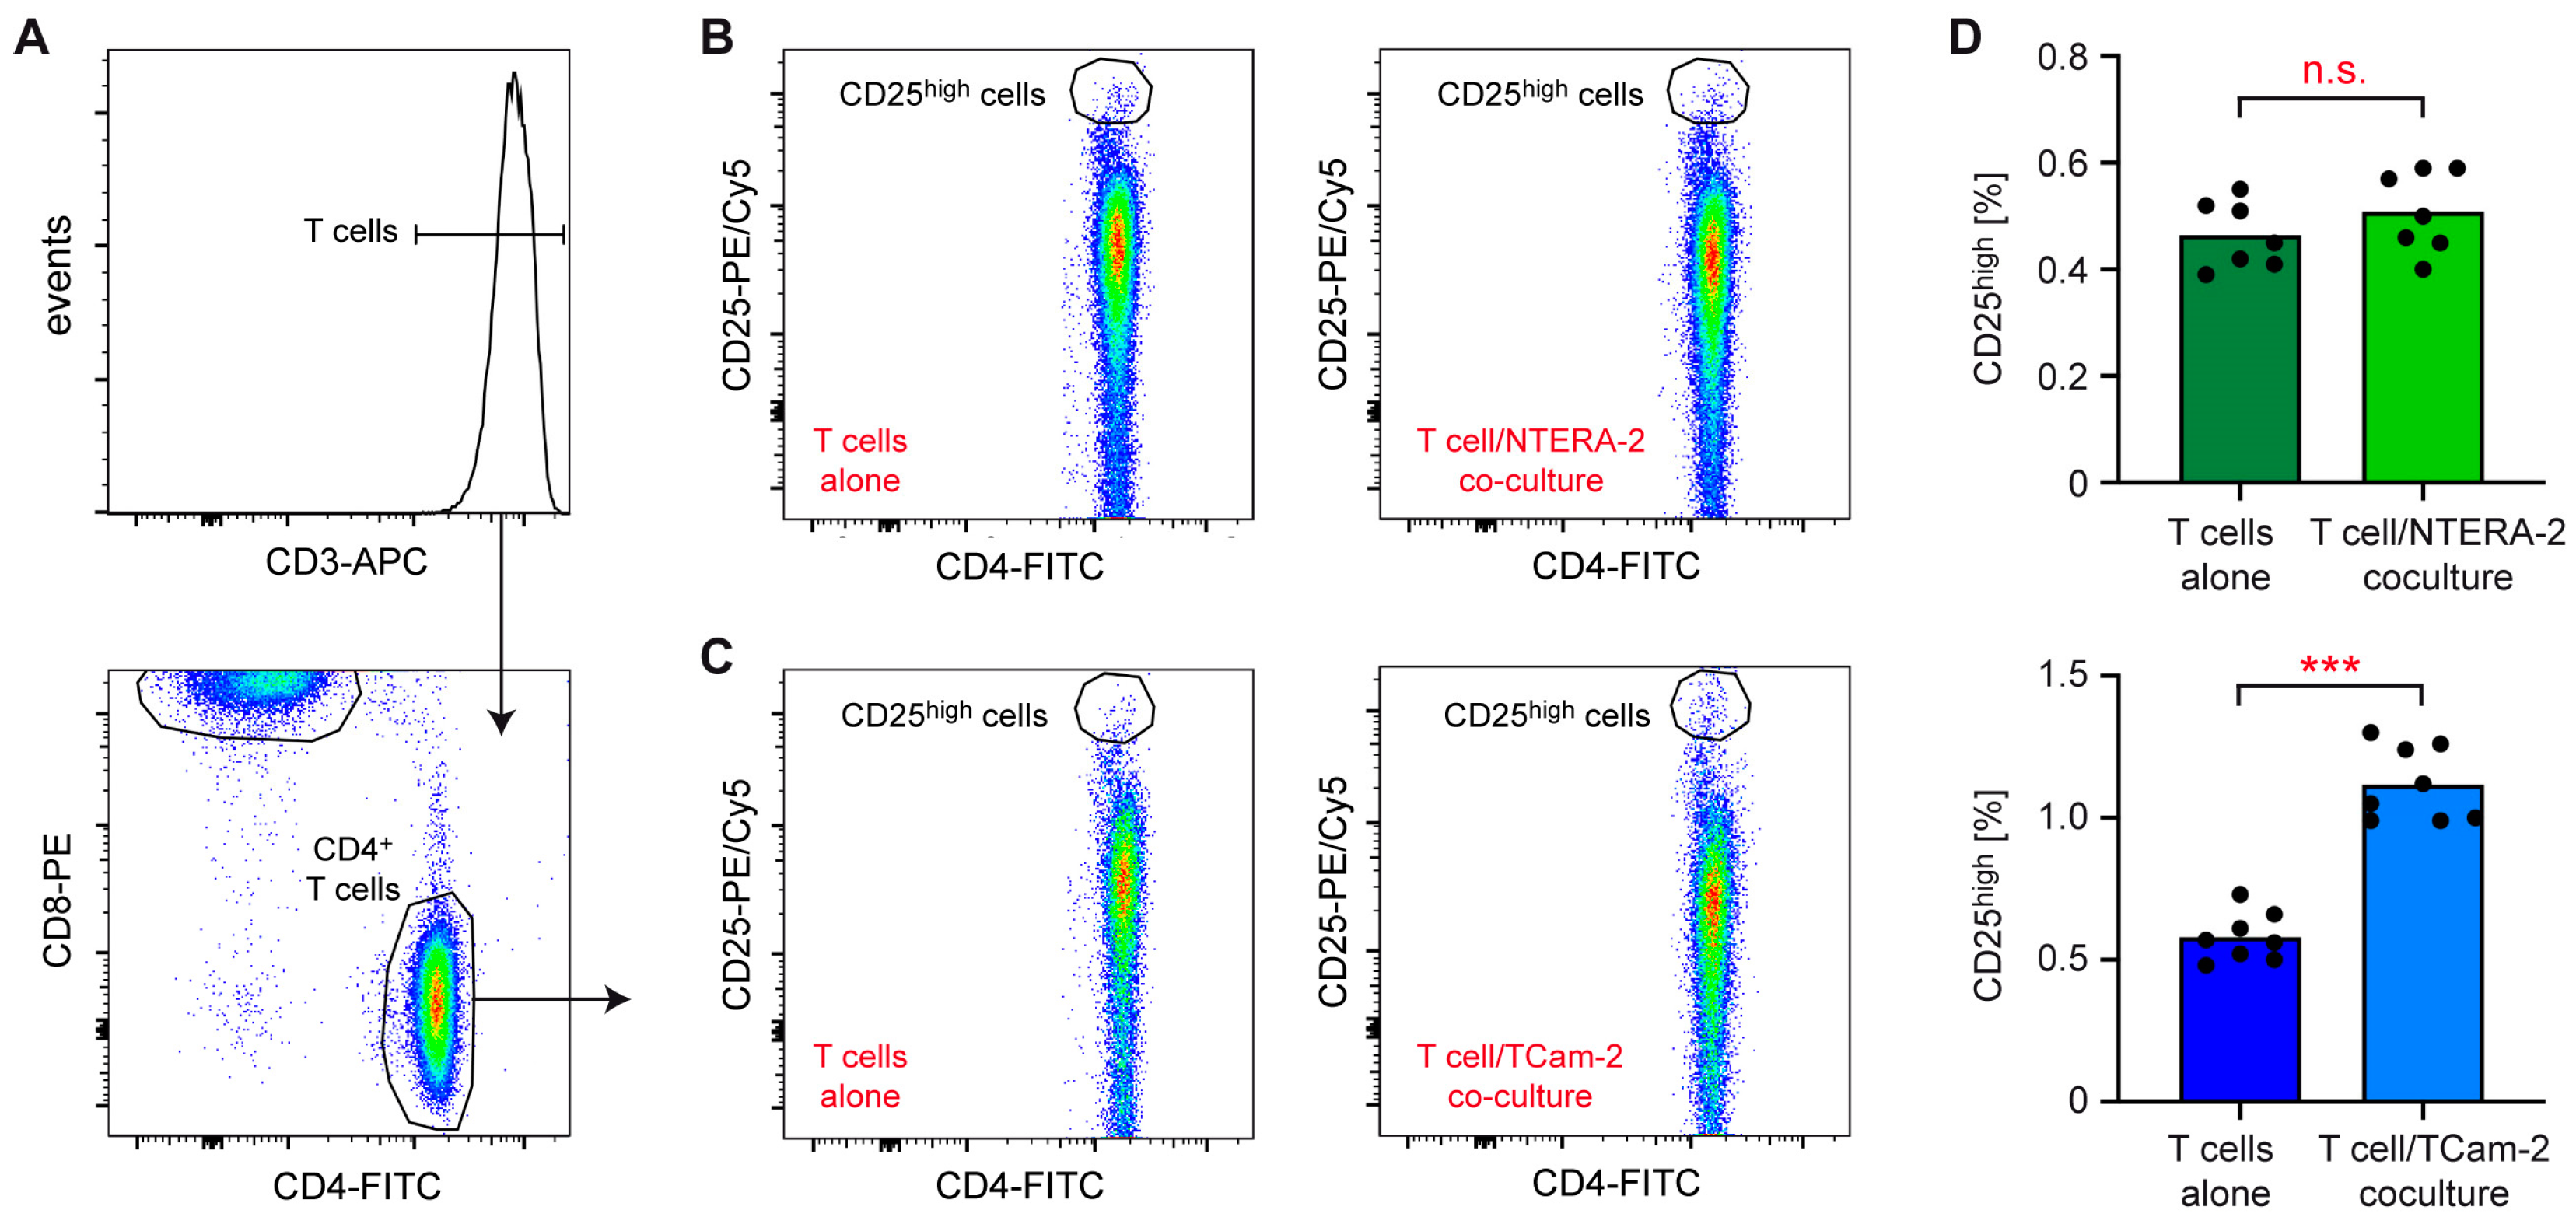
Abstract
Simple Summary
Abstract
1. Introduction
2. Materials and Methods
2.1. Culturing of Tumor Cell Lines
2.2. Isolation of T Cells and Monocytes from Human Buffy Coats
2.3. Coculture Experiments
2.4. Flow Cytometry
2.5. ELISA
2.6. Quantitative RT-PCR
2.7. Statistical Analysis
3. Results
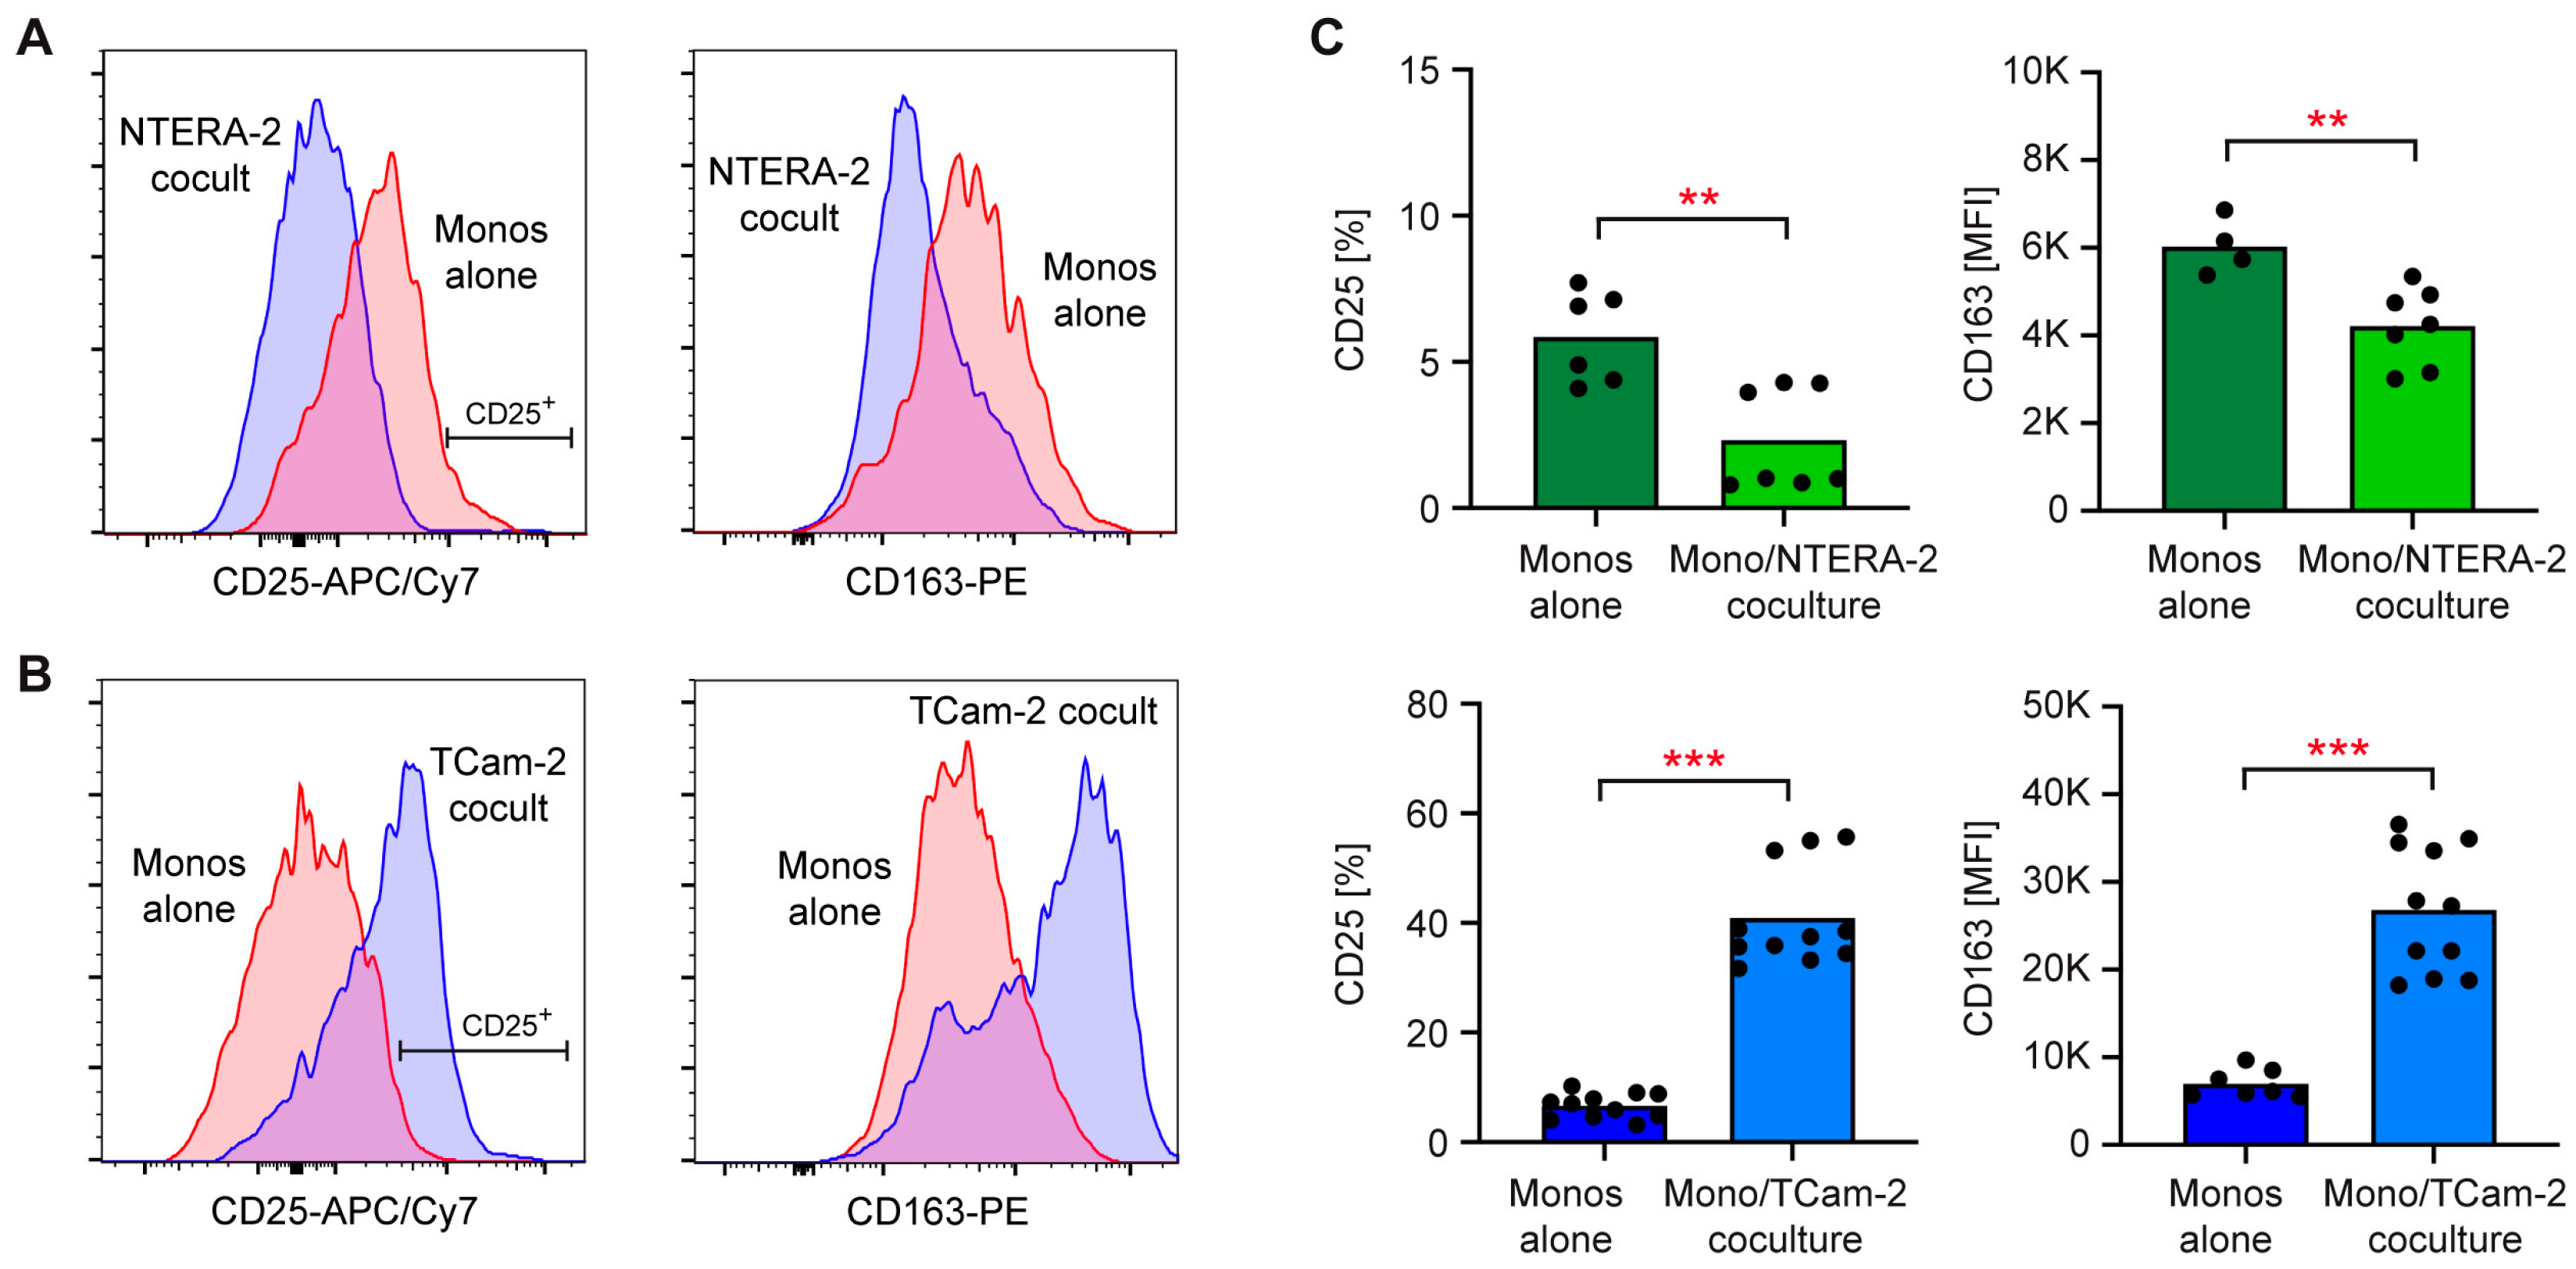
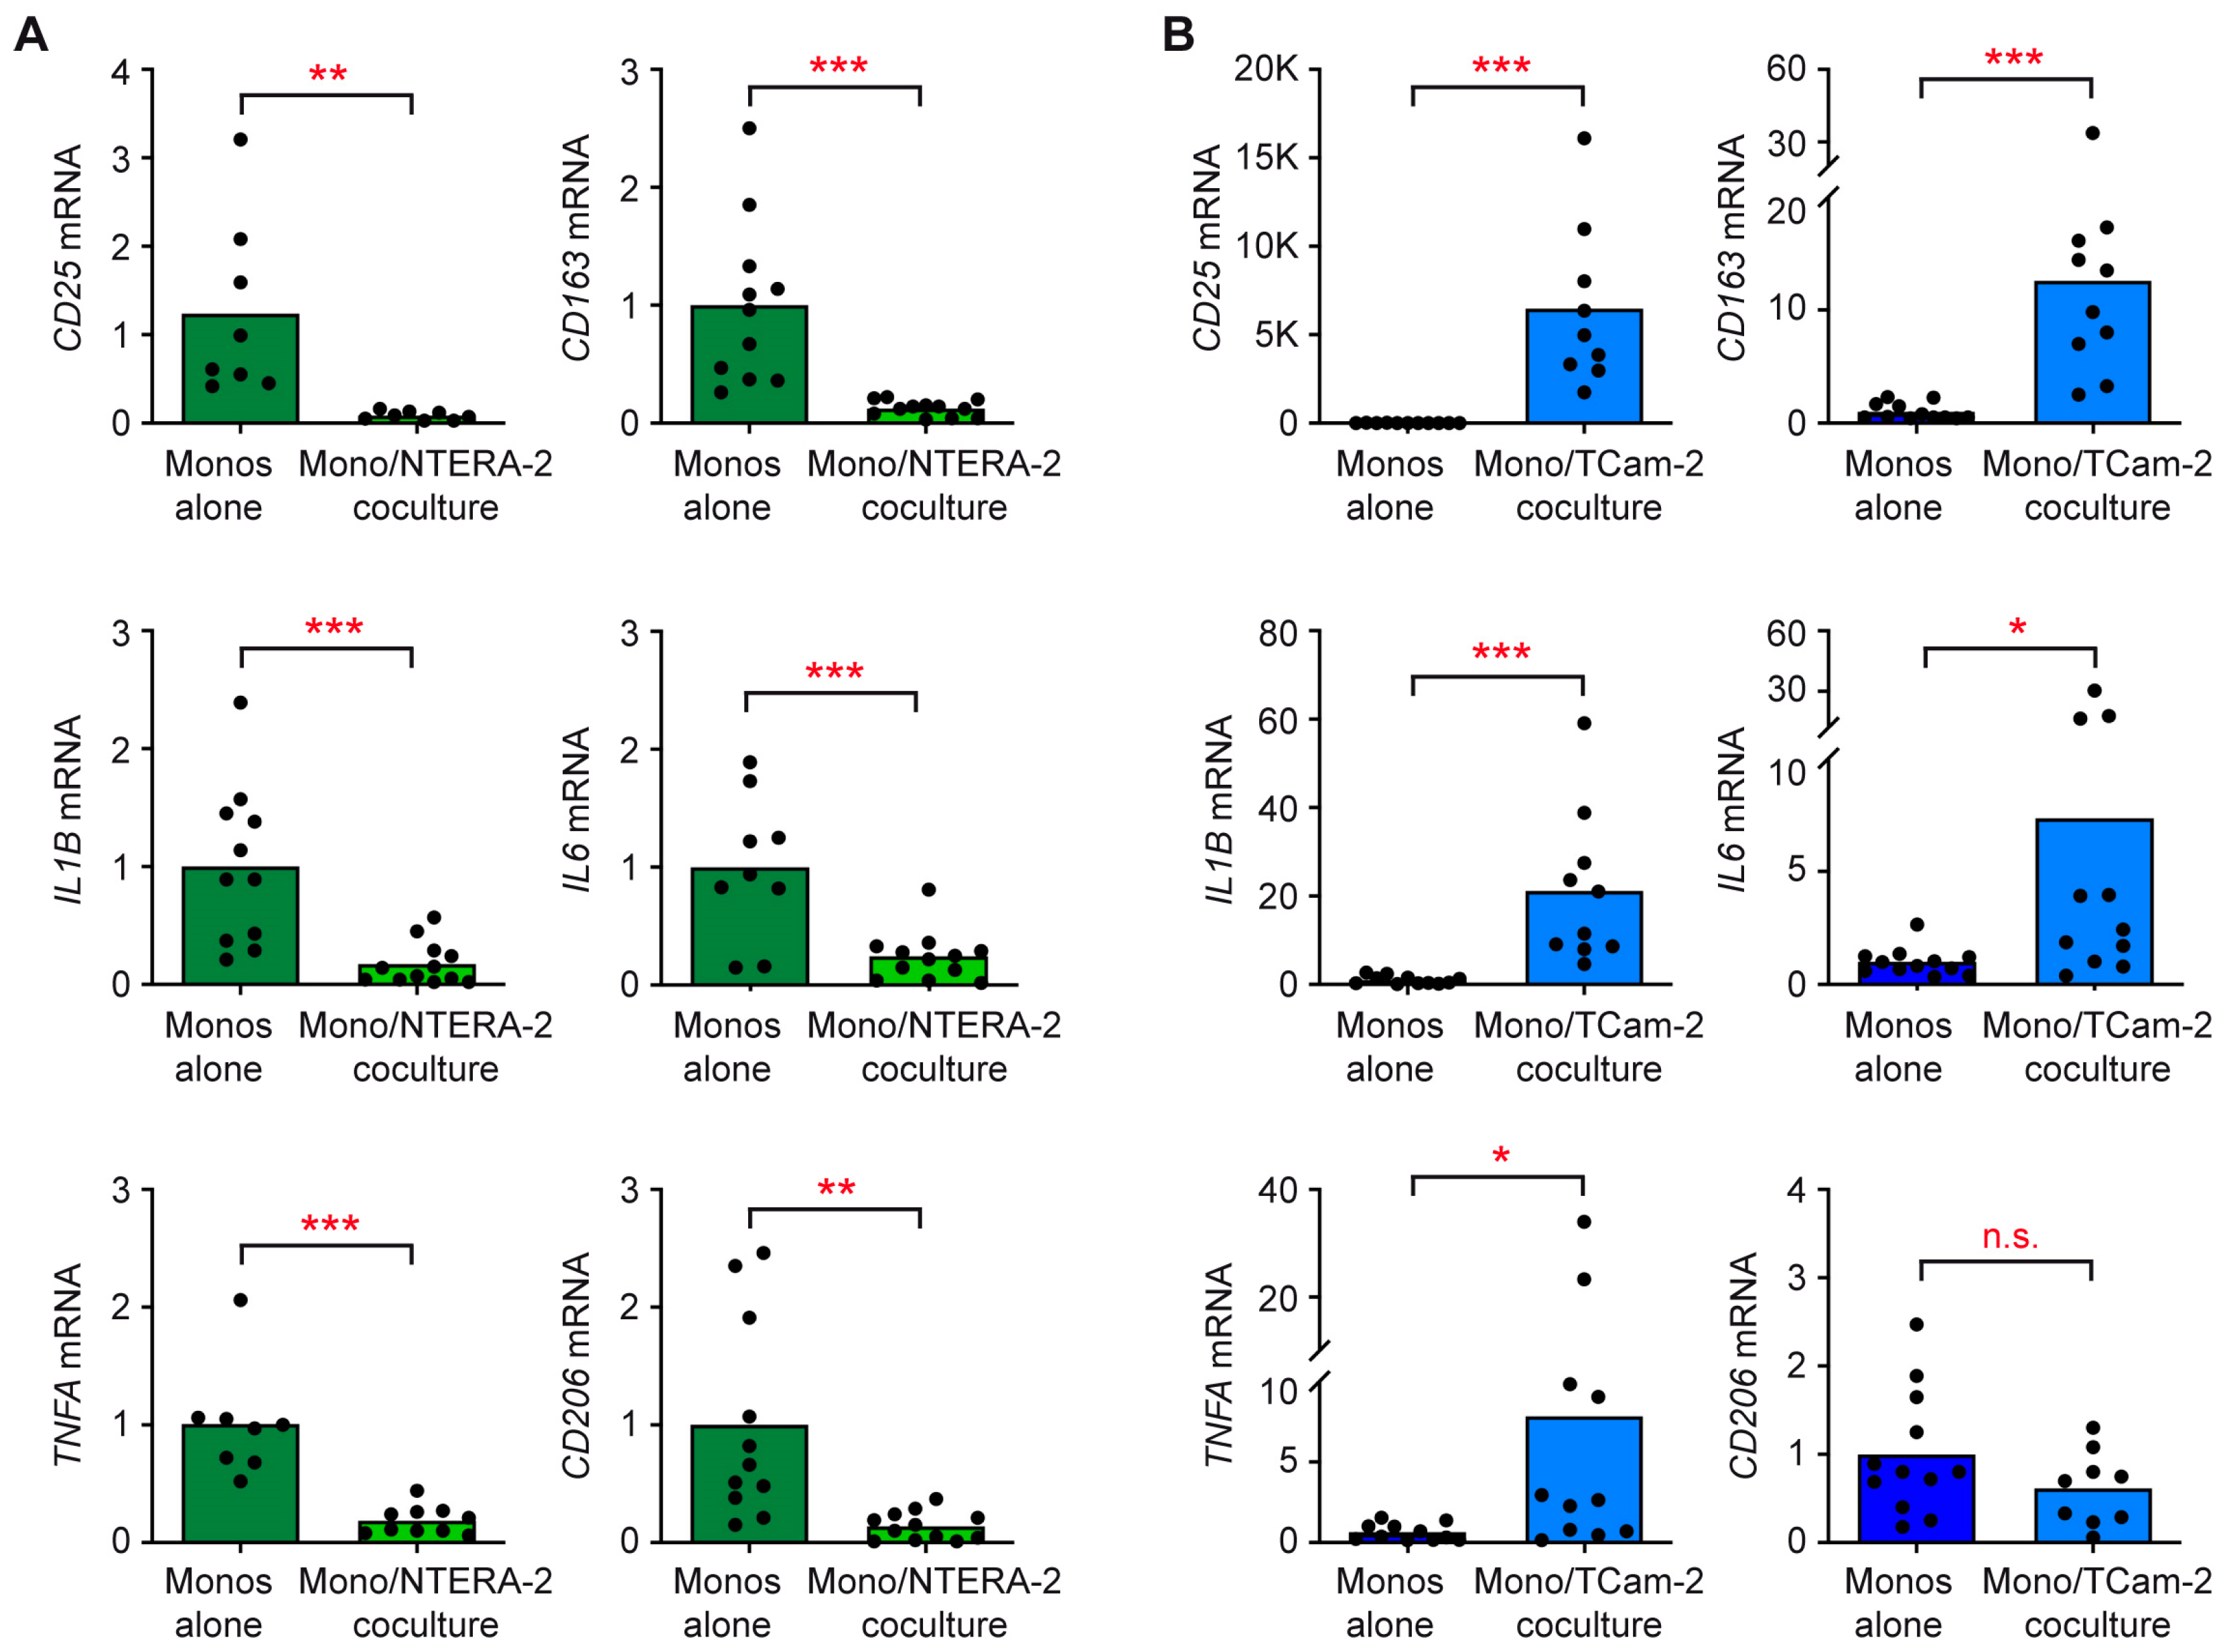
3.1. NTERA-2 and TCam-2 Cells Differ in Their Capability to Activate T Cells and Monocytes in Coculture
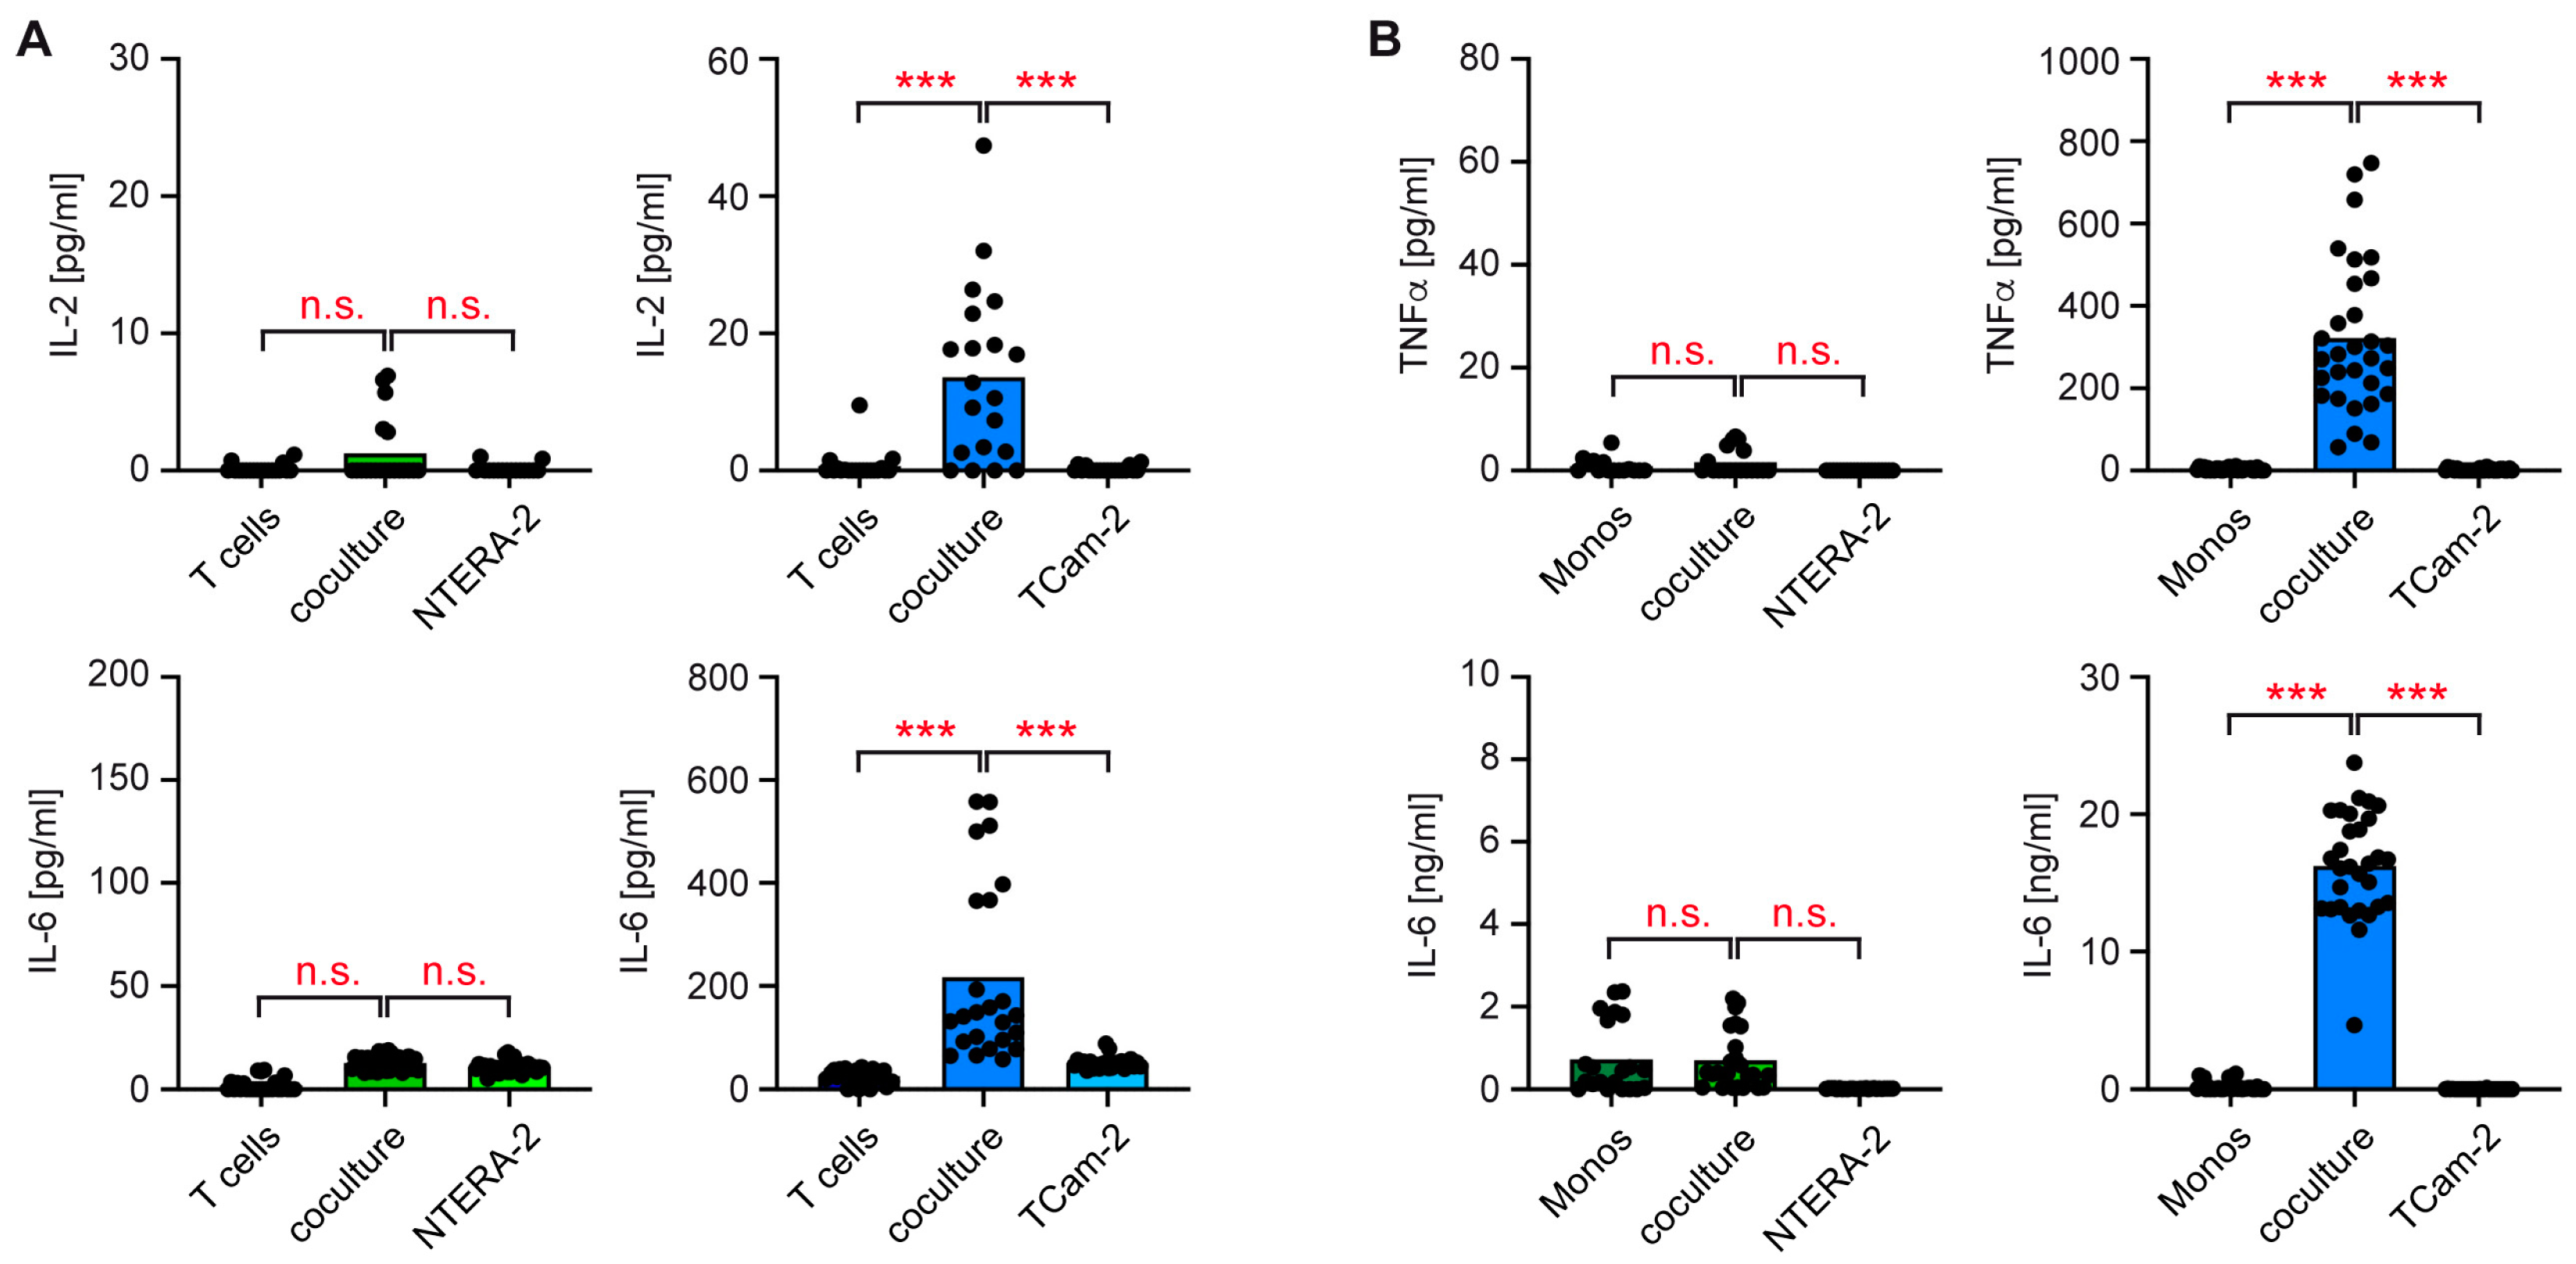
3.2. T Cells and Monocytes Fail to Secrete Pro-Inflammatory Cytokines in Cocultures with NTERA-2 Cells
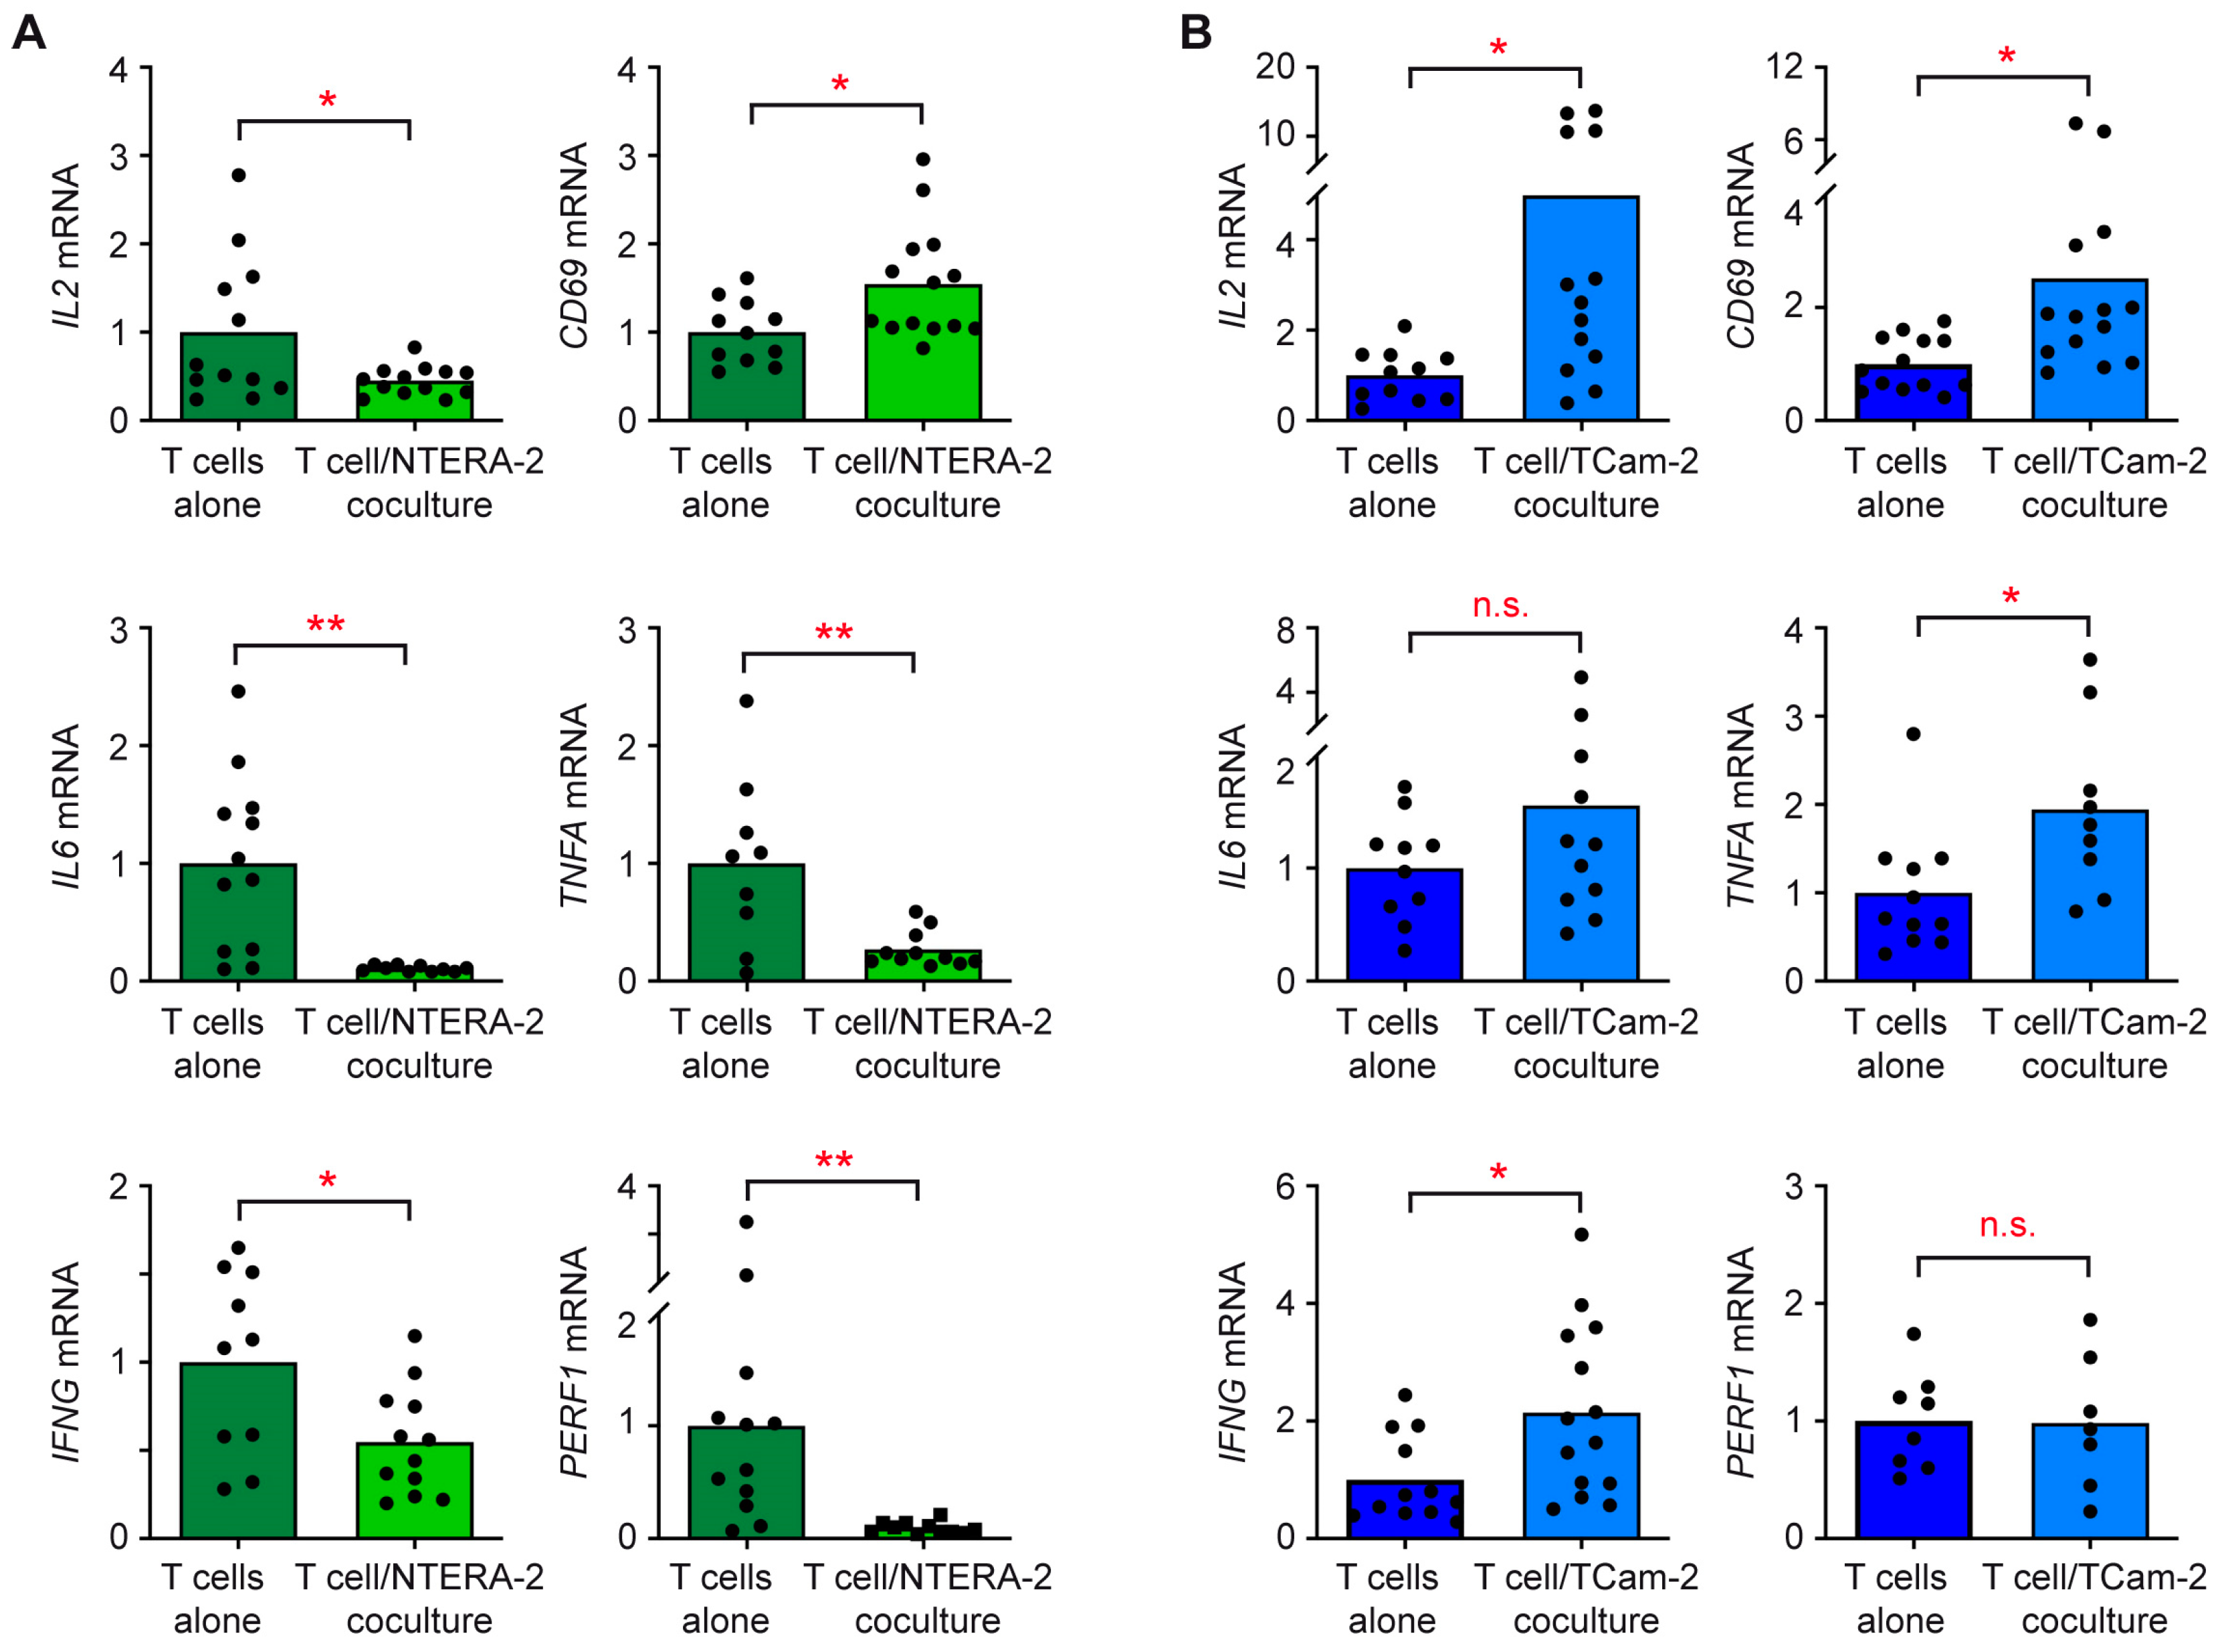
3.3. The Individual Response of T Cells and Monocytes to TGCC Subtypes Is Linked to Their Differential Gene Expression
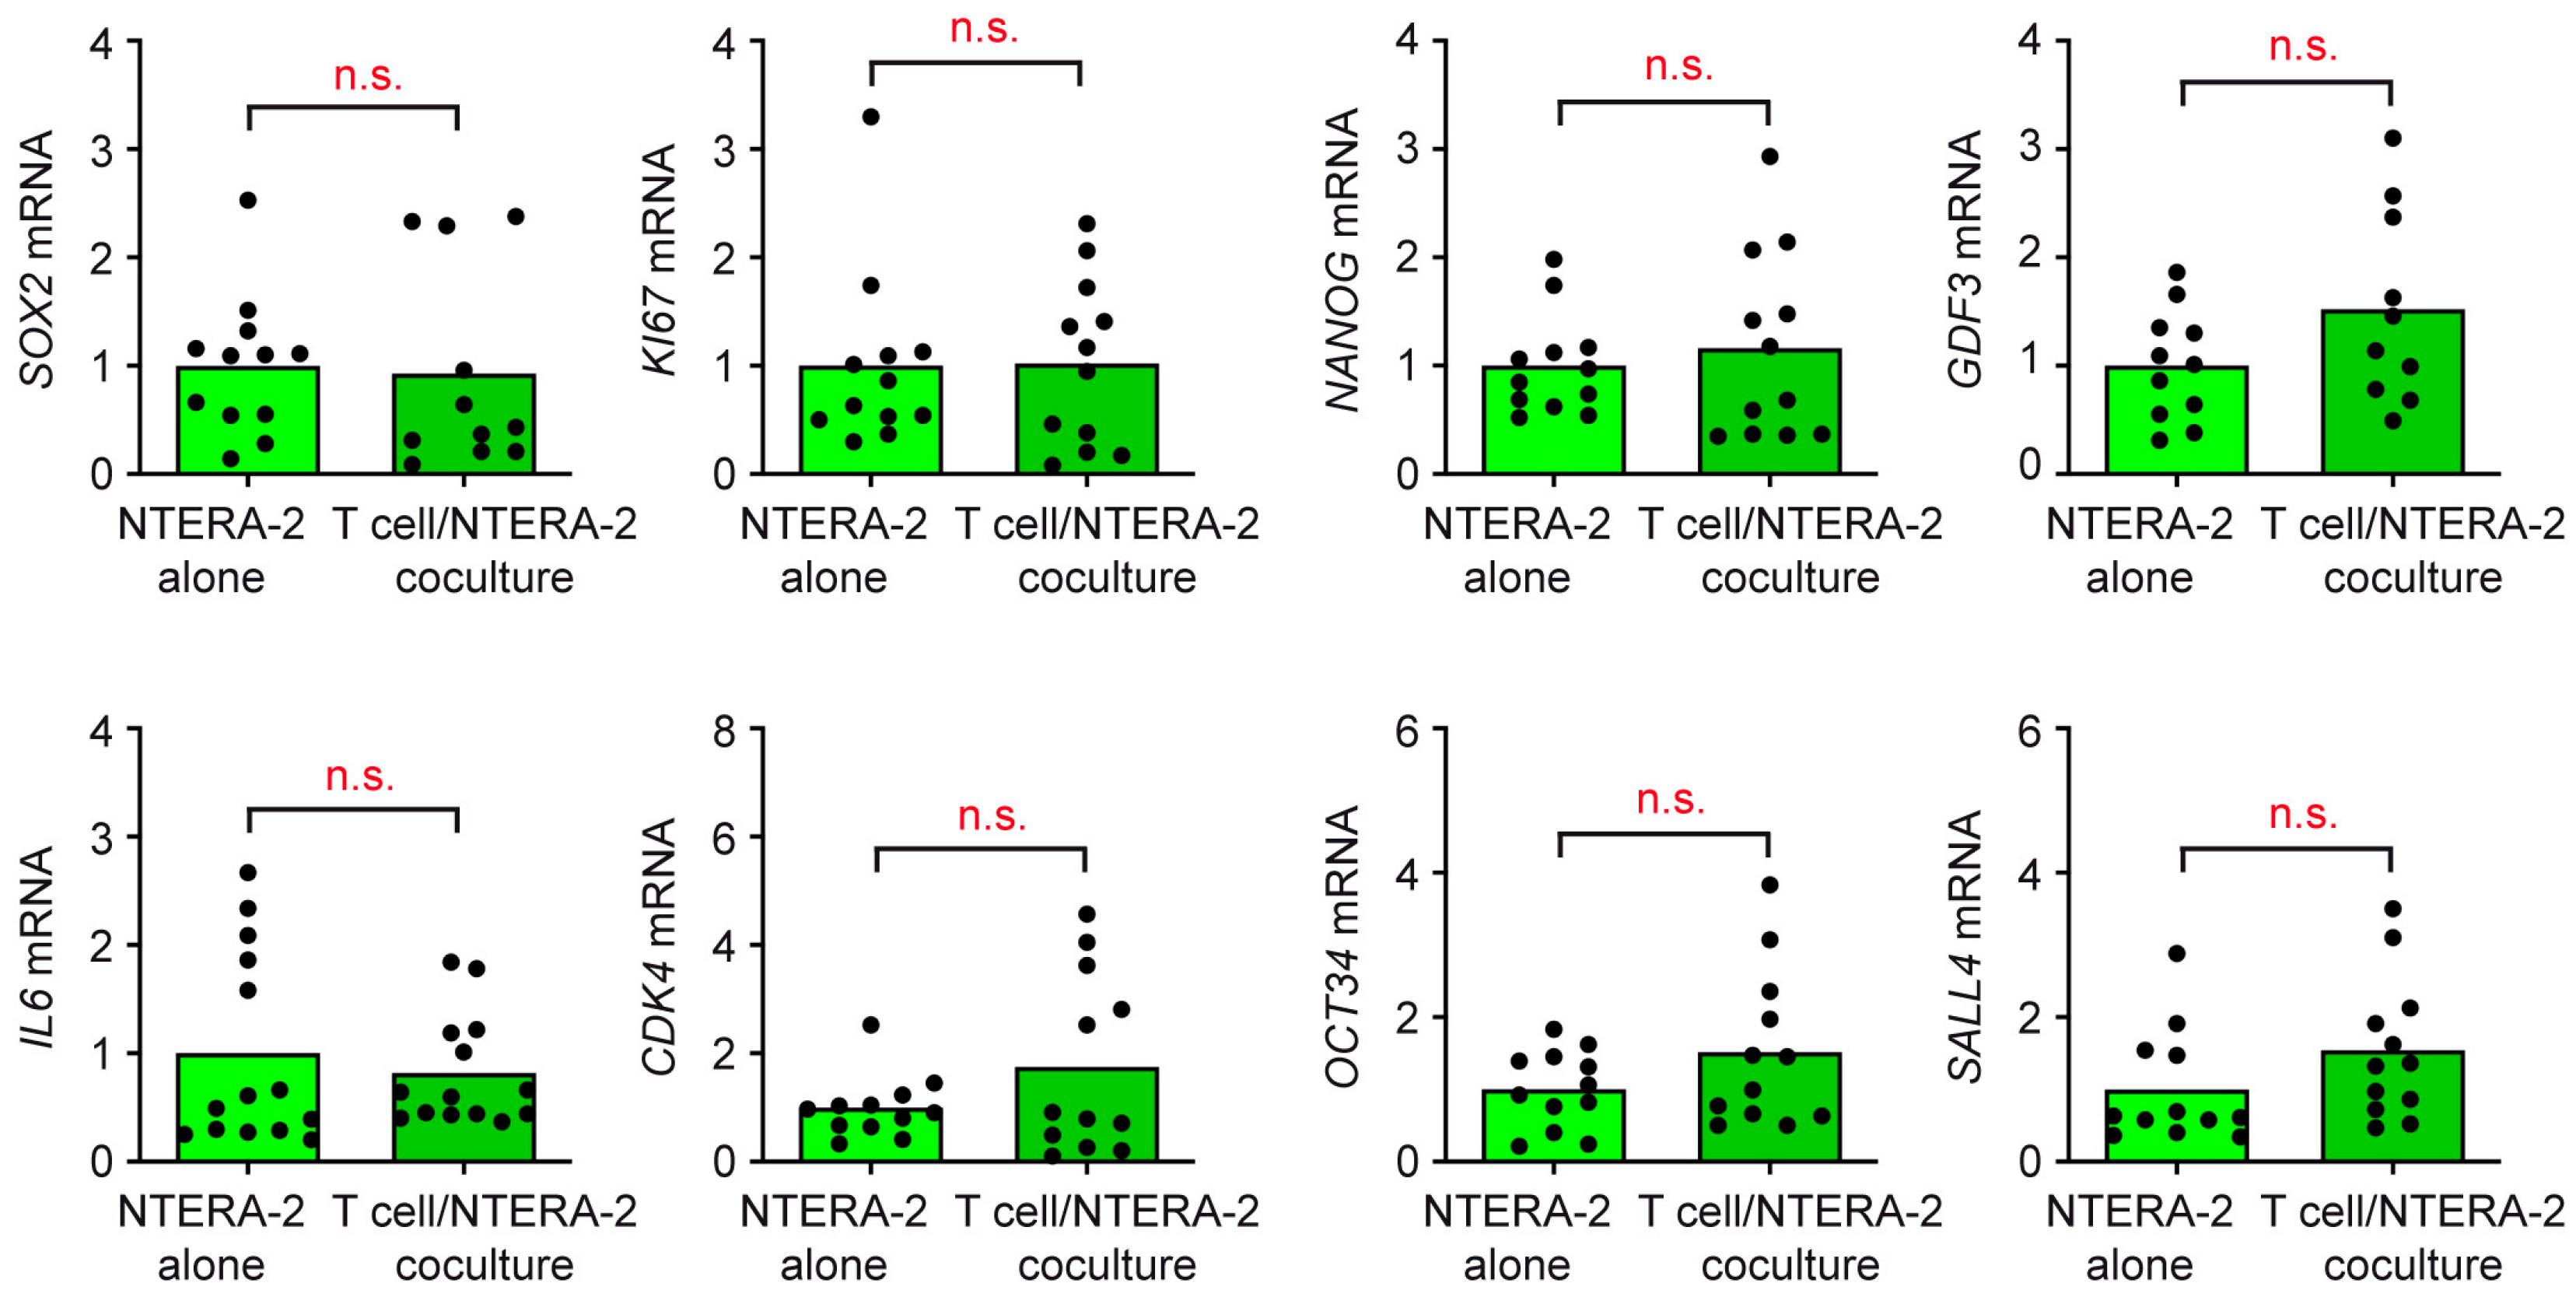
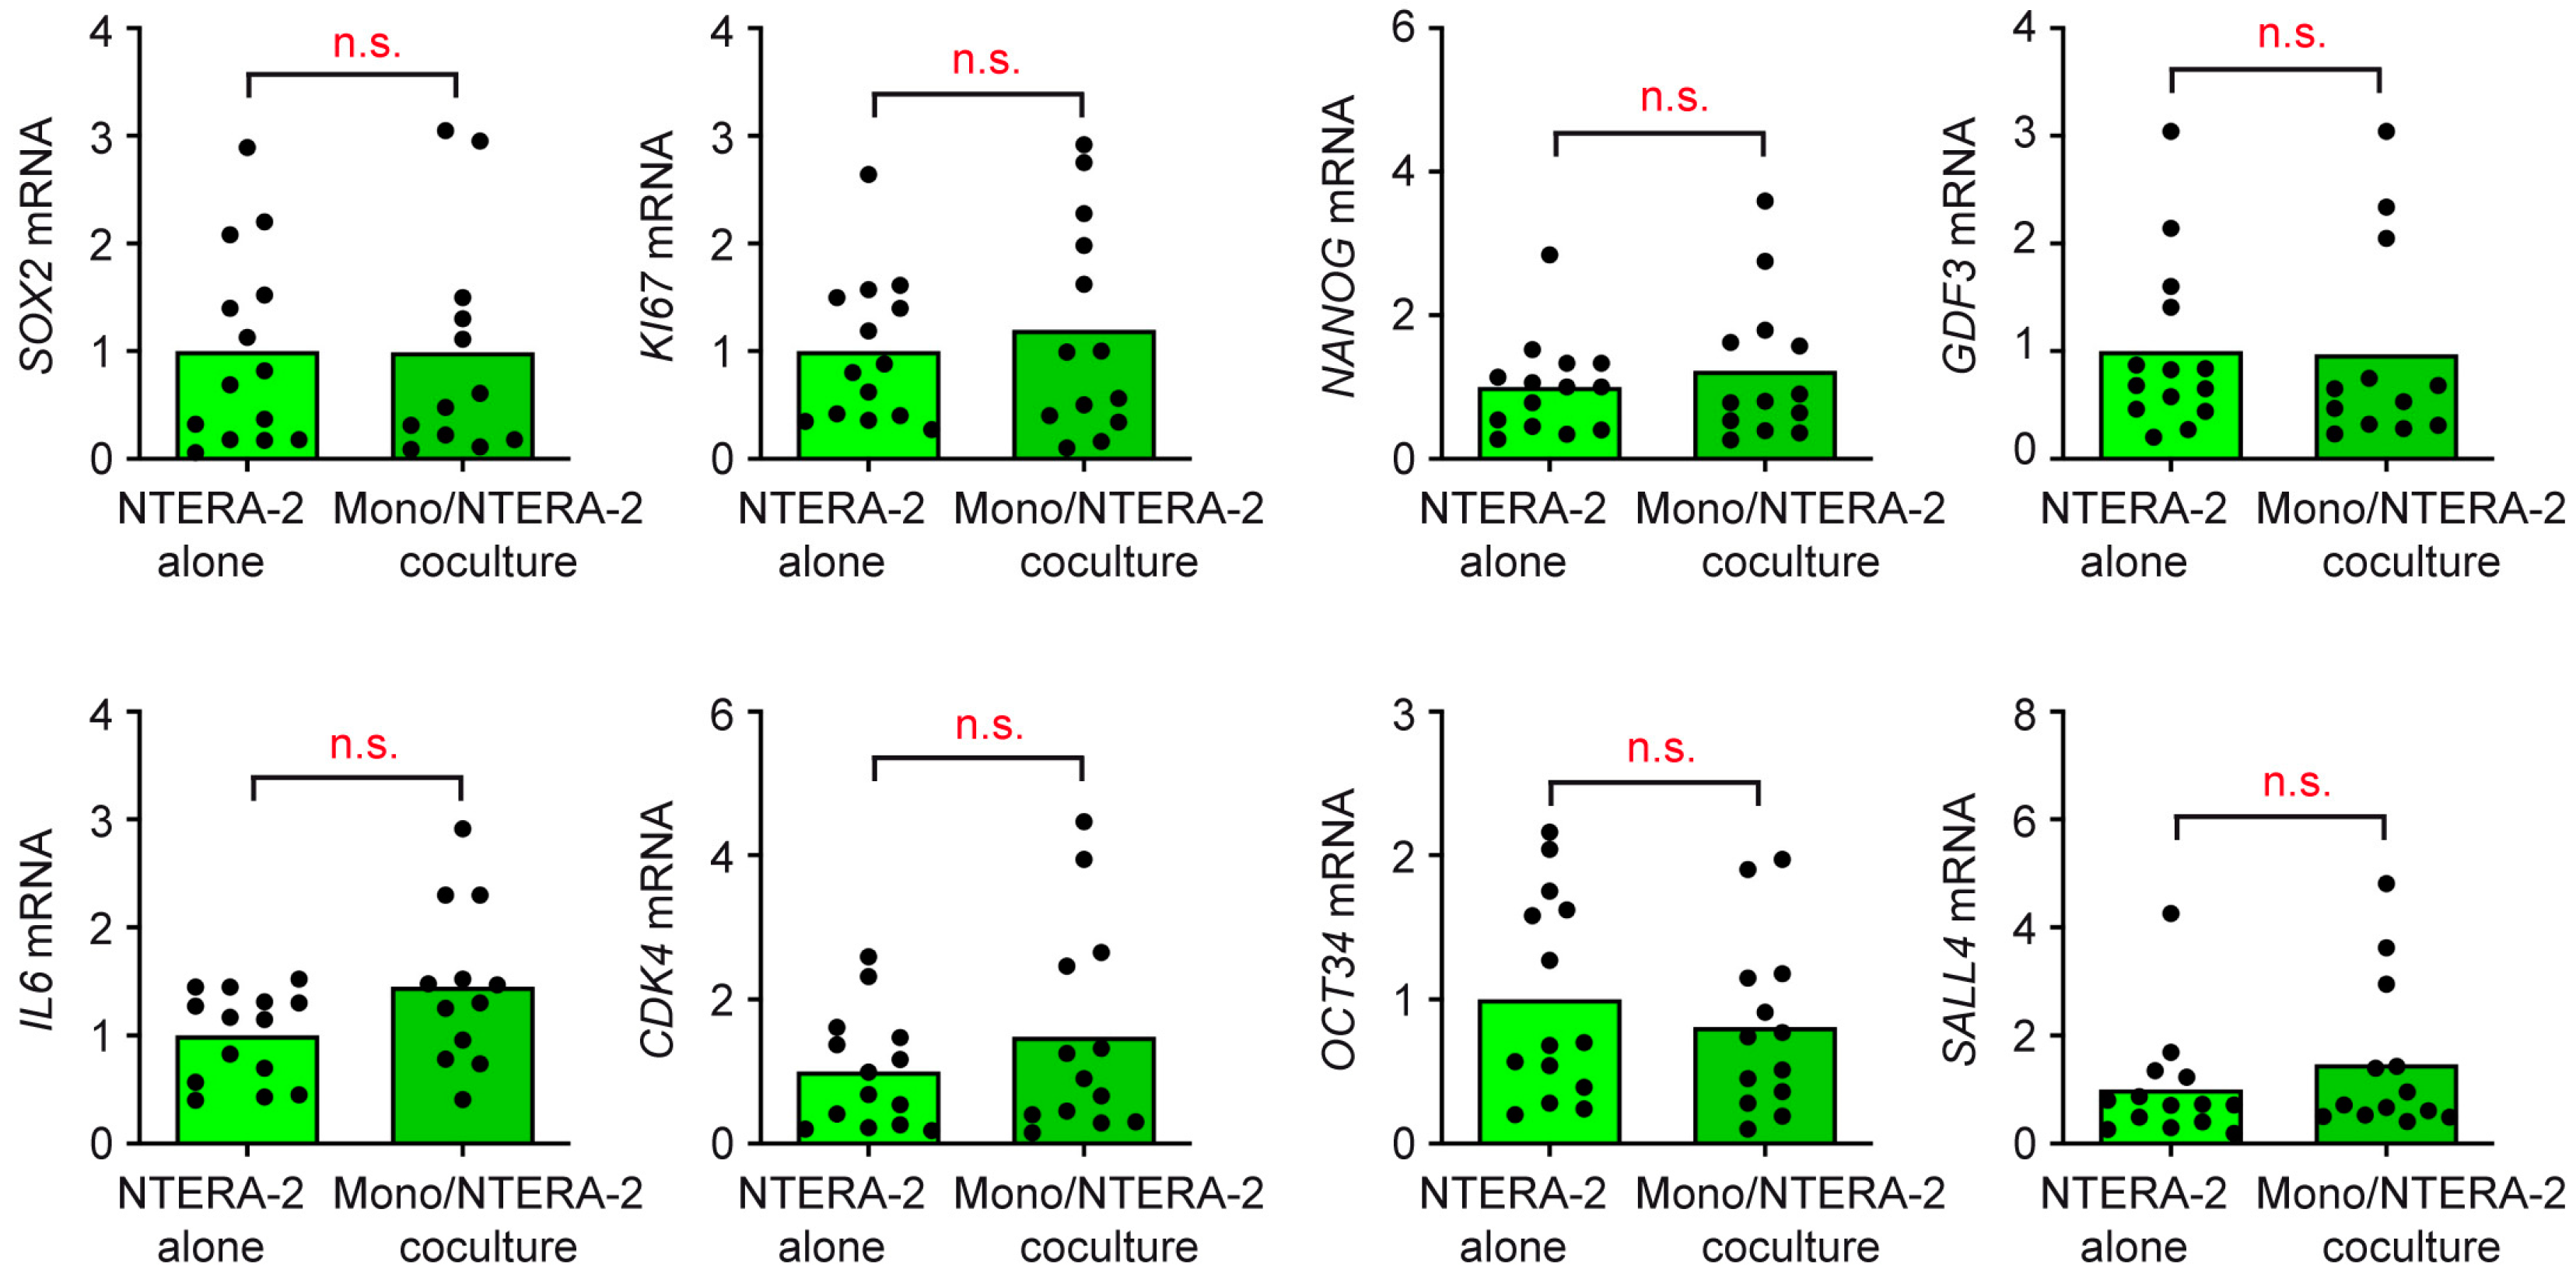
3.4. T Cells and Monocytes Do Not Exert Any Influence on NTERA-2 Cells in Coculture
4. Discussion
5. Conclusions
Supplementary Materials
Author Contributions
Funding
Institutional Review Board Statement
Informed Consent Statement
Data Availability Statement
Conflicts of Interest
References
- Shacter, E.; Weitzman, S.A. Chronic inflammation and cancer. Oncology 2002, 16, 217–226. [Google Scholar] [PubMed]
- Pearce, H.; Hutton, P.; Chaudhri, S.; Porfiri, E.; Patel, P.; Viney, R.; Moss, P. Spontaneous CD4(+) and CD8(+) T-cell responses directed against cancer testis antigens are present in the peripheral blood of testicular cancer patients. Eur. J. Immunol. 2017, 47, 1232–1242. [Google Scholar] [CrossRef]
- Katsuta, E.; Rashid, O.M.; Takabe, K. Clinical relevance of tumor microenvironment: Immune cells, vessels, and mouse models. Hum. Cell 2020, 33, 930–937. [Google Scholar] [CrossRef]
- Diez-Torre, A.; Silvan, U.; Diaz-Nunez, M.; Arechaga, J. The role of microenvironment in testicular germ cell tumors. Cancer Biol. Ther. 2010, 10, 529–536. [Google Scholar] [CrossRef] [PubMed]
- Ladanyi, A. Prognostic and predictive significance of immune cells infiltrating cutaneous melanoma. Pigment. Cell Melanoma Res. 2015, 28, 490–500. [Google Scholar] [CrossRef]
- Kampan, N.C.; Xiang, S.D.; McNally, O.M.; Stephens, A.N.; Quinn, M.A.; Plebanski, M. Immunotherapeutic Interleukin-6 or Interleukin-6 Receptor Blockade in Cancer: Challenges and Opportunities. Curr. Med. Chem. 2018, 25, 4785–4806. [Google Scholar] [CrossRef] [PubMed]
- Marin-Acevedo, J.A.; Kimbrough, E.O.; Lou, Y.Y. Next generation of immune checkpoint inhibitors and beyond. J. Hematol. Oncol. 2021, 14, 45. [Google Scholar] [CrossRef]
- Scarfo, I.; Maus, M.V. Current approaches to increase CAR T cell potency in solid tumors: Targeting the tumor microenvironment. J. Immunother. Cancer 2017, 5, 28. [Google Scholar] [CrossRef]
- Albers, P.; Albrecht, W.; Algaba, F.; Bokemeyer, C.; Cohn-Cedermark, G.; Fizazi, K.; Horwich, A.; Laguna, M.P.; Nicolai, N.; Oldenburg, J. Guidelines on Testicular Cancer: 2015 Update. Eur. Urol. 2015, 68, 1054–1068. [Google Scholar] [CrossRef]
- Oosterhuis, J.W.; Looijenga, L.H. Testicular germ-cell tumours in a broader perspective. Nat. Rev. Cancer 2005, 5, 210–222. [Google Scholar] [CrossRef]
- Groll, R.J.; Warde, P.; Jewett, M.A.S. A comprehensive systematic review of testicular germ cell tumor surveillance. Crit. Rev. Oncol. Hemat 2007, 64, 182–197. [Google Scholar] [CrossRef] [PubMed]
- Seidel, C.; Daugaard, G.; Nestler, T.; Tryakin, A.; Fedyanin, M.; Fankhauser, C.; Hermanns, T.; Aparicio, J.; Heinzelbecker, J.; Paffenholz, P.; et al. Human chorionic gonadotropin-positive seminoma patients: A registry compiled by the global germ cell tumor collaborative group (G3). Eur. J. Cancer 2020, 132, 127–135. [Google Scholar] [CrossRef]
- Hvarness, T.; Nielsen, J.E.; Almstrup, K.; Skakkebaek, N.E.; Rajpert-De Meyts, E.; Claesson, M.H. Phenotypic characterisation of immune cell infiltrates in testicular germ cell neoplasia. J. Reprod. Immunol. 2013, 100, 135–145. [Google Scholar] [CrossRef]
- Klein, B.; Haggeney, T.; Fietz, D.; Indumathy, S.; Loveland, K.L.; Hedger, M.; Kliesch, S.; Weidner, W.; Bergmann, M.; Schuppe, H.C. Specific immune cell and cytokine characteristics of human testicular germ cell neoplasia. Hum. Reprod. 2016, 31, 2192–2202. [Google Scholar] [CrossRef] [PubMed]
- Siska, P.J.; Johnpulle, R.A.N.; Zhou, A.; Bordeaux, J.; Kim, J.Y.; Dabbas, B.; Dakappagari, N.; Rathmell, J.C.; Rathmell, W.K.; Morgans, A.K.; et al. Deep exploration of the immune infiltrate and outcome prediction in testicular cancer by quantitative multiplexed immunohistochemistry and gene expression profiling. Oncoimmunology 2017, 6, e1305535. [Google Scholar] [CrossRef]
- Boutilier, A.J.; Elsawa, S.F. Macrophage Polarization States in the Tumor Microenvironment. Int. J. Mol. Sci. 2021, 22, 6995. [Google Scholar] [CrossRef] [PubMed]
- Zhao, X.; Wei, Y.Q.; Kariya, Y.; Teshigawara, K.; Uchida, A. Accumulation of gamma/delta T cells in human dysgerminoma and seminoma: Roles in autologous tumor killing and granuloma formation. Immunol. Investig. 1995, 24, 607–618. [Google Scholar] [CrossRef]
- Balzer, B.L.; Ulbright, T.M. Spontaneous regression of testicular germ cell tumors: An analysis of 42 cases. Am. J. Surg. Pathol. 2006, 30, 858–865. [Google Scholar] [CrossRef]
- Nestler, T.; Dalvi, P.; Haidl, F.; Wittersheim, M.; Von Brandenstein, M.; Paffenholz, P.; Wagener-Ryczek, S.; Pfister, D.; Koitzsch, U.; Hellmich, M.; et al. Transcriptome analysis reveals upregulation of immune response pathways at the invasive tumour front of metastatic seminoma germ cell tumours. Br. J. Cancer 2022, 126, 937–947. [Google Scholar] [CrossRef]
- Gayer, F.A.; Fichtner, A.; Legler, T.J.; Reichardt, H.M. A Coculture Model Mimicking the Tumor Microenvironment Unveils Mutual Interactions between Immune Cell Subtypes and the Human Seminoma Cell Line TCam-2. Cells 2022, 11, 885. [Google Scholar] [CrossRef]
- Dieckmann, K.P.; Skakkebaek, N.E. Carcinoma in situ of the testis: Review of biological and clinical features. Int. J. Cancer 1999, 83, 815–822. [Google Scholar] [CrossRef]
- Fichtner, A.; Richter, A.; Filmar, S.; Gaisa, N.T.; Schweyer, S.; Reis, H.; Nettersheim, D.; Oing, C.; Gayer, F.A.; Leha, A.; et al. The detection of isochromosome i(12p) in malignant germ cell tumours and tumours with somatic malignant transformation by the use of quantitative real-time polymerase chain reaction. Histopathology 2021, 78, 593–606. [Google Scholar] [CrossRef] [PubMed]
- Rodriguez, S.; Jafer, O.; Goker, H.; Summersgill, B.M.; Zafarana, G.; Gillis, A.J.M.; van Gurp, R.J.H.L.M.; Oosterhuis, J.W.; Lu, Y.J.; Huddart, R.; et al. Expression profile of genes from 12p in testicular germ cell tumors of adolescents and adults associated with i(12p) and amplification at 12p11.2-p12.1. Oncogene 2003, 22, 1880–1891. [Google Scholar] [CrossRef]
- Nettersheim, D.; Westernstroer, B.; Haas, N.; Leinhaas, A.; Brustle, O.; Schlatt, S.; Schorle, H. Establishment of a versatile seminoma model indicates cellular plasticity of germ cell tumor cells. Gene Chromosome Cancer 2012, 51, 717–726. [Google Scholar] [CrossRef]
- Jostes, S.V.; Fellermeyer, M.; Arevalo, L.; Merges, G.E.; Kristiansen, G.; Nettersheim, D.; Schorle, H. Unique and redundant roles of SOX2 and SOX17 in regulating the germ cell tumor fate. Int. J. Cancer 2020, 146, 1592–1605. [Google Scholar] [CrossRef]
- Bahrami, A.R.; Matin, M.M.; Andrews, P.W. The CDK inhibitor p27 enhances neural differentiation in pluripotent NTERA2 human EC cells, but does not permit differentiation of 2102Ep nullipotent human EC cells. Mech. Dev. 2005, 122, 1034–1042. [Google Scholar] [CrossRef]
- Eini, R.; Stoop, H.; Gillis, A.J.; Biermann, K.; Dorssers, L.C.; Looijenga, L.H. Role of SOX2 in the etiology of embryonal carcinoma, based on analysis of the NCCIT and NT2 cell lines. PLoS ONE 2014, 9, e83585. [Google Scholar] [CrossRef]
- Nettersheim, D.; Heimsoeth, A.; Jostes, S.; Schneider, S.; Fellermeyer, M.; Hofmann, A.; Schorle, H. SOX2 is essential for in vivo reprogramming of seminoma-like TCam-2 cells to an embryonal carcinoma-like fate. Oncotarget 2016, 7, 47095–47110. [Google Scholar] [CrossRef] [PubMed]
- de Jong, J.; Stoop, H.; Gillis, A.J.M.; Hersmus, R.; van Gurp, R.J.H.L.M.; de Geijn, G.J.M.V.; van Drunen, E.; Beverloo, H.B.; Schneider, D.T.; Sherlock, J.K.; et al. Further characterization of the first seminoma cell line TCam-2. Gene Chromosome Cancer 2008, 47, 185–196. [Google Scholar] [CrossRef]
- Eckert, D.; Nettersheim, D.; Heukamp, L.C.; Kitazawa, S.; Biermann, K.; Schorle, H. TCam-2 but not JKT-1 cells resemble seminoma in cell culture. Cell Tissue Res. 2008, 331, 529–538. [Google Scholar] [CrossRef]
- Bremmer, F.; Bohnenberger, H.; Kuffer, S.; Oellerich, T.; Serve, H.; Urlaub, H.; Strauss, A.; Maatoug, Y.; Behnes, C.L.; Oing, C.; et al. Proteomic Comparison of Malignant Human Germ Cell Tumor Cell Lines. Dis. Markers 2019, 2019, 8298524. [Google Scholar] [CrossRef]
- Batool, A.; Chen, S.R.; Liu, Y.X. Distinct Metabolic Features of Seminoma and Embryonal Carcinoma Revealed by Combined Transcriptome and Metabolome Analyses. J. Proteome Res. 2019, 18, 1819–1826. [Google Scholar] [CrossRef] [PubMed]
- Bremmer, F.; Hemmerlein, B.; Strauss, A.; Burfeind, P.; Thelen, P.; Radzun, H.J.; Behnes, C.L. N-cadherin expression in malignant germ cell tumours of the testis. BMC Clin. Pathol. 2012, 12, 19. [Google Scholar] [CrossRef]
- Lunney, J.K. Cytokines orchestrating the immune response. Rev. Sci. Tech. 1998, 17, 84–94. [Google Scholar] [CrossRef] [PubMed]
- Fisher, D.T.; Appenheimer, M.M.; Evans, S.S. The two faces of IL-6 in the tumor microenvironment. Semin. Immunol. 2014, 26, 38–47. [Google Scholar] [CrossRef] [PubMed]
- Klein, B.; Schuppe, H.C.; Bergmann, M.; Hedger, M.P.; Loveland, B.E.; Loveland, K.L. An in vitro model demonstrates the potential of neoplastic human germ cells to influence the tumour microenvironment. Andrology 2017, 5, 763–770. [Google Scholar] [CrossRef]
- Russell, S.M.; Lechner, M.G.; Mokashi, A.; Megiel, C.; Jang, J.K.; Taylor, C.R.; Looijenga, L.H.; French, C.A.; Epstein, A.L. Establishment and characterization of a new human extragonadal germ cell line, SEM-1, and its comparison with TCam-2 and JKT-1. Urology 2013, 81, 464.e1–464.e9. [Google Scholar] [CrossRef] [PubMed]
- de Jong, J.; Stoop, H.; Gillis, A.J.; van Gurp, R.J.; van Drunen, E.; Beverloo, H.B.; Lau, Y.F.; Schneider, D.T.; Sherlock, J.K.; Baeten, J.; et al. JKT-1 is not a human seminoma cell line. Int. J. Androl. 2007, 30, 350–365. [Google Scholar] [CrossRef]
- Desmousseaux, T.; Arama, E.; Maxwell, F.; Ferlicot, S.; Hani, C.; Fizazi, K.; Lebacle, C.; Loriot, Y.; Boumerzoug, M.; Cohen, J.; et al. Ultrasound and Magnetic Resonance Imaging of Burned-Out Testicular Tumours: The Diagnostic Keys Based on 48 Cases. Cancers 2022, 14, 4013. [Google Scholar] [CrossRef]


Disclaimer/Publisher’s Note: The statements, opinions and data contained in all publications are solely those of the individual author(s) and contributor(s) and not of MDPI and/or the editor(s). MDPI and/or the editor(s) disclaim responsibility for any injury to people or property resulting from any ideas, methods, instructions or products referred to in the content. |
© 2023 by the authors. Licensee MDPI, Basel, Switzerland. This article is an open access article distributed under the terms and conditions of the Creative Commons Attribution (CC BY) license (https://creativecommons.org/licenses/by/4.0/).
Share and Cite
Gayer, F.A.; Henkel, M.; Luft, J.; Reichardt, S.D.; Fichtner, A.; Legler, T.J.; Reichardt, H.M. The Subtype Identity of Testicular Cancer Cells Determines Their Immunostimulatory Activity in a Coculture Model. Cancers 2023, 15, 2619. https://doi.org/10.3390/cancers15092619
Gayer FA, Henkel M, Luft J, Reichardt SD, Fichtner A, Legler TJ, Reichardt HM. The Subtype Identity of Testicular Cancer Cells Determines Their Immunostimulatory Activity in a Coculture Model. Cancers. 2023; 15(9):2619. https://doi.org/10.3390/cancers15092619
Chicago/Turabian StyleGayer, Fabian A., Miriam Henkel, Juliane Luft, Sybille D. Reichardt, Alexander Fichtner, Tobias J. Legler, and Holger M. Reichardt. 2023. "The Subtype Identity of Testicular Cancer Cells Determines Their Immunostimulatory Activity in a Coculture Model" Cancers 15, no. 9: 2619. https://doi.org/10.3390/cancers15092619
APA StyleGayer, F. A., Henkel, M., Luft, J., Reichardt, S. D., Fichtner, A., Legler, T. J., & Reichardt, H. M. (2023). The Subtype Identity of Testicular Cancer Cells Determines Their Immunostimulatory Activity in a Coculture Model. Cancers, 15(9), 2619. https://doi.org/10.3390/cancers15092619