
Characterization of Mediastinal Bulky Lymphomas with FDG-PET-Based Radiomics and Machine Learning Techniques

 , , , , , , ,
Simple Summary
Abstract
1. Introduction
2. Materials and Methods
2.1. Population
2.2. Image Acquisition
2.3. Data Analysis
2.4. Texture Analysis
2.5. Machine Learning
- Training a model to perform a binary classification between cHL and PMBCL;
- Promoting the trained model to cope with a multiclass classification.
2.6. Statistical Analysis
3. Results
3.1. Patients
3.2. Radiomic Features
3.3. Machine Learning
4. Discussion
5. Conclusions
Author Contributions
Funding
Institutional Review Board Statement
Informed Consent Statement
Data Availability Statement
Acknowledgments
Conflicts of Interest
References
- Swerdlow, S.H.; Campo, E.; Pileri, S.A.; Harris, N.L.; Stein, H.; Siebert, R.; Advani, R.; Ghielmini, M.; Salles, G.A.; Zelenetz, A.D.; et al. The 2016 revision of the World Health Organization classification of lymphoid neoplasms. Blood 2016, 127, 2375–2390. [Google Scholar] [CrossRef] [PubMed]
- Cheson, B.D. PET/CT in Lymphoma: Current Overview and Future Directions. Semin Nucl. Med. 2018, 48, 76–81. [Google Scholar] [CrossRef] [PubMed]
- Eichenauer, D.A.; Aleman, B.M.P.; André, M.; Federico, M.; Hutchings, M.; Illidge, T.; Engert, A.; Ladetto, M.; ESMO Guidelines Committee. Hodgkin lymphoma: ESMO Clinical Practice Guidelines for diagnosis, treatment and follow-up. Ann. Oncol. 2018, 29, iv19–iv29. [Google Scholar] [CrossRef] [PubMed]
- Song, M.K.; Chung, J.S.; Sung-Yong, O.; Lee, G.W.; Kim, S.G.; Seol, Y.M.; Shin, H.J.; Choi, G.J.; Shin, D.H.; Yun, E.-Y. Clinical impact of bulky mass in the patient with primary extranodal diffuse large B cell lymphoma treated with R-CHOP therapy. Ann. Hematol. 2010, 89, 985–991. [Google Scholar] [CrossRef]
- Schürch, C.M.; Federmann, B.; Quintanilla-Martinez, L.; Fend, F. Tumor Heterogeneity in Lymphomas: A Different Breed. Pathobiology 2018, 85, 130–145. [Google Scholar] [CrossRef]
- Cheson, B.D.; Fisher, R.I.; Barrington, S.F.; Cavalli, F.; Schwartz, L.H.; Zucca, E.; Lister, T.A. Recommendations for initial evaluation, staging, and response assessment of hodgkin and non-hodgkin lymphoma: The lugano classification. J. Clin. Oncol. 2014, 32, 3059–3067. [Google Scholar] [CrossRef]
- Piña-Oviedo, S.; Moran, C.A. Primary Mediastinal Classical Hodgkin Lymphoma. Adv. Anat. Pathol. 2016, 23, 285–309. [Google Scholar] [CrossRef]
- Sun, Y.W.; Ji, C.F.; Wang, H.; He, J.; Liu, S.; Ge, Y.; Zhou, Z.Y. Differentiating gastric cancer and gastric lymphoma using texture analysis (TA) of positron emission tomography (PET). Chin. Med. J. 2020, 134, 439–447. [Google Scholar] [CrossRef]
- Van Timmeren, J.E.; Cester, D.; Tanadini-Lang, S.; Alkadhi, H.; Baessler, B. Radiomics in medical imaging—“how-to” guide and critical reflection. Insights Imaging 2020, 11, 91. [Google Scholar] [CrossRef]
- Litjens, G.; Kooi, T.; Bejnordi, B.E.; Setio, A.A.A.; Ciompi, F.; Ghafoorian, M.; Van Der Laak, J.A.; Van Ginneken, B.; Sánchez, C.I. A survey on deep learning in medical image analysis. Med. Image Anal. 2017, 42, 60–88. [Google Scholar] [CrossRef]
- Shen, D.; Wu, G.; Suk, H.I. Deep learning in medical image analysis. Annu. Rev. Biomed. Eng. 2017, 19, 221–248. [Google Scholar] [CrossRef]
- Hesamian, M.H.; Jia, W.; He, X.; Kennedy, P. Deep Learning Techniques for Medical Image Segmentation: Achievements and Challenges. J. Digit. Imaging 2019, 32, 582–596. [Google Scholar] [CrossRef]
- Wang, J.; Wu, C.J.; Bao, M.L.; Zhang, J.; Wang, X.N.; Zhang, Y.D. Machine learning-based analysis of MR radiomics can help to improve the diagnostic performance of PI-RADS v2 in clinically relevant prostate cancer. Eur. Radiol. 2017, 27, 4082–4090. [Google Scholar] [CrossRef]
- Cho, H.H.; Lee, H.Y.; Kim, E.; Lee, G.; Kim, J.; Kwon, J.; Park, H. Radiomics-guided deep neural networks stratify lung adenocarcinoma prognosis from CT scans. Commun. Biol. 2021, 4, 1286. [Google Scholar] [CrossRef]
- Tang, Y.; Yang, C.M.; Su, S.; Wang, W.J.; Fan, L.P.; Shu, J. Machine learning-based Radiomics analysis for differentiation degree and lymphatic node metastasis of extrahepatic cholangiocarcinoma. BMC Cancer 2021, 21, 1268. [Google Scholar] [CrossRef]
- Keek, S.A.; Leijenaar, R.T.H.; Jochems, A.; Woodruff, H.C. A review on radiomics and the future of theranostics for patient selection in precision medicine. Br. J. Radiol. 2018, 91, 1091. [Google Scholar] [CrossRef]
- Mirestean, C.C.; Pagute, O.; Buzea, C.; Iancu, R.I.; Iancu, D.T. Radiomic Machine Learning and Texture Analysis—New Horizons for Head and Neck Oncology. Maedica 2019, 14, 126–130. [Google Scholar]
- Nioche, C.; Orlhac, F.; Boughdad, S.; Reuzé, S.; Goya-Outi, J.; Robert, C.; Pellot-Barakat, C.; Soussan, M.; Frouin, F.; Buvat, I. LIFEx: A freeware for radiomic feature calculation in multimodality imaging to accelerate advances in the characterization of tumor heterogeneity. Cancer Res. 2018, 78, 4786–4789. [Google Scholar] [CrossRef]
- Kanoun, S.; Tal, I.; Berriolo-Riedinger, A.; Rossi, C.; Riedinger, J.M.; Vrigneaud, J.M.; Legrand, L.; Humbert, O.; Casasnovas, O.; Brunotte, F.; et al. Influence of Software Tool and Methodological Aspects of Total Metabolic Tumor Volume Calculation on Baseline [18F]FDG PET to Predict Survival in Hodgkin Lymphoma. PLoS ONE 2015, 10, e0140830. [Google Scholar] [CrossRef]
- Guyon, I.; Weston, J.; Barnhill, S.; Vapnik, V. Gene selection for cancer classification using support vector machines. Mach. Learn. 2002, 46, 389–422. [Google Scholar] [CrossRef]
- Bergstra, J.; Bandernet, R.; Bengio, Y.; Kégl, B. Algorithms for Hyper-Parameter Optimization. In Proceedings of the Advances in Neural Information Processing Systems 24 (NeurIPS 2011), Granada, Spain, 12–14 December 2011. [Google Scholar]
- Bergstra, J.; Yamins, D.; Cox, D. Making a Science of Model Search: Hyperparameter Optimization in Hundreds of Dimensions for Vision Architectures. In Proceedings of the 30th International Conference on Machine Learning (PMLR 2013), Atlanta, GA, USA, 17–19 June 2013; pp. 115–123. [Google Scholar]
- Pedregosa, F.; Varoquaux, G.; Gramfort, A.; Michel, V.; Thirion, B.; Grisel, O.; Blondel, M.; Prettenhofer, P.; Weiss, R.; Dubourg, V.; et al. Scikit-learn: Machine learning in Python. J. Mach. Learn. Res. 2011, 12, 2825–2830. [Google Scholar]
- Akiba, T.; Sano, S.; Yanase, T.; Ohta, T.; Koyama, M. Optuna: A Next-generation Hyperparameter Optimization Framework. In Proceedings of the 25th ACM SIGKDD International Conference on Knowledge Discovery and Data Mining, Anchorage, AK, USA, 4–8 August 2019; Association for Computing Machinery: New York, NY, USA, 2019; pp. 2623–2631. [Google Scholar]
- de Jesus, F.M.; Yin, Y.; Mantzorou-Kyriaki, E.; Kahle, X.U.; de Haas, R.J.; Yakar, D.; Glaudemans, A.W.J.M.; Noordzij, W.; Kwee, T.C.; Nijland, M. Machine learning in the differentiation of follicular lymphoma from diffuse large B-cell lymphoma with radiomic [18F]FDG PET/CT features. Eur. J. Nucl. Med. Mol. Imaging 2022, 49, 1535–1543. [Google Scholar] [CrossRef] [PubMed]
- Orlhac, F.; Soussan, M.; Chouahnia, K.; Martinod, E.; Buvat, I. 18F-FDG PET-Derived Textural Indices Reflect Tissue-Specific Uptake Pattern in Non-Small Cell Lung Cancer. PLoS ONE 2015, 12, e0145063. [Google Scholar] [CrossRef] [PubMed]
- Mann, H.B.; Whitney, D.R. On a Test of Whether one of Two Random Variables is Stochastically Larger than the Other. Ann. Math. Stat. 1947, 18, 50–60. [Google Scholar] [CrossRef]
- Chawla, N.V.; Bowyer, K.W.; Hall, L.O.; Kegelmeyer, W.P. SMOTE: Synthetic Minority Over-sampling Technique. J. Artif. Intell. Res. 2002, 16, 321–357. [Google Scholar] [CrossRef]
- Minn, H.; Joensuu, H.; Ahonen, A.; Klemi, P. Florodeoxyglucose imaging: A method to assess the proliferative activity of human cancer in vivo. Comparison with DNA flow cytometry in head and neck tumors. Cancer 1988, 61, 1776–1781. [Google Scholar] [CrossRef]
- Higashi, K.; Ueda, Y.; Yagishita, M.; Arisaka, Y.; Sakurai, A.; Oguchi, M.; Seki, H.; Nambu, Y.; Tonami, H.; Yamamoto, M. FDG PET measurement of the proliferative potential of non-small cell lung cancer. J. Nucl. Med. 2000, 41, 85–92. [Google Scholar]
- Lu, J.; Ma, D.; Shou, Y.; Chen, T.; Tong, L. Correlation of fluorodeoxyglucose uptake and tumor-proliferating antigen Ki-67 in lymphomas. J. Cancer Res. Ther. 2012, 8, 96–102. [Google Scholar] [CrossRef]
- Ngeow, J.Y.Y.; Quek, R.H.H.; Ng, D.C.E.; Hee, S.W.; Tao, M.; Lim, L.C.; Tan, Y.H.; Lim, S.T. High SUV uptake on FDG-PET/CT predicts for an aggressive B-cell lymphoma in a prospective study of primary FDG-PET/CT staging in lymphoma. Ann. Oncol. 2009, 20, 1543–1547. [Google Scholar] [CrossRef]
- Riester, M.; Xu, Q.; Moreira, A.; Zheng, J.; Michor, F.; Downey, R. The Warburg effect: Persistence of stem-cell metabolism in cancers as a failure of differentiation. Ann. Oncol. 2018, 29, 264–270. [Google Scholar] [CrossRef]
- Canellos, G.P. Residual mass in lymphoma may not be residual disease. J. Clin. Oncol. 1988, 6, 931–933. [Google Scholar] [CrossRef]
- Álvaro, T.; Lejeune, M.; García, J.F.; Salvadó, M.T.; López, C.; Bosch, R.; Jaén, J.; Escrivá, P.; Pons, L.E. Tumor-infiltrated immune response correlates with alterations in the apoptotic and cell cycle pathways in Hodgkin and Reed-Sternberg cells. Clin Cancer Res. 2008, 14, 685–691. [Google Scholar] [CrossRef]
- Hatt, M.; Majdoub, M.; Vallières, M.; Tixier, F.; Le Rest, C.C.; Groheux, D.; Hindié, E.; Martineau, A.; Pradier, O.; Hustinx, R.; et al. 18F-FDG PET uptake characterization through texture analysis: Investigating the complementary nature of heterogeneity and functional tumor volume in a multi-cancer site patient cohort. J. Nucl. Med. 2015, 56, 38–44. [Google Scholar] [CrossRef]
- Sasanelli, M.; Meignan, M.; Haioun, C.; Berriolo-Riedinger, A.; Casasnovas, R.-O.; Biggi, A.; Gallamini, A.; Siegel, B.A.; Cashen, A.F.; Véra, P.; et al. Pretherapy metabolic tumour volume is an independent predictor of outcome in patients with diffuse large B-cell lymphoma. Eur. J. Nucl. Med. Mol. Imaging 2014, 41, 2017–2022. [Google Scholar] [CrossRef]
- Nakagawa, K.; Takahashi, S.; Endo, M.; Ohde, Y.; Kurihara, H.; Terauchi, T. Can 18F-FDG PET predict the grade of malignancy in thymic epithelial tumors? An evaluation of only resected tumors. Cancer Manag. Res. 2017, 9, 761–768. [Google Scholar] [CrossRef]
- Song, M.-K.; Chung, J.-S.; Shin, H.-J.; Lee, S.-M.; Lee, S.-E.; Lee, H.-S.; Lee, G.-W.; Kim, S.-J.; Lee, S.-M.; Chung, D.-S. Clinical significance of metabolic tumor volume by PET/CT in stages II and III of diffuse large B cell lymphoma without extranodal site involvement. Ann. Hematol. 2012, 91, 697–703. [Google Scholar] [CrossRef]
- Tateishi, U.; Tatsumi, M.; Terauchi, T.; Ando, K.; Niitsu, N.; Kim, W.S.; Suh, C.; Ogura, M.; Tobinai, K. Prognostic significance of metabolic tumor burden by positron emission tomography/computed tomography in patients with relapsed/refractory diffuse large B-cell lymphoma. Cancer Sci. 2015, 106, 186–193. [Google Scholar] [CrossRef]
- Ha, S.; Choi, H.; Cheon, G.J.; Kang, K.W.; Chung, J.-K.; Kim, E.E.; Lee, D.S. Autoclustering of Non-small Cell Lung Carcinoma Subtypes on 18F-FDG PET Using Texture Analysis: A Preliminary Result. Nucl. Med. Mol. Imaging 2014, 48, 278–286. [Google Scholar] [CrossRef]
- Chicklore, S.; Goh, V.; Siddique, M.; Roy, A.; Marsden, P.K.; Cook, G.J. Quantifying tumour heterogeneity in 18F-FDG PET/CT imaging by texture analysis. Eur. J. Nucl. Med. Mol. Imaging 2013, 40, 133–140. [Google Scholar] [CrossRef]
- Jackson, A.; O’Connor, J.P.; Parker, G.J.; Jayson, G.C. Imaging tumor vascular heterogeneity and angiogenesis using dynamic contrast-enhanced magnetic resonance imaging. Clin Cancer Res. 2007, 13, 3449–3459. [Google Scholar] [CrossRef]
- Diehn, M.; Nardini, C.; Wang, D.S.; McGovern, S.; Jayaraman, M.; Liang, Y.; Aldape, K.; Cha, S.; Kuo, M.D. Identification of noninvasive imaging surrogates for brain tumor gene-expression modules. Proc. Natl. Acad. Sci. USA 2008, 105, 5213–5218. [Google Scholar] [CrossRef] [PubMed]
- Ben Bouallègue, F.; Tabaa, Y.A.; Kafrouni, M.; Cartron, G.; Vauchot, F.; Mariano-Goulart, D. Association between textural and morphological tumor indices on baseline PET-CT and early metabolic response on interim PET-CT in bulky malignant lymphomas. Med. Phys. 2017, 44, 4608–4619. [Google Scholar] [CrossRef] [PubMed]
- Orlhac, F.; Nioche, C.; Soussan, M.; Buvat, I. Understanding changes in tumor texture indices in PET: A comparison between visual assessment and index values in simulated and patient data. J. Nucl. Med. 2017, 58, 387–392. [Google Scholar] [CrossRef] [PubMed]
- Gebejes, A.; Huertas, R. Texture Characterization based on Grey-Level Co-occurrence Matrix. In Proceedings of the Conference of Informatics and Management Sciences—SECTION: Artificial Intelligence and Image Processing, ICTIC 2013, Chongqing, China, 25–29 March 2013. [Google Scholar]
- Tan, S.; Kligerman, S.; Chen, W.; Lu, M.; Kim, G.; Feigenberg, S.; D’Souza, W.D.; Suntharalingam, M.; Lu, W. Spatial-temporal [18F]FDG-PET features for predicting pathologic response of esophageal cancer to neoadjuvant chemoradiation therapy. Int. J. Radiat. Oncol. Biol. Phys. 2013, 85, 1375–1382. [Google Scholar] [CrossRef] [PubMed]
- Tixier, F.; Le Rest, C.C.; Hatt, M.; Albarghach, N.; Pradier, O.; Metges, J.-P.; Corcos, L.; Visvikis, D. Intratumor heterogeneity characterized by textural features on baseline 18F-FDG PET images predicts response to concomitant radiochemotherapy in esophageal cancer. J. Nucl. Med. 2011, 52, 369–378. [Google Scholar] [CrossRef] [PubMed]
- Kunkel, M.; Reichert, T.E.; Benz, P.; Lehr, H.-A.; Jeong, J.-H.; Wieand, S.; Bartenstein, P.; Wagner, W.; Whiteside, T.L. Overexpression of Glut-1 and increased glucose metabolism in tumors are associated with a poor prognosis in patients with oral squamous cell carcinoma. Cancer 2003, 97, 1015–1024. [Google Scholar] [CrossRef]
- Kazmierska, J.; Cholewinski, W.; Piotrowski, T.; Sowinska, A.; Bak, B.; Cegła, P.; Malicki, J. Assessment of tumour hypoxia, proliferation and glucose metabolism in head and neck cancer before and during treatment. Br. J. Radiol. 2020, 93, 20180781. [Google Scholar] [CrossRef]
- Orlhac, F.; Thézé, B.; Soussan, M.; Boisgard, R.; Buvat, I. Multiscale Texture Analysis: From 18F-FDG PET Images to Histologic Images. J. Nucl. Med. 2016, 57, 1823–1828. [Google Scholar] [CrossRef]
- Lippi, M.; Gianotti, S.; Fama, A.; Casali, M.; Barbolini, E.; Ferrari, A.; Fioroni, F.; Iori, M.; Luminari, S.; Menga, M.; et al. Texture analysis and multiple-instance learning for the classification of malignant lymphomas. Comput. Methods Programs Biomed. 2020, 185, 105153. [Google Scholar] [CrossRef]
- Zhu, S.; Xu, H.; Shen, C.; Wang, Y.; Xu, W.; Duan, S.; Chen, H.; Ou, X.; Chen, L.; Ma, X. Differential diagnostic ability of 18f-fdg PeT/cT radiomics features between renal cell carcinoma and renal lymphoma. Q. J. Nucl. Med. Mol. Imaging 2021, 65, 72–78. [Google Scholar] [CrossRef]
- Feng, B.; Huang, L.; Li, C.; Quan, Y.; Chen, Y.; Xue, H.; Chen, Q.; Sun, S.; Li, R.; Long, W. A Heterogeneity Radiomic Nomogram for Preoperative Differentiation of Primary Gastric Lymphoma From Borrmann Type IV Gastric Cancer. J. Comput. Assist. Tomogr. 2021, 45, 191–202. [Google Scholar] [CrossRef]


| Index Matrix Parameter | Matrix | Parameter |
|---|---|---|
| Conventional indices | SUVmean, SUVmax, SUVpeak | |
| Volumetric indices | MTV, TLG | |
| Texture features: first-order | Histogram | skewness, kurtosis, entropy, energy |
| Texture features: second-order | GLCM | homogeneity, energy, contrast, correlation, entropy, dissimilarity |
| NGLDM | coarseness, contrast, busyness | |
| GLRLM | SRE/LRE, LGRE/HGRE, SRLGE/SRHGE, LRLGE/LRHGE, GLNUr/RLNU, RP | |
| GLZLM | SZE, LZE, LGZE, HGZE, SZLGE, SZHGE, LZLGE, LZHGE, GLNUz, ZLNU, ZP |
| Characteristics | PMBCL, n (%) | cHL, n (%) | GZL, n (%) |
|---|---|---|---|
| Patients | 29 (24.8%) | 80 (68.4%) | 8 (6.8%) |
| Male sex | 10 (34.5%) | 35 (43.8%) | 5 (62.5%) |
| Median age y (range) | 40 (21–59) | 33 (18–74) | 47 (16–60). |
| Ann Arbor Stage | |||
| I | 6 (21%) | 1 (2%) | 0 (0%) |
| II | 12 (58%) | 48 (66%) | 7 (87.5%) |
| III | 2 (7%) | 12 (16%) | 1 (12.5%) |
| IV | 4 (14%) | 12 (16%) | 0 (0%) |
| B symptoms | 8 (28%) | 29 (40%) | 4 (50%) |
| LDH UI/l (range) | 355 (134–757) | 207 (135–630) | 255.5 (206–335) |
| ERS mm/h (range) | 37 (6–106) | 321 (4–120) | 34.5 (20–62) |
| Median bulky diameter cm (range) | 11.0 (6.5–17) | 8.9 (5–20) | 13.5 (5–20) |
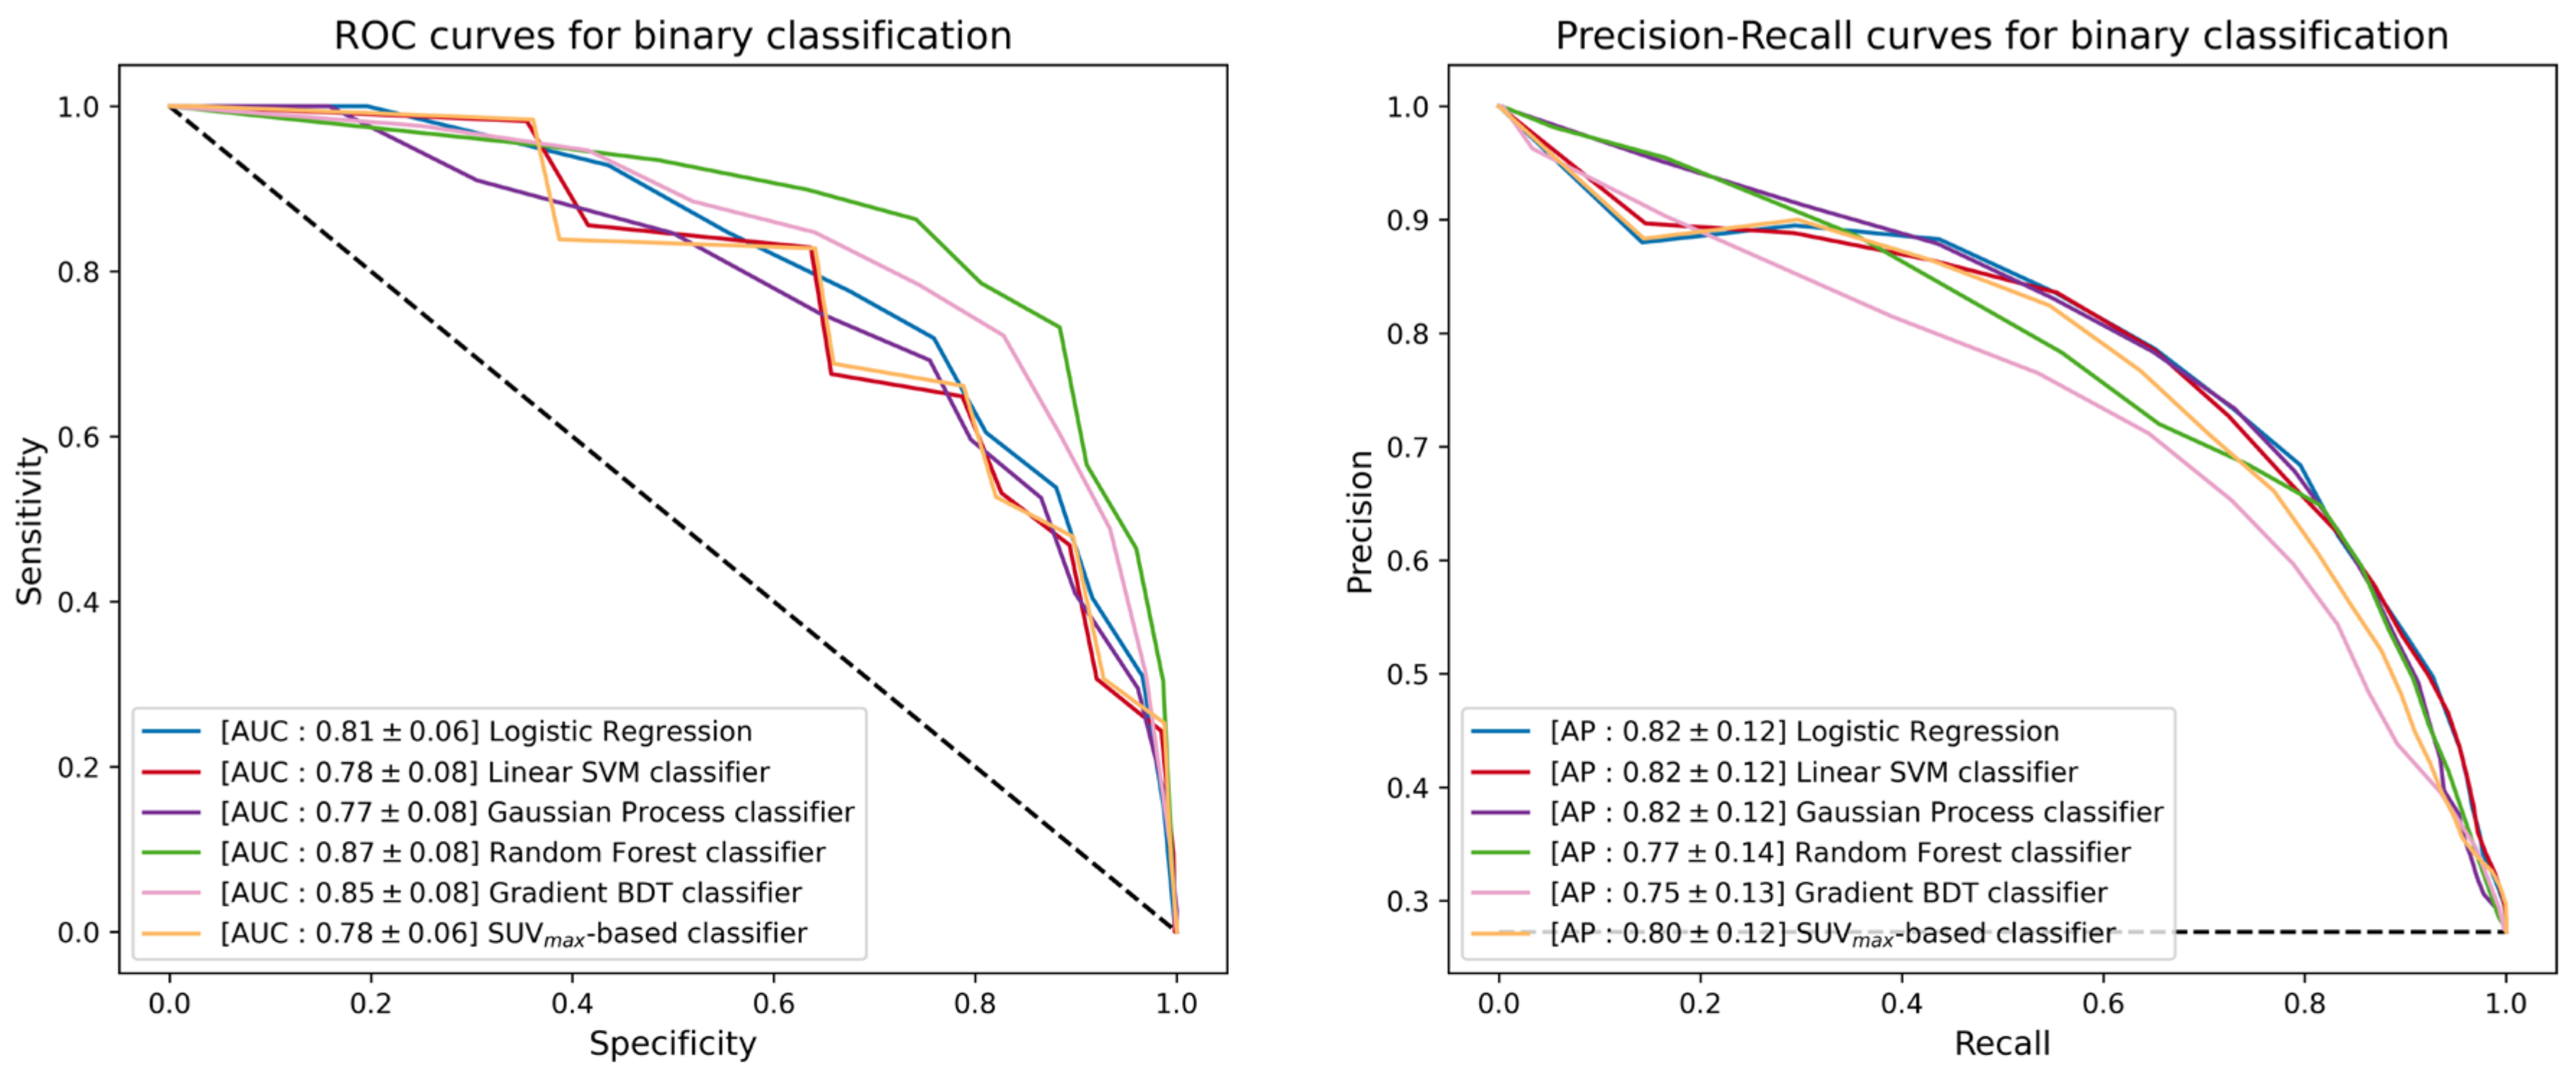
| Logistic Regression | Linear SVM | Gaussian Process | Random Forest | Gradient BDT | |||
|---|---|---|---|---|---|---|---|
| AUC [10th, 32nd percentiles] | 0.81 [0.73, 0.78] | 0.78 [0.68, 0.75] | 0.77 [0.68, 0.75] | 0.87 [0.79, 0.83] | 0.85 [0.74, 0.81] | 0.78 [0.73, 0.75] | |
| AP [10th, 32nd percentiles] | 0.82 [0.64, 0.77] | 0.82 [0.65, 0.76] | 0.82 [0.66, 0.78] | 0.77 [0.56, 0.69] | 0.75 [0.58, 0.69] | 0.80 [0.63, 0.75] | |
| TPR [10th, 32nd percentiles] | Tight requirement | 0.84 [0.67, 0.83] | 0.82 [0.67, 0.83] | 0.85 [0.67, 0.83] | 0.81 [0.50, 0.67] | 0.59 [0.33, 0.50] | 0.88 [0.67, 0.83] |
| Slight requirement | 0.69 [0.50, 0.67] | 0.69 [0.33, 0.67] | 0.69 [0.50, 0.67] | 0.65 [0.33, 0.50] | 0.62 [0.33, 0.50] | 0.76 [0.50, 0.67] | |
| TNR [10th, 32nd percentiles] | Tight requirement | 0.79 [0.62, 0.75] | 0.79 [0.62, 0.75] | 0.77 [0.56, 0.75] | 0.80 [0.62, 0.75] | 0.90 [0.81, 0.88] | 0.63 [0.38, 0.56] |
| Slight requirement | 0.90 [0.81, 0.88] | 0.90 [0.81, 0.88] | 0.91 [0.81, 0.88] | 0.91 [0.81, 0.88] | 0.91 [0.81, 0.88] | 0.82 [0.62, 0.75] | |
| PPV [10th, 32nd percentiles] | Tight requirement | 0.13 [0.11, 0.12] | 0.14 [0.11, 0.12] | 0.14 [0.12, 0.13] | 0.15 [0.10, 0.14] | 0.16 [0.09, 0.14] | 0.12 [0.10, 0.11] |
| Slight requirement | 0.18 [0.13, 0.16] | 0.18 [0.10, 0.17] | 0.18 [0.13, 0.17] | 0.17 [0.09, 0.14] | 0.17 [0.09, 0.14] | 0.18 [0.14, 0.16] | |
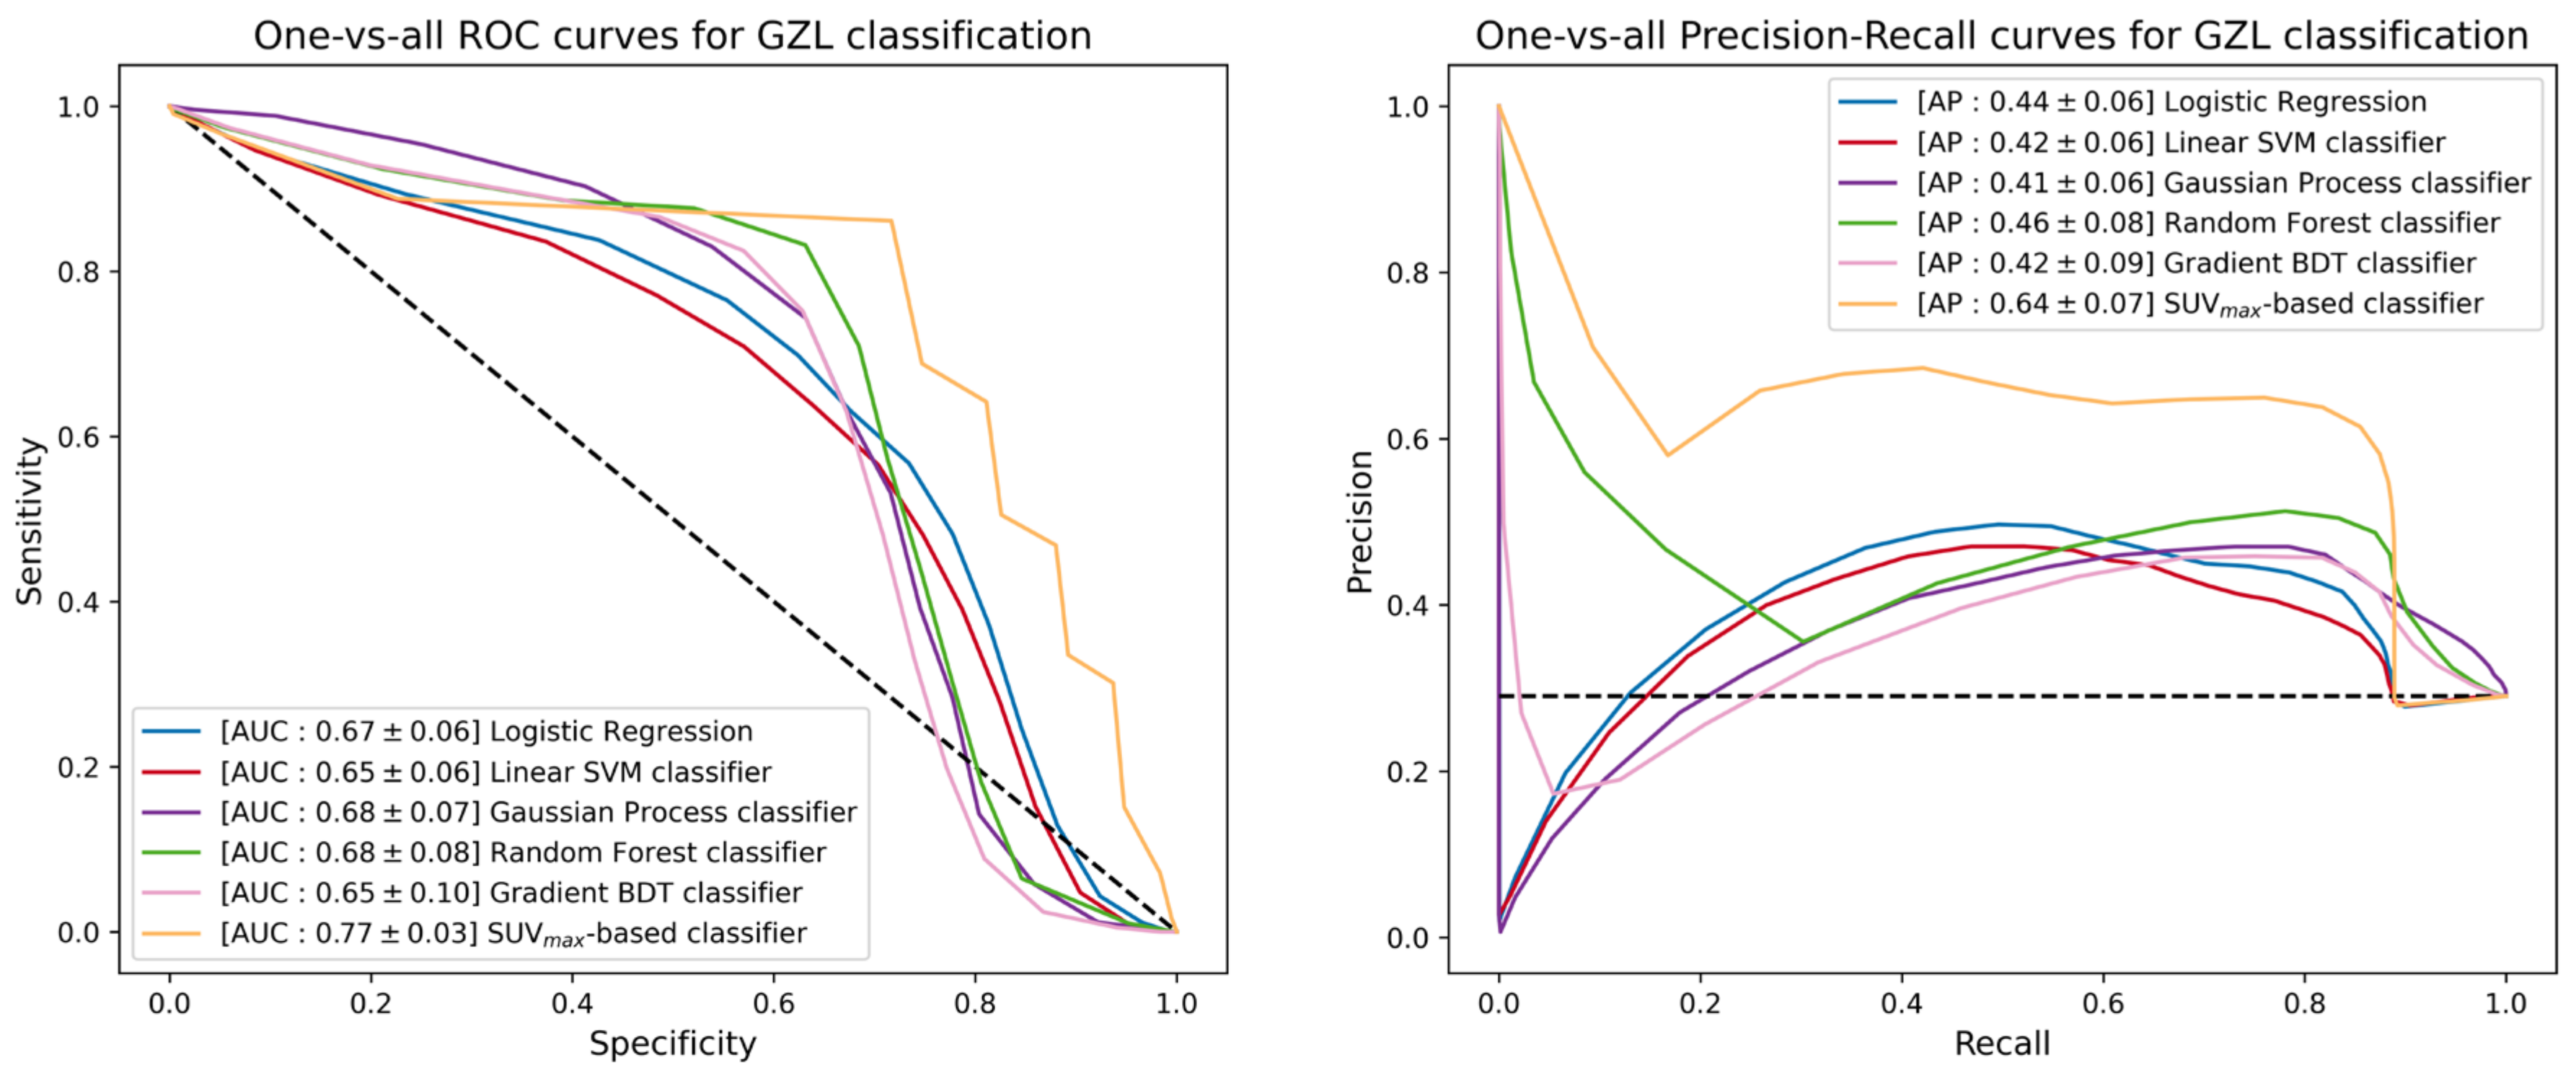
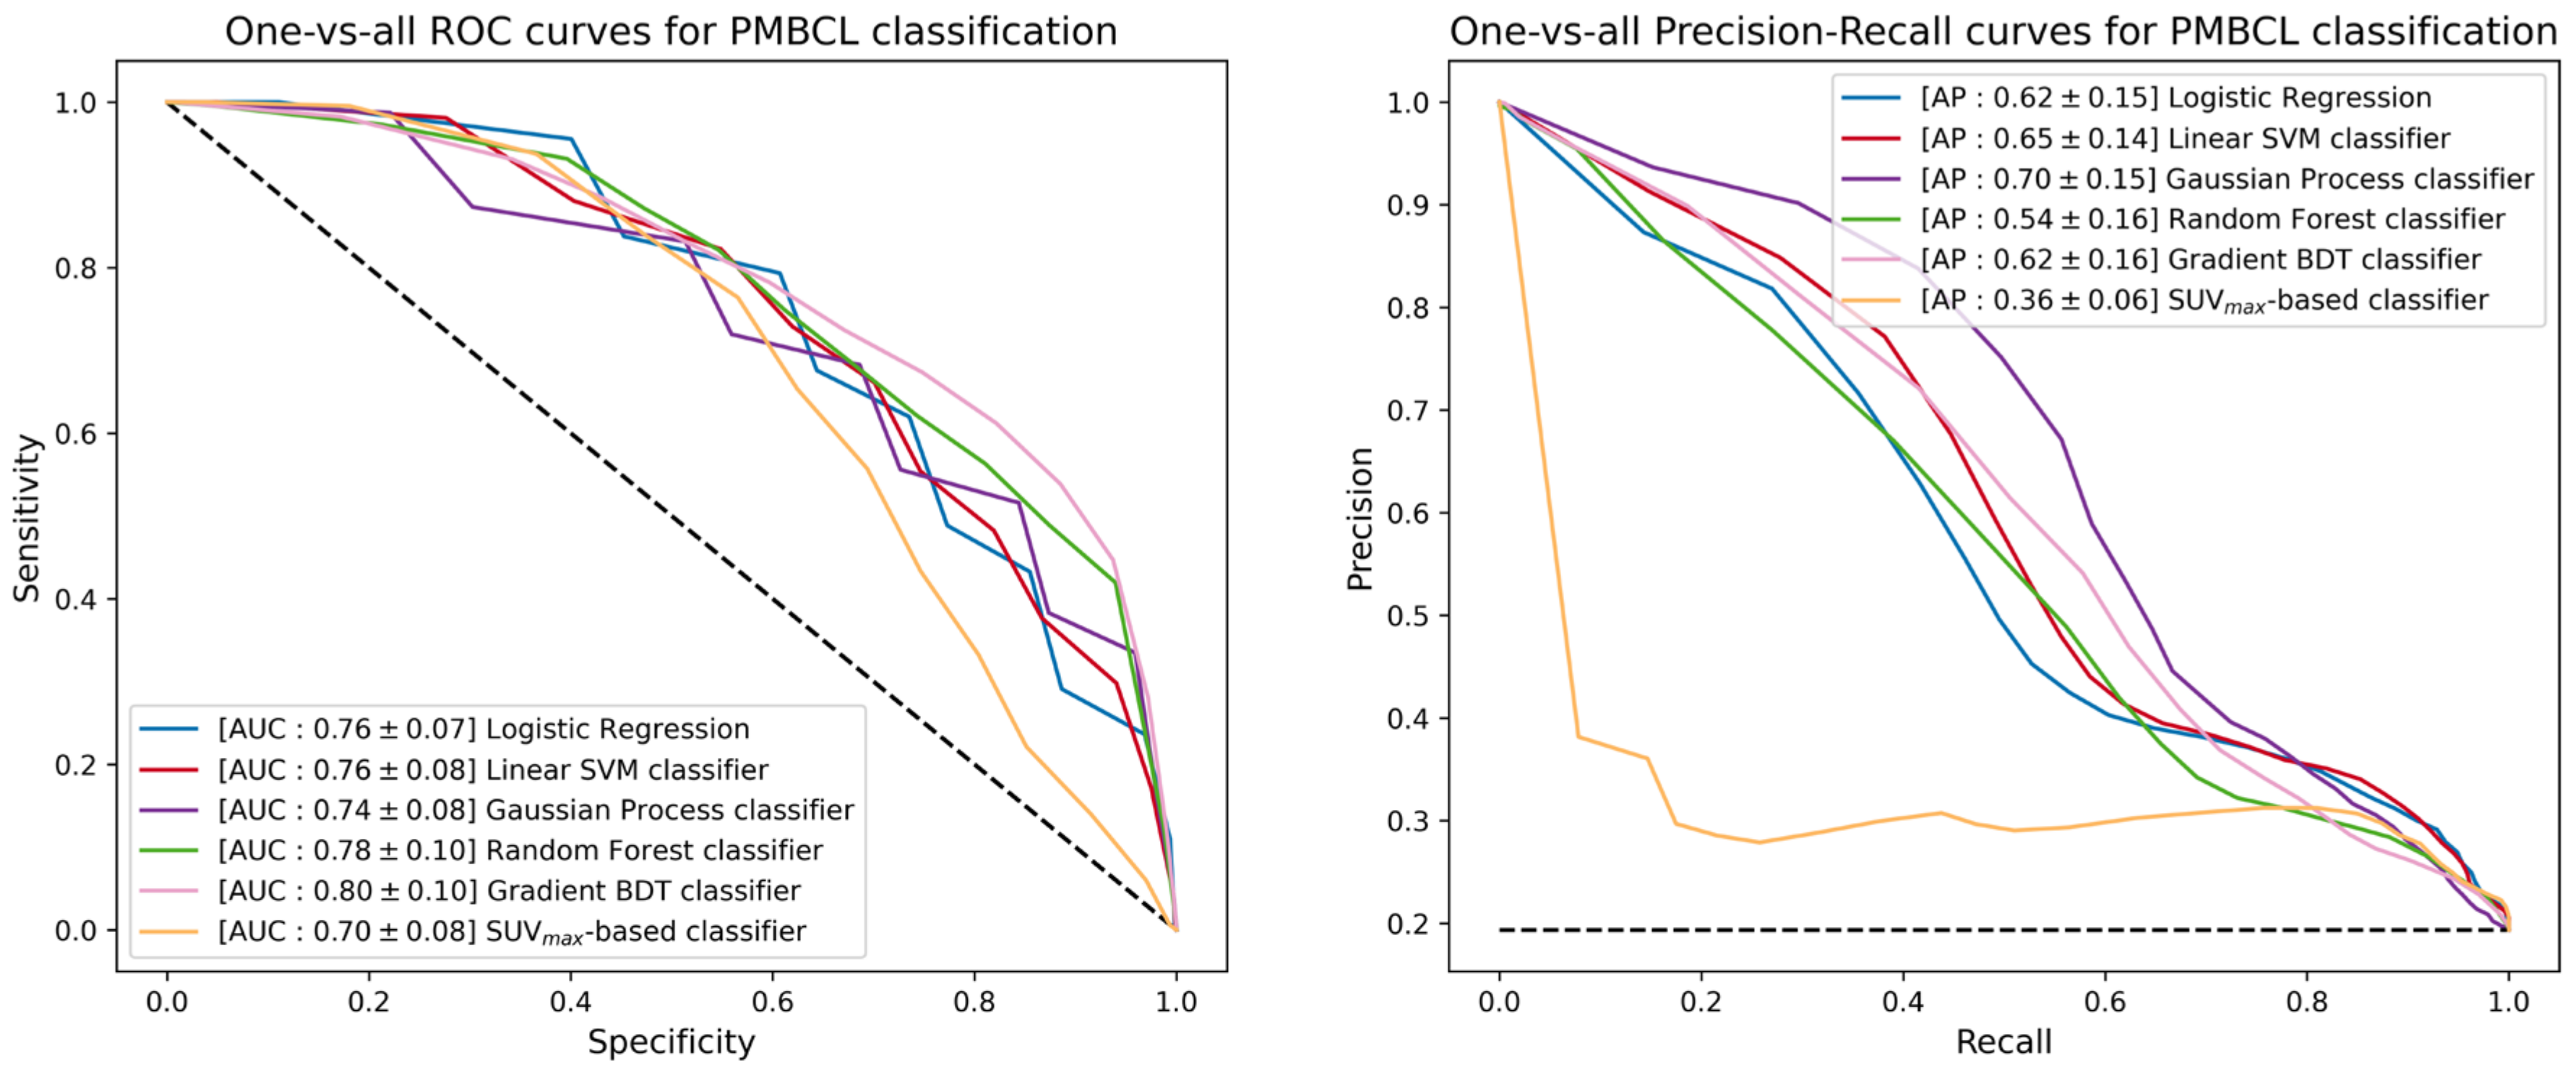
| Logistic Regression | Linear SVM | Gaussian Process | Random Forest | Gradient BDT | |||
|---|---|---|---|---|---|---|---|
| AUC [10th, 32nd percentiles] | One-vs-all for GZL classification | 0.67 [0.60, 0.65] | 0.65 [0.58, 0.63] | 0.68 [0.58, 0.65] | 0.68 [0.59, 0.66] | 0.65 [0.52, 0.62] | 0.77 [0.73, 0.77] |
| One-vs-all for PMBCL classification | 0.76 [0.66, 0.72] | 0.76 [0.66, 0.72] | 0.74 [0.63, 0.71] | 0.78 [0.65, 0.74] | 0.80 [0.66, 0.76] | 0.70 [0.59, 0.67] | |
| AP [10th, 32nd percentiles] | One-vs-all for GZL classification | 0.44 [0.37, 0.41] | 0.42 [0.35, 0.39] | 0.41 [0.33, 0.38] | 0.46 [0.37, 0.42] | 0.42 [0.31, 0.38] | 0.64 [0.55, 0.60] |
| One-vs-all for PMBCL classification | 0.62 [0.42, 0.56] | 0.65 [0.46, 0.58] | 0.70 [0.50, 0.63] | 0.54 [0.33, 0.45] | 0.62 [0.40, 0.55] | 0.36 [0.28, 0.33] | |
| TPR [10th, 32nd percentiles] | One-vs-all for GZL classification | 0.74 [0.67, 0.67] | 0.67 [0.56, 0.67] | 0.86 [0.78, 0.89] | 0.86 [0.89, 0.89] | 0.66 [0.22, 0.56] | 0.89 [0.89, 0.89] |
| One-vs-all for PMBCL classification | 0.84 [0.67, 0.83] | 0.81 [0.65, 0.67] | 0.85 [0.67, 0.83] | 0.80 [0.50, 0.67] | 0.76 [0.50, 0.67] | 0.88 [0.67, 0.83] | |
| TNR [10th, 32nd percentiles] | One-vs-all for GZL classification | 0.60 [0.41, 0.55] | 0.63 [0.45, 0.59] | 0.59 [0.41, 0.55] | 0.64 [0.45, 0.59] | 0.66 [0.50, 0.64] | 0.49 [0.27, 0.41] |
| One-vs-all for PMBCL classification | 0.59 [0.44, 0.67] | 0.63 [0.52, 0.60] | 0.53 [0.40, 0.52] | 0.56 [0.44, 0.52] | 0.64 [0.48, 0.60] | 0.45 [0.28, 0.40] | |
| PPV [10th, 32nd percentiles] | One-vs-all for GZL classification | 0.44 [0.35, 0.40] | 0.43 [0.35, 0.40] | 0.47 [0.38, 0.44] | 0.50 [0.38, 0.47] | 0.44 [0.26, 0.40] | 0.43 [0.27, 0.41] |
| One-vs-all for PMBCL classification | 0.33 [0.27, 0.31] | 0.35 [0.28, 0.32] | 0.31 [0.25, 0.29] | 0.31 [0.24, 0.29] | 0.35 [0.25, 0.30] | 0.28 [0.22, 0.25] |
Disclaimer/Publisher’s Note: The statements, opinions and data contained in all publications are solely those of the individual author(s) and contributor(s) and not of MDPI and/or the editor(s). MDPI and/or the editor(s) disclaim responsibility for any injury to people or property resulting from any ideas, methods, instructions or products referred to in the content. |
© 2023 by the authors. Licensee MDPI, Basel, Switzerland. This article is an open access article distributed under the terms and conditions of the Creative Commons Attribution (CC BY) license (https://creativecommons.org/licenses/by/4.0/).
Share and Cite
Abenavoli, E.M.; Barbetti, M.; Linguanti, F.; Mungai, F.; Nassi, L.; Puccini, B.; Romano, I.; Sordi, B.; Santi, R.; Passeri, A.; et al. Characterization of Mediastinal Bulky Lymphomas with FDG-PET-Based Radiomics and Machine Learning Techniques. Cancers 2023, 15, 1931. https://doi.org/10.3390/cancers15071931
Abenavoli EM, Barbetti M, Linguanti F, Mungai F, Nassi L, Puccini B, Romano I, Sordi B, Santi R, Passeri A, et al. Characterization of Mediastinal Bulky Lymphomas with FDG-PET-Based Radiomics and Machine Learning Techniques. Cancers. 2023; 15(7):1931. https://doi.org/10.3390/cancers15071931
Chicago/Turabian StyleAbenavoli, Elisabetta Maria, Matteo Barbetti, Flavia Linguanti, Francesco Mungai, Luca Nassi, Benedetta Puccini, Ilaria Romano, Benedetta Sordi, Raffaella Santi, Alessandro Passeri, and et al. 2023. "Characterization of Mediastinal Bulky Lymphomas with FDG-PET-Based Radiomics and Machine Learning Techniques" Cancers 15, no. 7: 1931. https://doi.org/10.3390/cancers15071931
APA StyleAbenavoli, E. M., Barbetti, M., Linguanti, F., Mungai, F., Nassi, L., Puccini, B., Romano, I., Sordi, B., Santi, R., Passeri, A., Sciagrà, R., Talamonti, C., Cistaro, A., Vannucchi, A. M., & Berti, V. (2023). Characterization of Mediastinal Bulky Lymphomas with FDG-PET-Based Radiomics and Machine Learning Techniques. Cancers, 15(7), 1931. https://doi.org/10.3390/cancers15071931