
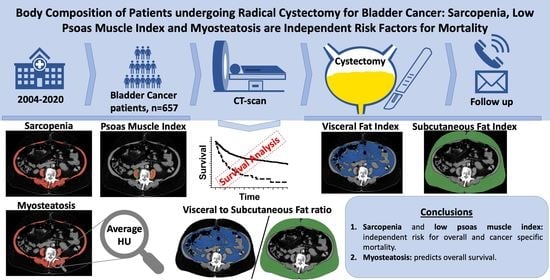
Body Composition of Patients Undergoing Radical Cystectomy for Bladder Cancer: Sarcopenia, Low Psoas Muscle Index, and Myosteatosis Are Independent Risk Factors for Mortality

 ,
,
Abstract
Simple Summary
Abstract
1. Introduction
2. Patients and Methods
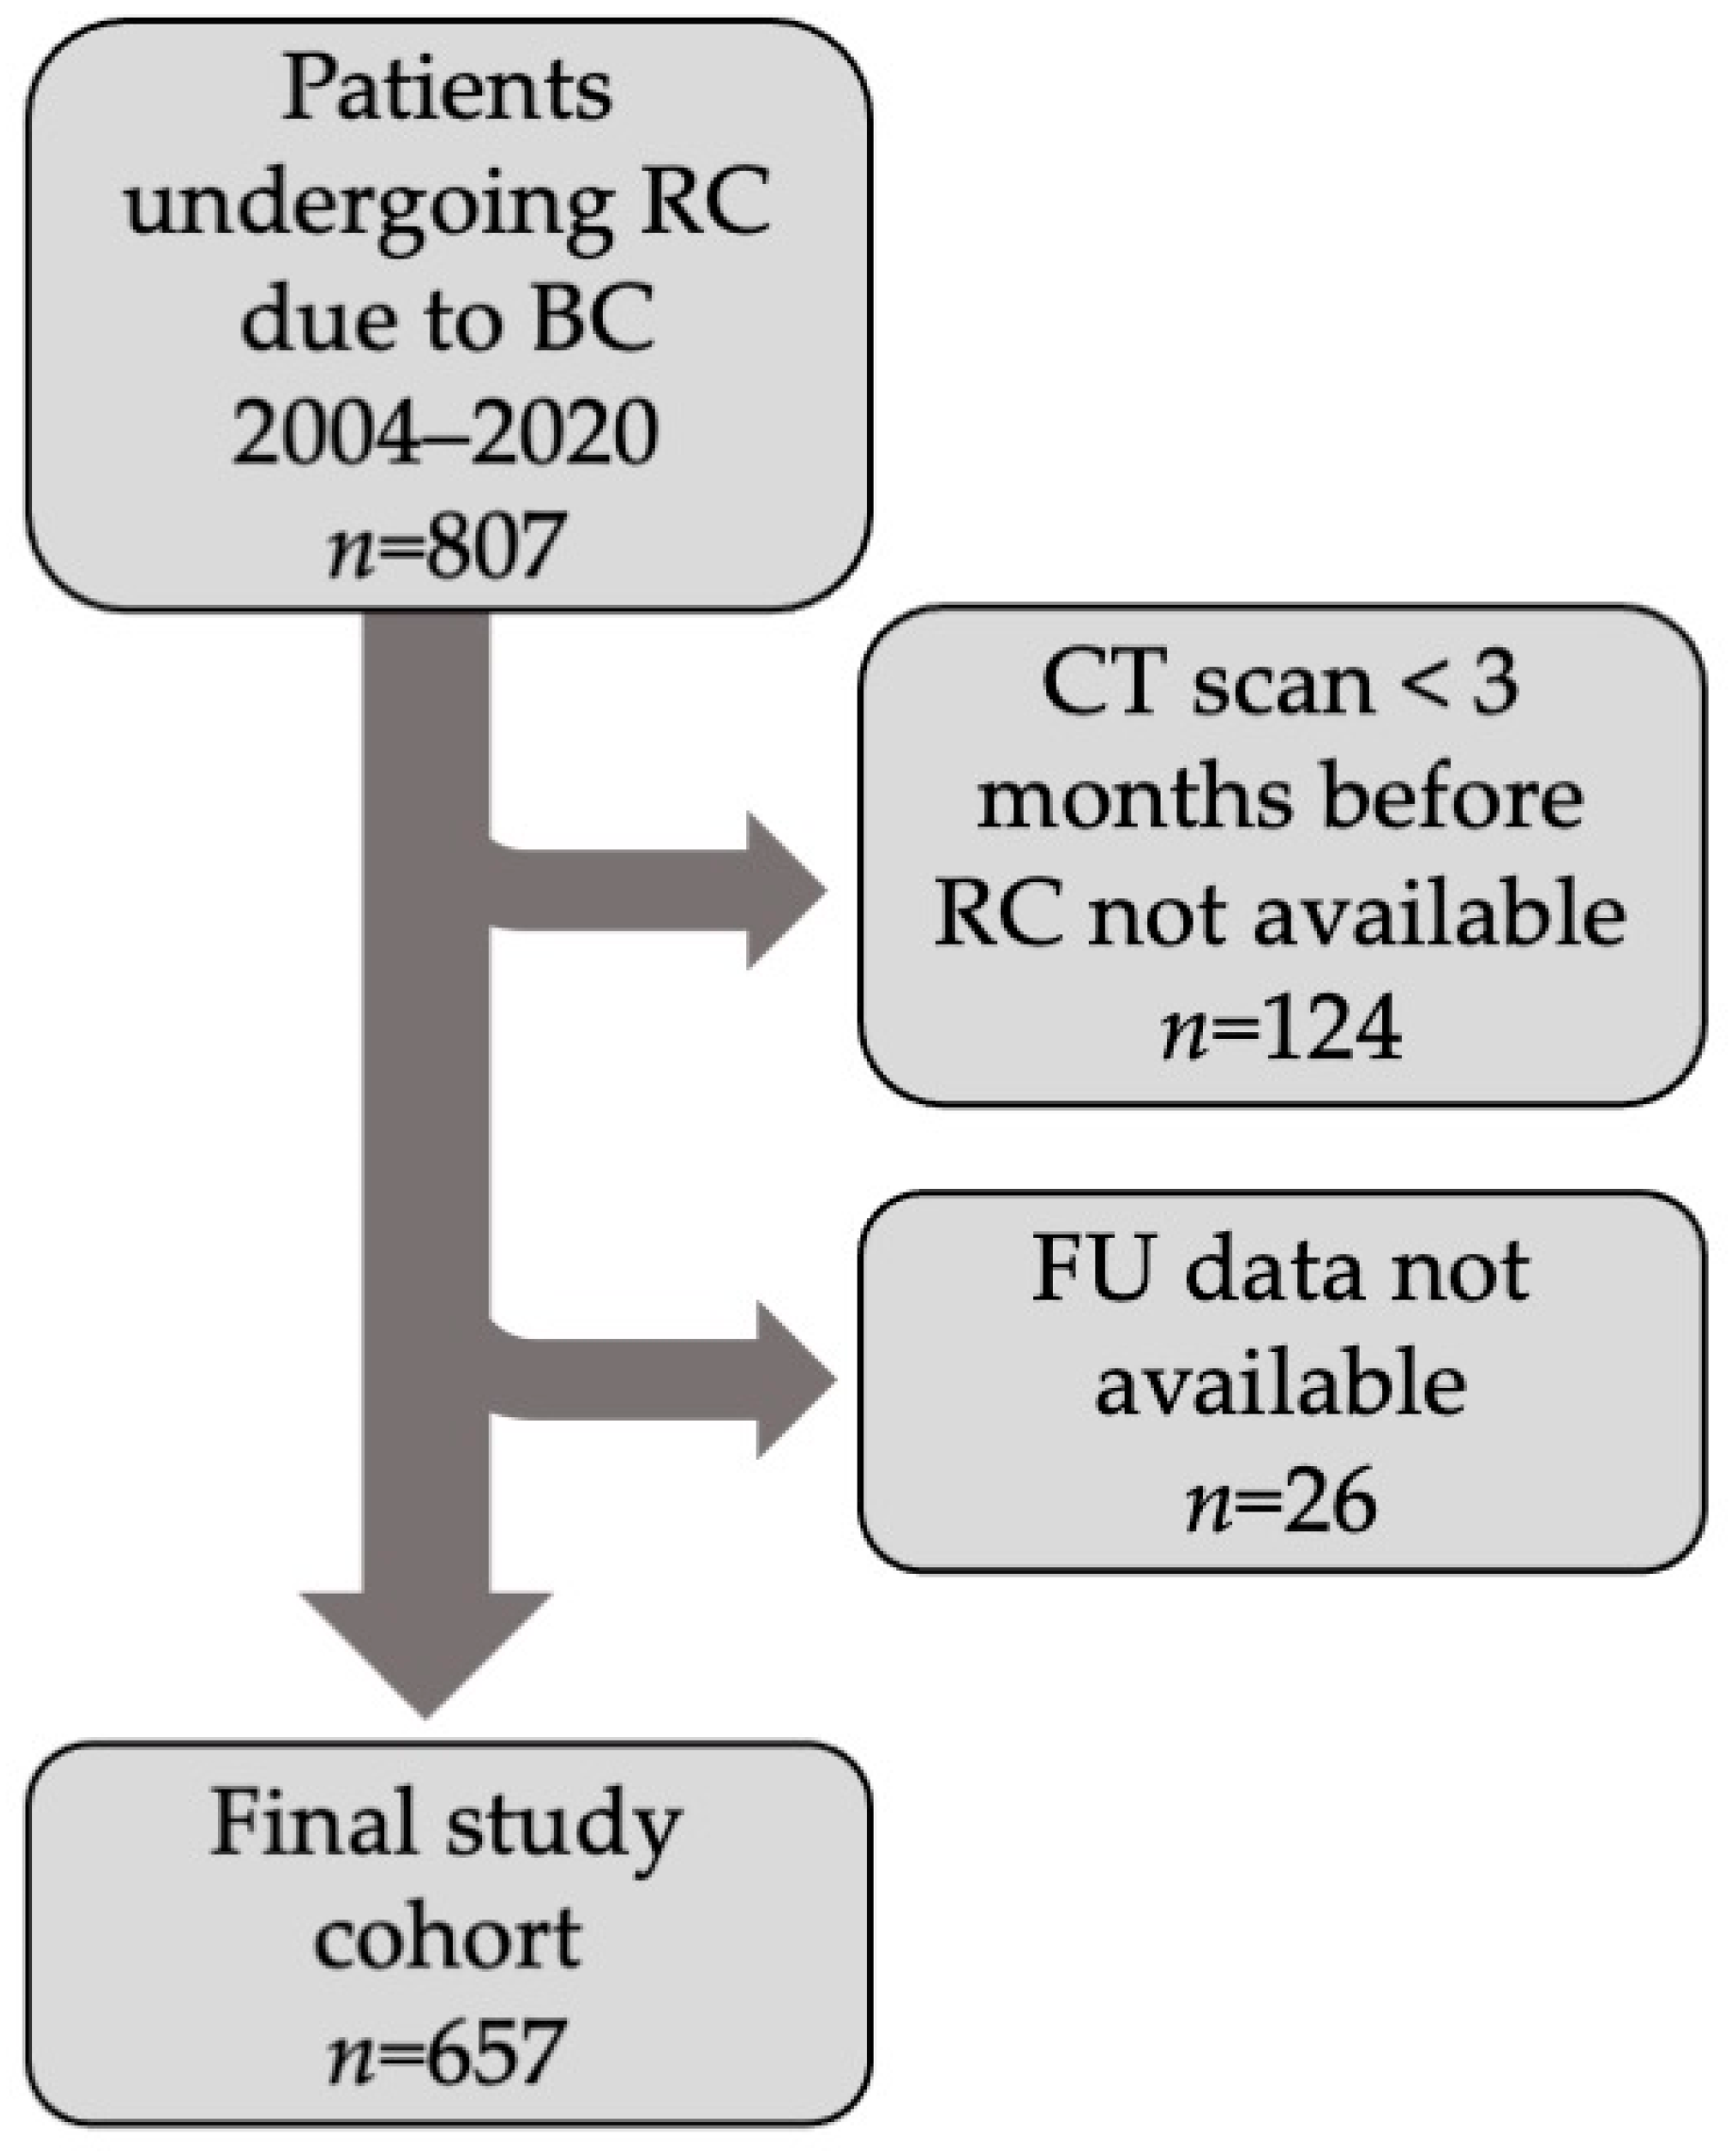
2.1. Patients
2.2. Body Composition Measurements
2.3. Statistical Analysis
3. Results
3.1. Descriptive Data
3.2. Relationship of Sarcopenia with Other Parameters
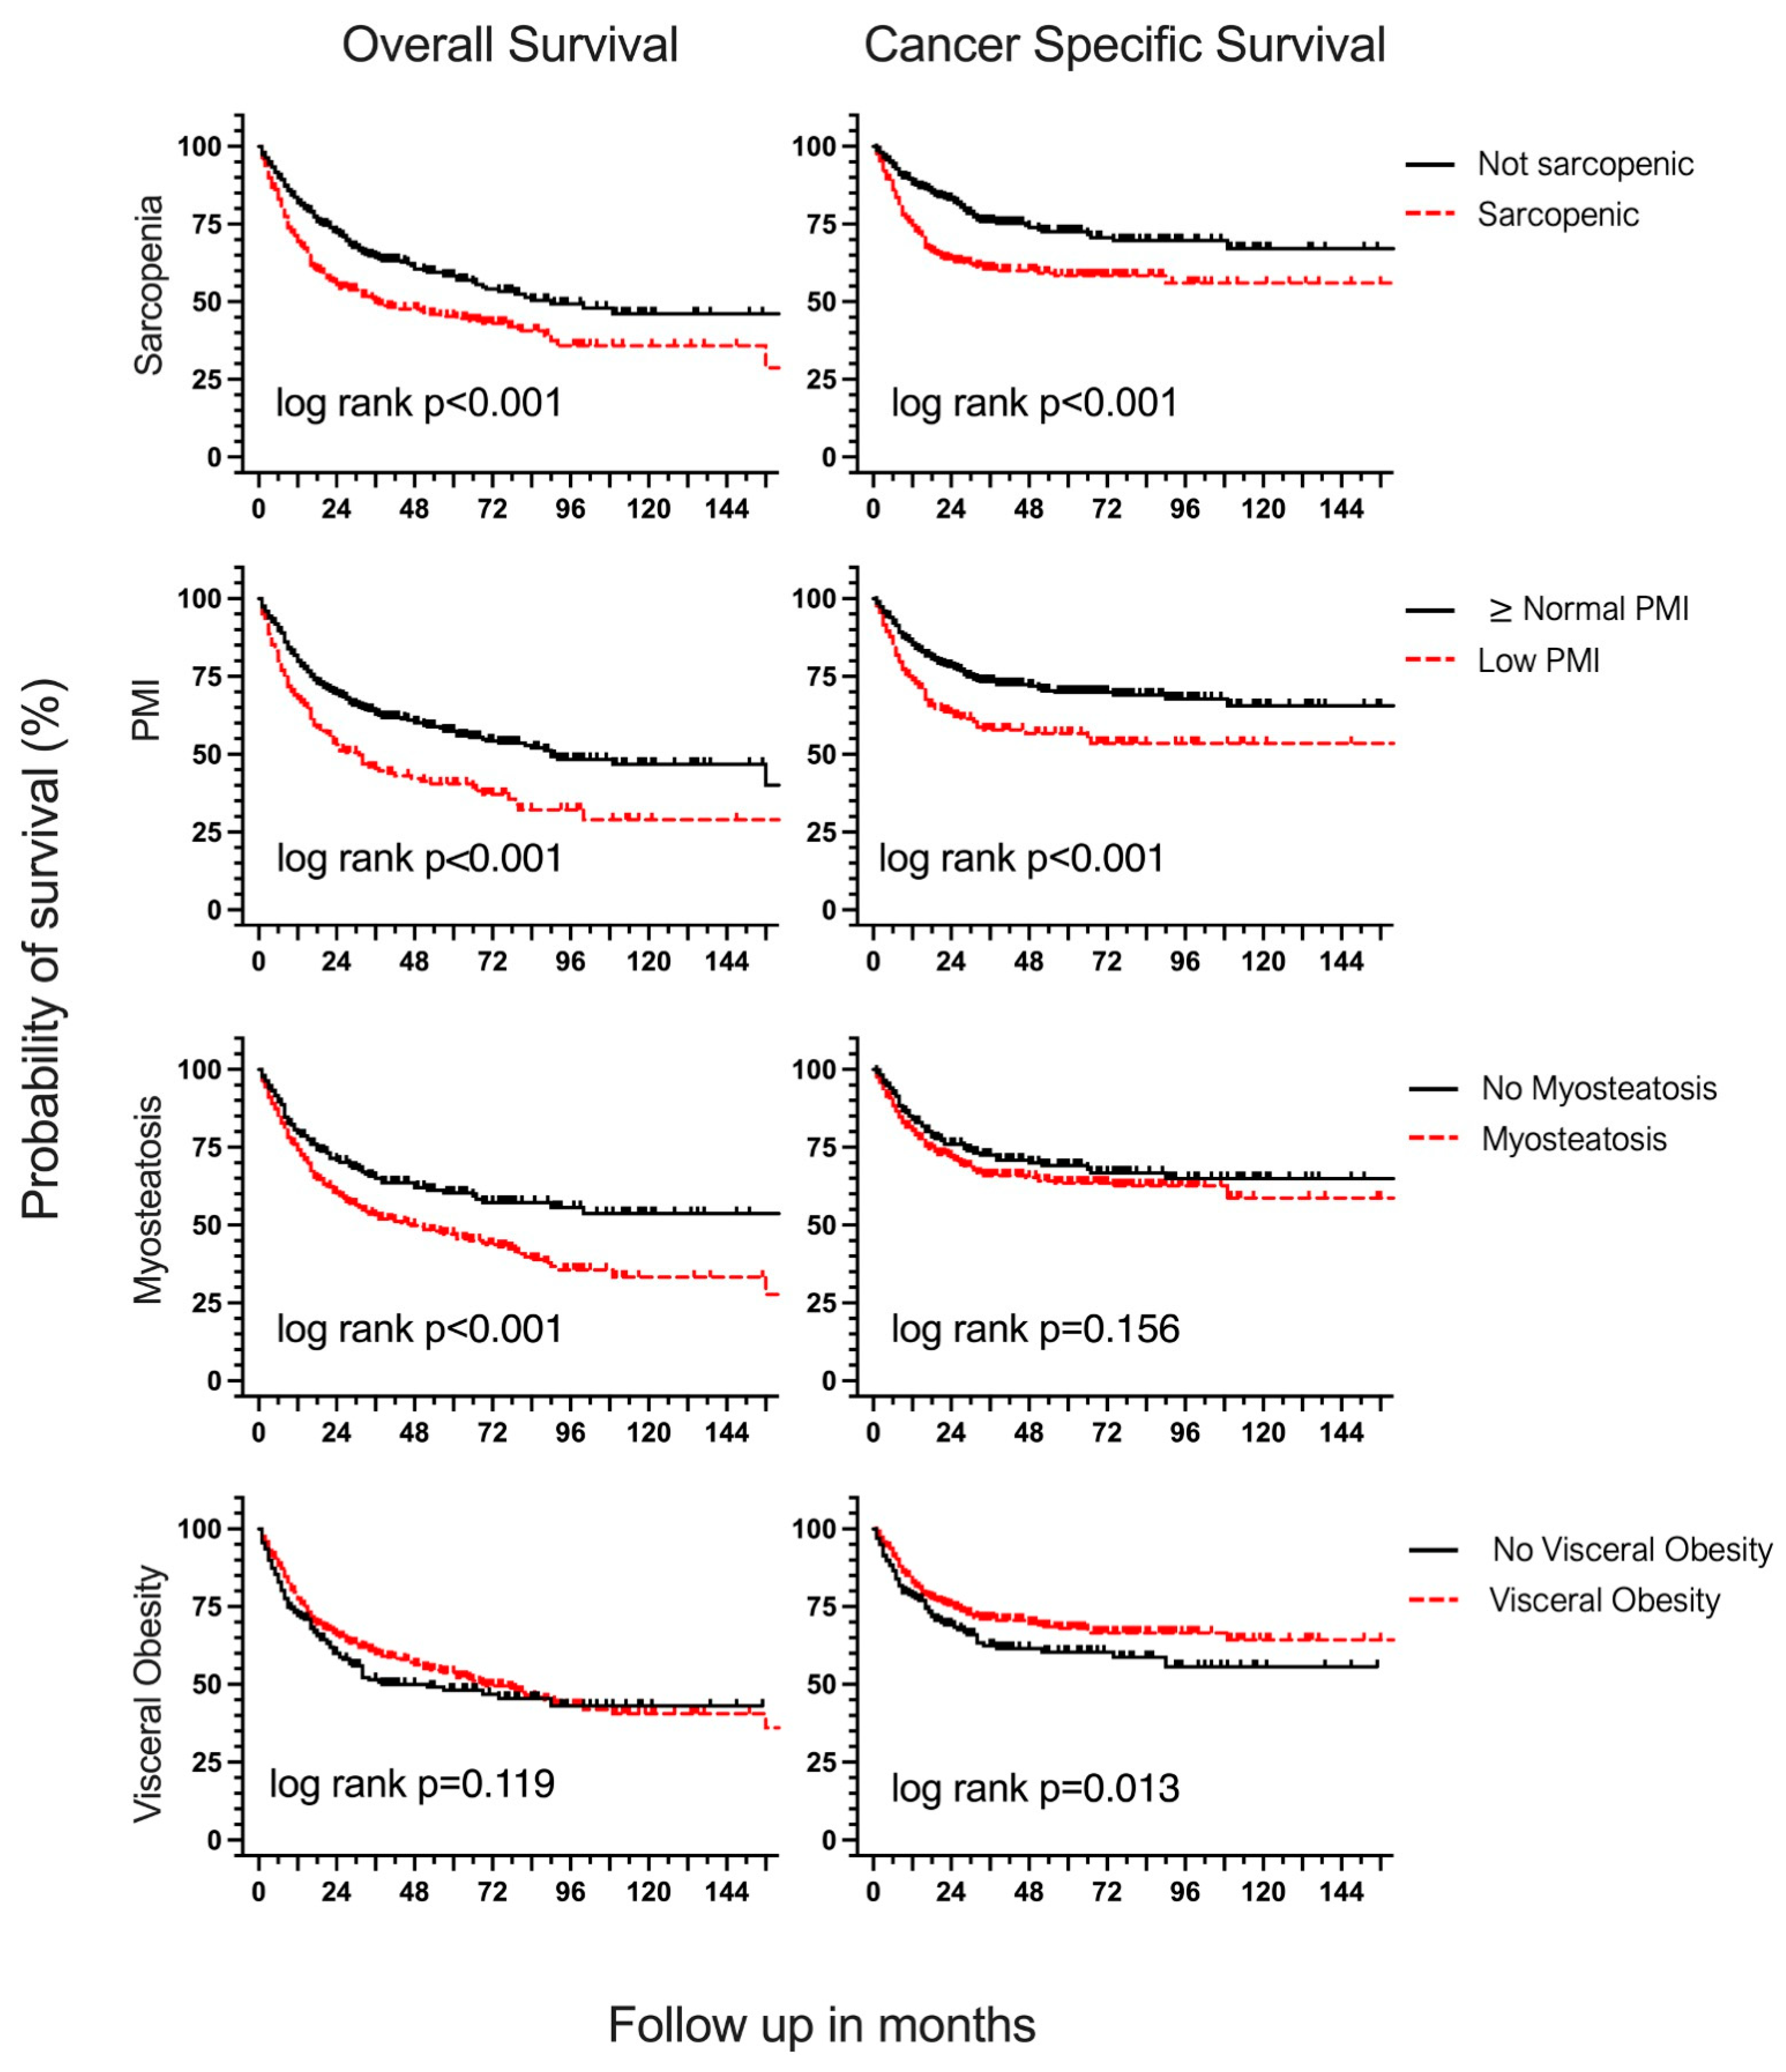
3.3. Body Composition and Overall Survival
3.4. Body Composition and Cancer-Specific Survival
4. Discussion
4.1. Choice of Body Composition Thresholds
4.2. Sarcopenia
4.3. Psoas Muscle Index
4.4. Myosteatosis
4.5. Adipose Tissue Indices
4.6. Limitations
5. Conclusions
Author Contributions
Funding
Institutional Review Board Statement
Informed Consent Statement
Data Availability Statement
Acknowledgments
Conflicts of Interest
References
- Cumberbatch, M.G.K.; Jubber, I.; Black, P.C.; Esperto, F.; Figueroa, J.D.; Kamat, A.M.; Kiemeney, L.; Lotan, Y.; Pang, K.; Silverman, D.T.; et al. Epidemiology of Bladder Cancer: A Systematic Review and Contemporary Update of Risk Factors in 2018. Eur. Urol. 2018, 74, 784–795. [Google Scholar] [CrossRef]
- Siegel, R.L.; Miller, K.D.; Fuchs, H.E.; Jemal, A. Cancer statistics, 2022. CA Cancer J. Clin. 2022, 72, 7–33. [Google Scholar] [CrossRef] [PubMed]
- Krebs in Deutschland Für 2017/2018; Robert Koch-Institut: Berlin, Germany, 2018.
- Witjes, J.A. Bladder cancer in 2015: Improving indication, technique and outcome of radical cystectomy. Nat. Rev. Urol. 2016, 13, 74–75. [Google Scholar] [CrossRef]
- Vlaming, M.; Kiemeney, L.A.L.M.; van der Heijden, A.G. Survival after radical cystectomy: Progressive versus De novo muscle invasive bladder cancer. Cancer Treat. Res. Commun. 2020, 25, 100264. [Google Scholar] [CrossRef] [PubMed]
- Boorjian, S.A.; Kim, S.P.; Tollefson, M.K.; Carrasco, A.; Cheville, J.C.; Thompson, R.H.; Thapa, P.; Frank, I. Comparative performance of comorbidity indices for estimating perioperative and 5-year all cause mortality following radical cystectomy for bladder cancer. J. Urol. 2013, 190, 55–60. [Google Scholar] [CrossRef]
- Mayr, R.; May, M.; Martini, T.; Lodde, M.; Comploj, E.; Pycha, A.; Strobel, J.; Denzinger, S.; Otto, W.; Wieland, W.; et al. Comorbidity and performance indices as predictors of cancer-independent mortality but not of cancer-specific mortality after radical cystectomy for urothelial carcinoma of the bladder. J. Urol. 2012, 190, 865. [Google Scholar] [CrossRef] [PubMed]
- Bauer, J.; Morley, J.E.; Schols, A.M.W.J.; Ferrucci, L.; Cruz-Jentoft, A.J.; Dent, E.; Baracos, V.E.; Crawford, J.A.; Doehner, W.; Heymsfield, S.B.; et al. Sarcopenia: A Time for Action. An SCWD Position Paper. J. Cachexia. Sarcopenia Muscle 2019, 10, 956–961. [Google Scholar] [CrossRef]
- Mayr, R.; Gierth, M.; Zeman, F.; Reiffen, M.; Seeger, P.; Wezel, F.; Pycha, A.; Comploj, E.; Bonatti, M.; Ritter, M.; et al. Sarcopenia as a comorbidity-independent predictor of survival following radical cystectomy for bladder cancer. J. Cachexia. Sarcopenia Muscle 2018, 9, 505–513. [Google Scholar] [CrossRef]
- Martini, D.J.; Shabto, J.M.; Goyal, S.; Liu, Y.; Olsen, T.A.; Evans, S.T.; Magod, B.L.; Ravindranathan, D.; Brown, J.T.; Yantorni, L.; et al. Body Composition as an Independent Predictive and Prognostic Biomarker in Advanced Urothelial Carcinoma Patients Treated with Immune Checkpoint Inhibitors. Oncologist 2021, 26, 1017–1025. [Google Scholar] [CrossRef]
- Ebadi, M.; Martin, L.; Ghosh, S.; Field, C.J.; Lehner, R.; Baracos, V.E.; Mazurak, V.C. Subcutaneous adiposity is an independent predictor of mortality in cancer patients. Br. J. Cancer 2017, 117, 148–155. [Google Scholar] [CrossRef] [PubMed]
- Boshier, P.R.; Heneghan, R.; Markar, S.R.; Baracos, V.E.; Low, D.E. Assessment of body composition and sarcopenia in patients with esophageal cancer: A systematic review and meta-analysis. Dis. Esophagus 2018, 31, doy047. [Google Scholar] [CrossRef]
- Coletta, A.M.; Sayegh, N.; Agarwal, N. Body composition and metastatic prostate cancer survivorship. Cancer Treat. Res. Commun. 2021, 27, 100322. [Google Scholar] [CrossRef] [PubMed]
- Martin, L.; Birdsell, L.; MacDonald, N.; Reiman, T.; Clandinin, M.T.; McCargar, L.J.; Murphy, R.; Ghosh, S.; Sawyer, M.B.; Baracos, V.E. Cancer cachexia in the age of obesity: Skeletal muscle depletion is a powerful prognostic factor, independent of body mass index. J. Clin. Oncol. 2013, 31, 1539–1547. [Google Scholar] [CrossRef]
- Dolan, R.D.; Almasaudi, A.S.; Dieu, L.B.; Horgan, P.G.; McSorley, S.T.; McMillan, D.C. The relationship between computed tomography-derived body composition, systemic inflammatory response, and survival in patients undergoing surgery for colorectal cancer. J. Cachexia. Sarcopenia Muscle 2019, 10, 111–122. [Google Scholar] [CrossRef] [PubMed]
- Bamba, S.; Inatomi, O.; Takahashi, K.; Morita, Y.; Imai, T.; Ohno, M.; Kurihara, M.; Takebayashi, K.; Kojima, M.; Iida, H.; et al. Assessment of Body Composition from CT Images at the Level of the Third Lumbar Vertebra in Inflammatory Bowel Disease. Inflamm. Bowel Dis. 2021, 27, 1435–1442. [Google Scholar] [CrossRef]
- Kasahara, R.; Kawahara, T.; Ohtake, S.; Saitoh, Y.; Tsutsumi, S.; Teranishi, J.I.; Miyoshi, Y.; Nakaigawa, N.; Yao, M.; Kobayashi, K.; et al. A low psoas muscle index before treatment can predict a poorer prognosis in advanced bladder cancer patients who receive gemcitabine and nedaplatin therapy. Biomed Res. Int. 2017, 2017, 7981549. [Google Scholar] [CrossRef] [PubMed]
- Xiao, J.; Caan, B.J.; Weltzien, E.; Cespedes Feliciano, E.M.; Kroenke, C.H.; Meyerhardt, J.A.; Baracos, V.E.; Kwan, M.L.; Castillo, A.L.; Prado, C.M. Associations of pre-existing co-morbidities with skeletal muscle mass and radiodensity in patients with non-metastatic colorectal cancer. J. Cachexia. Sarcopenia Muscle 2018, 9, 654–663. [Google Scholar] [CrossRef]
- Derstine, B.A.; Holcombe, S.A.; Ross, B.E.; Wang, N.C.; Su, G.L.; Wang, S.C. Skeletal muscle cutoff values for sarcopenia diagnosis using T10 to L5 measurements in a healthy US population. Sci. Rep. 2018, 8, 11369. [Google Scholar] [CrossRef]
- Han, J.; Tang, M.; Lu, C.; Shen, L.; She, J.; Wu, G. Subcutaneous, but not visceral, adipose tissue as a marker for prognosis in gastric cancer patients with cachexia. Clin. Nutr. 2021, 40, 5156–5161. [Google Scholar] [CrossRef] [PubMed]
- Tan, B.H.L.; Birdsell, L.A.; Martin, L.; Baracos, V.E.; Fearon, K.C.H. Sarcopenia in an overweight or obese patient is an adverse prognostic factor in pancreatic cancer. Clin. Cancer Res. 2009, 15, 6973–6979. [Google Scholar] [CrossRef]
- Torres, M.L.; Hartmann, L.C.; Cliby, W.A.; Kalli, K.R.; Young, P.M.; Weaver, A.L.; Langstraat, C.L.; Jatoi, A.; Kumar, S.; Mariani, A. Nutritional status, CT body composition measures and survival in ovarian cancer. Gynecol. Oncol. 2013, 129, 548–553. [Google Scholar] [CrossRef]
- Kim, S.I.; Kim, T.M.; Lee, M.; Kim, H.S.; Chung, H.H.; Cho, J.Y.; Song, Y.S. Impact of ct-determined sarcopenia and body composition on survival outcome in patients with advanced-stage high-grade serous ovarian carcinoma. Cancers 2020, 12, 559. [Google Scholar] [CrossRef]
- Lurje, I.; Czigany, Z.; Eischet, S.; Bednarsch, J.; Ulmer, T.F.; Isfort, P.; Strnad, P.; Trautwein, C.; Tacke, F.; Neumann, U.P.; et al. The prognostic impact of preoperative body composition in perihilar and intrahepatic cholangiocarcinoma. Hepatol. Commun. 2022, 6, 2400–2417. [Google Scholar] [CrossRef] [PubMed]
- Benedek, Z.; Todor-Boér, S.; Kocsis, L.; Bauer, O.; Suciu, N.; Coroș, M.F. Psoas muscle index defined by computer tomography predicts the presence of postoperative complications in colorectal cancer surgery. Medicina 2021, 57, 472. [Google Scholar] [CrossRef]
- Yoshikawa, T.; Miyamoto, M.; Aoyama, T.; Matsuura, H.; Iwahashi, H.; Ishibashi, H.; Kakimoto, S.; Sakamoto, T.; Takasaki, K.; Suminokura, J.; et al. Psoas muscle index at the fifth lumbar vertebra as a predictor of survival in epithelial ovarian cancers. Mol. Clin. Oncol. 2021, 15, 177. [Google Scholar] [CrossRef] [PubMed]
- Iwamoto, G.; Kawahara, T.; Miyai, T.; Yasui, M.; Hasumi, H.; Miyoshi, Y.; Yao, M.; Uemura, H. A lower psoas muscle index predicts a poorer prognosis in metastatic hormone-naïve prostate cancer. BJUI Compass 2021, 2, 39–45. [Google Scholar] [CrossRef] [PubMed]
- Cushen, S.J.; Power, D.G.; Murphy, K.P.; McDermott, R.; Griffin, B.T.; Lim, M.; Daly, L.; MacEneaney, P.; O’ Sullivan, K.; Prado, C.M.; et al. Impact of body composition parameters on clinical outcomes in patients with metastatic castrate-resistant prostate cancer treated with docetaxel. Clin. Nutr. ESPEN 2016, 13, e39–e45. [Google Scholar] [CrossRef] [PubMed]
- Sugino, Y.; Sasaki, T.; Kato, M.; Masui, S.; Nishikawa, K.; Okamoto, T.; Kajiwara, S.; Shibahara, T.; Onishi, T.; Tanaka, S.; et al. Prognostic effect of preoperative psoas muscle hounsfield unit at radical cystectomy for bladder cancer. Cancers 2021, 13, 5629. [Google Scholar] [CrossRef]
- Lennon, H.; Sperrin, M.; Badrick, E.; Renehan, A.G. The Obesity Paradox in Cancer: A Review. Curr. Oncol. Rep. 2016, 18, 56. [Google Scholar] [CrossRef]
- Psutka, S.P.; Carrasco, A.; Schmit, G.D.; Moynagh, M.R.; Boorjian, S.A.; Frank, I.; Stewart, S.B.; Thapa, P.; Tarrell, R.F.; Cheville, J.C.; et al. Sarcopenia in patients with bladder cancer undergoing radical cystectomy: Impact on cancer-specific and all-cause mortality. Cancer 2014, 120, 2910–2918. [Google Scholar] [CrossRef]
- Stangl-Kremser, J.; Ahmadi, H.; Derstine, B.; Wang, S.C.; Englesbe, M.J.; Daignault-Newton, S.; Chernin, A.S.; Montgomery, J.S.; Palapattu, G.S.; Lee, C.T. Psoas Muscle Mass can Predict Postsurgical Outcomes in Patients Who Undergo Radical Cystectomy and Urinary Diversion Reconstruction. Urology 2021, 158, 142–149. [Google Scholar] [CrossRef] [PubMed]
- Yamashita, S.; Iguchi, T.; Koike, H.; Wakamiya, T.; Kikkawa, K.; Kohjimoto, Y.; Hara, I. Impact of preoperative sarcopenia and myosteatosis on prognosis after radical cystectomy in patients with bladder cancer. Int. J. Urol. 2021, 28, 757–762. [Google Scholar] [CrossRef] [PubMed]
- Psutka, S.P.; Boorjian, S.A.; Moynagh, M.R.; Schmit, G.D.; Frank, I.; Carrasco, A.; Stewart, S.B.; Tarrell, R.; Thapa, P.; Matthew, K. Mortality after Radical Cystectomy: Impact of Obesity Versus Adiposity after Adjusting for Skeletal Muscle Wasting. J. Urol. 2015, 193, 1507–1513. [Google Scholar] [CrossRef] [PubMed]
- Stangl-Kremser, J.; D’Andrea, D.; Vartolomei, M.; Abufaraj, M.; Goldner, G.; Baltzer, P.; Shariat, S.F.; Tamandl, D. Prognostic value of nutritional indices and body composition parameters including sarcopenia in patients treated with radiotherapy for urothelial carcinoma of the bladder. Urol. Oncol. Semin. Orig. Investig. 2019, 37, 372–379. [Google Scholar] [CrossRef] [PubMed]
- Piccirillo, J.F.; Tierney, R.M.; Costas, I.; Grove, L.; Spitznagel, E.L. Prognostic importance of comorbidity in a hospital-based cancer registry. JAMA 2004, 291, 2441–2447. [Google Scholar] [CrossRef]
- Mitsiopoulos, N.; Baumgartner, R.N.; Heymsfield, S.B.; Lyons, W.; Gallagher, D.; Ross, R. Cadaver validation of skeletal muscle measurement by magnetic resonance imaging and computerized tomography. J. Appl. Physiol. 1998, 85, 115–122. [Google Scholar] [CrossRef]
- Mourtzakis, M.; Prado, C.M.M.; Lieffers, J.R.; Reiman, T.; McCargar, L.J.; Baracos, V.E. A practical and precise approach to quantification of body composition in cancer patients using computed tomography images acquired during routine care. Appl. Physiol. Nutr. Metab. 2008, 33, 997–1006. [Google Scholar] [CrossRef]
- Prado, C.M.; Lieffers, J.R.; McCargar, L.J.; Reiman, T.; Sawyer, M.B.; Martin, L.; Baracos, V.E. Prevalence and clinical implications of sarcopenic obesity in patients with solid tumours of the respiratory and gastrointestinal tracts: A population-based study. Lancet Oncol. 2008, 9, 629–635. [Google Scholar] [CrossRef]
- Fearon, K.; Strasser, F.; Anker, S.D.; Bosaeus, I.; Bruera, E.; Fainsinger, R.L.; Jatoi, A.; Loprinzi, C.; MacDonald, N.; Mantovani, G.; et al. Definition and classification of cancer cachexia: An international consensus. Lancet Oncol. 2011, 12, 489–495. [Google Scholar] [CrossRef]
- Doyle, S.L.; Bennett, A.M.; Donohoe, C.L.; Mongan, A.M.; Howard, J.M.; Lithander, F.E.; Pidgeon, G.P.; Reynolds, J.V.; Lysaght, J. Establishing computed tomography-defined visceral fat area thresholds for use in obesity-related cancer research. Nutr. Res. 2013, 33, 171–179. [Google Scholar] [CrossRef]
- Budczies, J.; Klauschen, F.; Sinn, B.V.; Gyorffy, B.; Schmitt, W.D.; Darb-Esfahani, S.; Denkert, C. Cutoff Finder: A Comprehensive and Straightforward Web Application Enabling Rapid Biomarker Cutoff Optimization. PLoS ONE 2012, 7, e51862. [Google Scholar] [CrossRef]
- Caan, B.J.; Meyerhardt, J.A.; Kroenke, C.H.; Alexeeff, S.; Xiao, J.; Weltzien, E.; Feliciano, E.C.; Castillo, A.L.; Quesenberry, C.P.; Kwan, M.L.; et al. Explaining the obesity paradox: The association between body composition and colorectal cancer survival (c-scans study). Cancer Epidemiol. Biomark. Prev. 2017, 26, 1008–1015. [Google Scholar] [CrossRef]
- Hari, A.; Berzigotti, A.; Štabuc, B.; Caglevič, N. Muscle psoas indices measured by ultrasound in cirrhosis—Preliminary evaluation of sarcopenia assessment and prediction of liver decompensation and mortality. Dig. Liver Dis. 2019, 51, 1502–1507. [Google Scholar] [CrossRef] [PubMed]
- Hirasawa, Y.; Nakashima, J.; Yunaiyama, D.; Sugihara, T.; Gondo, T.; Nakagami, Y.; Horiguchi, Y.; Ohno, Y.; Namiki, K.; Ohori, M.; et al. Sarcopenia as a Novel Preoperative Prognostic Predictor for Survival in Patients with Bladder Cancer Undergoing Radical Cystectomy. Ann. Surg. Oncol. 2016, 23, 1048–1054. [Google Scholar] [CrossRef] [PubMed]
- Taguchi, S.; Nakagawa, T.; Fukuhara, H. Inconsistencies in currently used definitions of sarcopenia in oncology. Ann. Oncol. 2020, 31, 318–319. [Google Scholar] [CrossRef] [PubMed]
- Derstine, B.A.; Holcombe, S.A.; Goulson, R.L.; Ross, B.E.; Wang, N.C.; Sullivan, J.A.; Su, G.L.; Wang, S.C. Quantifying Sarcopenia Reference Values Using Lumbar and Thoracic Muscle Areas in a Healthy Population. J. Nutr. Health Aging 2018, 22, 180–185. [Google Scholar] [CrossRef] [PubMed]
- Scarberry, K.; Scarberry, K.; Agrawal, S.; Kim, S.P. Resection margins after radical cystectomy at academic versus community cancer centers. J. Clin. Oncol. 2017, 35, 315. [Google Scholar] [CrossRef]
- John, S.; Lieskovsky, G.; Cote, R.; Groshen, S.; Feng, A.-C.; Boyd, S.; Skinner, E.; Bochner, B.; Thangathurai, D.; Mikhail, M.; et al. Radical Cystectomy in the Treatment of Invasive Bladder Cancer: Long-Term Resulty in 1053 Patients. J. Clin. Oncol. 2001, 19, 666–675. [Google Scholar]
- Yamamoto, K.; Nagatsuma, Y.; Fukuda, Y.; Hirao, M.; Nishikawa, K.; Miyamoto, A.; Ikeda, M.; Nakamori, S.; Sekimoto, M.; Fujitani, K.; et al. Effectiveness of a preoperative exercise and nutritional support program for elderly sarcopenic patients with gastric cancer. Gastric Cancer 2017, 20, 913–918. [Google Scholar] [CrossRef] [PubMed]


| Body Composition Measurement | Frequency n (%) |
|---|---|
| BMI | |
| Normal (18.5–24.9 kg/m2) | 204 (31.1) |
| Severely Underweight (<16 kg/m2) | 2 (0.3) |
| Underweight (17–18.4 kg/m2) | 14 (2.1) |
| Overweight (25–29.9 kg/m2) | 279 (42.5) |
| Obese I (30–34.9 kg/m2) | 120 (18.3) |
| Obese II (35–39.9 kg/m2) | 27 (4.1) |
| Adipositas per Magna (≥40 kg/m2) | 11 (1.7) |
| Sarcopenia | |
| SMI (Martin) [14] | 340 (51.8) |
| Males: SMI < 43 cm2/m2 if BMI < 25 kg/m2 or SMI < 53 cm2/m2 if BMI ≥ 25 kg/m2, females: SMI < 41 cm2/m2 | |
| SMI (Caan) [43] | 391 (59.5) |
| Males: SMI < 52.3 cm2/m2 if BMI < 30 kg/m2 or SMI < 54.3 cm2/m2 if BMI ≥ 30 kg/m2, females: SMI < 38.6 cm2/m2 if BMI < 30 kg/m2 or SMI < 46.6 cm2/m2 if BMI ≥ 30 kg/m2 | |
| SMI (Prado) [39] | 368 (56) |
| Males: SMI ≤ 52.4 cm2/m2, females: SMI ≤ 38.5 cm2/m2 | |
| SMI (Lancet Oncology Consensus) [40] | 434 (66.1) |
| Males: SMI < 55 cm2/m2, females: SMI < 39 cm2/m2 | |
| Psoas Muscle Index | |
| Low PMI (Kasahara) [17] | 224 (34.1) |
| Males: <2.49 cm2/m2, females: <2.07 cm2/m2 | |
| Myosteatosis | |
| SMHU (Derstine) [19] | 474 (72.1) |
| Males: <38.5 HU, Females: <34.3 HU | |
| SMHU (Martin, Lurje) [14,24] | 430 (65.4) |
| Patients with BMI < 25 kg/m2: <41 HU, Patients with BMI ≥ 25 kg/m2: <33 HU | |
| SMHU (Xiao) [18] | 414 (63) |
| Males: <35.5 HU, Females: <32.5 HU | |
| High SFI [11] | 300 (45.7) |
| Males: ≥50.0 cm2/m2. females: ≥42.0 cm2/m2 | |
| Visceral Obesity [41] | 436 (66.4) |
| Males: VFA > 160 cm2, females: >80 cm2 | |
| High VFI (Engelmann) | 342 (52.1) |
| Males: >74.34 cm2/m2, females: >28.38 cm2/m2 | |
| High VSR (Engelmann) | 308 (46.9) |
| Males: >1.421, females >0.4255 |
| Characteristic | Entire Cohort n = 657 (%) | Not Sarcopenic n = 317 (48.2%) | Sarcopenic n = 340 (52.8%) | p-Value |
|---|---|---|---|---|
| Age Median (IQR) | 70 (63–77) | 67 (60–74) | 73 (66–79) | <0.01 |
| Gender (male) | 490 (74.6) | 245 (77.3) | 245 (72.1) | 0.12 |
| Smoker (former or current) | 349 (53.1) | 180 (56.8) | 168 (49.4) | 0.06 |
| ACE-27 | ||||
| None | 111 (16.9) | 69 (21.8) | 42 (12.4) | 0.01 |
| Mild | 209 (31.8) | 92 (29) | 117 (34.4) | |
| Moderate | 205 (31.2) | 93 (29.3) | 112 (32.9) | |
| Severe | 132 (20.1) | 63 (19.9) | 69 (20.3) | |
| T-Stage | ||||
| pTa, pT1, pTis | 92 (14) | 50 (15.8) | 42 (12.4) | 0.04 |
| pT2 | 222 (33.8) | 120 (37.9) | 102 (30) | |
| pT3 | 229 (34.9) | 99 (31.2) | 130 (38.2) | |
| pT4 | 114 (17.4) | 48 (15.1) | 66 (19.4) | |
| Positive R-Stage | 93 (14.2) | 34 (10.8) | 59 (17.4) | 0.02 |
| N-Stage | ||||
| N0 | 439 (66.8) | 216 (68.1) | 223 (65.6) | 0.66 |
| N+ | 198 (30.1) | 93 (29.3) | 105 (30.9) | |
| Nx | 20 (3) | 8 (2.5) | 12 (3.5) | |
| Preoperative cM-Stage | ||||
| cM+ | 32 (4.9) | 14 (4.4) | 18 (5.3) | 0.60 |
| Perioperative Chemotherapy | ||||
| Neoadjuvant | 47 (7.2) | 17 (5.4) | 30 (8.9) | 0.08 |
| Adjuvant | 94 (14.3) | 51 (16.5) | 43 (13) | 0.21 |
| BMI Category | ||||
| Normal | 204 (31.1) | 100 (31.5) | 104 (30.6) | 0.06 |
| Underweight | 16 (2.4) | 3 (0.9) | 13 (3.8) | |
| Overweight | 437 (66.7) | 214 (67.5) | 223 (65.6) | |
| Sarcopenia | ||||
| (Caan) [43] | 391 (59.5) | 80 (25.2) | 311 (91.5) | <0.01 |
| (Prado) [39] | 368 (56) | 64 (20.2) | 304 (89.4) | <0.01 |
| (L.O. Consensus) [40] | 434 (66.1) | 107 (33.8) | 327 (96.2) | <0.01 |
| Myosteatosis | ||||
| (Derstine) [19] | 473 (72) | 206 (65) | 267 (79) | <0.01 |
| (Martin, Lurje) [14,24] | 429 (65.3) | 177 (55.8) | 252 (74.6) | <0.01 |
| (Xiao) [18] | 413 (62.9) | 171 (53.9) | 242 (71.6) | <0.01 |
| Low PMI | 224 (34.1) | 50 (15.8) | 174 (51.2) | <0.01 |
| High SFI | 300 (45.7) | 153 (48.3) | 147 (43.2) | 0.20 |
| Visceral Obesity | 436 (66.4) | 211 (66.6) | 225 (66.2) | 0.92 |
| High VFI | 342 (52.1) | 168 (53) | 174 (51.2) | 0.64 |
| High VSR | 308 (46.9) | 142 (44.8) | 166 (48.8) | 0.30 |
| OS | CSS | |||||
|---|---|---|---|---|---|---|
| Characteristic | HR | 95% CI | p | HR | 95% CI | p |
| Age (Years, continuous) | 1.05 | 1.03–1.06 | <0.01 | 1.02 | 1.01–1.04 | <0.01 |
| Gender (ref. Male) | 1.24 | 0.96–1.60 | 0.10 | 1.47 | 1.08–2.01 | 0.02 |
| Smoker (ref. no) | 0.79 | 0.63–0.98 | 0.04 | 0.75 | 0.57–1.00 | 0.05 |
| ACE-27 (Ref. ACE-27 0) | ||||||
| Mild | 1.22 | 0.84–1.77 | 0.29 | 1.03 | 0.67–1.57 | 0.90 |
| Moderate | 1.61 | 1.13–2.30 | <0.01 | 1.07 | 0.70–1.63 | 0.75 |
| Severe | 2.17 | 1.50–3.15 | <0.01 | 1.40 | 0.89–2.18 | 0.14 |
| T-Stage (Ref. pTa, pT1, pTis) | ||||||
| pT2 | 0.92 | 0.60–1.43 | 0.72 | 1.34 | 0.63–2.84 | 0.45 |
| pT3 | 3.01 | 2.02–4.48 | <0.01 | 6.40 | 3.22–12.71 | <0.01 |
| pT4 | 4.20 | 2.75–6.42 | <0.01 | 11.03 | 5.48–22.23 | <0.01 |
| Positive R-Stage (Ref. R0) | 2.68 | 2.02–3.56 | <0.01 | 3.52 | 2.53–4.90 | <0.01 |
| N-Stage (Ref. N0) | ||||||
| N+ | 2.72 | 2.15–3.44 | <0.01 | 4.58 | 3.40–6.19 | <0.01 |
| Nx | 3.26 | 1.88–5.64 | <0.01 | 5.25 | 2.78–9.91 | <0.01 |
| Positive cM-stage (Ref. cM0) | 4.14 | 2.70–6.34 | <0.01 | 6.86 | 4.42–10.64 | <0.01 |
| Perioperative Chemotherapy (Ref.: No) | 1.21 | 0.92–1.58 | 0.17 | 1.66 | 1.22–2.27 | <0.01 |
| BMI Category (Ref. Normal) | ||||||
| Severely Underweight | 7.17 | 1.75–29.35 | 0.01 | 5.36 | 0.74–39.01 | 0.10 |
| Underweight | 1.72 | 0.87–3.41 | 0.12 | 1.83 | 0.84–3.97 | 0.13 |
| Overweight | 0.80 | 0.62–1.04 | 0.10 | 0.71 | 0.51–0.98 | 0.04 |
| Obese I | 0.77 | 0.55–1.07 | 0.12 | 0.63 | 0.41–0.96 | 0.03 |
| Obese II | 1.04 | 0.59–1.81 | 0.90 | 0.31 | 0.10–0.97 | 0.04 |
| Adipositas per Magna | 0.62 | 0.23–1.69 | 0.35 | 0.45 | 0.11–1.82 | 0.26 |
| Sarcopenia (Ref. absence) | ||||||
| Sarcopenia (Martin) [14] | 1.59 | 1.27–2.00 | <0.01 | 1.87 | 1.40–2.51 | <0.01 |
| Sarcopenia (Caan) [43] | 1.36 | 1.08–1.72 | <0.01 | 1.53 | 1.14–2.07 | <0.01 |
| Sarcopenia (Prado) [39] | 1.40 | 1.12–1.76 | <0.01 | 1.57 | 1.17–2.10 | <0.01 |
| Sarcopenia (L.O. Consensus) [40] | 1.43 | 1.12–1.83 | <0.01 | 1.64 | 1.19–2.26 | <0.01 |
| Myosteatosis (Ref. absence) | ||||||
| (Derstine) [19] | 1.54 | 1.18–2.01 | <0.01 | 1.14 | 0.83–1.57 | 0.41 |
| (Martin, Lurje) [14,24] | 1.63 | 1.27–2.10 | <0.01 | 1.26 | 0.93–1.71 | 0.14 |
| (Xiao) [18] | 1.54 | 1.21–1.96 | <0.01 | 1.10 | 0.82–1.48 | 0.51 |
| Myosteatosis (HU, continuous) | 0.97 | 0.96–0.98 | <0.01 | 0.98 | 0.97–1.00 | 0.04 |
| Low PMI (Ref. High PMI) | 1.67 | 1.33–2.10 | <0.01 | 1.85 | 1.39–2.46 | <0.01 |
| High SFI (Ref. Low SFI) | 0.97 | 0.77–1.209 | 0.76 | 0.82 | 0.62–1.10 | 0.19 |
| Visceral Obesity (Ref. No) | 0.83 | 0.66–1.05 | 0.12 | 0.70 | 0.52–0.93 | 0.01 |
| High VFI (Ref. low VFI) | 0.96 | 0.77–1.20 | 0.72 | 0.77 | 0.58–1.02 | 0.07 |
| High VSR (Ref. low VSR) | 1.16 | 0.93–1.45 | 0.20 | 0.97 | 0.73–1.29 | 0.84 |
| MV Model with Sarcopenia (Martin) | MV Model with Low PMI | MV Model with Myosteatosis (Xiao) | MV Model with Myosteatosis (Cont.) | |||||||||
|---|---|---|---|---|---|---|---|---|---|---|---|---|
| Characteristic | HR | 95% CI | p | HR | 95% CI | p | HR | 95% CI | p | HR | 95% CI | p |
| Age (Years, continuous) | 1.03 | 1.02–1.05 | <0.01 | 1.03 | 1.02–1.05 | <0.01 | 1.03 | 1.02–1.05 | <0.01 | 1.03 | 1.01–1.04 | <0.01 |
| ACE-27 (Ref. ACE-27 0) | ||||||||||||
| Mild | 0.86 | 0.59–1.25 | 0.43 | 0.87 | 0.59–1.27 | 0.47 | 0.84 | 0.57–1.23 | 0.37 | 0.85 | 0.58–1.24 | 0.40 |
| Moderate | 1.24 | 0.86–1.80 | 0.25 | 1.26 | 0.87–1.83 | 0.23 | 1.18 | 0.81–1.73 | 0.38 | 1.19 | 0.82–1.73 | 0.37 |
| Severe | 1.57 | 1.06–2.32 | 0.02 | 1.54 | 1.05–2.29 | 0.03 | 1.49 | 1.00–2.22 | <0.05 | 1.50 | 1.01–2.23 | <0.05 |
| T-Stage (Ref. pTa, pT1, pTis) | ||||||||||||
| pT2 | 0.80 | 0.52–1.25 | 0.33 | 0.79 | 0.51–1.22 | 0.29 | 0.78 | 0.50–1.22 | 0.28 | 0.78 | 0.50–1.21 | 0.26 |
| pT3 | 2.06 | 1.35–3.13 | <0.01 | 2.10 | 1.38–3.19 | <0.01 | 2.02 | 1.32–3.07 | 0.00 | 1.99 | 1.31–3.04 | <0.01 |
| pT4 | 2.23 | 1.39–3.58 | <0.01 | 2.23 | 1.39–3.59 | <0.01 | 2.20 | 1.37–3.53 | 0.00 | 2.19 | 1.36–3.53 | <0.01 |
| Positive R-Stage (Ref. R0) | 1.40 | 1.01–1.94 | <0.05 | 1.41 | 1.02–1.96 | 0.04 | 1.39 | 1.00–1.93 | 0.05 | 1.38 | 0.99–1.92 | 0.06 |
| N-Stage (Ref. N0) | ||||||||||||
| N+ | 1.77 | 1.34–2.33 | <0.01 | 1.72 | 1.30–2.27 | <0.01 | 1.82 | 1.37–2.40 | <0.01 | 1.77 | 1.34–2.33 | <0.01 |
| Nx | 1.43 | 0.80–2.55 | 0.23 | 1.44 | 0.81–2.58 | 0.22 | 1.39 | 0.78–2.49 | 0.27 | 1.39 | 0.78–2.47 | 0.27 |
| Positive cM-stage (Ref. cM0) | 2.58 | 1.62–4.10 | <0.01 | 2.52 | 1.58–4.01 | <0.01 | 2.47 | 1.55–3.93 | <0.01 | 2.56 | 1.61–4.07 | <0.01 |
| BMI Category (Ref. Normal) | ||||||||||||
| Severely Underweight | 6.67 | 1.56–28.46 | 0.01 | 6.54 | 1.53–27.92 | 0.01 | 8.63 | 2.03–36.91 | <0.01 | 8.98 | 2.09–38.50 | <0.01 |
| Underweight | 1.56 | 0.78–3.15 | 0.21 | 1.42 | 0.70–2.89 | 0.33 | 1.74 | 0.85–3.53 | 0.13 | 1.64 | 0.81–3.31 | 0.18 |
| Overweight | 0.72 | 0.55–0.95 | 0.02 | 0.79 | 0.60–1.04 | 0.09 | 0.72 | 0.55–0.94 | 0.02 | 0.71 | 0.55–0.93 | 0.01 |
| Obese I | 0.88 | 0.63–1.25 | 0.48 | 0.93 | 0.65–1.32 | 0.68 | 0.78 | 0.55–1.10 | 0.16 | 0.76 | 0.53–1.08 | 0.12 |
| Obese II | 1.57 | 0.89–2.78 | 0.12 | 1.67 | 0.93–2.97 | 0.08 | 1.37 | 0.77–2.44 | 0.28 | 1.24 | 0.69–2.23 | 0.48 |
| Adipositas per Magna | 0.55 | 0.20–1.53 | 0.25 | 0.58 | 0.21–1.63 | 0.30 | 0.45 | 0.16–1.26 | 0.13 | 0.39 | 0.14–1.11 | 0.08 |
| Sarcopenia (Martin) [14] (Ref. absence) | 1.30 | 1.02–1.66 | 0.04 | - | - | - | - | - | - | - | - | - |
| Low PMI (Ref. High PMI) | - | - | - | 1.32 | 1.02–1.70 | 0.03 | - | - | - | - | - | - |
| Myosteatosis (Xiao) [18] (Ref. absence) | - | - | - | - | - | - | 1.32 | 1.00–1.75 | <0.05 | - | - | - |
| Myosteatosis (HU, continuous) | - | - | - | - | - | - | - | - | - | 0.98 | 0.97–1.00 | 0.01 |
| Characteristic | MV Model with Sarcopenia (Martin) | MV Model with Low PMI | MV Model with Myosteatosis (Cont.) | ||||||
|---|---|---|---|---|---|---|---|---|---|
| HR | 95% CI | p | HR | 95% CI | p | HR | 95% CI | p | |
| Age (Years, continuous) | 1.01 | 0.99–1.03 | 0.30 | 1.01 | 0.99–1.03 | 0.21 | 1.01 | 0.99–1.03 | 0.43 |
| T-Stage (Ref. pTa, pT1, pTis) | |||||||||
| pT2 | 1.23 | 0.58–2.63 | 0.59 | 1.20 | 0.56–2.55 | 0.64 | 1.16 | 0.54–2.47 | 0.71 |
| pT3 | 4.27 | 2.09–8.73 | <0.01 | 4.39 | 2.14–8.99 | <0.01 | 4.11 | 2.01–8.44 | <0.01 |
| pT4 | 5.21 | 2.42–11.18 | <0.01 | 5.17 | 2.41–11.10 | <0.01 | 5.03 | 2.34–10.81 | <0.01 |
| Positive R-Stage (Ref. R0) | 1.61 | 1.09–2.39 | 0.02 | 1.60 | 1.08–2.38 | 0.02 | 1.57 | 1.06–2.33 | 0.03 |
| N-Stage (Ref. N0) | |||||||||
| N+ | 2.43 | 1.68–3.51 | <0.01 | 2.34 | 1.62–3.40 | <0.01 | 2.40 | 1.66–3.48 | <0.01 |
| Nx | 2.15 | 1.10–4.20 | 0.03 | 2.29 | 1.17–4.50 | 0.02 | 2.14 | 1.09–4.18 | 0.03 |
| Positive cM-stage (Ref. cM0) | 2.63 | 1.59–4.35 | <0.01 | 2.56 | 1.54–4.24 | <0.01 | 2.62 | 1.58–4.34 | <0.01 |
| Perioperative Chemotherapy (Ref. no) | 0.77 | 0.53–1.11 | 0.16 | 0.77 | 0.53–1.10 | 0.15 | 0.80 | 0.55–1.15 | 0.23 |
| BMI Category (Ref. Normal) | |||||||||
| Severely Underweight | 2.20 | 0.29–17.04 | 0.45 | 2.36 | 0.30–18.23 | 0.41 | 3.28 | 0.42–25.39 | 0.25 |
| Underweight | 1.56 | 0.65–3.77 | 0.32 | 1.25 | 0.51–3.05 | 0.63 | 1.47 | 0.60–3.58 | 0.40 |
| Overweight | 0.62 | 0.44–0.87 | 0.01 | 0.70 | 0.49–0.98 | 0.04 | 0.62 | 0.44–0.87 | 0.01 |
| Obese I | 0.86 | 0.55–1.34 | 0.51 | 0.88 | 0.56–1.39 | 0.58 | 0.69 | 0.44–1.08 | 0.11 |
| Obese II | 0.58 | 0.18–1.85 | 0.35 | 0.63 | 0.20–2.05 | 0.45 | 0.45 | 0.14–1.46 | 0.18 |
| Adipositas per Magna | 0.60 | 0.15–2.49 | 0.49 | 0.61 | 0.15–2.55 | 0.50 | 0.38 | 0.09–1.62 | 0.19 |
| Sarcopenia (Martin) [14] (Ref. absence) | 1.64 | 1.19–2.25 | <0.01 | - | - | - | - | - | - |
| Low PMI (Ref. High PMI) | - | - | - | 1.41 | 1.02–1.96 | 0.04 | - | - | - |
| Myosteatosis (HU, continuous) | - | - | - | - | - | - | 0.98 | 0.96–1.00 | <0.05 |
Disclaimer/Publisher’s Note: The statements, opinions and data contained in all publications are solely those of the individual author(s) and contributor(s) and not of MDPI and/or the editor(s). MDPI and/or the editor(s) disclaim responsibility for any injury to people or property resulting from any ideas, methods, instructions or products referred to in the content. |
© 2023 by the authors. Licensee MDPI, Basel, Switzerland. This article is an open access article distributed under the terms and conditions of the Creative Commons Attribution (CC BY) license (https://creativecommons.org/licenses/by/4.0/).
Share and Cite
Engelmann, S.U.; Pickl, C.; Haas, M.; Kaelble, S.; Hartmann, V.; Firsching, M.; Lehmann, L.; Gužvić, M.; van Rhijn, B.W.G.; Breyer, J.; et al. Body Composition of Patients Undergoing Radical Cystectomy for Bladder Cancer: Sarcopenia, Low Psoas Muscle Index, and Myosteatosis Are Independent Risk Factors for Mortality. Cancers 2023, 15, 1778. https://doi.org/10.3390/cancers15061778
Engelmann SU, Pickl C, Haas M, Kaelble S, Hartmann V, Firsching M, Lehmann L, Gužvić M, van Rhijn BWG, Breyer J, et al. Body Composition of Patients Undergoing Radical Cystectomy for Bladder Cancer: Sarcopenia, Low Psoas Muscle Index, and Myosteatosis Are Independent Risk Factors for Mortality. Cancers. 2023; 15(6):1778. https://doi.org/10.3390/cancers15061778
Chicago/Turabian StyleEngelmann, Simon U., Christoph Pickl, Maximilian Haas, Sebastian Kaelble, Valerie Hartmann, Maximilian Firsching, Laura Lehmann, Miodrag Gužvić, Bas W. G. van Rhijn, Johannes Breyer, and et al. 2023. "Body Composition of Patients Undergoing Radical Cystectomy for Bladder Cancer: Sarcopenia, Low Psoas Muscle Index, and Myosteatosis Are Independent Risk Factors for Mortality" Cancers 15, no. 6: 1778. https://doi.org/10.3390/cancers15061778
APA StyleEngelmann, S. U., Pickl, C., Haas, M., Kaelble, S., Hartmann, V., Firsching, M., Lehmann, L., Gužvić, M., van Rhijn, B. W. G., Breyer, J., Burger, M., & Mayr, R. (2023). Body Composition of Patients Undergoing Radical Cystectomy for Bladder Cancer: Sarcopenia, Low Psoas Muscle Index, and Myosteatosis Are Independent Risk Factors for Mortality. Cancers, 15(6), 1778. https://doi.org/10.3390/cancers15061778