
Hyperinsulinemic and Pro-Inflammatory Dietary Patterns and Metabolomic Profiles Are Associated with Increased Risk of Total and Site-Specific Cancers among Postmenopausal Women

 , , , ,
Abstract
Simple Summary
Abstract
1. Introduction
2. Methods
2.1. Study Population
2.2. Dietary Assessment and Calculation of Dietary Indices
2.3. Ascertainment of Incident Cancer
2.4. Metabolomics Profiling and Derivation of Metabolomics Profile Scores for the Dietary Patterns
2.5. Statistical Analysis
3. Results
3.1. Participant Characteristics (Table 1)

| Empirical Dietary Index for Hyperinsulinemic (EDIH) Score a,b | Empirical Dietary Inflammatory Pattern (EDIP) Score a,b | Health Eating Index 2015 (HEI-2015) a,b | |||||||||||||
|---|---|---|---|---|---|---|---|---|---|---|---|---|---|---|---|
| Characteristic | Quintile 1 | Quintile 2 | Quintile 3 | Quintile 4 | Quintile 5 | Quintile 1 | Quintile 2 | Quintile 3 | Quintile 4 | Quintile 5 | Quintile 1 | Quintile 2 | Quintile 3 | Quintile 4 | Quintile 5 |
| n | 22,493 | 22,494 | 22,494 | 22,494 | 22,493 | 22,493 | 22,494 | 22,494 | 22,494 | 22,493 | 22,493 | 22,493 | 22,494 | 22,493 | 22,493 |
| Race/ethnicity | |||||||||||||||
| American Indian or Alaskan Native | 0.3 | 0.3 | 0.5 | 0.5 | 0.5 | 0.4 | 0.3 | 0.4 | 0.5 | 0.6 | 0.6 | 0.4 | 0.4 | 0.3 | 0.3 |
| Asian or Pacific Islander | 2.2 | 2.8 | 3.2 | 3.1 | 2.7 | 1.3 | 1.9 | 2.3 | 3.5 | 5.1 | 2.7 | 3.1 | 2.9 | 2.9 | 2.5 |
| Black | 4.0 | 5.1 | 7.1 | 9.5 | 13 | 3.2 | 4.2 | 6.2 | 9.5 | 16 | 11 | 8.9 | 7.4 | 6.0 | 5.5 |
| Hispanic/Latino | 2.5 | 2.9 | 3.4 | 4.1 | 5.0 | 1.5 | 1.8 | 2.6 | 3.9 | 8.3 | 5.4 | 4.5 | 3.5 | 2.6 | 1.8 |
| Other | 1.4 | 1.5 | 1.3 | 1.4 | 1.5 | 1.2 | 1.2 | 1.4 | 1.6 | 1.8 | 1.6 | 1.5 | 1.4 | 1.3 | 1.3 |
| White | 89 | 87 | 84 | 81 | 77 | 92 | 91 | 87 | 81 | 68 | 78 | 81 | 84 | 87 | 88 |
| Age, years | 63 ± 7 | 64 ± 7 | 64 ± 7 | 63 ± 7 | 62 ± 7 | 63 ± 7 | 63 ± 7 | 64 ± 7 | 64 ± 7 | 62 ± 7 | 62 ± 7 | 63 ± 7 | 63 ± 7 | 64 ± 7 | 64 ± 7 |
| BMI, kg/m2 | 26 ± 5 | 26 ± 5 | 27 ± 5 | 28 ± 6 | 30 ± 6 | 27 ± 5 | 27 ± 5 | 27 ± 5 | 28 ± 6 | 29 ± 6 | 29 ± 6 | 28 ± 6 | 27 ± 6 | 27 ± 5 | 26 ± 5 |
| Under/Normal weight (15 ≤ BMI < 25) | 49 | 44 | 39 | 34 | 24 | 44 | 42 | 39 | 36 | 29 | 29 | 33 | 37 | 42 | 49 |
| Overweight (25 ≤ BMI < 30) | 33 | 35 | 35 | 35 | 32 | 35 | 35 | 35 | 34 | 32 | 33 | 34 | 35 | 35 | 33 |
| Obese (BMI ≥ 30) | 18 | 21 | 25 | 31 | 43 | 21 | 23 | 26 | 29 | 39 | 38 | 32 | 27 | 23 | 18 |
| Physical activity, MET-hours/week | 17 ± 16 | 15± 14 | 13 ± 13 | 11 ± 12 | 9 ± 11 | 16 ± 15 | 14 ± 14 | 13 ± 13 | 12 ± 13 | 10 ± 12 | 8 ± 11 | 11 ± 12 | 13 ± 14 | 15 ± 14 | 17 ± 15 |
| Pack years of smoking | 11 ± 18 | 9 ± 17 | 9 ± 17 | 9 ± 18 | 11 ± 19 | 13 ± 20 | 10 ±18 | 9 ± 17 | 8 ± 17 | 8 ± 17 | 12 ± 21 | 10 ± 19 | 9 ± 18 | 9 ± 16 | 8 ±16 |
| Current smoking | 6 | 5 | 6 | 7 | 9 | 8 | 6 | 6 | 6 | 7 | 13 | 8 | 6 | 4 | 3 |
| Aspirin/NSAIDs use | 14 | 14 | 13 | 13 | 13 | 14 | 14 | 14 | 13 | 12 | 13 | 13 | 14 | 13 | 14 |
| Statin use | 2 | 2 | 2 | 2 | 2 | 2 | 2 | 2 | 2 | 2 | 2 | 2 | 2 | 3 | 2 |
| Hypercholestrolemia | 12 | 14 | 15 | 15 | 15 | 12 | 13 | 15 | 15 | 16 | 12 | 14 | 14 | 15 | 16 |
| Educational level | |||||||||||||||
| <high school | 3 | 4 | 5 | 6 | 8 | 3 | 3 | 4 | 6 | 10 | 9 | 6 | 5 | 4 | 2 |
| High school/GED | 45 | 51 | 55 | 59 | 62 | 50 | 52 | 54 | 57 | 58 | 62 | 58 | 54 | 51 | 46 |
| ≥4 years of college | 51 | 45 | 39 | 35 | 29 | 46 | 43 | 41 | 36 | 31 | 28 | 35 | 41 | 44 | 51 |
| Total alcohol intake, alcohol servings/week c | 4.8 ± 7.5 | 2.4 ± 4.2 | 1.9 ± 3.7 | 1.6 ± 3.6 | 1.5 ± 3.6 | 5.3 ± 7.8 | 2.8 ± 4.4 | 1.9 ± 3.6 | 1.3 ± 3.0 | 0.8 ± 2.6 | 1.7 ± 4.0 | 2.2 ± 4.6 | 2.6 ± 5.0 | 2.8 ± 5.2 | 3.0 ± 5.5 |
| Macronutrients, %kcal/d | |||||||||||||||
| Carbohydrates | 54 ± 10 | 54 ± 9 | 52 ± 8 | 49 ± 8 | 45 ± 9 | 50 ± 10 | 51 ± 9 | 51 ± 9 | 51 ± 9 | 50 ± 9 | 46 ± 9 | 48 ± 9 | 51 ± 9 | 53 ± 9 | 56 ± 8 |
| Total fat | 28 ± 8 | 29 ± 8 | 31 ± 8 | 34 ± 7 | 38 ± 7 | 30 ± 9 | 31 ± 8 | 32 ± 8 | 33 ± 8 | 34 ± 8 | 38 ± 7 | 35 ± 7 | 32 ± 7 | 29 ± 7 | 26 ± 7 |
| Saturated fat | 9 ± 3 | 10 ± 3 | 10 ± 3 | 11 ± 3 | 13 ± 3 | 10 ± 3 | 11 ± 3 | 10 ± 3 | 11 ± 3 | 11 ± 3 | 14 ± 3 | 12 ± 3 | 11 ± 3 | 9 ± 2 | 8 ± 2 |
| Unsaturated fat | 16 ± 5 | 17 ± 5 | 18 ± 5 | 20 ± 5 | 22 ± 5 | 18 ± 5 | 18 ± 5 | 19 ± 5 | 19 ± 5 | 20 ± 5 | 22 ± 5 | 20 ± 5 | 19 ± 5 | 17 ± 5 | 16 ± 5 |
| Total protein | 16 ± 3 | 17 ± 3 | 17 ± 3 | 17 ± 3 | 17 ± 4 | 17 ± 3 | 17 ± 3 | 17 ± 3 | 17 ± 3 | 17 ± 4 | 16 ± 3 | 17 ± 3 | 17 ± 3 | 17 ± 3 | 18 ± 3 |
| Animal/plant protein ratio | 2 ± 1 | 2 ± 1 | 2 ± 1 | 3 ± 1 | 3 ± 2 | 2 ± 1 | 2 ± 1 | 2 ± 1 | 3 ± 1 | 3 ± 1 | 3 ± 2 | 3 ± 1 | 3 ± 1 | 2 ± 1 | 2 ± 1 |
| Micronutrients, per 1000 kcal | |||||||||||||||
| Calcium, mg/d | 577 ± 217 | 560 ± 211 | 528 ± 203 | 484 ± 184 | 410 ± 156 | 533 ± 205 | 531 ± 198 | 525 ± 201 | 511 ± 207 | 459 ± 201 | 419 ± 167 | 470 ± 183 | 508 ± 196 | 549 ± 204 | 614 ± 213 |
| Potassium, mg/d | 1860 ± 427 | 1816 ± 412 | 1728 ± 388 | 1599 ± 353 | 1384 ± 319 | 1882 ± 416 | 1781 ± 383 | 1709 ± 376 | 1616 ± 377 | 1397 ± 371 | 1296 ± 295 | 1523 ± 309 | 1688 ± 335 | 1848 ± 360 | 2030 ± 360 |
| Vitamin D, mcg/d | 3 ± 2 | 3 ± 2 | 3 ± 2 | 3 ± 2 | 2 ± 1 | 3 ± 2 | 3 ± 2 | 3 ± 2 | 3 ± 2 | 3 ± 2 | 2 ± 1 | 2 ± 1 | 3 ± 2 | 3 ± 2 | 3 ± 2 |
| Magnesium, mg/d | 180 ± 35 | 175 ± 35 | 167 ± 33 | 154 ± 30 | 134 ± 28 | 177 ± 34 | 170 ± 33 | 164 ± 34 | 158 ± 34 | 141 ± 35 | 126 ± 24 | 147 ± 25 | 162 ± 26 | 177 ± 28 | 197 ± 30 |
| Iron, mg/d | 8 ± 2 | 8 ± 3 | 8 ± 3 | 8 ± 2 | 7 ± 2 | 8 ± 2 | 8 ± 2 | 8 ± 3 | 8 ± 3 | 8 ± 3 | 7 ± 2 | 8 ± 2 | 8 ± 3 | 8 ± 3 | 9 ± 3 |
| Folate, mcg/d | 184 ± 64 | 183 ± 65 | 175 ± 64 | 161 ± 59 | 136 ± 50 | 184 ± 62 | 177 ± 61 | 171 ± 62 | 164 ± 63 | 142 ± 61 | 129 ± 52 | 152 ± 55 | 169 ± 59 | 185 ± 62 | 202 ± 62 |
| Vitamin A, mcg RAE/d | 483 ± 194 | 493 ± 199 | 486 ± 198 | 467 ± 197 | 423 ± 196 | 490 ± 205 | 485 ± 189 | 480 ± 188 | 470 ± 192 | 426 ± 210 | 385 ± 182 | 438 ± 188 | 469 ± 196 | 506 ± 192 | 553 ± 193 |
| Vitamin C, mg/d | 74 ± 40 | 76 ± 41 | 72 ± 39 | 63 ± 35 | 49 ± 28 | 70 ± 38 | 71 ± 38 | 70 ± 39 | 67 ± 38 | 54 ± 34 | 41 ± 26 | 57 ± 31 | 69 ± 36 | 79 ± 38 | 88 ± 38 |
| Vitamin E, IU/d | 6 ± 3 | 6 ± 4 | 6 ± 4 | 6 ± 3 | 5 ± 3 | 6 ± 3 | 6 ± 3 | 6 ± 4 | 6 ± 4 | 5 ± 3 | 5 ± 3 | 6 ± 3 | 6 ± 4 | 6 ± 4 | 7 ± 4 |
3.2. Food and Nutrient Profiles of the Dietary Patterns (Supplementary Tables S1 and S4)
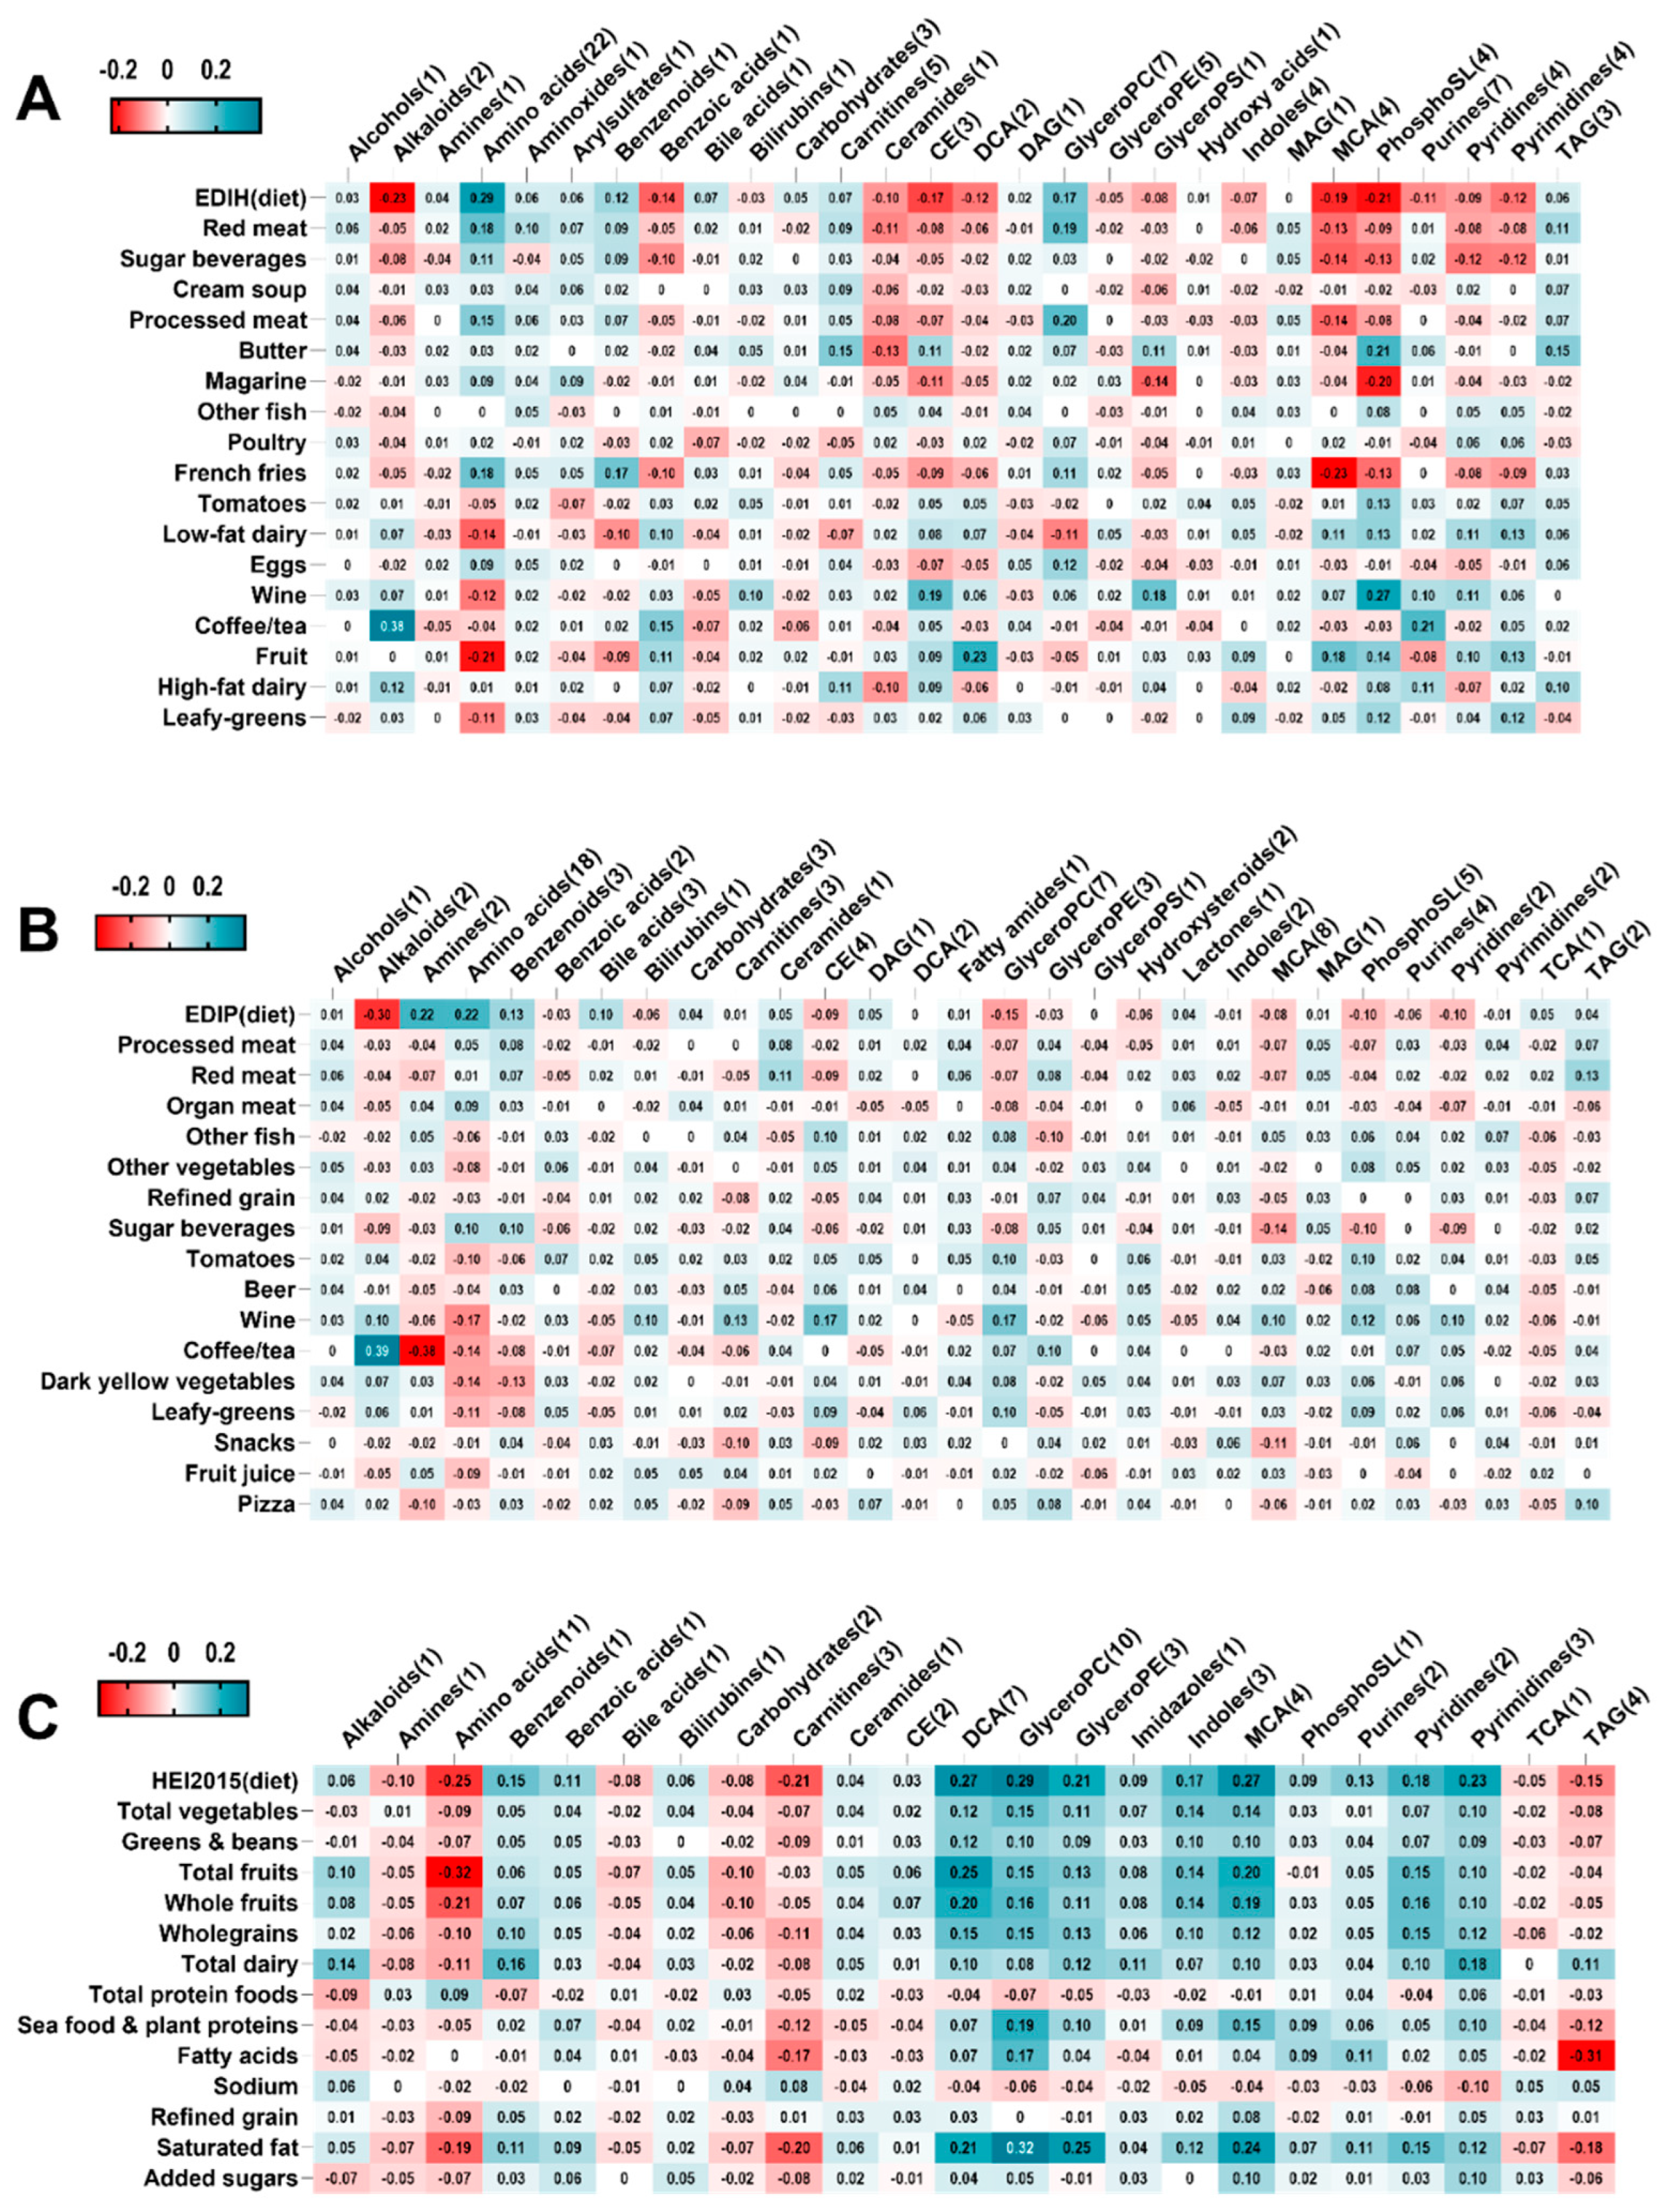
3.3. Metabolomics Profile Scores of the Dietary Patterns (Figure 1)

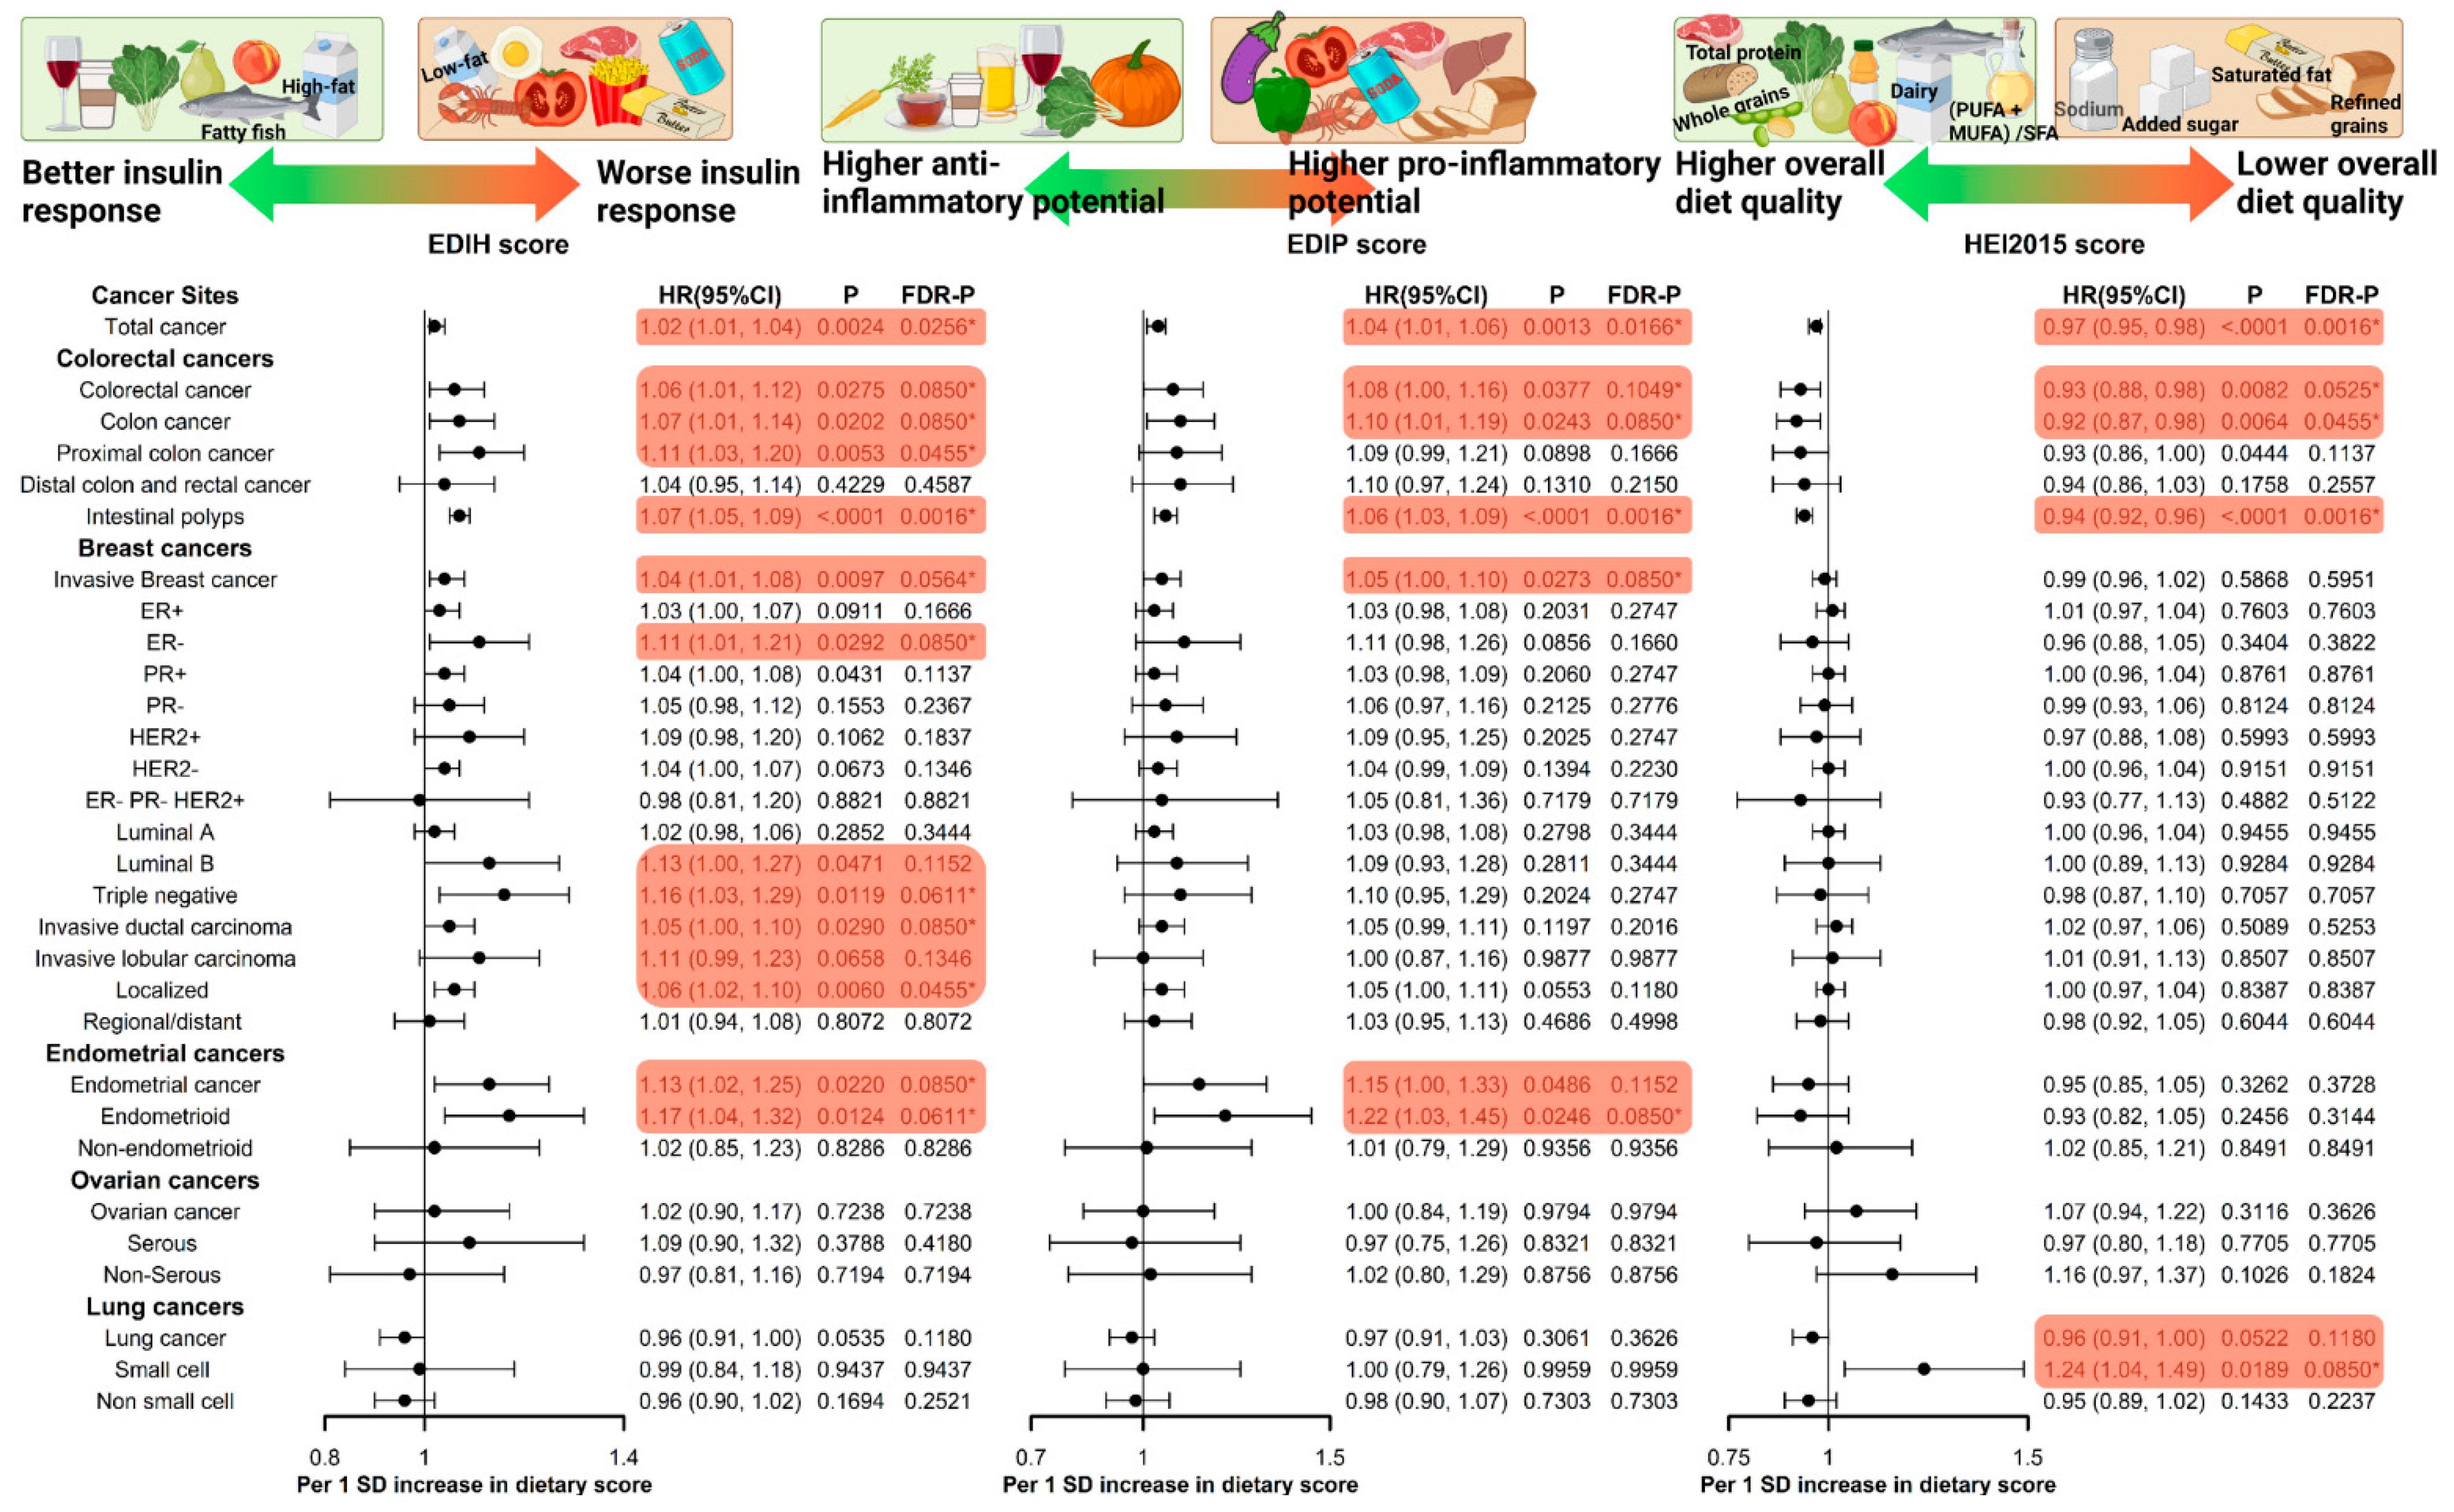
3.4. EDIH and Cancer Risk (Table 2, Figure 2)
| Dietary Pattern | Cancer Risk Type | Quintile 1 | Quintile 2 | Quintile 3 | Quintile 4 | Quintile 5 | Q5-Q1 (Absolute Risk Difference); c P-Trend. d | FDR-Adjusted p-Value |
|---|---|---|---|---|---|---|---|---|
| Total cancer (except non-melanoma skin cancer) | ||||||||
| EDIH e | Absolute risk/cases | 969/3934 | 962/3861 | 993/3772 | 1015/3594 | 1021/3607 | 52 | |
| EDIH | Relative risk | 1 (reference) | 1.04 (1.00, 1.09) | 1.06 (1.01, 1.11) | 1.04 (1.00, 1.10) | 1.10 (1.04, 1.15) | 0.0008 | 0.0122 |
| EDIP e | Absolute risk/cases | 979/4131 | 970/4027 | 992/3703 | 1000/3608 | 1020/3299 | 41 | |
| EDIP | Relative risk | 1 (reference) | 1.06 (1.01, 1.11) | 1.02 (0.97, 1.08) | 1.07 (1.01, 1.13) | 1.08 (1.02, 1.15) | 0.0163 | 0.0808 |
| HEI-2015 | Absolute risk/cases | 1030/3697 | 1005/3740 | 967/3786 | 977/3750 | 981/3795 | −49 | |
| HEI-2015 e | Relative risk | 1 (reference) | 0.98 (0.93, 1.02) | 0.97 (0.92, 1.01) | 0.94 (0.89, 0.98) | 0.93 (0.89, 0.98) | 0.0008 | 0.0122 |
| Colorectal cancer | ||||||||
| EDIH | Absolute risk/cases | 80/3795 | 80/309 | 89/372 | 85/306 | 91/320 | 11 | |
| EDIH | Relative risk | 1 (reference) | 1.06 (0.90, 1.25) | 1.31 (1.11, 1.54) | 1.08 (0.91, 1.28) | 1.19 (1.00, 1.43) | 0.0658 | 0.2084 |
| EDIP | Absolute risk/cases | 84/315 | 82/333 | 82/338 | 86/319 | 91/303 | 7 | |
| EDIP | Relative risk | 1 (reference) | 1.14 (0.96, 1.35) | 1.19 (0.99, 1.43) | 1.19 (0.98, 1.45) | 1.23 (0.99, 1.52) | 0.0595 | 0.1966 |
| HEI-2015 | Absolute riskc/cases | 96/342 | 86/337 | 86/316 | 76/297 | 82/316 | −14 | |
| HEI-2015 | Relative risk | 1 (reference) | 0.96 (0.82, 1.12) | 0.90 (0.77, 1.06) | 0.83 (0.70, 0.97) | 0.86 (0.72, 1.01) | 0.0158 | 0.0808 |
| Colon cancer | ||||||||
| EDIH | Absolute risk/cases | 67/250 | 66/264 | 74/312 | 72/254 | 76/266 | 9 | |
| EDIH | Relative risk | 1 (reference) | 1.09 (0.91, 1.31) | 1.33 (1.11, 1.60) | 1.09 (0.90, 1.32) | 1.22 (1.00, 1.48) | 0.0755 | 0.2295 |
| EDIP | Absolute risk/cases | 69/260 | 68/286 | 72/279 | 69/266 | 78/255 | 9 | |
| EDIP | Relative risk | 1 (reference) | 1.18 (0.98, 1.43) | 1.20 (0.98, 1.46) | 1.22 (0.98, 1.51) | 1.28 (1.02, 1.62) | 0.0483 | 0.1835 |
| HEI-2015 | Absolute risk/cases | 80/285 | 71/284 | 73/264 | 64/249 | 67/264 | −13 | |
| HEI-2015 | Relative risk | 1 (reference) | 0.97 (0.82, 1.14) | 0.90 (0.76, 1.07) | 0.81 (0.68, 0.97) | 0.83 (0.69, 1.00) | 0.0102 | 0.0808 |
| Proximal colon cancer | ||||||||
| EDIH | Absolute risk/cases | 39/141 | 38/160 | 46/204 | 50/155 | 45/168 | 6 | |
| EDIH | Relative risk | 1 (reference) | 1.16 (0.92, 1.47) | 1.55 (1.23, 1.95) | 1.19 (0.93, 1.52) | 1.41 (1.10, 1.81) | 0.0134 | 0.0808 |
| EDIP | Absolute risk/cases | 42/147 | 41/185 | 47/178 | 44/160 | 44/158 | 2 | |
| EDIP | Relative risk | 1 (reference) | 1.36 (1.07, 1.73) | 1.34 (1.03, 1.73) | 1.29 (0.98, 1.71) | 1.42 (1.05, 1.92) | 0.0587 | 0.1966 |
| HEI-2015 | Absolute risk/cases | 47/173 | 46/176 | 44/169 | 41/151 | 40/159 | −7 | |
| HEI-2015 | Relative risk | 1 (reference) | 0.96 (0.78, 1.19) | 0.92 (0.74, 1.14) | 0.78 (0.62, 0.98) | 0.80 (0.64, 1.01) | 0.0156 | 0.0808 |
| Distal colon and rectal cancer | ||||||||
| EDIH | Absolute risk/cases | 33/127 | 34/116 | 30/132 | 31/119 | 36/133 | 3 | |
| EDIH | Relative risk | 1 (reference) | 0.91 (0.70, 1.19) | 0.97 (0.74, 1.27) | 0.95 (0.72, 1.25) | 1.09 (0.82, 1.44) | 0.4874 | 0.6174 |
| EDIP | Absolute risk/cases | 33/141 | 34/109 | 27/119 | 32/131 | 39/127 | 6 | |
| EDIP | Relative risk | 1 (reference) | 0.80 (0.60, 1.05) | 0.87 (0.65, 1.16) | 1.02 (0.75, 1.39) | 1.03 (0.74, 1.44) | 0.5117 | 0.6375 |
| HEI-2015 | Absolute risk/cases | 39/136 | 30/138 | 33/114 | 31/117 | 31/122 | −8 | |
| HEI-2015 | Relative risk | 1 (reference) | 1.02 (0.80, 1.31) | 0.88 (0.68, 1.14) | 0.86 (0.66, 1.12) | 0.92 (0.70, 1.20) | 0.2774 | 0.4679 |
| Intestinal polyps | ||||||||
| EDIH | Absolute risk/cases | 551/1991 | 571/2030 | 594/2134 | 635/2211 | 649/2308 | 98 | |
| EDIH | Relative risk | 1 (reference) | 1.05 (0.99, 1.12) | 1.14 (1.07, 1.22) | 1.18 (1.11, 1.27) | 1.23 (1.15, 1.32) | <0.0001 | 0.0038 |
| EDIP | Absolute risk/cases | 566/2143 | 604/2144 | 574/2113 | 616/2081 | 639/2193 | 73 | |
| EDIP | Relative risk | 1 (reference) | 1.05 (0.98, 1.12) | 1.07 (1.00, 1.15) | 1.08 (1.01, 1.17) | 1.16 (1.07, 1.26) | 0.0004 | 0.0101 |
| HEI-2015 | Absolute risk/cases | 651/2307 | 626/2223 | 586/2172 | 585/2075 | 553/1896 | −98 | |
| HEI-2015 | Relative risk | 1 (reference) | 0.97 (0.91, 1.03) | 0.95 (0.89, 1.00) | 0.89 (0.84, 0.95) | 0.84 (0.78, 0.89) | <0.0001 | 0.0038 |
| Invasive Breast cancer | ||||||||
| EDIH | Absolute risk/cases | 275/899 | 259/921 | 272/827 | 276/843 | 294/903 | 19 | |
| EDIH | Relative risk | 1 (reference) | 1.09 (0.99, 1.20) | 1.02 (0.92, 1.12) | 1.06 (0.96, 1.18) | 1.19 (1.07, 1.32) | 0.0032 | 0.0405 |
| EDIP | Absolute risk/cases | 264/926 | 266/936 | 285/874 | 285/866 | 275/791 | 11 | |
| EDIP | Relative risk | 1 (reference) | 1.09 (0.99, 1.20) | 1.07 (0.96, 1.19) | 1.13 (1.01, 1.27) | 1.12 (1.00, 1.27) | 0.0561 | 0.1966 |
| HEI-2015 | Absolute risk/cases | 281/872 | 274/867 | 262/847 | 278/869 | 280/938 | −1 | |
| HEI-2015 | Relative risk | 1 (reference) | 0.95 (0.86, 1.04) | 0.90 (0.82, 1.00) | 0.92 (0.83, 1.01) | 0.99 (0.90, 1.09) | 0.6135 | 0.6842 |
| ER+ | ||||||||
| EDIH | Absolute risk/cases | 226/745 | 207/747 | 217/685 | 231/688 | 232/714 | 6 | |
| EDIH | Relative risk | 1 (reference) | 1.08 (0.97, 1.20) | 1.04 (0.93, 1.16) | 1.07 (0.96, 1.20) | 1.16 (1.04, 1.30) | 0.017 | 0.0808 |
| EDIP | Absolute risk/cases | 217/769 | 213/768 | 232/726 | 228/704 | 222/612 | 5 | |
| EDIP | Relative risk | 1 (reference) | 1.09 (0.98, 1.22) | 1.09 (0.97, 1.23) | 1.13 (1.00, 1.29) | 1.08 (0.94, 1.24) | 0.1966 | 0.3735 |
| HEI-2015 | Absolute risk/cases | 223/694 | 220/692 | 213/695 | 228/720 | 229/778 | 6 | |
| HEI-2015 | Relative risk | 1 (reference) | 0.95 (0.85, 1.05) | 0.93 (0.84, 1.04) | 0.95 (0.86, 1.06) | 1.03 (0.92, 1.14) | 0.6815 | 0.7117 |
| ER- | ||||||||
| EDIH | Absolute risk/cases | 29/100 | 37/123 | 36/105 | 29/100 | 38/127 | 9 | |
| EDIH | Relative risk | 1 (reference) | 1.22 (0.93, 1.60) | 1.05 (0.79, 1.40) | 1.01 (0.75, 1.36) | 1.31 (0.98, 1.76) | 0.1847 | 0.3640 |
| EDIP | Absolute risk/cases | 31/108 | 35/104 | 35/106 | 37/124 | 31/113 | 0 | |
| EDIP | Relative risk | 1 (reference) | 0.98 (0.73, 1.31) | 1.02 (0.75, 1.39) | 1.23 (0.89, 1.70) | 1.19 (0.84, 1.68) | 0.1796 | 0.3640 |
| HEI-2015 | Absolute risk/cases | 38/123 | 31/110 | 31/107 | 33/104 | 35/111 | −3 | |
| HEI-2015 | Relative risk | 1 (reference) | 0.87 (0.67, 1.12) | 0.83 (0.64, 1.08) | 0.79 (0.61, 1.04) | 0.85 (0.65, 1.12) | 0.1725 | 0.3640 |
| PR+ | ||||||||
| EDIH | Absolute risk/cases | 183/626 | 177/636 | 188/588 | 195/575 | 194/604 | 11 | |
| EDIH | Relative risk | 1 (reference) | 1.10 (0.99, 1.24) | 1.08 (0.96, 1.21) | 1.09 (0.96, 1.23) | 1.20 (1.06, 1.36) | 0.0085 | 0.0808 |
| EDIP | Absolute risk/cases | 184/648 | 177/649 | 197/635 | 195/597 | 184/500 | 0 | |
| EDIP | Relative risk | 1 (reference) | 1.12 (0.99, 1.26) | 1.17 (1.03, 1.33) | 1.18 (1.03, 1.36) | 1.09 (0.94, 1.27) | 0.1438 | 0.3277 |
| HEI-2015 | Absolute risk/cases | 190/597 | 187/580 | 181/593 | 191/615 | 189/644 | −1 | |
| HEI-2015 | Relative risk | 1 (reference) | 0.92 (0.82, 1.04) | 0.92 (0.82, 1.03) | 0.94 (0.84, 1.06) | 0.98 (0.87, 1.10) | 0757 | 0.8946 |
| PR- | ||||||||
| EDIH | Absolute risk/cases | 66/206 | 62/222 | 62/195 | 60/204 | 70/225 | 4 | |
| EDIH | Relative risk | 1 (reference) | 1.08 (0.89, 1.31) | 0.96 (0.78, 1.19) | 1.02 (0.83, 1.26) | 1.16 (0.94, 1.43) | 0.2408 | 0.4679 |
| EDIP | Absolute risk/cases | 61/220 | 65/214 | 65/182 | 66/222 | 63/214 | 2 | |
| EDIP | Relative risk | 1 (reference) | 0.96 (0.79, 1.18) | 0.83 (0.66, 1.03) | 1.04 (0.83, 1.31) | 1.06 (0.83, 1.36) | 0.5338 | 0.6579 |
| HEI-2015 | Absolute risk/cases | 68/212 | 59/212 | 60/204 | 65/199 | 69/225 | 1 | |
| HEI-2015 | Relative risk | 1 (reference) | 0.96 (0.79, 1.16) | 0.91 (0.74, 1.10) | 0.88 (0.72, 1.07) | 0.99 (0.81, 1.21) | 0.6136 | 0.7117 |
| HER2+ | ||||||||
| EDIH | Absolute risk/cases | 27/86 | 24/85 | 26/86 | 28/85 | 30/100 | 3 | |
| EDIH | Relative risk | 1 (reference) | 0.99 (0.73, 1.35) | 1.03 (0.75, 1.41) | 1.02 (0.74, 1.42) | 1.24 (0.90, 1.71) | 0.1823 | 0.3640 |
| EDIP | Absolute risk/cases | 25/81 | 26/97 | 27/91 | 31/86 | 26/87 | 1 | |
| EDIP | Relative risk | 1 (reference) | 1.25 (0.91, 1.72) | 1.21 (0.86, 1.71) | 1.20 (0.83, 1.74) | 1.29 (0.86, 1.92) | 0.3012 | 0.4766 |
| HEI-2015 | Absolute risk/cases | 28/97 | 26/84 | 25/84 | 28/90 | 28/87 | 0 | |
| HEI-2015 | Relative risk | 1 (reference) | 0.84 (0.63, 1.13) | 0.84 (0.63, 1.14) | 0.91 (0.68, 1.22) | 0.89 (0.66, 1.22) | 0.5863 | 0.6749 |
| HER2- | ||||||||
| EDIH | Absolute risk/cases | 208/698 | 198/708 | 205/639 | 207/647 | 216/660 | 8 | |
| EDIH | Relative risk | 1 (reference) | 1.09 (0.98, 1.22) | 1.03 (0.92, 1.16) | 1.08 (0.96, 1.21) | 1.15 (1.02, 1.29) | 0.0424 | 0.1696 |
| EDIP | Absolute risk/cases | 203/726 | 200/722 | 214/665 | 210/660 | 207/579 | 4 | |
| EDIP | Relative risk | 1 (reference) | 1.09 (0.98, 1.22) | 1.06 (0.94, 1.20) | 1.13 (0.99, 1.29) | 1.09 (0.95, 1.26) | 0.1868 | 0.3640 |
| HEI-2015 | Absolute risk/cases | 212/654 | 202/652 | 198/662 | 208/657 | 214/727 | 2 | |
| HEI-2015 | Relative risk | 1 (reference) | 0.95 (0.85, 1.06) | 0.94 (0.84, 1.05) | 0.92 (0.82, 1.03) | 1.01 (0.90, 1.13) | 0.9486 | 0.9486 |
| ER- PR- HER2+ | ||||||||
| EDIH | Absolute risk/cases | 7/25 | 8/23 | 8/25 | 7/25 | 7/22 | 0 | |
| EDIH | Relative risk | 1 (reference) | 0.92 (0.51, 1.65) | 1.01 (0.56, 1.82) | 1.01 (0.55, 1.84) | 0.89 (0.47, 1.68) | 0.8008 | 0.8008 |
| EDIP | Absolute risk/cases | 6/19 | 8/31 | 8/21 | 9/25 | 5/24 | −1 | |
| EDIP | Relative risk | 1 (reference) | 1.88 (1.00, 3.51) | 1.35 (0.66, 2.77) | 1.71 (0.81, 3.58) | 1.73 (0.78, 3.83) | 0.2972 | 0.4766 |
| HEI-2015 | Absolute risk/cases | 9/30 | 5/22 | 7/23 | 7/23 | 8/22 | −1 | |
| HEI-2015 | Relative risk | 1 (reference) | 0.72 (0.42, 1.26) | 0.75 (0.43, 1.31) | 0.76 (0.44, 1.34) | 0.76 (0.42, 1.36) | 0.3750 | 0.5182 |
| Luminal A | ||||||||
| EDIH | Absolute risk/cases | 189/640 | 173/625 | 183/575 | 188/582 | 190/576 | 1 | |
| EDIH | Relative risk | 1 (reference) | 1.06 (0.95, 1.19) | 1.03 (0.91, 1.16) | 1.08 (0.95, 1.22) | 1.11 (0.98, 1.26) | 0.1054 | 0.2762 |
| EDIP | Absolute risk/cases | 182/660 | 178/655 | 190/599 | 185/577 | 188/507 | 6 | |
| EDIP | Relative risk | 1 (reference) | 1.10 (0.98, 1.24) | 1.07 (0.94, 1.22) | 1.11 (0.97, 1.28) | 1.08 (0.93, 1.25) | 0.3097 | 0.4766 |
| HEI-2015 | Absolute risk/cases | 187/579 | 181/582 | 179/593 | 186/593 | 190/651 | 3 | |
| HEI-2015 | Relative risk | 1 (reference) | 0.95 (0.85, 1.07) | 0.95 (0.84, 1.06) | 0.93 (0.83, 1.05) | 1.02 (0.90, 1.14) | 0.9289 | 0.9289 |
| Luminal B | ||||||||
| EDIH | Absolute risk/cases | 19/59 | 16/61 | 18/60 | 20/59 | 22/76 | 3 | |
| EDIH | Relative risk | 1 (reference) | 1.05 (0.72, 1.51) | 1.06 (0.72, 1.54) | 1.05 (0.71, 1.55) | 1.40 (0.96, 2.04) | 0.0885 | 0.2491 |
| EDIP | Absolute risk/cases | 19/61 | 17/65 | 20/69 | 21/59 | 19/61 | 0 | |
| EDIP | Relative risk | 1 (reference) | 1.07 (0.73, 1.56) | 1.15 (0.77, 1.71) | 1.02 (0.66, 1.58) | 1.11 (0.70, 1.77) | 0.7315 | 0.7315 |
| HEI-2015 | Absolute risk/cases | 19/65 | 19/59 | 18/60 | 20/67 | 20/64 | 1 | |
| HEI-2015 | Relative risk | 1 (reference) | 0.88 (0.62, 1.26) | 0.90 (0.63, 1.29) | 1.01 (0.71, 1.44) | 0.98 (0.68, 1.41) | 0.9019 | 0.9019 |
| Triple negative | ||||||||
| EDIH | Absolute risk/cases | 18/57 | 24/83 | 21/61 | 17/63 | 25/84 | 7 | |
| EDIH | Relative risk | 1 (reference) | 1.43 (1.01, 2.01) | 1.05 (0.72, 1.54) | 1.09 (0.74, 1.60) | 1.49 (1.02, 2.16) | 0.1386 | 0.3277 |
| EDIP | Absolute risk/cases | 19/66 | 21/65 | 22/65 | 24/81 | 18/71 | −1 | |
| EDIP | Relative risk | 1 (reference) | 0.97 (0.67, 1.40) | 0.98 (0.66, 1.45) | 1.24 (0.82, 1.85) | 1.13 (0.73, 1.76) | 0.3704 | 0.5182 |
| HEI-2015 | Absolute risk/cases | 24/75 | 21/70 | 19/69 | 19/61 | 23/73 | −1 | |
| HEI-2015 | Relative risk | 1 (reference) | 0.91 (0.66, 1.27) | 0.89 (0.64, 1.24) | 0.78 (0.55, 1.10) | 0.93 (0.66, 1.31) | 0.4526 | 0.5950 |
| Invasive ductal carcinoma | ||||||||
| EDIH | Absolute risk/cases | 144/463 | 140/482 | 143/474 | 153/478 | 158/500 | 14 | |
| EDIH | Relative risk | 1 (reference) | 1.07 (0.94, 1.22) | 1.08 (0.94, 1.24) | 1.11 (0.97, 1.28) | 1.20 (1.04, 1.38) | 0.0119 | 0.0808 |
| EDIP | Absolute risk/cases | 146/489 | 143/512 | 152/465 | 153/492 | 146/439 | 0 | |
| EDIP | Relative risk | 1 (reference) | 1.08 (0.94, 1.23) | 1.00 (0.87, 1.16) | 1.11 (0.95, 1.30) | 1.06 (0.89, 1.25) | 0.4745 | 0.6112 |
| HEI-2015 | Absolute risk/cases | 149/459 | 140/485 | 142/450 | 154/506 | 154/497 | 6 | |
| HEI-2015 | Relative risk | 1 (reference) | 1.02 (0.89, 1.16) | 0.93 (0.82, 1.06) | 1.05 (0.92, 1.19) | 1.04 (0.91, 1.19) | 0.5326 | 0.6529 |
| Invasive lobular carcinoma | ||||||||
| EDIH | Absolute risk/cases | 25/87 | 20/81 | 23/65 | 21/68 | 28/81 | 3 | |
| EDIH | Relative risk | 1 (reference) | 1.04 (0.76, 1.42) | 0.88 (0.63, 1.24) | 0.97 (0.69, 1.37) | 1.23 (0.87, 1.72) | 0.3275 | 0.4787 |
| EDIP | Absolute risk/cases | 22/96 | 23/62 | 24/89 | 23/64 | 24/71 | 2 | |
| EDIP | Relative risk | 1 (reference) | 0.70 (0.49, 0.98) | 1.05 (0.76, 1.47) | 0.81 (0.55, 1.18) | 1.00 (0.67, 1.48) | 0.8900 | 0.8900 |
| HEI-2015 | Absolute risk/cases | 24/80 | 24/57 | 20/77 | 24/82 | 23/86 | −1 | |
| HEI-2015 | Relative risk | 1 (reference) | 0.66 (0.47, 0.93) | 0.87 (0.63, 1.19) | 0.89 (0.65, 1.23) | 0.91 (0.66, 1.26) | 0.9513 | 0.9513 |
| Localized | ||||||||
| EDIH | Absolute risk/cases | 186/622 | 179/633 | 185/580 | 190/582 | 200/615 | 14 | |
| EDIH | Relative risk | 1 (reference) | 1.08 (0.97, 1.21) | 1.03 (0.92, 1.16) | 1.07 (0.94, 1.21) | 1.18 (1.04, 1.34) | 0.0193 | 0.0863 |
| EDIP | Absolute risk/cases | 176/630 | 190/658 | 193/597 | 196/606 | 185/541 | 9 | |
| EDIP | Relative risk | 1 (reference) | 1.13 (1.01, 1.28) | 1.08 (0.95, 1.23) | 1.17 (1.02, 1.34) | 1.14 (0.98, 1.32) | 0.0836 | 0.2444 |
| HEI-2015 | Absolute risk/cases | 189/584 | 192/595 | 179/597 | 188/598 | 192/658 | 3 | |
| HEI-2015 | Relative risk | 1 (reference) | 0.97 (0.86, 1.09) | 0.95 (0.84, 1.07) | 0.94 (0.83, 1.06) | 1.03 (0.91, 1.16) | 0.8605 | 0.8605 |
| Regional/distant | ||||||||
| EDIH | Absolute risk/cases | 67/219 | 62/230 | 67/199 | 66/215 | 70/229 | 3 | |
| EDIH | Relative risk | 1 (reference) | 1.09 (0.90, 1.32) | 0.98 (0.80, 1.21) | 1.09 (0.89, 1.34) | 1.20 (0.98, 1.48) | 0.1030 | 0.2762 |
| EDIP | Absolute risk/cases | 69/234 | 59/220 | 71/224 | 67/219 | 67/195 | −2 | |
| EDIP | Relative risk | 1 (reference) | 1.00 (0.82, 1.22) | 1.07 (0.86, 1.32) | 1.11 (0.88, 1.39) | 1.07 (0.83, 1.37) | 0.4475 | 0.5950 |
| HEI-2015 | Absolute risk/cases | 71/226 | 60/216 | 66/201 | 67/220 | 69/229 | −2 | |
| HEI-2015 | Relative risk | 1 (reference) | 0.92 (0.77, 1.12) | 0.85 (0.70, 1.03) | 0.92 (0.76, 1.12) | 0.97 (0.80, 1.18) | 0.7019 | 0.7117 |
| Endometrial cancer | ||||||||
| EDIH | Absolute risk/cases | 46/74 | 47/88 | 53/79 | 52/73 | 62/89 | 16 | |
| EDIH | Relative risk | 1 (reference) | 1.30 (0.94, 1.79) | 1.24 (0.89, 1.74) | 1.24 (0.88, 1.76) | 1.63 (1.16, 2.30) | 0.0110 | 0.0808 |
| EDIP | Absolute risk/cases | 50/81 | 49/93 | 49/67 | 55/84 | 58/78 | 8 | |
| EDIP | Relative risk | 1 (reference) | 1.21 (0.88, 1.68) | 0.94 (0.65, 1.36) | 1.27 (0.87, 1.85) | 1.39 (0.92, 2.09) | 0.1466 | 0.3277 |
| HEI-2015 | Absolute risk/cases | 56/67 | 52/84 | 57/98 | 42/81 | 53/73 | −3 | |
| HEI-2015 | Relative risk | 1 (reference) | 1.16 (0.84, 1.60) | 1.27 (0.93, 1.74) | 1.01 (0.72, 1.41) | 0.88 (0.62, 1.24) | 0.3151 | 0.4766 |
| Endometroid | ||||||||
| EDIH | Absolute risk/cases | 32/49 | 22/50 | 35/53 | 38/52 | 42/62 | 10 | |
| EDIH | Relative risk | 1 (reference) | 1.14 (0.76, 1.71) | 1.30 (0.86, 1.96) | 1.38 (0.90, 2.10) | 1.74 (1.15, 2.64) | 0.0058 | 0.0630 |
| EDIP | Absolute risk/cases | 28/54 | 32/59 | 32/42 | 33/55 | 44/56 | 16 | |
| EDIP | Relative risk | 1 (reference) | 1.19 (0.80, 1.77) | 0.90 (0.57, 1.43) | 1.28 (0.80, 2.03) | 1.52 (0.93, 2.50) | 0.117 | 0.2964 |
| HEI-2015 | Absolute risk/cases | 36/48 | 29/53 | 45/66 | 34/54 | 25/45 | −11 | |
| HEI-2015 | Relative risk | 1 (reference) | 1.03 (0.69, 1.52) | 1.21 (0.83, 1.77) | 0.94 (0.63, 1.41) | 0.77 (0.50, 1.18) | 0.2181 | 0.4043 |
| Non-endometroid | ||||||||
| EDIH | Absolute risk/cases | 15/25 | 19/39 | 19/25 | 17/21 | 16/27 | 1 | |
| EDIH | Relative risk | 1 (reference) | 1.57 (0.94, 2.64) | 1.07 (0.60, 1.92) | 0.97 (0.52, 1.80) | 1.36 (0.75, 2.48) | 0.7359 | 0.7359 |
| EDIP | Absolute risk/cases | 20/27 | 13/33 | 19/26 | 18/29 | 16/22 | −4 | |
| EDIP | Relative risk | 1 (reference) | 1.21 (0.70, 2.09) | 1.01 (0.54, 1.88) | 1.18 (0.62, 2.27) | 1.03 (0.50, 2.13) | 0.9443 | 0.9443 |
| HEI-2015 | Absolute risk/cases | 15/19 | 20/31 | 15/31 | 15/27 | 21/29 | 6 | |
| HEI-2015 | Relative risk | 1 (reference) | 1.52 (0.86, 2.70) | 1.43 (0.80, 2.55) | 1.21 (0.66, 2.20) | 1.25 (0.68, 2.28) | 0.7907 | 0.7907 |
| Ovarian cancer | ||||||||
| EDIH | Absolute rate/cases | 35/60 | 34/52 | 25/54 | 36/41 | 37/53 | 2 | |
| EDIH | Relative risk | 1 (reference) | 0.95 (0.65, 1.39) | 1.04 (0.70, 1.53) | 0.85 (0.55, 1.30) | 1.16 (0.77, 1.75) | 0.5950 | 0.6749 |
| EDIP | Absolute rate/cases | 37/64 | 31/63 | 32/44 | 33/46 | 34/43 | −3 | |
| EDIP | Relative risk | 1 (reference) | 1.02 (0.70, 1.49) | 0.76 (0.49, 1.18) | 0.85 (0.54, 1.36) | 0.89 (0.54, 1.47) | 0.4541 | 0.5950 |
| HEI-2015 | Absolute risk/cases | 33/47 | 28/45 | 36/42 | 34/69 | 37/57 | 4 | |
| HEI-2015 | Relative risk | 1 (reference) | 0.93 (0.62, 1.40) | 0.84 (0.55, 1.29) | 1.37 (0.93, 2.01) | 1.09 (0.73, 1.64) | 0.2412 | 0.4365 |
| Serous | ||||||||
| EDIH | Absolute risk/cases | 14/27 | 16/25 | 9/23 | 17/15 | 17/24 | 3 | |
| EDIH | Relative risk | 1 (reference) | 1.06 (0.60, 1.85) | 1.06 (0.59, 1.91) | 0.75 (0.38, 1.47) | 1.26 (0.68, 2.32) | 0.7023 | 0.7117 |
| EDIP | Absolute risk/cases | 18/28 | 12/35 | 14/20 | 15/10 | 14/21 | −4 | |
| EDIP | Relative risk | 1 (reference) | 1.38 (0.80,2.39) | 0.88 (0.46, 1.71) | 0.48 (0.21, 1.11) | 1.41 (0.54, 2.42) | 0.5589 | 0.6637 |
| HEI-2015 | Absolute risk/cases | 16/23 | 11/19 | 15/21 | 16/28 | 14/23 | −2 | |
| HEI-2015 | Relative risk | 1 (reference) | 0.80 (0.44, 1.48) | 0.86 (0.47, 1.57) | 1.13 (0.64, 2.00) | 0.90 (0.49, 1.66) | 0.9040 | 0.9040 |
| Non-Serous | ||||||||
| EDIH | Absolute risk/cases | 20/33 | 18/27 | 16/31 | 18/26 | 20/29 | 0 | |
| EDIH | Relative risk/cases | 1 (reference) | 0.86 (0.51, 1.44) | 1.01 (0.60, 1.70) | 0.92 (0.53, 1.60) | 1.10 (0.63, 1.91) | 0.6922 | 0.7117 |
| EDIP | Absolute risk/cases | 19/36 | 18/28 | 18/24 | 18/36 | 20/22 | 1 | |
| EDIP | Relative risk | 1 (reference) | 0.75 (0.44, 1.28) | 0.66 (0.37, 1.91) | 1.04 (0.58, 1.87) | 0.70 (0.36, 1.39) | 0.5761 | 0.6736 |
| HEI-2015 | Absolute risk/cases | 16/23 | 15/27 | 20/21 | 19/41 | 22/34 | −6 | |
| HEI-2015 | Relative risk | 1 (reference) | 1.14 (0.65, 1.99) | 0.87 (0.48, 1.58) | 1.66 (0.98, 2.80) | 1.32 (0.76, 2.31) | 0.1355 | 0.3277 |
| Lung cancer | ||||||||
| EDIH | Absolute risk/cases | 116/482 | 108/408 | 107/410 | 113/417 | 119/399 | 3 | |
| EDIH | Relative risk | 1 (reference) | 0.94 (0.82, 1.08) | 0.97 (0.84, 1.11) | 1.01 (0.88, 1.16) | 0.89 (0.77, 1.03) | 0.2609 | 0.4507 |
| EDIP | Absolute risk/cases | 110/547 | 109/464 | 114/397 | 117/377 | 113/331 | 3 | |
| EDIP | Relative risk | 1 (reference) | 1.05 (0.92, 1.20) | 0.97 (0.84, 1.13) | 1.03 (0.88, 1.21) | 1.02 (0.85, 1.21) | 0.9331 | 0.9331 |
| HEI-2015 | Absolute risk/cases | 130/520 | 112/439 | 110/415 | 113/387 | 99/354 | −31 | |
| HEI-2015 | Relative risk | 1 (reference) | 0.97 (0.86, 1.11) | 0.99 (0.87, 1.13) | 0.97 (0.84, 1.11) | 0.91 (0.78, 1.05) | 0.2555 | 0.4507 |
| Small cell | ||||||||
| EDIH | Absolute risk/cases | 7/25 | 8/32 | 7/26 | 6/29 | 9/26 | 2 | |
| EDIH | Relative risk | 1 (reference) | 1.43 (0.83, 2.45) | 1.02 (0.57, 1.83) | 1.15 (0.64, 2.04) | 0.81 (0.44, 1.48) | 0.3198 | 0.4766 |
| EDIP | Absolute risk/cases | 8/31 | 5/38 | 6/23 | 10/28 | 8/18 | 0 | |
| EDIP | Relative risk | 1 (reference) | 1.55 (0.92, 2.61) | 0.93 (0.50, 1.72) | 1.28 (0.68, 2.42) | 0.83 (0.40, 1.74) | 0.6212 | 0.6842 |
| HEI-2015 | Absolute risk/cases | 7/33 | 7/27 | 7/32 | 8/23 | 7/23 | 0 | |
| HEI-2015 | Relative risk | 1 (reference) | 1.21 (0.72, 2.04) | 1.81 (1.09, 3.02) | 1.51 (0.86, 2.65) | 1.79 (1.00, 3.23) | 0.028 | 0.1182 |
| Non-small cell | ||||||||
| EDIH | Absolute risk/cases | 57/249 | 59/183 | 51/204 | 55/225 | 59/198 | 2 | |
| EDIH | Relative risk | 1 (reference) | 0.81 (0.67, 0.99) | 0.94 (0.77, 1.14) | 1.06 (0.88, 1.30) | 0.89 (0.72, 1.09) | 0.7986 | 0.7986 |
| EDIP | Absolute risk/cases | 57/275 | 50/218 | 61/205 | 59/192 | 54/169 | −3 | |
| EDIP | Relative risk | 1 (reference) | 0.98 (0.80, 1.18) | 1.00 (0.81, 1.23) | 1.04 (0.83, 1.31) | 1.04 (0.81, 1.34) | 0.6585 | 0.7117 |
| HEI-2015 | Absolute risk/cases | 64/251 | 56/219 | 53/207 | 57/197 | 51/184 | −13 | |
| HEI-2015 | Relative risk | 1 (reference) | 0.98 (0.81, 1.18) | 0.97 (0.80, 1.17) | 0.95 (0.78, 1.16) | 0.90 (0.73, 1.11) | 0.3434 | 0.4924 |

3.5. EDIP and Cancer Risk (Table 2, Figure 2)
3.6. HEI-2015 and Cancer Risk (Table 2, Figure 2)
3.7. Sensitivity Analyses and Subgroup Analyses (Supplementary Tables S5–S8)
4. Discussion
4.1. Principal Findings, Strengths and Weaknesses in Relation to Other Studies
4.2. Strengths and Weaknesses of the Study
4.3. Possible Implications and Conclusions
Supplementary Materials
Author Contributions
Funding
Institutional Review Board Statement
Informed Consent Statement
Data Availability Statement
Conflicts of Interest
References
- Brucher, B.L.; Jamall, I.S. Epistemology of the origin of cancer: A new paradigm. BMC Cancer 2014, 14, 331. [Google Scholar] [CrossRef]
- Grivennikov, S.I.; Greten, F.R.; Karin, M. Immunity, inflammation, and cancer. Cell 2010, 140, 883–899. [Google Scholar] [CrossRef] [PubMed]
- Hu, Y.; Zhang, X.; Ma, Y.; Yuan, C.; Wang, M.; Wu, K.; Tabung, F.K.; Tobias, D.; Hu, F.B.; Giovannucci, E.; et al. Incident Type 2 Diabetes Duration and Cancer Risk: A Prospective Study in Two US Cohorts. J. Natl. Cancer Inst. 2020, 113, 381–389. [Google Scholar] [CrossRef]
- Tabung, F.K.; Wang, W.; Fung, T.T.; Hu, F.B.; Smith-Warner, S.A.; Chavarro, J.E.; Fuchs, C.S.; Willett, W.C.; Giovannucci, E.L. Development and validation of empirical indices to assess the insulinaemic potential of diet and lifestyle. Br. J. Nutr. 2016, 116, 1787–1798. [Google Scholar] [CrossRef] [PubMed]
- Tabung, F.K.; Smith-Warner, S.A.; Chavarro, J.E.; Wu, K.; Fuchs, C.S.; Hu, F.B.; Chan, A.T.; Willett, W.C.; Giovannucci, E.L. Development and Validation of an Empirical Dietary Inflammatory Index. J. Nutr. 2016, 146, 1560–1570. [Google Scholar] [CrossRef]
- Tabung, F.K.; Wang, W.; Fung, T.T.; Smith-Warner, S.A.; Keum, N.; Wu, K.; Fuchs, C.S.; Hu, F.B.; Giovannucci, E.L. Association of dietary insulinemic potential and colorectal cancer risk in men and women. Am. J. Clin. Nutr. 2018, 108, 363–370. [Google Scholar] [CrossRef] [PubMed]
- Wang, W.; Fung, T.T.; Wang, M.; Smith-Warner, S.A.; Giovannucci, E.L.; Tabung, F.K. Association of the Insulinemic Potential of Diet and Lifestyle With Risk of Digestive System Cancers in Men and Women. JNCI Cancer Spectr. 2018, 2, pky080. [Google Scholar] [CrossRef]
- Tabung, F.K.; Liu, L.; Wang, W.; Fung, T.T.; Wu, K.; Smith-Warner, S.A.; Cao, Y.; Hu, F.B.; Ogino, S.; Fuchs, C.S.; et al. Association of Dietary Inflammatory Potential With Colorectal Cancer Risk in Men and Women. JAMA Oncol. 2018, 4, 366–373. [Google Scholar] [CrossRef] [PubMed]
- Romanos-Nanclares, A.; Tabung, F.K.; Sinnott, J.A.; Trabert, B.; De Vivo, I.; Playdon, M.C.; Eliassen, A.H. Inflammatory and insulinemic dietary patterns and risk of endometrial cancer among US women. J. Natl. Cancer Inst. 2022, 115, 311–321. [Google Scholar] [CrossRef]
- Romanos-Nanclares, A.; Tabung, F.K.; Willett, W.C.; Rosner, B.; Holmes, M.D.; Chen, W.Y.; Tamimi, R.M.; Eliassen, A.H. Insulinemic potential of diet and risk of total and subtypes of breast cancer among US females. Am. J. Clin. Nutr. 2022, 116, 1530–1539. [Google Scholar] [CrossRef]
- Sasamoto, N.; Wang, T.; Townsend, M.K.; Eliassen, A.H.; Tabung, F.K.; Giovannucci, E.L.; Matulonis, U.A.; Terry, K.L.; Tworoger, S.S.; Harris, H.R. Pre-diagnosis and post-diagnosis dietary patterns and survival in women with ovarian cancer. Br. J. Cancer 2022, 127, 1097–1105. [Google Scholar] [CrossRef]
- Petimar, J.; Smith-Warner Stephanie, A.; Fung Teresa, T.; Rosner Bernard Chan Andrew, T.; Hu Frank, B.; Giovannucci Edward, L.; Tabung Fred, K. Recommendation-based dietary indices and risk of colorectal cancer in the Nurses’ Health Study and Health Professionals Follow-up Study. Am. J. Clin. Nutr. 2018, 108, 1092–1103. [Google Scholar] [CrossRef] [PubMed]
- Petimar, J.; Smith-Warner, S.A.; Rosner, B.A.; Chan, A.T.; Giovannucci, E.L.; Tabung, F.K. Adherence to The World Cancer Research Fund/American Institute for Cancer Research 2018 Recommendations for Cancer Prevention and Risk of Colorectal Cancer. Cancer Epidemiol. Biomark. Prev. 2019, 28, 1469–1479. [Google Scholar] [CrossRef] [PubMed]
- Tabung, F.K.; Brown Lisa, S.; Fung Teresa, T. Dietary Patterns and Colorectal Cancer Risk: A Review of 17 Years of Evidence (2000–2016). Curr. Color. Cancer Rep. 2017, 13, 440–454. [Google Scholar] [CrossRef]
- Liu, L.; Nishihara, R.; Qian, Z.R.; Tabung, F.K.; Nevo, D.; Zhang, X.; Song, M.; Cao, Y.; Mima, K.; Masugi, Y.; et al. Association Between Inflammatory Diet Pattern and Risk of Colorectal Carcinoma Subtypes Classified by Immune Responses to Tumor. Gastroenterology 2017, 153, 1517–1530.e1514. [Google Scholar] [CrossRef] [PubMed]
- Tabung, F.K.; Balasubramanian, R.; Liang, L.; Clinton, S.K.; Cespedes Feliciano, E.M.; Manson, J.E.; Van Horn, L.; Wactawski-Wende, J.; Clish, C.B.; Giovannucci, E.L.; et al. Identifying Metabolomic Profiles of Insulinemic Dietary Patterns. Metabolites 2019, 9, 120. [Google Scholar] [CrossRef] [PubMed]
- Tabung, F.K.; Liang, L.; Huang, T.; Balasubramanian, R.; Zhao, Y.; Chandler, P.D.; Manson, J.E.; Cespedes Feliciano, E.M.; Hayden, K.M.; Van Horn, L.; et al. Identifying metabolomic profiles of inflammatory diets in postmenopausal women. Clin. Nutr. 2020, 39, 1478–1490. [Google Scholar] [CrossRef]
- Fouzder, C.; Mukhuty, A.; Mukherjee, S.; Malick, C.; Kundu, R. Trigonelline inhibits Nrf2 via EGFR signalling pathway and augments efficacy of Cisplatin and Etoposide in NSCLC cells. Toxicol. In Vitro 2020, 70, 105038. [Google Scholar] [CrossRef]
- Chandler, P.D.; Song, Y.; Lin, J.; Zhang, S.; Sesso, H.D.; Mora, S.; Giovannucci, E.L.; Rexrode, K.E.; Moorthy, M.V.; Li, C.; et al. Lipid biomarkers and long-term risk of cancer in the Women’s Health Study. Am. J. Clin. Nutr. 2016, 103, 1397–1407. [Google Scholar] [CrossRef]
- The Women’s Health Initiative Study Group. Design of the Women’s Health Initiative clinical trial and observational study. Control. Clin. Trials 1998, 19, 61–109. [Google Scholar] [CrossRef]
- Paynter, N.P.; Balasubramanian, R.; Giulianini, F.; Wang, D.D.; Tinker, L.F.; Gopal, S.; Deik, A.A.; Bullock, K.; Pierce, K.A.; Scott, J.; et al. Metabolic Predictors of Incident Coronary Heart Disease in Women. Circulation 2018, 137, 841–853. [Google Scholar] [CrossRef] [PubMed]
- Patterson, R.E.; Kristal, A.R.; Tinker, L.F.; Carter, R.A.; Bolton, M.P.; Agurs-Collins, T. Measurement Characteristics of the Women’s Health Initiative Food Frequency Questionnaire. Ann. Epidemiol. 1999, 9, 178–187. [Google Scholar] [CrossRef] [PubMed]
- Schakel, S.F.; Sievert, Y.A.; Buzzard, I.M. Sources of data for developing and maintaining a nutrient database. J. Am. Diet. Assoc. 1988, 88, 1268–1271. [Google Scholar] [CrossRef]
- Jin, Q.; Shi, N.; Aroke, D.; Lee, D.H.; Joseph, J.J.; Donneyong, M.; Conwell, D.L.; Hart, P.A.; Zhang, X.; Clinton, S.K.; et al. Insulinemic and Inflammatory Dietary Patterns Show Enhanced Predictive Potential for Type 2 Diabetes Risk in Postmenopausal Women. Diabetes Care 2021, 44, 707–714. [Google Scholar] [CrossRef]
- Healthy Eating Index. U.S. Department of Agriculture Food and Nutrition Service. Available online: https://www.fns.usda.gov/healthy-eating-index-hei (accessed on 17 February 2023).
- Curb, J.; Mctiernan, A.; Heckbert, S.R.; Kooperberg, C.; Stanford, J.; Nevitt, M.; Johnson, K.C.; Proulx-Burns, L.; Pastore, L.; Criqui, M.; et al. Outcomes Ascertainment and Adjudication Methods in the Women’s Health Initiative. Ann. Epidemiol. 2003, 13, S122–S128. [Google Scholar] [CrossRef]
- Yang, J.; Loos, R.J.; Powell, J.E.; Medland, S.E.; Speliotes, E.K.; Chasman, D.I.; Rose, L.M.; Thorleifsson, G.; Steinthorsdottir, V.; Magi, R.; et al. FTO genotype is associated with phenotypic variability of body mass index. Nature 2012, 490, 267–272. [Google Scholar] [CrossRef]
- Li, J.; Guasch-Ferre, M.; Chung, W.; Ruiz-Canela, M.; Toledo, E.; Corella, D.; Bhupathiraju, S.N.; Tobias, D.K.; Tabung, F.K.; Hu, J.; et al. The Mediterranean diet, plasma metabolome, and cardiovascular disease risk. Eur. Heart J. 2020, 41, 2645–2656. [Google Scholar] [CrossRef]
- Willett, W.C.; Howe, G.R.; Kushi, L.H. Adjustment for total energy intake in epidemiologic studies. Am. J. Clin. Nutr. 1997, 65, 1220S–1228S; discussion 1229S–1231S. [Google Scholar] [CrossRef]
- Tabung, F.K.; Satija, A.; Fung, T.T.; Clinton, S.K.; Giovannucci, E.L. Long-Term Change in both Dietary Insulinemic and Inflammatory Potential Is Associated with Weight Gain in Adult Women and Men. J. Nutr. 2019, 149, 804–815. [Google Scholar] [CrossRef] [PubMed]
- Lee, D.H.; Li, J.; Li, Y.; Liu, G.; Wu, K.; Bhupathiraju, S.; Rimm, E.B.; Rexrode, K.M.; Manson, J.E.; Willett, W.C.; et al. Dietary Inflammatory and Insulinemic Potential and Risk of Type 2 Diabetes: Results From Three Prospective U.S. Cohort Studies. Diabetes Care 2020, 43, 2675–2683. [Google Scholar] [CrossRef]
- Wan, Y.; Tabung, F.K.; Lee, D.H.; Fung, T.T.; Willett, W.C.; Giovannucci, E.L. Dietary Insulinemic Potential and Risk of Total and Cause-Specific Mortality in the Nurses’ Health Study and the Health Professionals Follow-up Study. Diabetes Care 2022, 45, 451–459. [Google Scholar] [CrossRef]
- Tabung, F.K.; Steck, S.E.; Ma, Y.; Liese, A.D.; Zhang, J.; Caan, B.; Hou, L.; Johnson, K.C.; Mossavar-Rahmani, Y.; Shivappa, N.; et al. The association between dietary inflammatory index and risk of colorectal cancer among postmenopausal women: Results from the Women’s Health Initiative. Cancer Causes Control 2015, 26, 399–408. [Google Scholar] [CrossRef]
- Vargas, A.J.; Neuhouser, M.L.; George, S.M.; Thomson, C.A.; Ho, G.Y.; Rohan, T.E.; Kato, I.; Nassir, R.; Hou, L.; Manson, J.E. Diet Quality and Colorectal Cancer Risk in the Women’s Health Initiative Observational Study. Am. J. Epidemiol. 2016, 184, 23–32. [Google Scholar] [CrossRef] [PubMed]
- Romanos-Nanclares, A.; Willett, W.C.; Rosner, B.A.; Tamimi, R.M.; Tabung, F.K.; Holmes, M.D.; Chen, W.Y.; Eliassen, A.H. Abstract P1-09-06: Insulinemic potential of diet and risk of total and subtypes of breast cancer among US women. Cancer Res. 2022, 82, P1-09-06. [Google Scholar] [CrossRef]
- Tabung, F.K.; Steck, S.E.; Liese, A.D.; Zhang, J.; Ma, Y.; Caan, B.; Chlebowski, R.T.; Freudenheim, J.L.; Hou, L.; Mossavar-Rahmani, Y.; et al. Association between dietary inflammatory potential and breast cancer incidence and death: Results from the Women’s Health Initiative. Br. J. Cancer 2016, 114, 1277–1285. [Google Scholar] [CrossRef] [PubMed]
- Tabung, F.K.; Steck, S.E.; Liese, A.D.; Zhang, J.; Ma, Y.; Johnson, K.C.; Lane, D.S.; Qi, L.; Snetselaar, L.; Vitolins, M.Z.; et al. Patterns of change over time and history of the inflammatory potential of diet and risk of breast cancer among postmenopausal women. Breast Cancer Res. Treat. 2016, 159, 139–149. [Google Scholar] [CrossRef]
- Steck, S.E.; Murphy, E.A. Dietary patterns and cancer risk. Nat. Rev. Cancer 2020, 20, 125–138. [Google Scholar] [CrossRef]
- Shi, N.; Aroke, D.; Jin, Q.; Lee, D.H.; Hussan, H.; Zhang, X.; Manson, J.E.; LeBlanc, E.S.; Barac, A.; Arcan, C.; et al. Proinflammatory and Hyperinsulinemic Dietary Patterns Are Associated With Specific Profiles of Biomarkers Predictive of Chronic Inflammation, Glucose-Insulin Dysregulation, and Dyslipidemia in Postmenopausal Women. Front. Nutr. 2021, 8, 690428. [Google Scholar] [CrossRef]
- Giovannucci, E.; Harlan, D.M.; Archer, M.C.; Bergenstal, R.M.; Gapstur, S.M.; Habel, L.A.; Pollak, M.; Regensteiner, J.G.; Yee, D. Diabetes and cancer: A consensus report. Diabetes Care 2010, 33, 1674–1685. [Google Scholar] [CrossRef]
- Dashti, S.G.; Simpson, J.A.; Viallon, V.; Karahalios, A.; Moreno-Betancur, M.; Brasky, T.; Pan, K.; Rohan, T.E.; Shadyab, A.H.; Thomson, C.A.; et al. Adiposity and breast, endometrial, and colorectal cancer risk in postmenopausal women: Quantification of the mediating effects of leptin, C-reactive protein, fasting insulin, and estradiol. Cancer Med. 2022, 11, 1145–1159. [Google Scholar] [CrossRef]
- Reeves, G.K.; Pirie, K.; Beral, V.; Green, J.; Spencer, E.; Bull, D.; Million Women Study, C. Cancer incidence and mortality in relation to body mass index in the Million Women Study: Cohort study. BMJ 2007, 335, 1134. [Google Scholar] [CrossRef]
- Tabung, F.K.; Huang, T.; Giovannucci, E.L.; Smith-Warner, S.A.; Tworoger, S.S.; Poole, E.M. The inflammatory potential of diet and ovarian cancer risk: Results from two prospective cohort studies. Br. J. Cancer 2017, 117, 907–911. [Google Scholar] [CrossRef] [PubMed]
- Cesar, T.B.; Oliveira, M.R.; Mesquita, C.H.; Maranhao, R.C. High cholesterol intake modifies chylomicron metabolism in normolipidemic young men. J. Nutr. 2006, 136, 971–976. [Google Scholar] [CrossRef] [PubMed]
- Christodoulou, M.I.; Tchoumtchoua, J.; Skaltsounis, A.L.; Scorilas, A.; Halabalaki, M. Natural Alkaloids Intervening the Insulin Pathway: New Hopes for Anti-Diabetic Agents? Curr. Med. Chem. 2019, 26, 5982–6015. [Google Scholar] [CrossRef] [PubMed]
- Hu, F.B.; Rimm, E.; Smith-Warner, S.A.; Feskanich, D.; Stampfer, M.J.; Ascherio, A.; Sampson, L.; Willett, W.C. Reproducibility and validity of dietary patterns assessed with a food-frequency questionnaire. Am. J. Clin. Nutr. 1999, 69, 243–249. [Google Scholar] [CrossRef] [PubMed]
- Zeleznik, O.A.; Wittenbecher, C.; Deik, A.; Jeanfavre, S.; Avila-Pacheco, J.; Rosner, B.; Rexrode, K.M.; Clish, C.B.; Hu, F.B.; Eliassen, A.H. Intrapersonal Stability of Plasma Metabolomic Profiles over 10 Years among Women. Metabolites 2022, 12, 372. [Google Scholar] [CrossRef] [PubMed]
- Casso, D.; White, E.; Patterson, R.E.; Agurs-Collins, T.; Kooperberg, C.; Haines, P.S. Correlates of serum lycopene in older women. Nutr. Cancer 2000, 36, 163–169. [Google Scholar] [CrossRef]
- Kapala, A.; Szlendak, M.; Motacka, E. The Anti-Cancer Activity of Lycopene: A Systematic Review of Human and Animal Studies. Nutrients 2022, 14, 5152. [Google Scholar] [CrossRef]
| T1 | T2 | T3 | P for Linear Trend c | 1 sd Increment | P for Continuous Dietary Score e | |
|---|---|---|---|---|---|---|
| Overall cancer/cases | ||||||
| EDIH metabolomics score | 165 | 133 | 143 | |||
| MV-adjusted | 1 | 0.80 (0.63, 1.01) | 0.93 (0.72, 1.20) | 0.5171 | 0.99 (0.78, 1.26) | 0.9115 |
| EDIP metabolomics score | 179 | 140 | 122 | |||
| MV-adjusted | 1 | 0.83 (0.66, 1.04) | 0.81 (0.62, 1.05) | 0.0893 | 0.76 (0.58, 1.00) | 0.0531 |
| HEI metabolomics score | 161 | 130 | 150 | |||
| MV-adjusted | 1 | 0.82 (0.64, 1.05) | 0.94 (0.73, 1.22) | 0.6573 | 0.86 (0.68, 1.09) | 0.2083 |
| Colorectal cancer/cases | ||||||
| EDIH metabolomics score | 25 | 16 | 18 | |||
| MV-adjusted | 1 | 0.34 (0.14, 0.85) | 0.52 (0.21, 1.28) | 0.1259 | 0.67 (0.27, 1.63) | 0.3777 |
| EDIP metabolomics score | 28 | 13 | 18 | |||
| MV-adjusted | 1 | 0.38 (0.15, 0.96) | 0.63 (0.25, 1.61) | 0.3514 | 0.57 (0.20, 1.60) | 0.2845 |
| HEI metabolomics score | 21 | 13 | 25 | |||
| MV-adjusted | 1 | 0.28 (0.10, 0.77) | 1.56 (0.66, 3.71) | 0.2690 | 1.33 (0.58, 3.07) | 0.5007 |
| Colon cancer/cases | ||||||
| EDIH metabolomics score | 19 | 10 | 17 | |||
| MV-adjusted | 1 | 0.38 (0.14, 1.03) | 0.74 (0.29, 1.89) | 0.5184 | 1.04 (0.39, 2.73) | 0.9413 |
| EDIP metabolomics score | 21 | 9 | 16 | |||
| MV-adjusted | 1 | 0.41 (0.14, 1.22) | 0.73 (0.26, 2.04) | 0.6204 | 0.61 (0.20 1.92) | 0.3987 |
| HEI metabolomics score | 19 | 10 | 17 | |||
| MV-adjusted | 1 | 0.27 (0.09, 0.77) | 0.94 (0.37, 2.40) | 0.9655 | 0.78 (0.31, 1.96) | 0.5954 |
| Intestinal Polyps/cases | ||||||
| EDIH metabolomics score | 67 | 77 | 100 | |||
| MV-adjusted | 1 | 0.96 (0.63, 1.44) | 1.13 (0.72, 1.76) | 0.5515 | 1.29 (0.84, 1.98) | 0.2458 |
| EDIP metabolomics score | 61 | 75 | 108 | |||
| MV-adjusted | 1 | 1.17 (0.75, 1.84) | 1.46 (0.91, 2.34) | 0.1136 | 1.51 (0.93, 2.46) | 0.0989 |
| HEI metabolomics score | 95 | 80 | 69 | |||
| MV-adjusted | 1 | 0.89 (0.60, 1.33) | 0.72 (0.47, 1.11) | 0.1421 | 0.76 (0.51, 1.13) | 0.1701 |
| Invasive breast cancer/cases | ||||||
| EDIH metabolomics score | 44 | 33 | 41 | |||
| MV-adjusted | 1 | 0.74 (0.46, 1.18) | 1.00 (0.62, 1.62) | 0.9814 | 1.39 (0.87, 2.20) | 0.1649 |
| EDIP metabolomics score | 41 | 37 | 40 | |||
| MV-adjusted | 1 | 0.95 (0.60, 1.52) | 1.16 (0.71, 1.89) | 0.5685 | 1.01 (0.60, 1.71) | 0.9649 |
| HEI metabolomics score | 38 | 39 | 41 | |||
| MV-adjusted | 1 | 1.02 (0.64, 1.64) | 1.03 (0.62, 1.69) | 0.9158 | 1.00 (0.65, 1.56) | 0.9812 |
| Endometrial cancer/cases | ||||||
| EDIH metabolomics score | 5 | 5 | 12 | |||
| MV-adjusted | 1 | 0.44 (0.10, 1.87) | 1.78 (0.51, 6.27) | 0.2407 | 3.58 (0.96, 13.29) | 0.0566 |
| EDIP metabolomics score | 6 | 5 | 11 | |||
| MV-adjusted | 1 | 0.70 (0.18, 2.68) | 1.25 (0.36, 4.35) | 0.6640 | 2.67 (0.63, 11.28) | 0.1805 |
| HEI metabolomics score | 7 | 10 | 5 | |||
| MV-adjusted | 1 | 1.23 (0.39, 3.93) | 0.54 (0.13, 2.25) | 0.3963 | 0.41 (0.12, 1.43) | 0.1627 |
| Lung cancer/cases | ||||||
| EDIH metabolomics score | 23 | 28 | 24 | |||
| MV-adjusted | 1 | 1.25 (0.69, 2.27) | 1.10 (0.56, 2.14) | 0.7803 | 0.88 (0.47, 1.65) | 0.6964 |
| EDIP metabolomics score | 33 | 39 | 13 | |||
| MV-adjusted | 1 | 0.96 (0.56, 1.65) | 0.52 (0.25, 1.12) | 0.1340 | 0.57 (0.28, 1.14) | 0.1115 |
| HEI metabolomics score | 41 | 18 | 16 | |||
| MV-adjusted | 1 | 0.49 (0.26, 0.92) | 0.49 (0.24, 1.01) | 0.0289 | 0.46 (0.24, 0.90) | 0.0227 |
Disclaimer/Publisher’s Note: The statements, opinions and data contained in all publications are solely those of the individual author(s) and contributor(s) and not of MDPI and/or the editor(s). MDPI and/or the editor(s) disclaim responsibility for any injury to people or property resulting from any ideas, methods, instructions or products referred to in the content. |
© 2023 by the authors. Licensee MDPI, Basel, Switzerland. This article is an open access article distributed under the terms and conditions of the Creative Commons Attribution (CC BY) license (https://creativecommons.org/licenses/by/4.0/).
Share and Cite
Jin, Q.; Shi, N.; Lee, D.H.; Rexrode, K.M.; Manson, J.E.; Balasubramanian, R.; Zhang, X.; Neuhouser, M.L.; Lopez-Pentecost, M.; Thomson, C.A.; et al. Hyperinsulinemic and Pro-Inflammatory Dietary Patterns and Metabolomic Profiles Are Associated with Increased Risk of Total and Site-Specific Cancers among Postmenopausal Women. Cancers 2023, 15, 1756. https://doi.org/10.3390/cancers15061756
Jin Q, Shi N, Lee DH, Rexrode KM, Manson JE, Balasubramanian R, Zhang X, Neuhouser ML, Lopez-Pentecost M, Thomson CA, et al. Hyperinsulinemic and Pro-Inflammatory Dietary Patterns and Metabolomic Profiles Are Associated with Increased Risk of Total and Site-Specific Cancers among Postmenopausal Women. Cancers. 2023; 15(6):1756. https://doi.org/10.3390/cancers15061756
Chicago/Turabian StyleJin, Qi, Ni Shi, Dong Hoon Lee, Kathryn M. Rexrode, JoAnn E. Manson, Raji Balasubramanian, Xuehong Zhang, Marian L. Neuhouser, Melissa Lopez-Pentecost, Cynthia A. Thomson, and et al. 2023. "Hyperinsulinemic and Pro-Inflammatory Dietary Patterns and Metabolomic Profiles Are Associated with Increased Risk of Total and Site-Specific Cancers among Postmenopausal Women" Cancers 15, no. 6: 1756. https://doi.org/10.3390/cancers15061756
APA StyleJin, Q., Shi, N., Lee, D. H., Rexrode, K. M., Manson, J. E., Balasubramanian, R., Zhang, X., Neuhouser, M. L., Lopez-Pentecost, M., Thomson, C. A., Zick, S. M., Felix, A. S., Stover, D. G., Sardesai, S. D., Esnakula, A., Mo, X., Clinton, S. K., & Tabung, F. K. (2023). Hyperinsulinemic and Pro-Inflammatory Dietary Patterns and Metabolomic Profiles Are Associated with Increased Risk of Total and Site-Specific Cancers among Postmenopausal Women. Cancers, 15(6), 1756. https://doi.org/10.3390/cancers15061756