
MicroRNA-483-5p Inhibits Hepatocellular Carcinoma Cell Proliferation, Cell Steatosis, and Fibrosis by Targeting PPARα and TIMP2

 ,
,  , and
, and 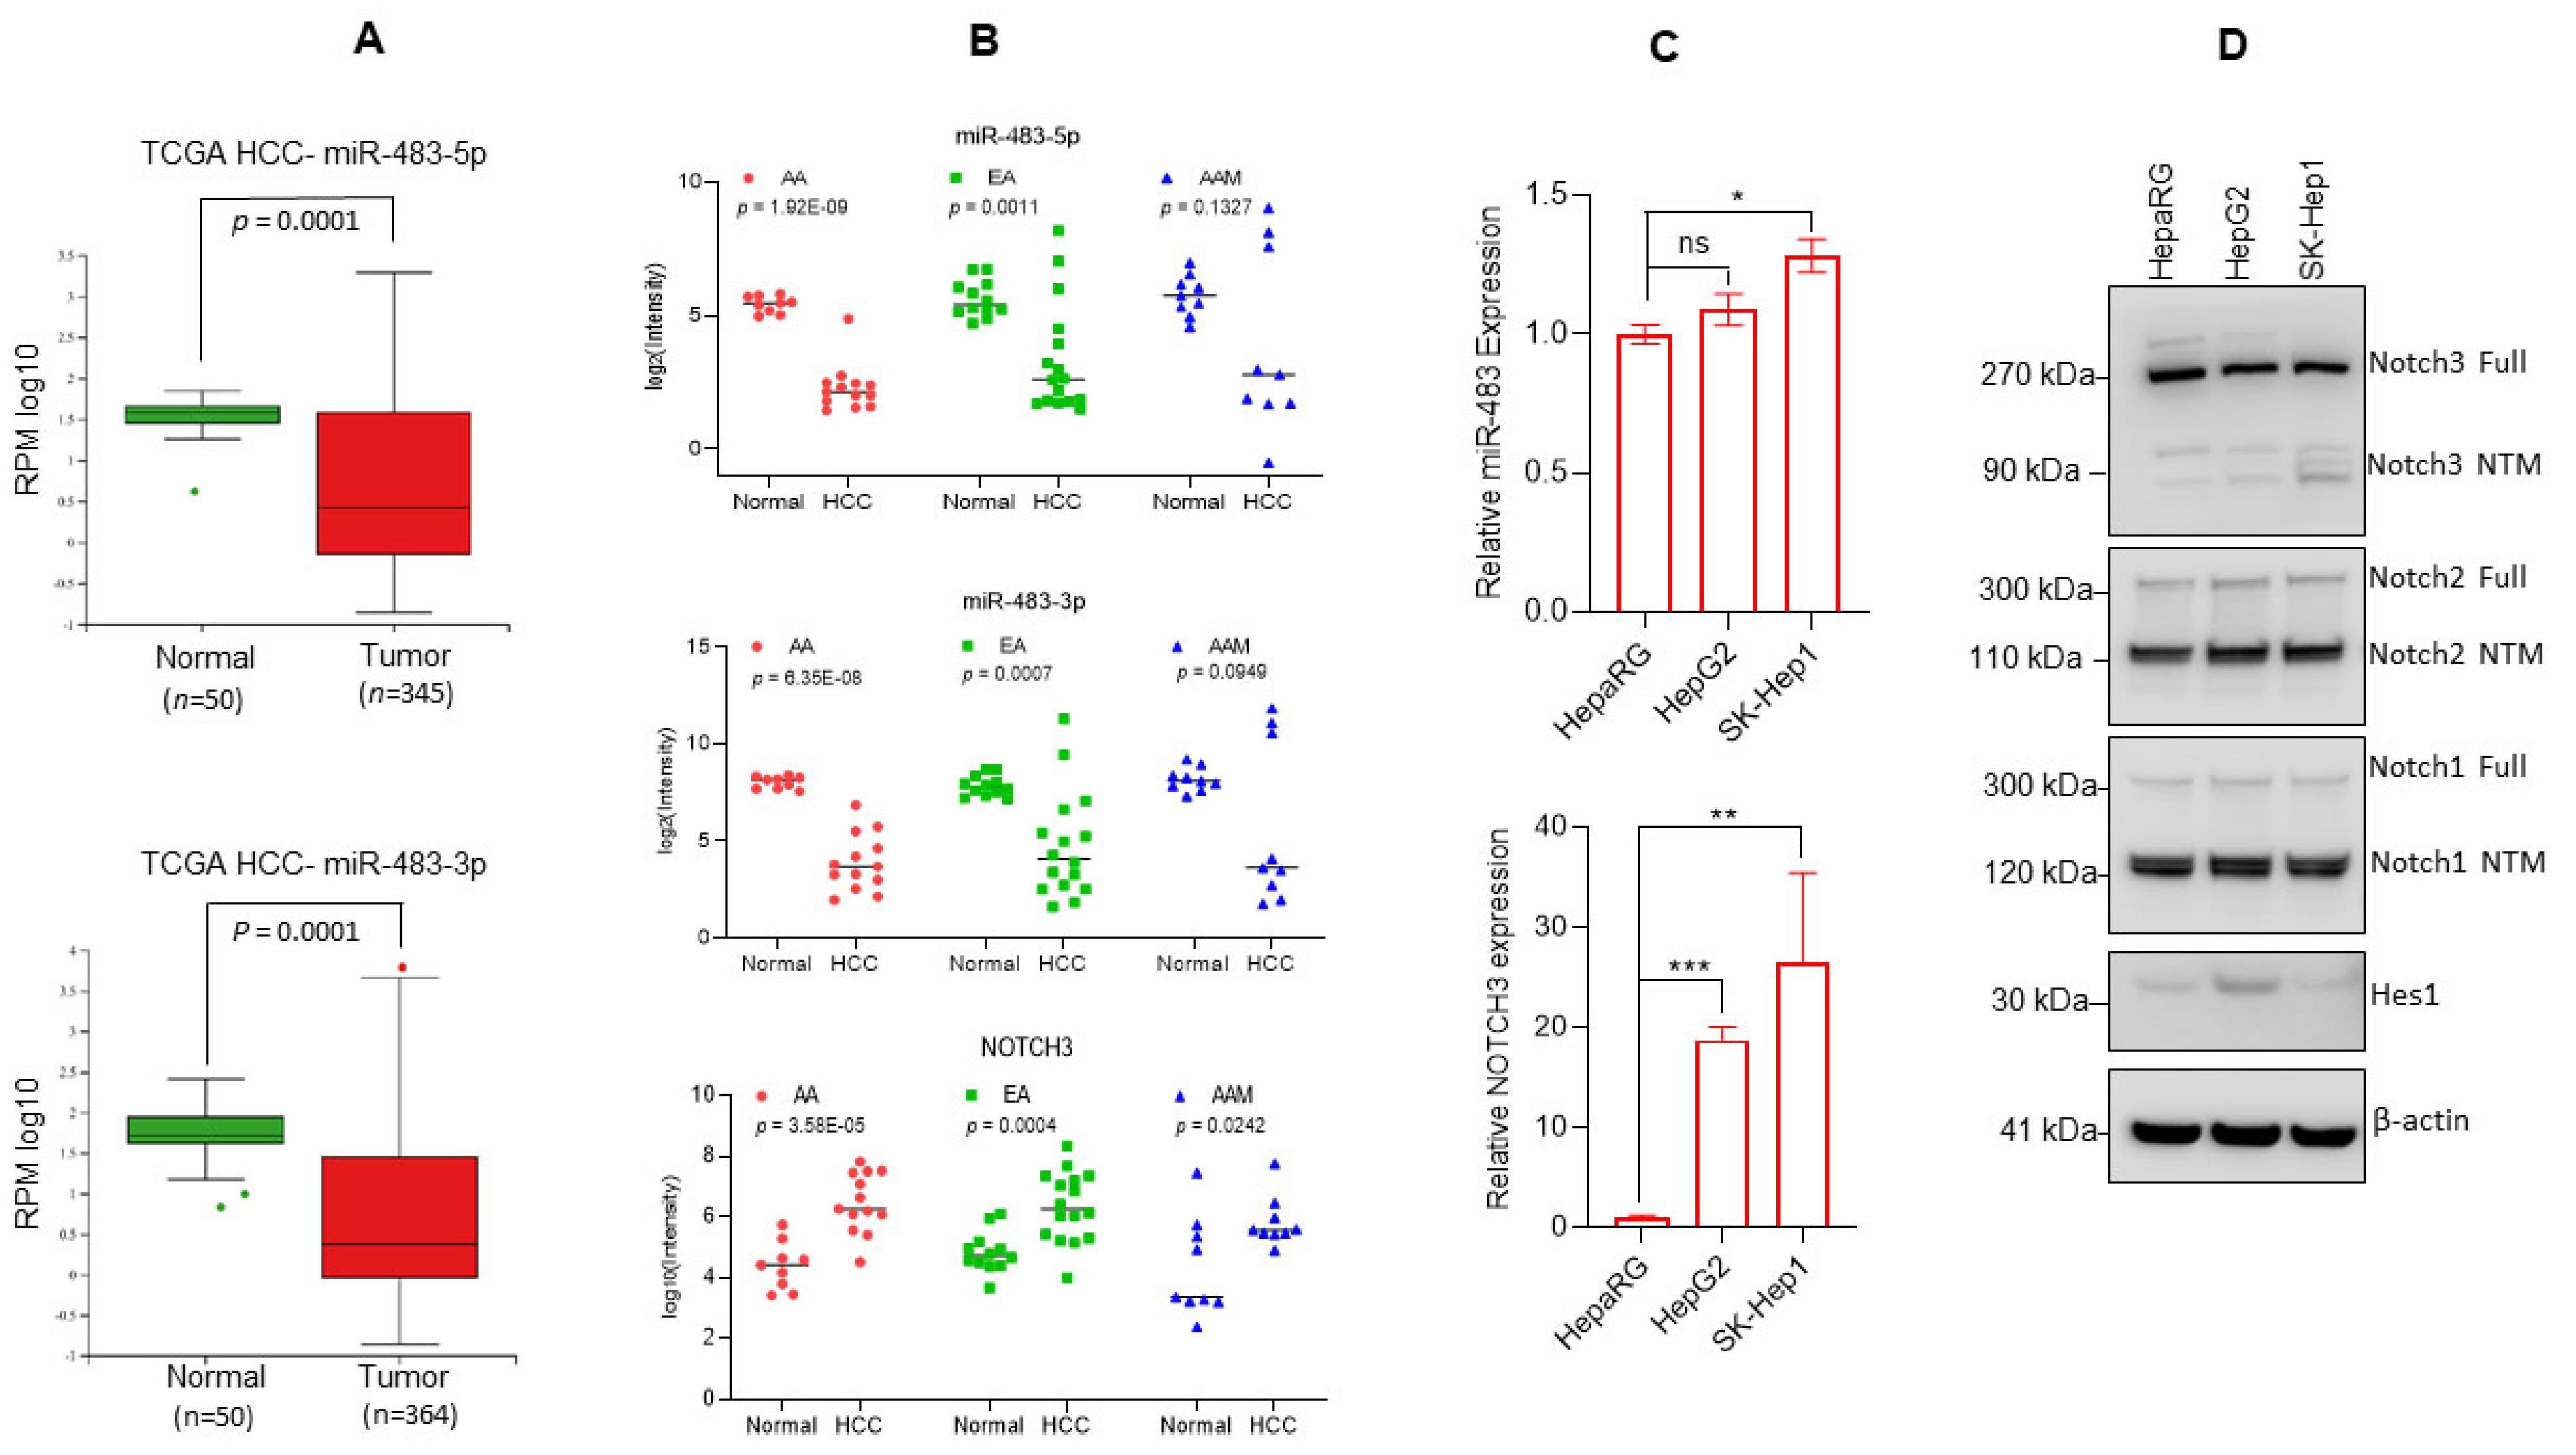
Abstract
Simple Summary
Abstract
1. Introduction
2. Materials and Methods
2.1. HCC Tumor Samples and miR-483 Expression
2.2. Cell Culture
2.3. miRNA Transfection
2.4. RT/qPCR
2.5. Western Blotting
2.6. Cell Survival Assay
2.7. Cell Colony Formation Assay
2.8. Cell Migration Assay
2.9. Luciferase Assay
2.10. Development of NAFLD and AFLD Mouse Models
2.11. Statistical Analysis
3. Results
3.1. Downregulation of miR-483 Expression Activates Notch Signaling in HCC Tissues
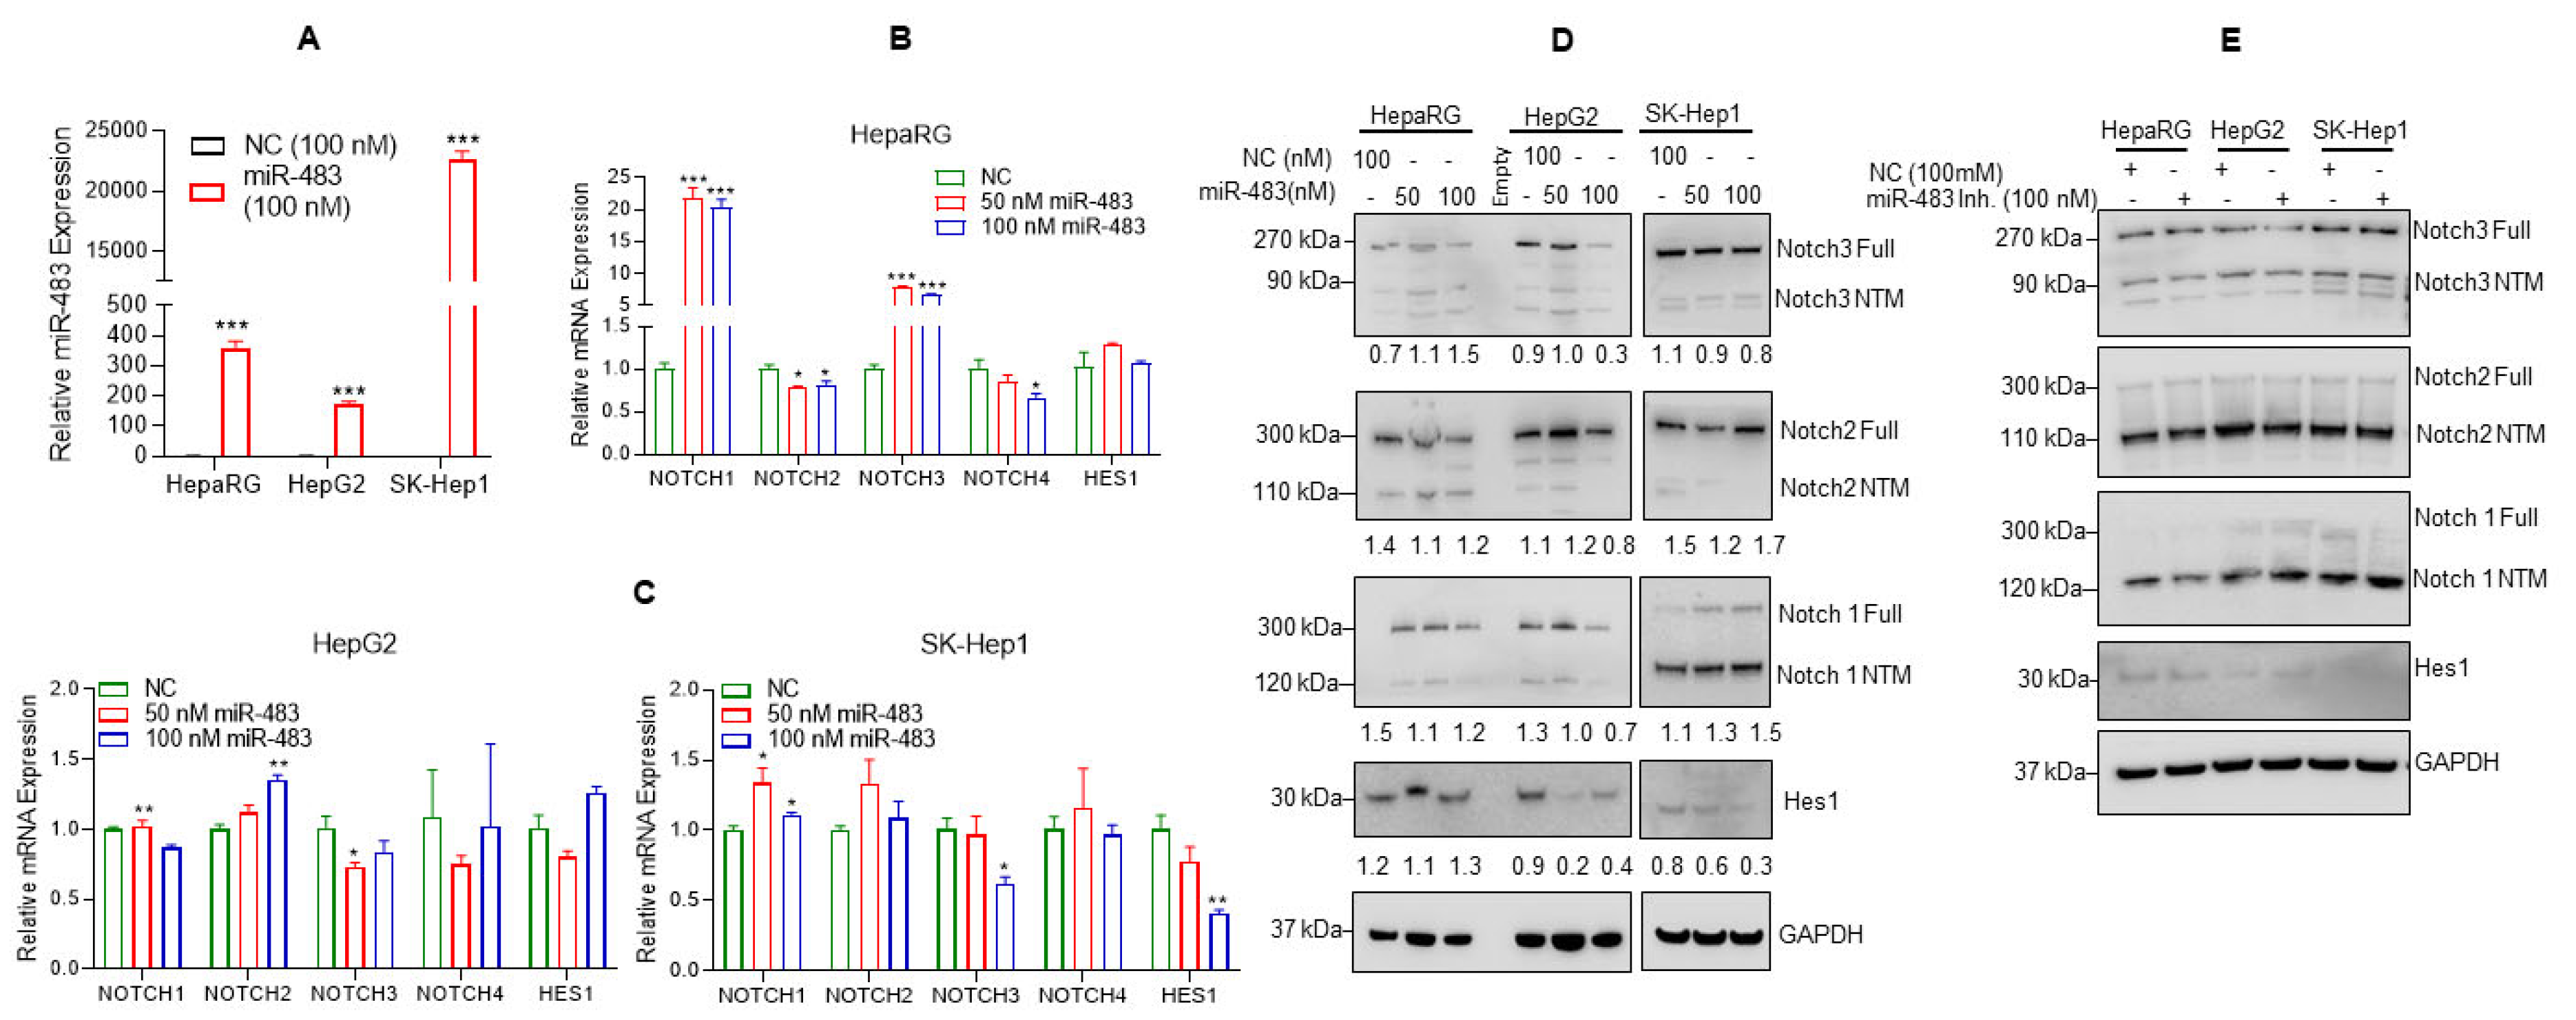
3.2. Overexpression of miR-483 Dysregulates Notch Signaling in HCC Cells
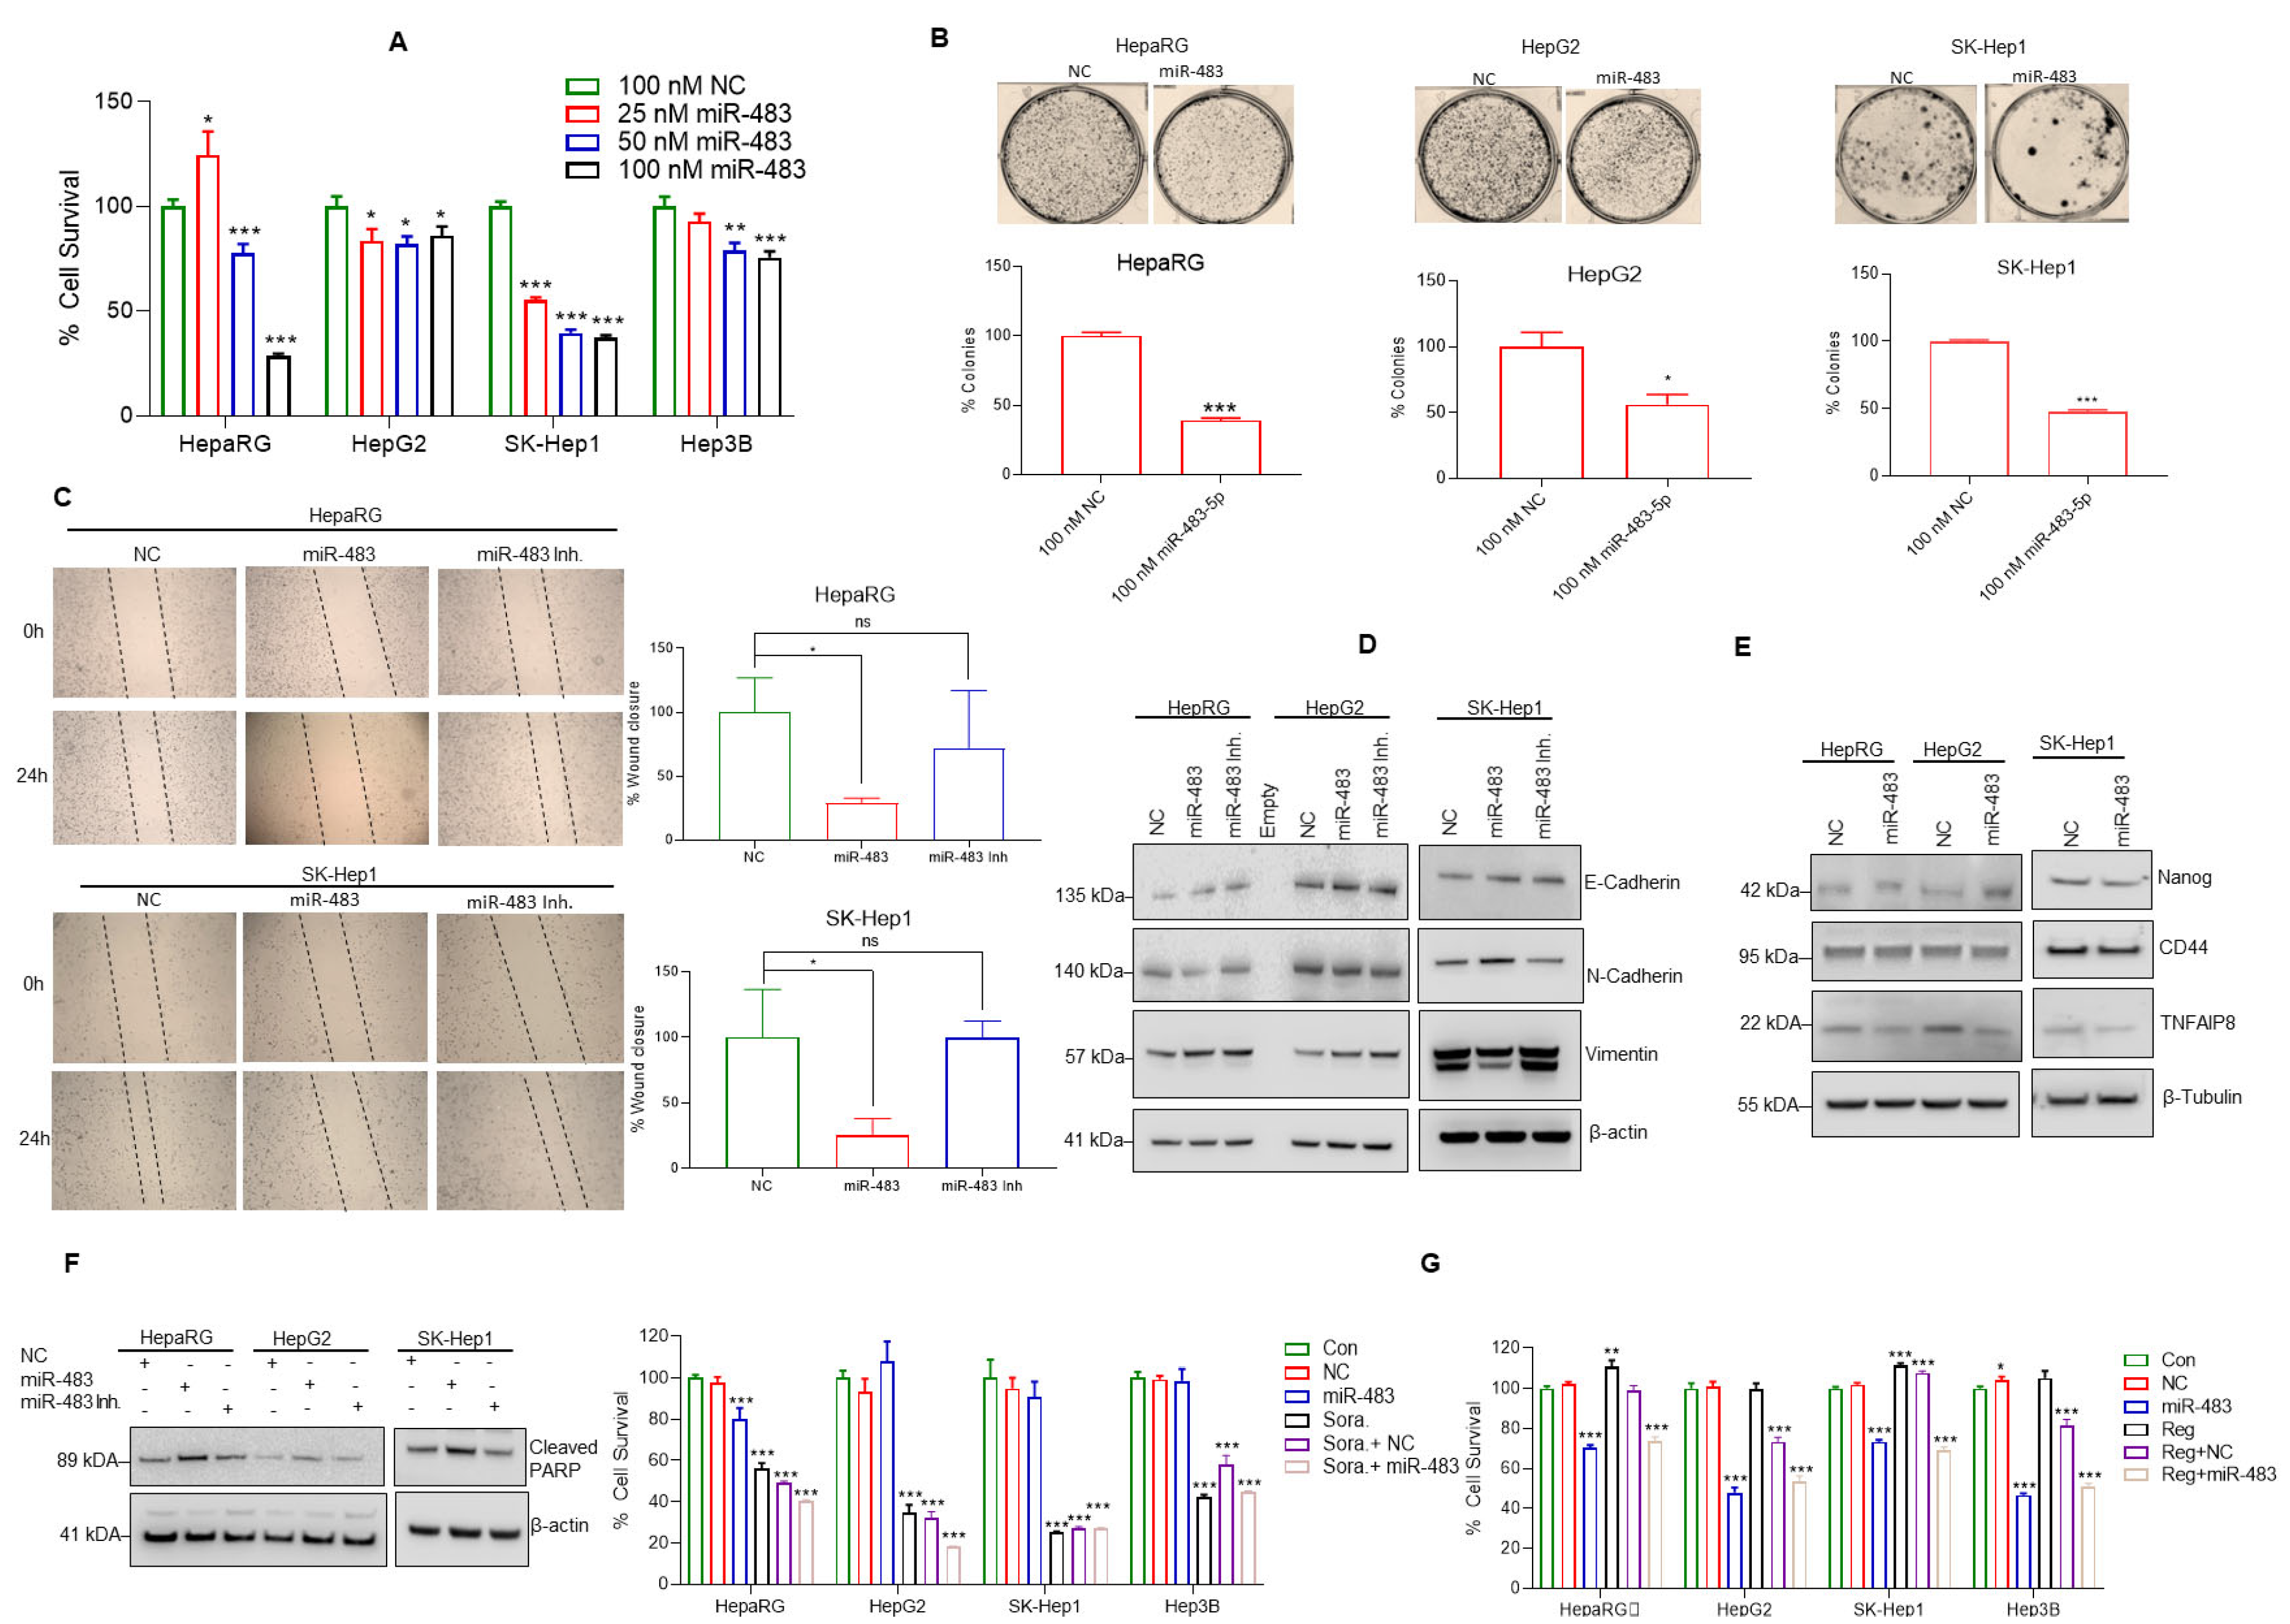
3.3. miR-483 Inhibits HCC Hallmarks and Increases Sensitivity toward Anti-HCC Drugs
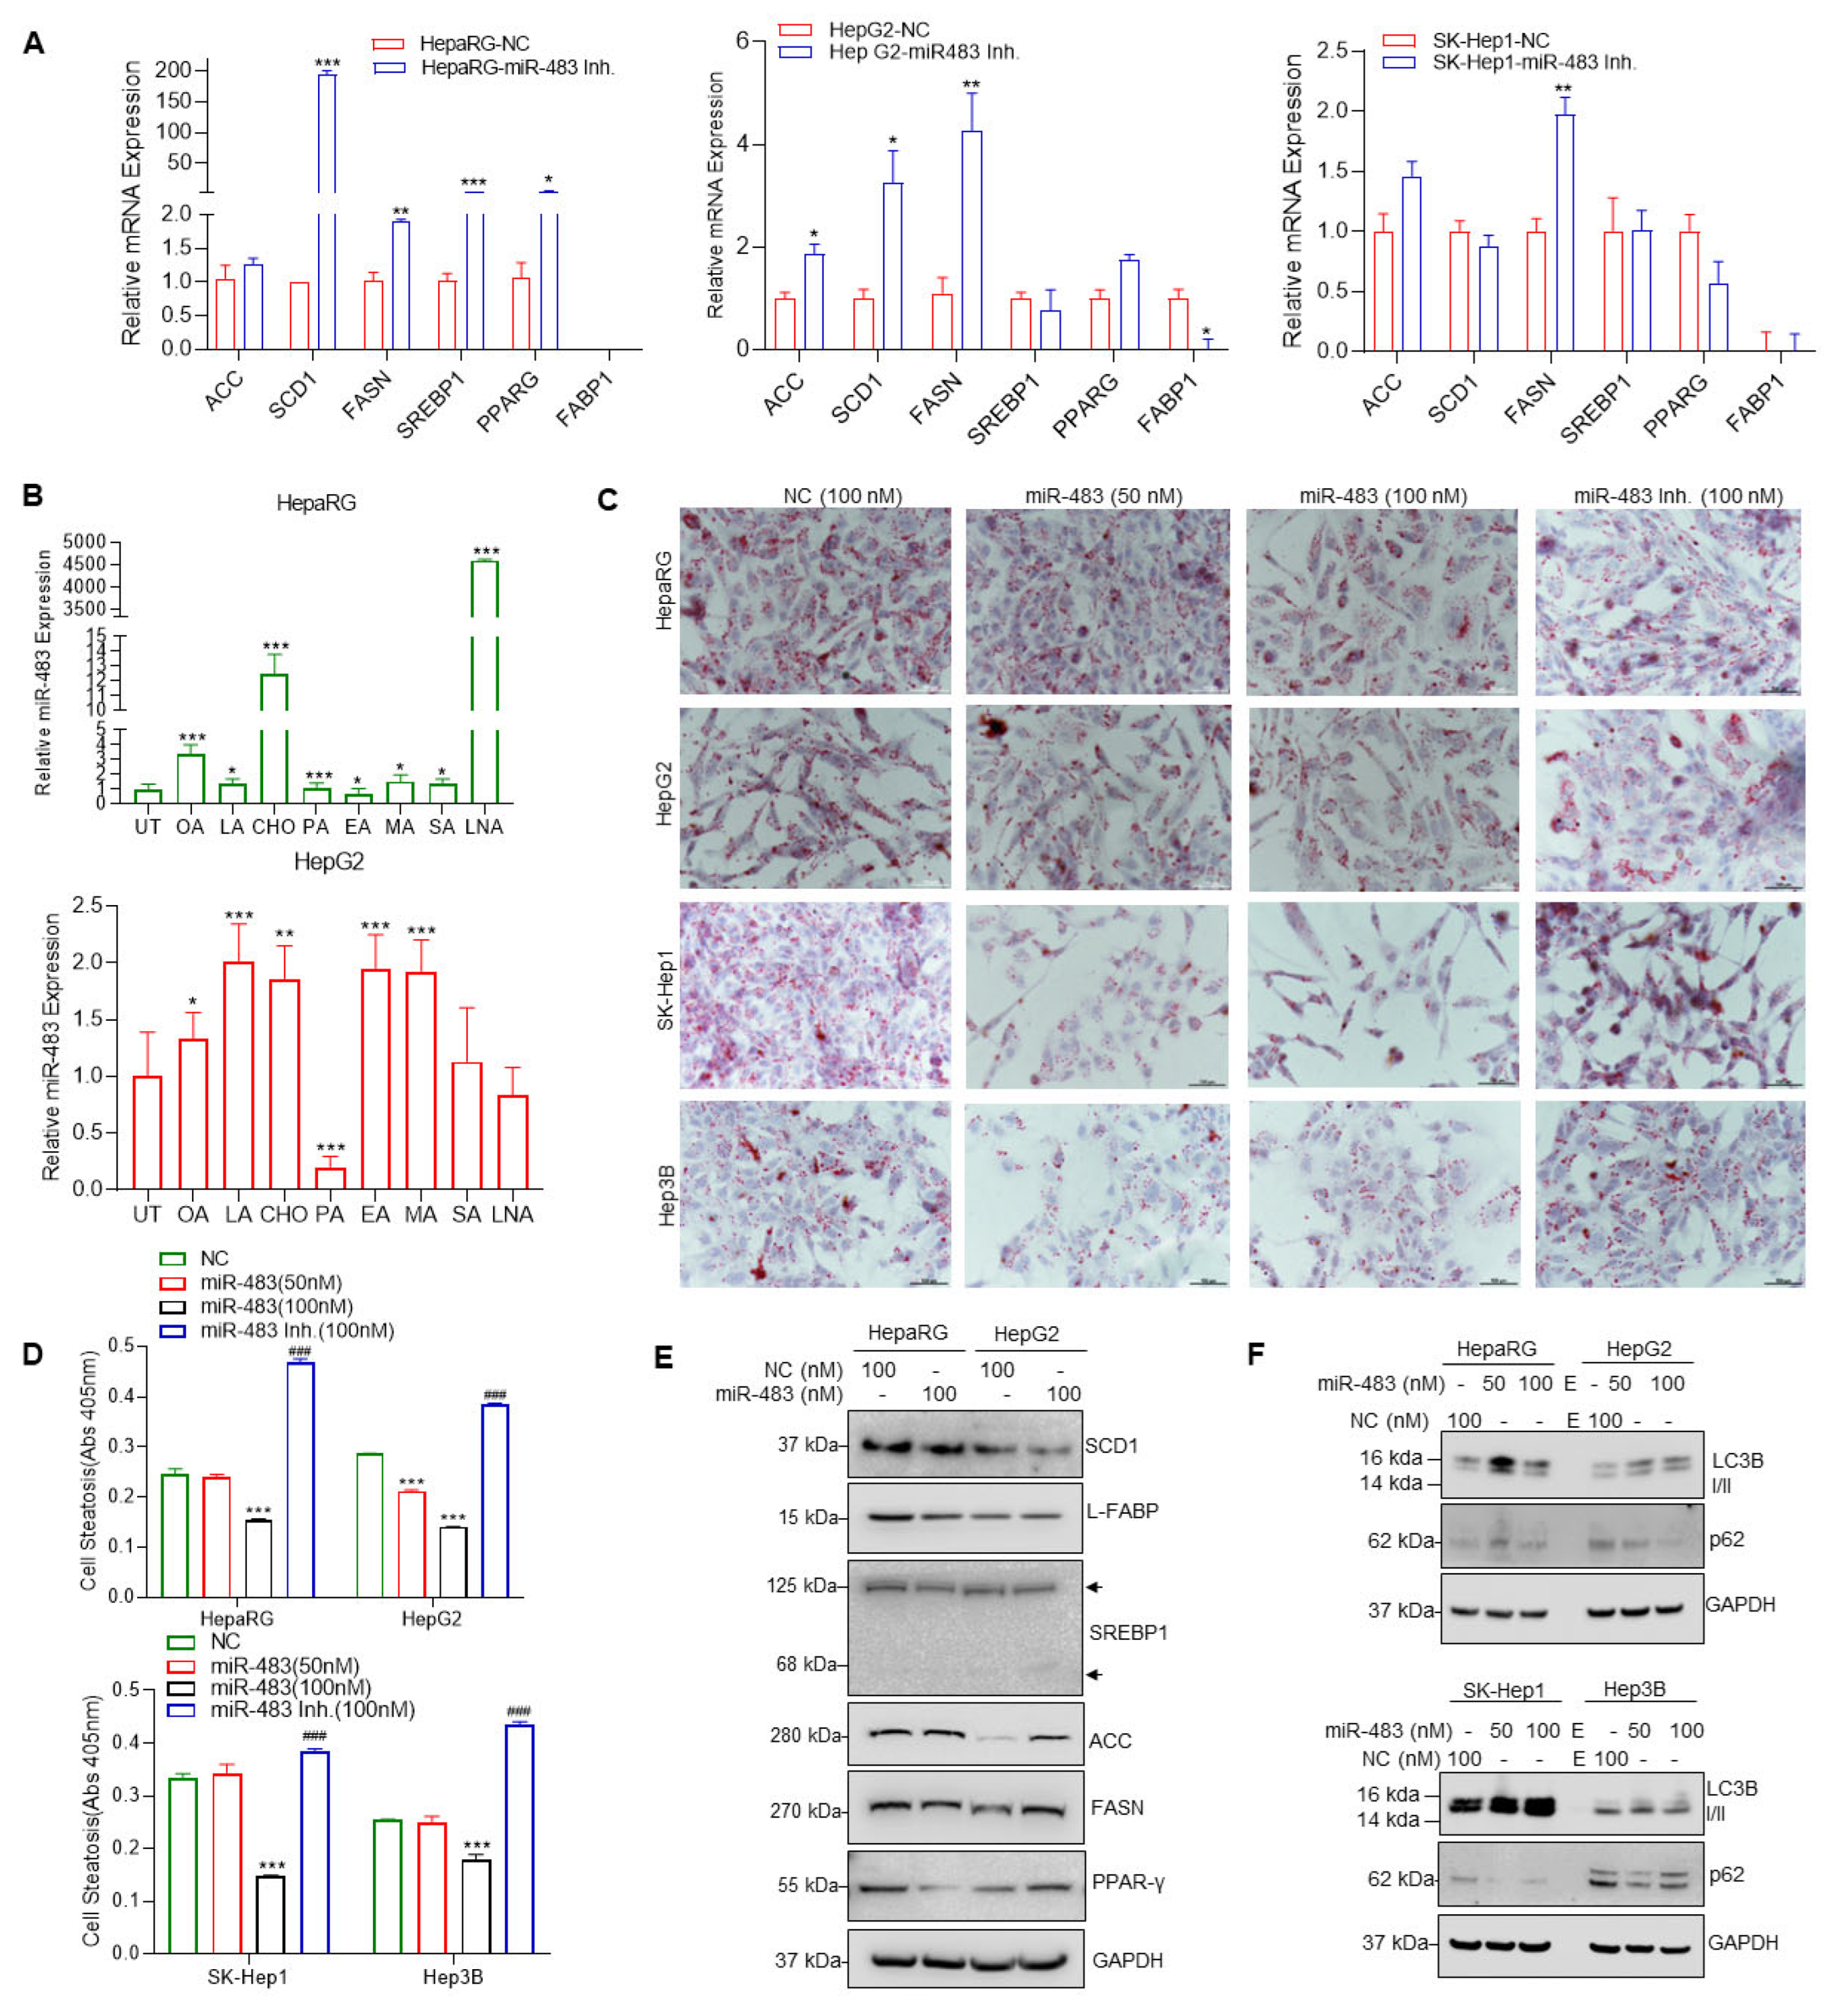
3.4. miR-483 Inhibits HCC Cell Steatosis by Modulation of Lipogenic Gene Expression
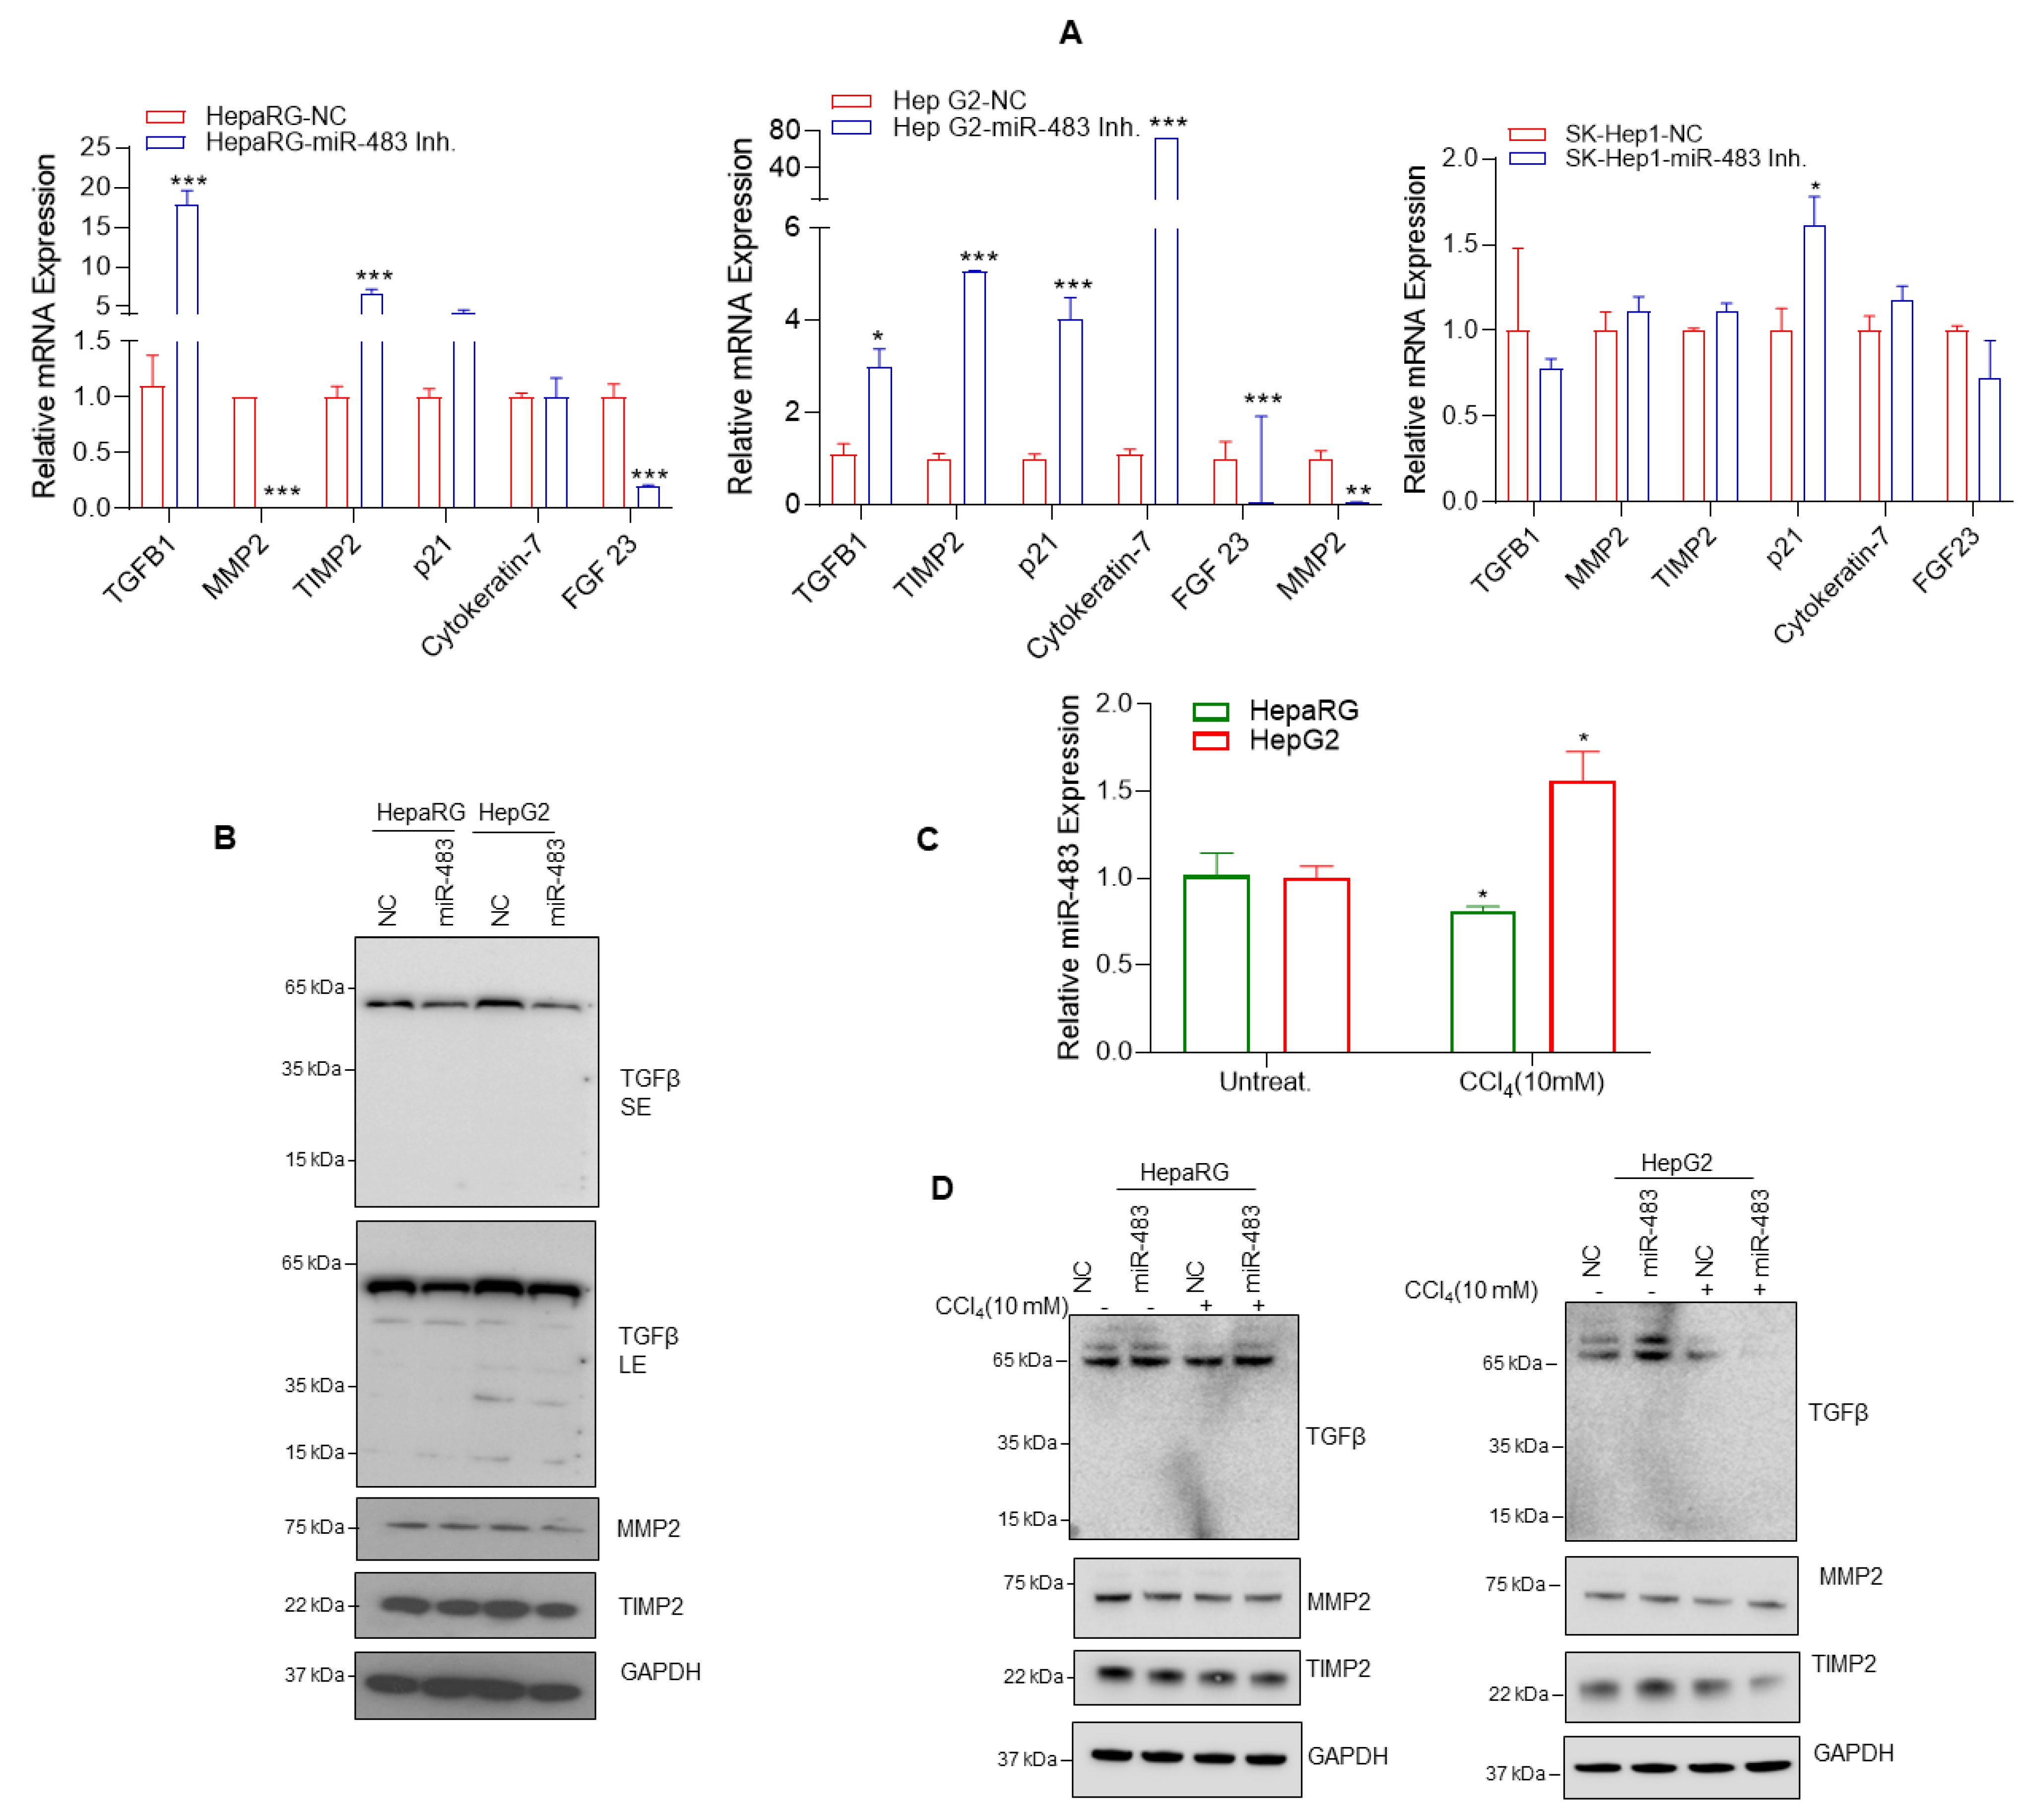
3.5. miR-483 Inhibits Fibrogenic Signaling in HCC
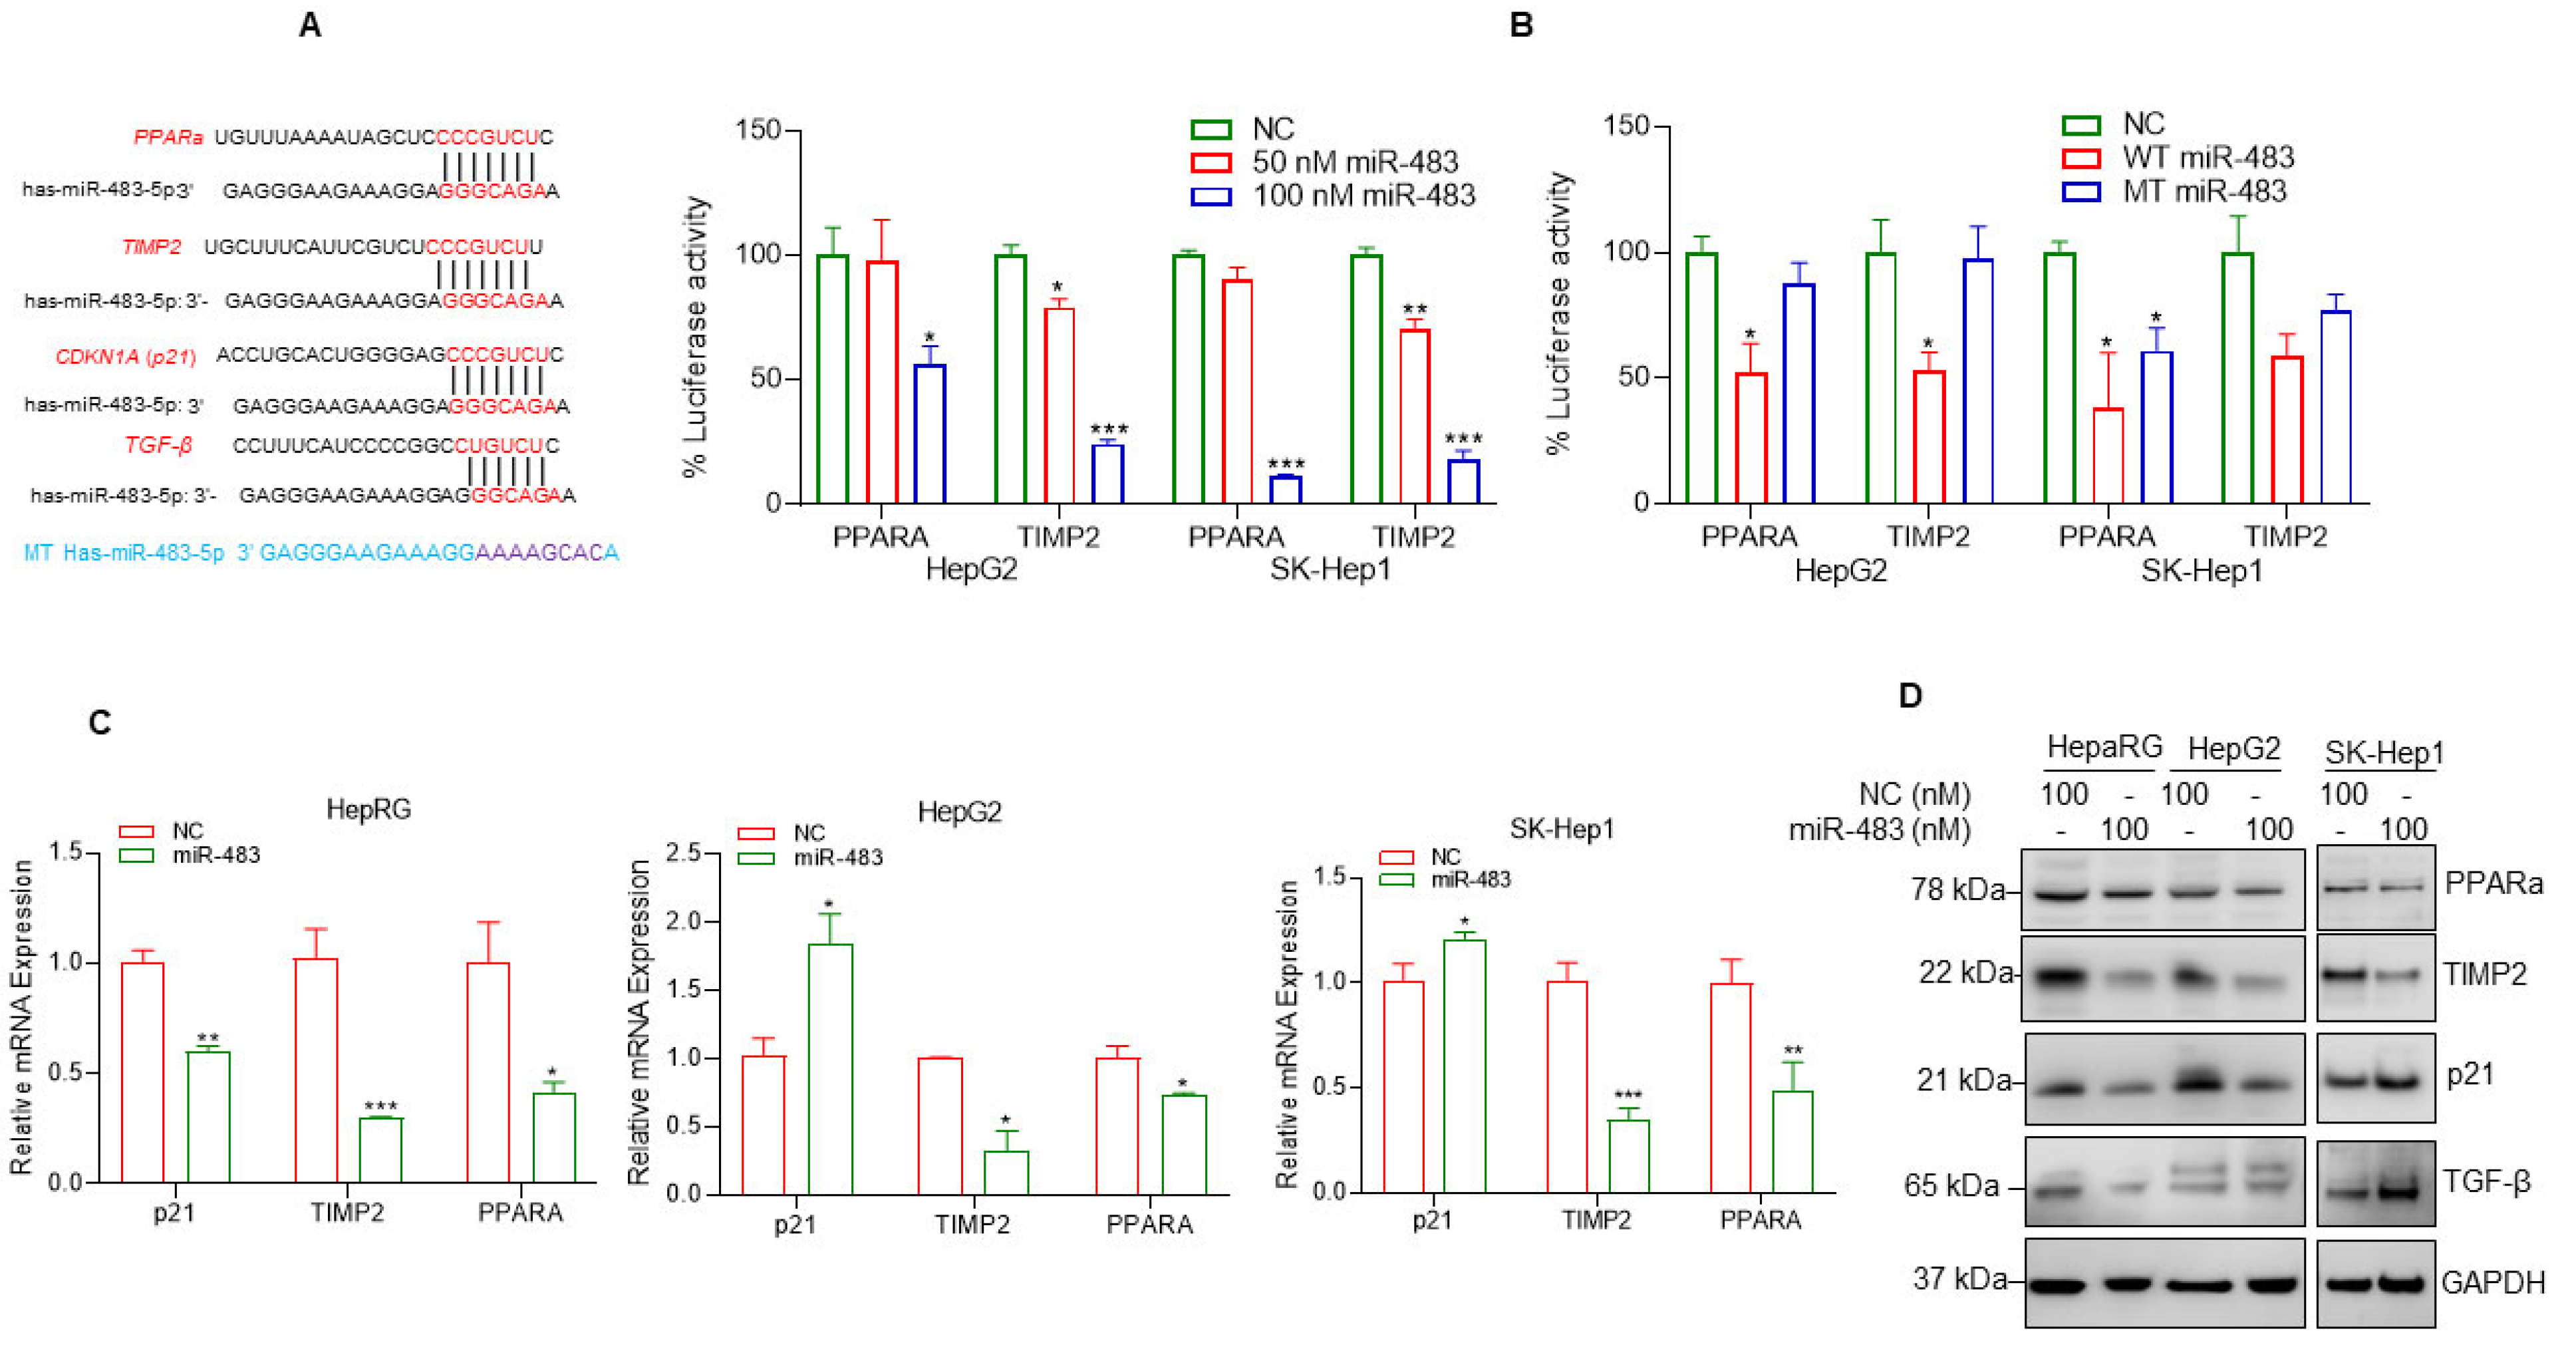
3.6. miR-483 Targets PPARa and TIMP2 and Inhibits Cell Steatosis and Fibrosis
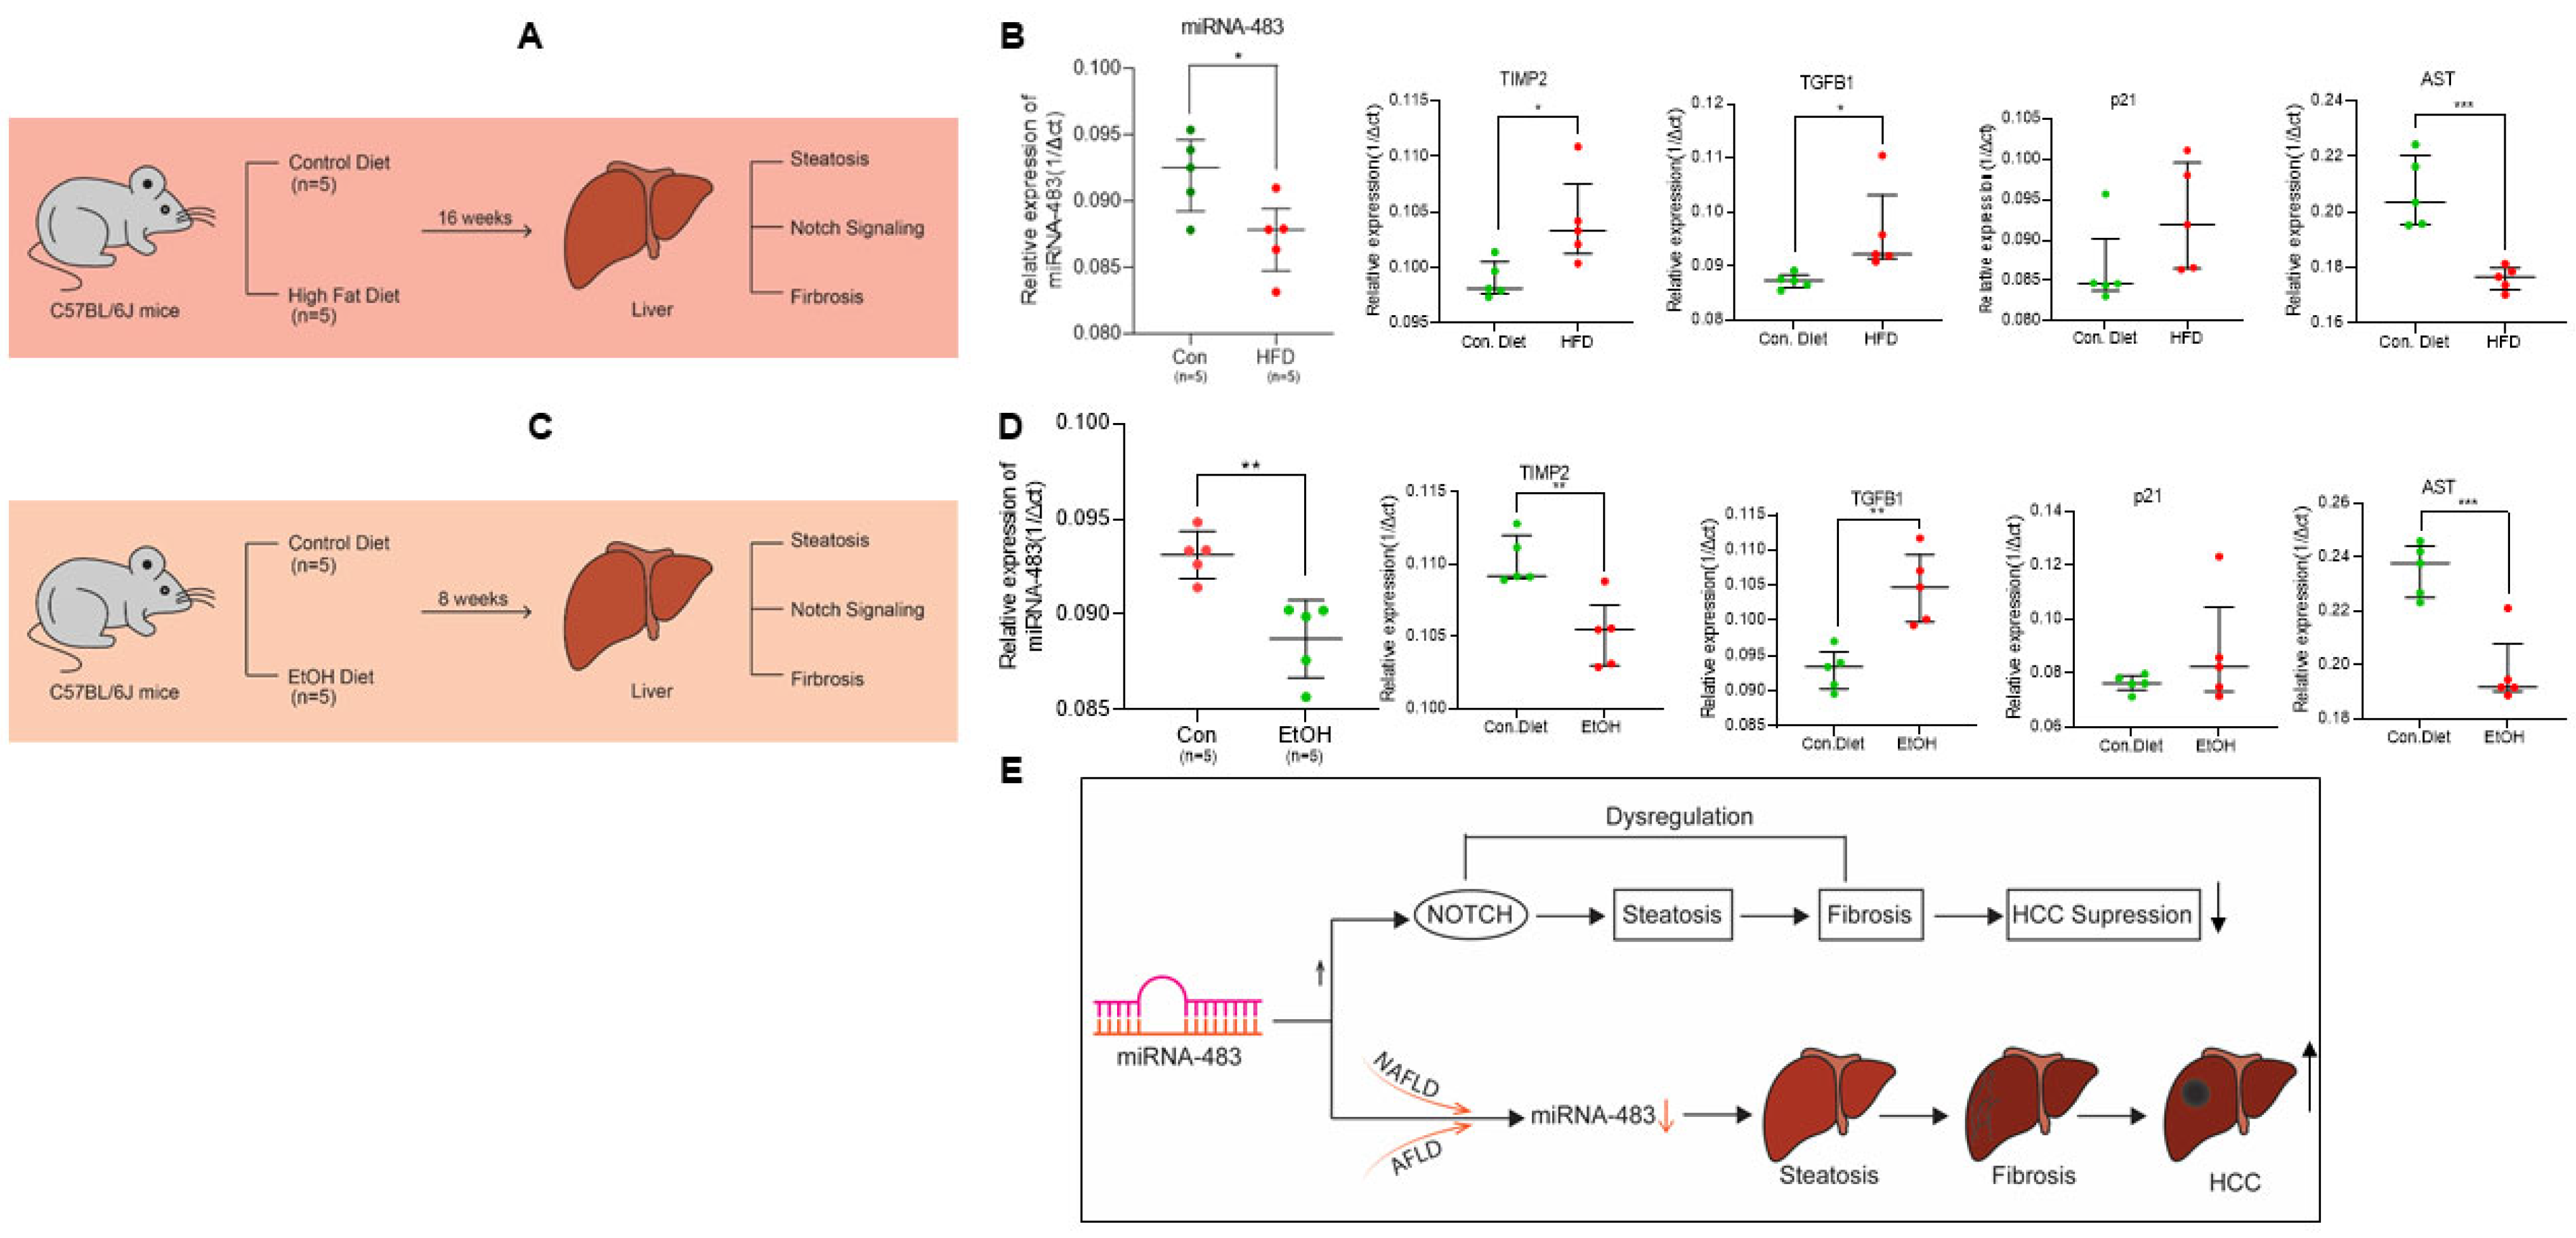
3.7. Downregulation of miR-483 Exacerbates NAFLD and AFLD in Mice Liver
4. Discussion
5. Conclusions
Supplementary Materials
Author Contributions
Funding
Institutional Review Board Statement
Informed Consent Statement
Data Availability Statement
Acknowledgments
Conflicts of Interest
References
- Marrero, J.A.; Kulik, L.M.; Sirlin, C.B.; Zhu, A.X.; Finn, R.S.; Abecassis, M.M.; Roberts, L.R.; Heimbach, J.K. Diagnosis, Staging, and Management of Hepatocellular Carcinoma: 2018 Practice Guidance by the American Association for the Study of Liver Diseases. Hepatology 2018, 68, 723–750. [Google Scholar] [CrossRef] [PubMed]
- Siegel, R.L.; Miller, K.D.; Fuchs, H.E.; Jemal, A. Cancer statistics, 2022. CA Cancer J. Clin. 2022, 72, 7–33. [Google Scholar] [CrossRef] [PubMed]
- Sanyal, A.J.; Yoon, S.K.; Lencioni, R. The etiology of hepatocellular carcinoma and consequences for treatment. Oncologist 2010, 15 (Suppl. S4), 14–22. [Google Scholar] [CrossRef]
- Balogh, J.; Victor, D., 3rd; Asham, E.H.; Burroughs, S.G.; Boktour, M.; Saharia, A.; Li, X.; Ghobrial, R.M.; Monsour, H.P., Jr. Hepatocellular carcinoma: A review. J. Hepatocell. Carcinoma 2016, 3, 41–53. [Google Scholar] [CrossRef] [PubMed]
- Friedman, S.L.; Neuschwander-Tetri, B.A.; Rinella, M.; Sanyal, A.J. Mechanisms of NAFLD development and therapeutic strategies. Nat. Med. 2018, 24, 908–922. [Google Scholar] [CrossRef] [PubMed]
- Wegermann, K.; Suzuki, A.; Mavis, A.M.; Abdelmalek, M.F.; Diehl, A.M.; Moylan, C.A. Tackling NAFLD: Three Targeted Populations. Hepatology 2021, 73, 1199–1206. [Google Scholar] [CrossRef] [PubMed]
- Paschos, P.; Paletas, K. Non alcoholic fatty liver disease and metabolic syndrome. Hippokratia 2009, 13, 9–19. [Google Scholar]
- Rinella, M.E. Nonalcoholic fatty liver disease: A systematic review. JAMA 2015, 313, 2263–2273. [Google Scholar] [CrossRef]
- White, D.L.; Kanwal, F.; El-Serag, H.B. Association between nonalcoholic fatty liver disease and risk for hepatocellular cancer, based on systematic review. Clin. Gastroenterol. Hepatol. 2012, 10, 1342–1359.e1342. [Google Scholar] [CrossRef]
- Michelotti, G.A.; Machado, M.V.; Diehl, A.M. NAFLD, NASH and liver cancer. Nat. Rev. Gastroenterol. Hepatol. 2013, 10, 656–665. [Google Scholar] [CrossRef]
- Cohen, J.C.; Horton, J.D.; Hobbs, H.H. Human Fatty Liver Disease: Old Questions and New Insights. Science 2011, 332, 1519–1523. [Google Scholar] [CrossRef] [PubMed]
- Dang, K.; Hirode, G.; Singal, A.; Sundaram, V.; Wong, R.J. Alcoholic Liver Disease Epidemiology in the United States: A Retrospective Analysis of 3 US Databases. Am. J. Gastroenterol. 2020, 115, 96–104. [Google Scholar] [CrossRef]
- Pai, R.K.; Kleiner, D.E.; Hart, J.; Adeyi, O.A.; Clouston, A.D.; Behling, C.A.; Jain, D.; Kakar, S.; Brahmania, M.; Burgart, L.; et al. Standardising the interpretation of liver biopsies in non-alcoholic fatty liver disease clinical trials. Aliment Pharmacol. Ther. 2019, 50, 1100–1111. [Google Scholar] [CrossRef] [PubMed]
- Takakura, K.; Oikawa, T.; Nakano, M.; Saeki, C.; Torisu, Y.; Kajihara, M.; Saruta, M. Recent Insights Into the Multiple Pathways Driving Non-alcoholic Steatohepatitis-Derived Hepatocellular Carcinoma. Front. Oncol. 2019, 9, 762. [Google Scholar] [CrossRef] [PubMed]
- Younossi, Z.M.; Koenig, A.B.; Abdelatif, D.; Fazel, Y.; Henry, L.; Wymer, M. Global epidemiology of nonalcoholic fatty liver disease-Meta-analytic assessment of prevalence, incidence, and outcomes. Hepatology 2016, 64, 73–84. [Google Scholar] [CrossRef]
- Neureiter, D.; Stintzing, S.; Kiesslich, T.; Ocker, M. Hepatocellular carcinoma: Therapeutic advances in signaling, epigenetic and immune targets. World J. Gastroenterol. 2019, 25, 3136–3150. [Google Scholar] [CrossRef]
- Wang, W.; Wei, C. Advances in the early diagnosis of hepatocellular carcinoma. Genes Dis. 2020, 7, 308–319. [Google Scholar] [CrossRef]
- Bartel, D.P. MicroRNAs: Genomics, biogenesis, mechanism, and function. Cell 2004, 116, 281–297. [Google Scholar] [CrossRef]
- Karp, X.; Ambros, V. Developmental biology. Encountering microRNAs in cell fate signaling. Science 2005, 310, 1288–1289. [Google Scholar] [CrossRef]
- Cheng, A.M.; Byrom, M.W.; Shelton, J.; Ford, L.P. Antisense inhibition of human miRNAs and indications for an involvement of miRNA in cell growth and apoptosis. Nucleic Acids Res. 2005, 33, 1290–1297. [Google Scholar] [CrossRef]
- Lu, S.; Sun, Y.H.; Shi, R.; Clark, C.; Li, L.; Chiang, V.L. Novel and mechanical stress-responsive MicroRNAs in Populus trichocarpa that are absent from Arabidopsis. Plant Cell 2005, 17, 2186–2203. [Google Scholar] [CrossRef] [PubMed]
- Murray, M.J.; Huddart, R.A.; Coleman, N. The present and future of serum diagnostic tests for testicular germ cell tumours. Nat. Rev. Urol. 2016, 13, 715–725. [Google Scholar] [CrossRef] [PubMed]
- Shen, S.; Lin, Y.; Yuan, X.; Shen, L.; Chen, J.; Chen, L.; Qin, L.; Shen, B. Biomarker MicroRNAs for Diagnosis, Prognosis and Treatment of Hepatocellular Carcinoma: A Functional Survey and Comparison. Sci. Rep. 2016, 6, 38311. [Google Scholar] [CrossRef] [PubMed]
- Sierzega, M.; Kaczor, M.; Kolodziejczyk, P.; Kulig, J.; Sanak, M.; Richter, P. Evaluation of serum microRNA biomarkers for gastric cancer based on blood and tissue pools profiling: The importance of miR-21 and miR-331. Br. J. Cancer 2017, 117, 266–273. [Google Scholar] [CrossRef] [PubMed]
- Niture, S.; Tricoli, L.; Qi, Q.; Gadi, S.; Hayes, K.; Kumar, D. MicroRNA-99b-5p targets mTOR/AR axis, induces autophagy and inhibits prostate cancer cell proliferation. Tumour. Biol. 2022, 44, 107–126. [Google Scholar] [CrossRef] [PubMed]
- Rios-Colon, L.; Chijioke, J.; Niture, S.; Afzal, Z.; Qi, Q.; Srivastava, A.; Ramalinga, M.; Kedir, H.; Cagle, P.; Arthur, E.; et al. Leptin modulated microRNA-628-5p targets Jagged-1 and inhibits prostate cancer hallmarks. Sci. Rep. 2022, 12, 10073. [Google Scholar] [CrossRef]
- An, Y.; Gao, S.; Zhao, W.C.; Qiu, B.A.; Xia, N.X.; Zhang, P.J.; Fan, Z.P. Novel serum microRNAs panel on the diagnostic and prognostic implications of hepatocellular carcinoma. World J. Gastroenterol. 2018, 24, 2596–2604. [Google Scholar] [CrossRef]
- Peng, Y.; Croce, C.M. The role of MicroRNAs in human cancer. Signal Transduct. Target. Ther. 2016, 1, 15004. [Google Scholar] [CrossRef]
- Veronese, A.; Lupini, L.; Consiglio, J.; Visone, R.; Ferracin, M.; Fornari, F.; Zanesi, N.; Alder, H.; D’Elia, G.; Gramantieri, L.; et al. Oncogenic role of miR-483-3p at the IGF2/483 locus. Cancer Res. 2010, 70, 3140–3149. [Google Scholar] [CrossRef]
- Olson, P.; Lu, J.; Zhang, H.; Shai, A.; Chun, M.G.; Wang, Y.; Libutti, S.K.; Nakakura, E.K.; Golub, T.R.; Hanahan, D. MicroRNA dynamics in the stages of tumorigenesis correlate with hallmark capabilities of cancer. Genes Dev. 2009, 23, 2152–2165. [Google Scholar] [CrossRef]
- Soon, P.S.; Tacon, L.J.; Gill, A.J.; Bambach, C.P.; Sywak, M.S.; Campbell, P.R.; Yeh, M.W.; Wong, S.G.; Clifton-Bligh, R.J.; Robinson, B.G.; et al. miR-195 and miR-483-5p Identified as Predictors of Poor Prognosis in Adrenocortical Cancer. Clin. Cancer Res. 2009, 15, 7684–7692. [Google Scholar] [CrossRef] [PubMed]
- Ma, N.; Li, F.; Li, D.; Hui, Y.; Wang, X.; Qiao, Y.; Zhang, Y.; Xiang, Y.; Zhou, J.; Zhou, L.; et al. Igf2-derived intronic miR-483 promotes mouse hepatocellular carcinoma cell proliferation. Mol. Cell. Biochem. 2012, 361, 337–343. [Google Scholar] [CrossRef]
- Tian, T.; Lv, X.; Pan, G.; Lu, Y.; Chen, W.; He, W.; Lei, X.; Zhang, H.; Liu, M.; Sun, S.; et al. Long Noncoding RNA MPRL Promotes Mitochondrial Fission and Cisplatin Chemosensitivity via Disruption of Pre-miRNA Processing. Clin. Cancer Res. 2019, 25, 3673–3688. [Google Scholar] [CrossRef] [PubMed]
- Dong, J.; He, M.; Li, J.; Pessentheiner, A.; Wang, C.; Zhang, J.; Sun, Y.; Wang, W.T.; Zhang, Y.; Liu, J.; et al. microRNA-483 ameliorates hypercholesterolemia by inhibiting PCSK9 production. JCI Insight 2020, 5, e143812. [Google Scholar] [CrossRef] [PubMed]
- Li, F.; Ma, N.; Zhao, R.; Wu, G.; Zhang, Y.; Qiao, Y.; Han, D.; Xu, Y.; Xiang, Y.; Yan, B.; et al. Overexpression of miR-483-5p/3p cooperate to inhibit mouse liver fibrosis by suppressing the TGF-beta stimulated HSCs in transgenic mice. J. Cell Mol. Med. 2014, 18, 966–974. [Google Scholar] [CrossRef]
- Varghese, R.S.; Zhou, Y.; Barefoot, M.; Chen, Y.; Di Poto, C.; Balla, A.K.; Oliver, E.; Sherif, Z.A.; Kumar, D.; Kroemer, A.H.; et al. Identification of miRNA-mRNA associations in hepatocellular carcinoma using hierarchical integrative model. BMC Med. Genom. 2020, 13, 56. [Google Scholar] [CrossRef]
- Varghese, R.S.; Barefoot, M.E.; Jain, S.; Chen, Y.; Zhang, Y.; Alley, A.; Kroemer, A.H.; Tadesse, M.G.; Kumar, D.; Sherif, Z.A.; et al. Integrative Analysis of DNA Methylation and microRNA Expression Reveals Mechanisms of Racial Heterogeneity in Hepatocellular Carcinoma. Front. Genet. 2021, 12, 708326. [Google Scholar] [CrossRef]
- Marion, M.J.; Hantz, O.; Durantel, D. The HepaRG cell line: Biological properties and relevance as a tool for cell biology, drug metabolism, and virology studies. Methods Mol. Biol. 2010, 640, 261–272. [Google Scholar] [CrossRef] [PubMed]
- Niture, S.; Lin, M.; Odera, J.O.; Moore, J.; Zhe, H.; Chen, X.; Suy, S.; Collins, S.P.; Kumar, D. TNFAIP8 drives metabolic reprogramming to promote prostate cancer cell proliferation. Int. J. Biochem. Cell Biol. 2021, 130, 105885. [Google Scholar] [CrossRef]
- Cagle, P.; Niture, S.; Srivastava, A.; Ramalinga, M.; Aqeel, R.; Rios-Colon, L.; Chimeh, U.; Suy, S.; Collins, S.P.; Dahiya, R.; et al. MicroRNA-214 targets PTK6 to inhibit tumorigenic potential and increase drug sensitivity of prostate cancer cells. Sci. Rep. 2019, 9, 9776. [Google Scholar] [CrossRef]
- Choi, S.; Neequaye, P.; French, S.W.; Gonzalez, F.J.; Gyamfi, M.A. Pregnane X receptor promotes ethanol-induced hepatosteatosis in mice. J. Biol. Chem. 2018, 293, 1–17. [Google Scholar] [CrossRef] [PubMed]
- Niture, S.; Gyamfi, M.A.; Lin, M.; Chimeh, U.; Dong, X.; Zheng, W.; Moore, J.; Kumar, D. TNFAIP8 regulates autophagy, cell steatosis, and promotes hepatocellular carcinoma cell proliferation. Cell Death Dis. 2020, 11, 178. [Google Scholar] [CrossRef]
- Hu, L.; Xue, F.; Shao, M.; Deng, A.; Wei, G. Aberrant expression of Notch3 predicts poor survival for hepatocellular carcinomas. Biosci. Trends 2013, 7, 152–156. [Google Scholar] [PubMed]
- Gramantieri, L.; Giovannini, C.; Lanzi, A.; Chieco, P.; Ravaioli, M.; Venturi, A.; Grazi, G.L.; Bolondi, L. Aberrant Notch3 and Notch4 expression in human hepatocellular carcinoma. Liver Int. 2007, 27, 997–1007. [Google Scholar] [CrossRef] [PubMed]
- Huang, Q.; Li, J.; Zheng, J.; Wei, A. The Carcinogenic Role of the Notch Signaling Pathway in the Development of Hepatocellular Carcinoma. J. Cancer 2019, 10, 1570–1579. [Google Scholar] [CrossRef]
- Zhang, Y.; Li, D.; Feng, F.; An, L.; Hui, F.; Dang, D.; Zhao, Q. Progressive and Prognosis Value of Notch Receptors and Ligands in Hepatocellular Carcinoma: A Systematic Review and Meta-analysis. Sci. Rep. 2017, 7, 14809. [Google Scholar] [CrossRef]
- Ribatti, D.; Tamma, R.; Annese, T. Epithelial-Mesenchymal Transition in Cancer: A Historical Overview. Transl. Oncol. 2020, 13, 100773. [Google Scholar] [CrossRef]
- Van Zijl, F.; Zulehner, G.; Petz, M.; Schneller, D.; Kornauth, C.; Hau, M.; Machat, G.; Grubinger, M.; Huber, H.; Mikulits, W. Epithelial-mesenchymal transition in hepatocellular carcinoma. Future Oncol. 2009, 5, 1169–1179. [Google Scholar] [CrossRef]
- Pinyopornpanish, K.; Khoudari, G.; Saleh, M.A.; Angkurawaranon, C.; Pinyopornpanish, K.; Mansoor, E.; Dasarathy, S.; McCullough, A. Hepatocellular carcinoma in nonalcoholic fatty liver disease with or without cirrhosis: A population-based study. BMC Gastroenterol. 2021, 21, 394. [Google Scholar] [CrossRef]
- Singh, R.; Kaushik, S.; Wang, Y.; Xiang, Y.; Novak, I.; Komatsu, M.; Tanaka, K.; Cuervo, A.M.; Czaja, M.J. Autophagy regulates lipid metabolism. Nature 2009, 458, 1131–1135. [Google Scholar] [CrossRef]
- Zhang, J.; He, Y.; Yan, X.; Chen, S.; He, M.; Lei, Y.; Zhang, J.; Gongol, B.; Gu, M.; Miao, Y.; et al. MicroRNA-483 amelioration of experimental pulmonary hypertension. EMBO Mol. Med. 2020, 12, e11303. [Google Scholar] [CrossRef] [PubMed]
- Liss, K.H.; Finck, B.N. PPARs and nonalcoholic fatty liver disease. Biochimie 2017, 136, 65–74. [Google Scholar] [CrossRef] [PubMed]
- Wang, Y.; Nakajima, T.; Gonzalez, F.J.; Tanaka, N. PPARs as Metabolic Regulators in the Liver: Lessons from Liver-Specific PPAR-Null Mice. Int. J. Mol. Sci. 2020, 21, 2061. [Google Scholar] [CrossRef] [PubMed]
- Condrat, C.E.; Thompson, D.C.; Barbu, M.G.; Bugnar, O.L.; Boboc, A.; Cretoiu, D.; Suciu, N.; Cretoiu, S.M.; Voinea, S.C. miRNAs as Biomarkers in Disease: Latest Findings Regarding Their Role in Diagnosis and Prognosis. Cells 2020, 9, 276. [Google Scholar] [CrossRef]
- Wei, Y.; Zhang, Q.; An, L.; Fang, G.; Hong, D.; Jiao, T.; Yang, H.; Wang, Z. Serum exosomal microRNA-370-3p and microRNA-196a-5p are potential biomarkers for the diagnosis and prognosis of hepatocellular carcinoma. Folia Histochem. Cytobiol. 2022, 60, 215–225. [Google Scholar] [CrossRef] [PubMed]
- Fang, Y.; Yan, D.; Wang, L.; Zhang, J.; He, Q. Circulating microRNAs (miR-16, miR-22, miR-122) expression and early diagnosis of hepatocellular carcinoma. J. Clin. Lab. Anal. 2022, 36, e24541. [Google Scholar] [CrossRef] [PubMed]
- Khairy, A.; Ibrahim, M.K.; AbdElrahman, M.; Fouad, R.; Zayed, N.; Ayman, Y.; Abdellatef, Z.; Yosry, A. The diagnostic utility of microRNA 222-3p, microRNA 21-5p, and microRNA 122-5p for HCV-related hepatocellular carcinoma and its relation to direct-acting antiviral therapy. Arab. J. Gastroenterol. 2022, 23, 108–114. [Google Scholar] [CrossRef] [PubMed]
- Villanueva, A.; Alsinet, C.; Yanger, K.; Hoshida, Y.; Zong, Y.; Toffanin, S.; Rodriguez-Carunchio, L.; Sole, M.; Thung, S.; Stanger, B.Z.; et al. Notch signaling is activated in human hepatocellular carcinoma and induces tumor formation in mice. Gastroenterology 2012, 143, 1660–1669.e1667. [Google Scholar] [CrossRef]
- Fu, Z.W.; Wang, L.; Li, S.J.; Chen, F.; Au-Yeung, K.K.W.; Shi, C. MicroRNA as an Important Target for Anticancer Drug Development. Front. Pharmacol. 2021, 12, 736323. [Google Scholar] [CrossRef]
- Yahya, S.M.M.; Fathy, S.A.; El-Khayat, Z.A.; El-Toukhy, S.E.; Hamed, A.R.; Hegazy, M.G.A.; Nabih, H.K. Possible Role of microRNA-122 in Modulating Multidrug Resistance of Hepatocellular Carcinoma. Indian J. Clin. Biochem. 2018, 33, 21–30. [Google Scholar] [CrossRef]
- Shi, L.; Chen, Z.G.; Wu, L.L.; Zheng, J.J.; Yang, J.R.; Chen, X.F.; Chen, Z.Q.; Liu, C.L.; Chi, S.Y.; Zheng, J.Y.; et al. miR-340 reverses cisplatin resistance of hepatocellular carcinoma cell lines by targeting Nrf2-dependent antioxidant pathway. Asian Pac. J. Cancer Prev. 2014, 15, 10439–10444. [Google Scholar] [CrossRef] [PubMed]
- López-Riera, M.; Conde, I.; Quintas, G.; Pedrola, L.; Zaragoza, Á.; Perez-Rojas, J.; Salcedo, M.; Benlloch, S.; Castell, J.V.; Jover, R. Non-invasive prediction of NAFLD severity: A comprehensive, independent validation of previously postulated serum microRNA biomarkers. Sci. Rep. 2018, 8, 10606. [Google Scholar] [CrossRef] [PubMed]
- Xiang, Y.; Mao, L.; Zuo, M.-L.; Song, G.-L.; Tan, L.-M.; Yang, Z.-B. The Role of MicroRNAs in Hyperlipidemia: From Pathogenesis to Therapeutical Application. Mediat. Inflamm. 2022, 2022, 3101900. [Google Scholar] [CrossRef] [PubMed]
- Naeli, P.; Mirzadeh Azad, F.; Malakootian, M.; Seidah, N.G.; Mowla, S.J. Post-transcriptional Regulation of PCSK9 by miR-191, miR-222, and miR-224. Front. Genet. 2017, 8, 189. [Google Scholar] [CrossRef] [PubMed]
- Xu, X.; Dong, Y.; Ma, N.; Kong, W.; Yu, C.; Gong, L.; Chen, J.; Ren, J. MiR-337-3p lowers serum LDL-C level through targeting PCSK9 in hyperlipidemic mice. Metabolism 2021, 119, 154768. [Google Scholar] [CrossRef] [PubMed]
- Yorimitsu, T.; Klionsky, D.J. Autophagy: Molecular machinery for self-eating. Cell Death Differ. 2005, 12 (Suppl. S2), 1542–1552. [Google Scholar] [CrossRef] [PubMed]
- Wang, Y.; Liu, Z.; Zou, W.; Hong, H.; Fang, H.; Tong, W. Molecular regulation of miRNAs and potential biomarkers in the progression of hepatic steatosis to NASH. Biomark. Med. 2015, 9, 1189–1200. [Google Scholar] [CrossRef]
- Leti, F.; Malenica, I.; Doshi, M.; Courtright, A.; Van Keuren-Jensen, K.; Legendre, C.; Still, C.D.; Gerhard, G.S.; DiStefano, J.K. High-throughput sequencing reveals altered expression of hepatic microRNAs in nonalcoholic fatty liver disease-related fibrosis. Transl. Res. 2015, 166, 304–314. [Google Scholar] [CrossRef]
- Fang, Z.; Dou, G.; Wang, L. MicroRNAs in the Pathogenesis of Nonalcoholic Fatty Liver Disease. Int. J. Biol. Sci. 2021, 17, 1851–1863. [Google Scholar] [CrossRef]
- Murakami, Y.; Toyoda, H.; Tanaka, M.; Kuroda, M.; Harada, Y.; Matsuda, F.; Tajima, A.; Kosaka, N.; Ochiya, T.; Shimotohno, K. The progression of liver fibrosis is related with overexpression of the miR-199 and 200 families. PLoS ONE 2011, 6, e16081. [Google Scholar] [CrossRef]
- Hou, J.; Lin, L.; Zhou, W.; Wang, Z.; Ding, G.; Dong, Q.; Qin, L.; Wu, X.; Zheng, Y.; Yang, Y.; et al. Identification of miRNomes in human liver and hepatocellular carcinoma reveals miR-199a/b-3p as therapeutic target for hepatocellular carcinoma. Cancer Cell 2011, 19, 232–243. [Google Scholar] [CrossRef] [PubMed]
- Cabral, B.C.A.; Hoffmann, L.; Bottaro, T.; Costa, P.F.; Ramos, A.L.A.; Coelho, H.S.M.; Villela-Nogueira, C.A.; Urmenyi, T.P.; Faffe, D.S.; Silva, R. Circulating microRNAs associated with liver fibrosis in chronic hepatitis C patients. Biochem. Biophys. Rep. 2020, 24, 100814. [Google Scholar] [CrossRef] [PubMed]
- Gervois, P.; Torra, I.P.; Fruchart, J.C.; Staels, B. Regulation of lipid and lipoprotein metabolism by PPAR activators. Clin. Chem. Lab. Med. 2000, 38, 3–11. [Google Scholar] [CrossRef] [PubMed]
- Ferland-McCollough, D.; Fernandez-Twinn, D.S.; Cannell, I.G.; David, H.; Warner, M.; Vaag, A.A.; Bork-Jensen, J.; Brons, C.; Gant, T.W.; Willis, A.E.; et al. Programming of adipose tissue miR-483-3p and GDF-3 expression by maternal diet in type 2 diabetes. Cell Death Differ. 2012, 19, 1003–1012. [Google Scholar] [CrossRef]
- Wang, H.; Zhang, H.; Sun, Q.; Wang, Y.; Yang, J.; Yang, J.; Zhang, T.; Luo, S.; Wang, L.; Jiang, Y.; et al. Intra-articular Delivery of Antago-miR-483-5p Inhibits Osteoarthritis by Modulating Matrilin 3 and Tissue Inhibitor of Metalloproteinase 2. Mol. Ther. 2017, 25, 715–727. [Google Scholar] [CrossRef]
- Gu, J.; Wang, M.; Wang, X.; Li, J.; Liu, H.; Lin, Z.; Yang, X.; Zhang, X.; Liu, H. Exosomal miR-483-5p in Bone Marrow Mesenchymal Stem Cells Promotes Malignant Progression of Multiple Myeloma by Targeting TIMP2. Front. Cell Dev. Biol. 2022, 10, 862524. [Google Scholar] [CrossRef]


Disclaimer/Publisher’s Note: The statements, opinions and data contained in all publications are solely those of the individual author(s) and contributor(s) and not of MDPI and/or the editor(s). MDPI and/or the editor(s) disclaim responsibility for any injury to people or property resulting from any ideas, methods, instructions or products referred to in the content. |
© 2023 by the authors. Licensee MDPI, Basel, Switzerland. This article is an open access article distributed under the terms and conditions of the Creative Commons Attribution (CC BY) license (https://creativecommons.org/licenses/by/4.0/).
Share and Cite
Niture, S.; Gadi, S.; Qi, Q.; Gyamfi, M.A.; Varghese, R.S.; Rios-Colon, L.; Chimeh, U.; Vandana; Ressom, H.W.; Kumar, D. MicroRNA-483-5p Inhibits Hepatocellular Carcinoma Cell Proliferation, Cell Steatosis, and Fibrosis by Targeting PPARα and TIMP2. Cancers 2023, 15, 1715. https://doi.org/10.3390/cancers15061715
Niture S, Gadi S, Qi Q, Gyamfi MA, Varghese RS, Rios-Colon L, Chimeh U, Vandana, Ressom HW, Kumar D. MicroRNA-483-5p Inhibits Hepatocellular Carcinoma Cell Proliferation, Cell Steatosis, and Fibrosis by Targeting PPARα and TIMP2. Cancers. 2023; 15(6):1715. https://doi.org/10.3390/cancers15061715
Chicago/Turabian StyleNiture, Suryakant, Sashi Gadi, Qi Qi, Maxwell Afari Gyamfi, Rency S. Varghese, Leslimar Rios-Colon, Uchechukwu Chimeh, Vandana, Habtom W. Ressom, and Deepak Kumar. 2023. "MicroRNA-483-5p Inhibits Hepatocellular Carcinoma Cell Proliferation, Cell Steatosis, and Fibrosis by Targeting PPARα and TIMP2" Cancers 15, no. 6: 1715. https://doi.org/10.3390/cancers15061715
APA StyleNiture, S., Gadi, S., Qi, Q., Gyamfi, M. A., Varghese, R. S., Rios-Colon, L., Chimeh, U., Vandana, Ressom, H. W., & Kumar, D. (2023). MicroRNA-483-5p Inhibits Hepatocellular Carcinoma Cell Proliferation, Cell Steatosis, and Fibrosis by Targeting PPARα and TIMP2. Cancers, 15(6), 1715. https://doi.org/10.3390/cancers15061715