Article

Body Composition in Patients with Follicular Lymphoma: Asso-Ciations between Changes in Radiomic Parameters in Patients Treated with R-CHOP-like and R-B Regimens: LyRa 01F

by
Fabiana Esposito
1,*,
Maria Rosaria Pascale
1,
Cristiano Tesei
1,
Paola Elda Gigliotti
2,
Alessandra Luciano
2,
Cecilia Angeloni
2,
Massimiliano Marinoni
1,
Federico Meconi
1,3,
Roberto Secchi
1,
Alberto Patanè
2,
Massimiliano Postorino
1,3,
Maria Cantonetti
1,† and
Guglielmo Manenti
2,4,†
1
Hematology, Department of Biomedicine and Prevention, University Tor Vergata, 00133 Rome, Italy
2
Department of Diagnostic Imaging and Interventional Radiology, University of Rome Tor Vergata, 00133 Rome, Italy
3
Hematolofy, Fondazione Policlinico Tor Vergata, 00133 Rome, Italy
4
Department of Biomedicine and Prevention, University of Rome Tor Vergata, 00133 Rome, Italy
*
Author to whom correspondence should be addressed.
These authors contributed equally to this work.
Cancers 2023, 15(4), 999; https://doi.org/10.3390/cancers15040999
Submission received: 12 January 2023 / Revised: 25 January 2023 / Accepted: 29 January 2023 / Published: 4 February 2023

Abstract

:

Simple Summary

In this study, we assessed changes in bone mineral density at disease onset and at the end of therapy in follicular lymphoma patients treated with R-CHOP and R-Bendamustine regimens. Another aim was to assess whether low bone mineral density at the onset of the disease is an unfavorable prognostic index. We also evaluated changes in other radiomic parameters, such as the musculoskeletal index, visceral adipose tissue, and subcutaneous adipose tissue in patients treated with R-Bendamustine and R-CHOP, with the latter containing high doses of steroids, which we know are associated with negative bone balance, a loss of muscle mass, and metabolic and cardiovascular issues. This is particularly relevant in elderly patients, in whom these changes could have an important impact on outcomes and the quality of life. As R-CHOP and R-Bendamustine are two effective treatment regimens in follicular lymphoma, this study, together with other clinical-laboratory parameters, could help in the choice of therapy.

Abstract

In patients with follicular lymphoma (FL), therapeutic advances have led to improved survival, and within this framework, it is important to identify treatment strategies offering a better quality of life. Using (18)F-fluorodeoxyglucose positron emission tomography/computed tomography (PET/CT), in patients treated with R-CHOP-like or R-Bendamustine regimens, we assessed changes in the bone mineral density (BMD), musculoskeletal index (SMI), visceral adipose tissue (VAT), and subcutaneous adipose tissue (SAT) at disease onset and at the end of therapy. We evaluated whether the high-steroid regimen could lead to more significant radiological changes than those induced by the steroid-free regimen and whether a low BMD at disease onset is an unfavorable prognostic index. Seventy-nine patients between 60 and 80 years old with a new diagnosis of FL were included in the study. Evaluation of Delta values (pre- and post-therapy mean values) in the two immunochemotherapy regimens showed differences in radiomic parameters within the two patient cohorts. The R-CHOP-like regimen was associated with a significant reduction in BMD, an increase in SAT and VAT, and a reduction in skeletal muscle density (SMD) and SMI. Moreover, patients with high FLIPI showed a BMD below the cut-off value. This study represents the first study demonstrating a prognostic correlation between FLIPI and low BMD.

1. Introduction

Follicular Lymphoma (FL) is the most common indolent lymphoproliferative disorder [1] and the second most frequent histological subtype among Non-Hodgkin’s Lymphomas (NHLs) after Large B-cell Lymphoma (DLBCL) in Western Europe [2,3].
This subtype is phenotypically, genetically, and clinically heterogeneous, and its course varies from an indolent type of lymphoma, requiring only “watch and wait”, to a more aggressive one, requiring first-line systemic immunochemotherapy treatment [3].
The 2016 WHO classification uses a 1–3 grading system based on the increase in the number of centroblasts counted per high-power field (hpf). FL grade I has 0 to 5 centroblasts per hpf, FL grade 2 has 6 to 15 centroblasts/hpf, and FL grade 3 has more than 15 centroblasts/hpf. Grade 3 has been divided into grade 3A, in which centrocytes are present, and grade 3B, which has only centroblasts. Grade 3B is clinically and biologically more similar to diffuse large B-cell lymphoma and is treated as such [2,4]. Recently, the fifth edition of the WHO introduced a significant revision of FL, making a distinction between the classical form (cFL) and follicular large B-cell lymphoma (FLBL), with a close and biological relationship with DLBCL and FL with uncommon features (uFL), which comprises two subsets: One with a cytological variant ’blastoid’ or ’large centrocyte’ and the other with a predominantly diffuse variant [5].
For prognostic purposes, the Follicular Lymphoma International Prognostic Index (FLIPI) is the most widely used score in FL and uses simple clinical parameters, such as age, Ann Arbor stage, hemoglobin value, Lactic Dehydrogenase (LDH), and the number of lymph nodes involved [6].
In patients requiring treatment, two other scores such as FLIPI2 and FIRST FLIPI have been suggested. More recently, a genetic risk score (m7FLIPI) has been added in combination with the FLIPI score, which considers seven candidate genes [7]. However, none of these indices guide the choice of therapy in common clinical practice.
In patients with advanced FL who require treatment and in whom complete remission (CR) and long progression-free survival (PFS) are sought, rituximab in combination with anthracycline-based chemotherapy treatments (R-CHOP-like) such as cyclophosphamide doxorubicin, vincristine, and prednisone (CHOP), or R-COMP (rituximab-cyclophosphamide-liposomal doxorubicin-vincristine-prednisone), or the combination of rituximab with bendamustine(R-B), should be used as first-line treatments [8,9,10].
In patients with grade 3B follicular lymphomas, or if there are clinical signs of transformation, it is preferable to use immunochemotherapy regimens containing anthracyclines (R-CHOP-like) [3].
Several studies have compared the two regimens, and no superiority in terms of therapeutic effect has been found between R-CHOP and R-B [10], and thus, often, in clinical practice, the choice of treatment is based on clinical parameters at the onset of the disease, such as the patient’s age and fitness, the presence of cardiological comorbidities (cardiotoxic effect of anthracyclines), or the refusal of treatment that may cause alopecia
18FDG PET/CT is the current standard for staging and assessing therapeutic response in FL [11].
The images obtained from CT scans performed during PET/CT can be used to assess BMD by placing a region of interest (ROI) on the vertebral body of the first lumbar vertebra (L1) and referring to standardized values to define osteopenia and osteoporosis, based on gender and age [12]. In a CT scan, skeletal muscle density (SMD), as a measure of attenuation, represents the degree of lipid deposition in skeletal muscle and can be a surrogate for muscle quality. Furthermore, advanced software allows the extraction of quantitative measures of the skeletal muscle area (SMA), subcutaneous adipose tissue (SAT), and visceral adipose tissue (VAT), even retrospectively [13,14]. From these values and when knowing the patient’s height, the skeletal muscle index (SMI) can be calculated as SMA divided by the square of their height. Due to the significant variation in body composition between males and females, sex (gender)-specific cut-offs of the skeletal muscle index for non-obese men and women have been proposed, based on the body mass index (BMI) category and gender [14].
Currently, most of the radiomic studies that have investigated PET/CT as a tool for personalizing treatment and as a predictor of progression-free survival (PFS) and overall survival (OS) have been developed primarily for DLBCL [15,16,17,18,19].
Several studies have shown an increased loss of bone mass and increased risk of fractures in patients treated for NHL with high doses of corticosteroids [20,21,22,23,24].
The main endpoint of this experimental study is to evaluate changes in the body composition in FL patients in PET/CT at the end of the two different immunochemotherapies because, in the future, these parameters could help us in the therapy choice and assess a possible prognostic value of radiomic parameters at disease onset.

2. Materials and Methods

2.1. Study Population

The study population was retrospectively selected from a database of patients with FL, referred to our Institute between January 2011 and May 2019, with a post-treatment follow-up of at least 30 months. The sample included 79 patients with newly diagnosed FL grades 1–3A according to the 2016 WHO classification, treated with first-line chemotherapy regimens R-CHOP-like or R-B. Patients who relapsed within 30 months were also included in the analysis.
Patient inclusion criteria included an age range of 60–80 years, a baseline 18FDG PET/CT scan suitable for radiomic analysis performed at the Department of Diagnostic Imaging Radiology of the Policlinico Tor Vergata, first-line treatment with six cycles R-CHOP: Rituximab 375 mg/m2, Cyclophosphamide 750 mg/m2, Doxorubicin 50 mg/m2 (liposomal Doxorubicin 50 mg/m2 in R-COMP), Vincristine 1.4 mg/m2(for a maximum of 2 mg total dose) on day 1 and Prednisone 100 mg for 5 days every 21 days) or six cycles of R-B: Rituximab 375 mg/m2 on day 1 and Bendamustine 90 mg/m2 on days 1 and 2 of the cycle every 28 days.
In order to ensure the population was homogeneous, patients diagnosed with FL grade 3B, patients who had not undergone baseline or reassessment 18FDG PET/CT after immunochemotherapy at our Institute, and patients for whom it was impossible to access the images or examine the radiomic parameters considered were excluded. Table 1 summarizes the characteristics of the evaluated patients.
The database included 150 patients with FL in the 60–80 age range, and 71 were excluded because they did not fulfil the inclusion criteria. Early-stage patients who had performed only locoregional radiotherapy or for whom treatment criteria were not matched were excluded from our study. Patients who had performed immunochemotherapy treatments other than the R-CHOP or R-B regimen were also excluded.
For each patient, PET/CT was performed at the beginning of immunochemotherapy treatment and one month after its completion. For each patient, we considered descriptive parameters such as age and sex and clinical criteria such as the date of diagnosis, histology, Ann Arbor stage, performance status according to the ECOG scale, weight, and height; from these we calculated FLIPI, response to the end of therapy, the date of progression (if present), and the date of last contact or death. Finally, from the radiomic parameters we calculated and measured BMD, SMI, VAT, SAT, SMD, and SMA at onset and after chemoimmunotherapy treatment.

2.2. Radiomics Parameters

Quantitative measurements of BMD were taken from CT images at the level of the 1st lumbar vertebra. The body composition profile was performed at the level of the 3rd lumbar vertebra, including SMD, SMA, SMI, SAT, and VAT on both pre-treatment baseline CT scans and end-of-treatment CT scans. A radiologist extrapolated some parameters from the low-dose CT co-registration PET scan, using GE Adw Cross X software on a dedicated workstation (ADVANTAGE WORKSTATION 4.4. GE MEDICAL SYSTEMS).
BMD, measured in Hounsfield Units (HUs), was calculated at the slice passing through the middle third of the L1 soma, using an ROI with an area of 600 mm2 (Figure 1A). For the SMD, SMA, VATA (area of visceral adipose tissue), and SATA (area of subcutaneous adipose tissue) calculation, the slice through the middle third of the L3 vertebral soma was used as the reference slice, as proposed by Xiao et al. [25].
SMD was assessed in HU, with an ROI within an area of 400 mm2 drawn at the psoas muscle.
SMA was measured by drawing a freehand ROI comprising all abdominal, lumbar, and paravertebral muscles and selecting, within that ROI, only those tissues with muscle density (Figure 1B).
The SMI (skeletal muscle index, cm2/m2) was calculated as SMA (cm2)/patient height (m)2.
The VATA (visceral adipose tissue area, cm2) was measured by drawing a freehand ROI including the abdominal region, excluding the abdominal muscle region and SAT (subcutaneous adipose tissue), and selecting, within the aforementioned ROI, only tissues with adipose density (−150 to −50 HU approximately) (Figure 1C).
The SATA (subcutaneous adipose tissue area, cm2) was calculated by drawing a freehand ROI that includes the tissues of the abdominal wall outside the abdominal muscular region and selecting, within this ROI, those with adipose density (Figure 1D).

2.3. Statistical Analysis

A preliminary analysis to select a proper sample size was performed, referring to published data [23]. Assuming a normal distribution of BMD and a power of 0.90, with alpha = 0.05, the total sample size should have been n=78.
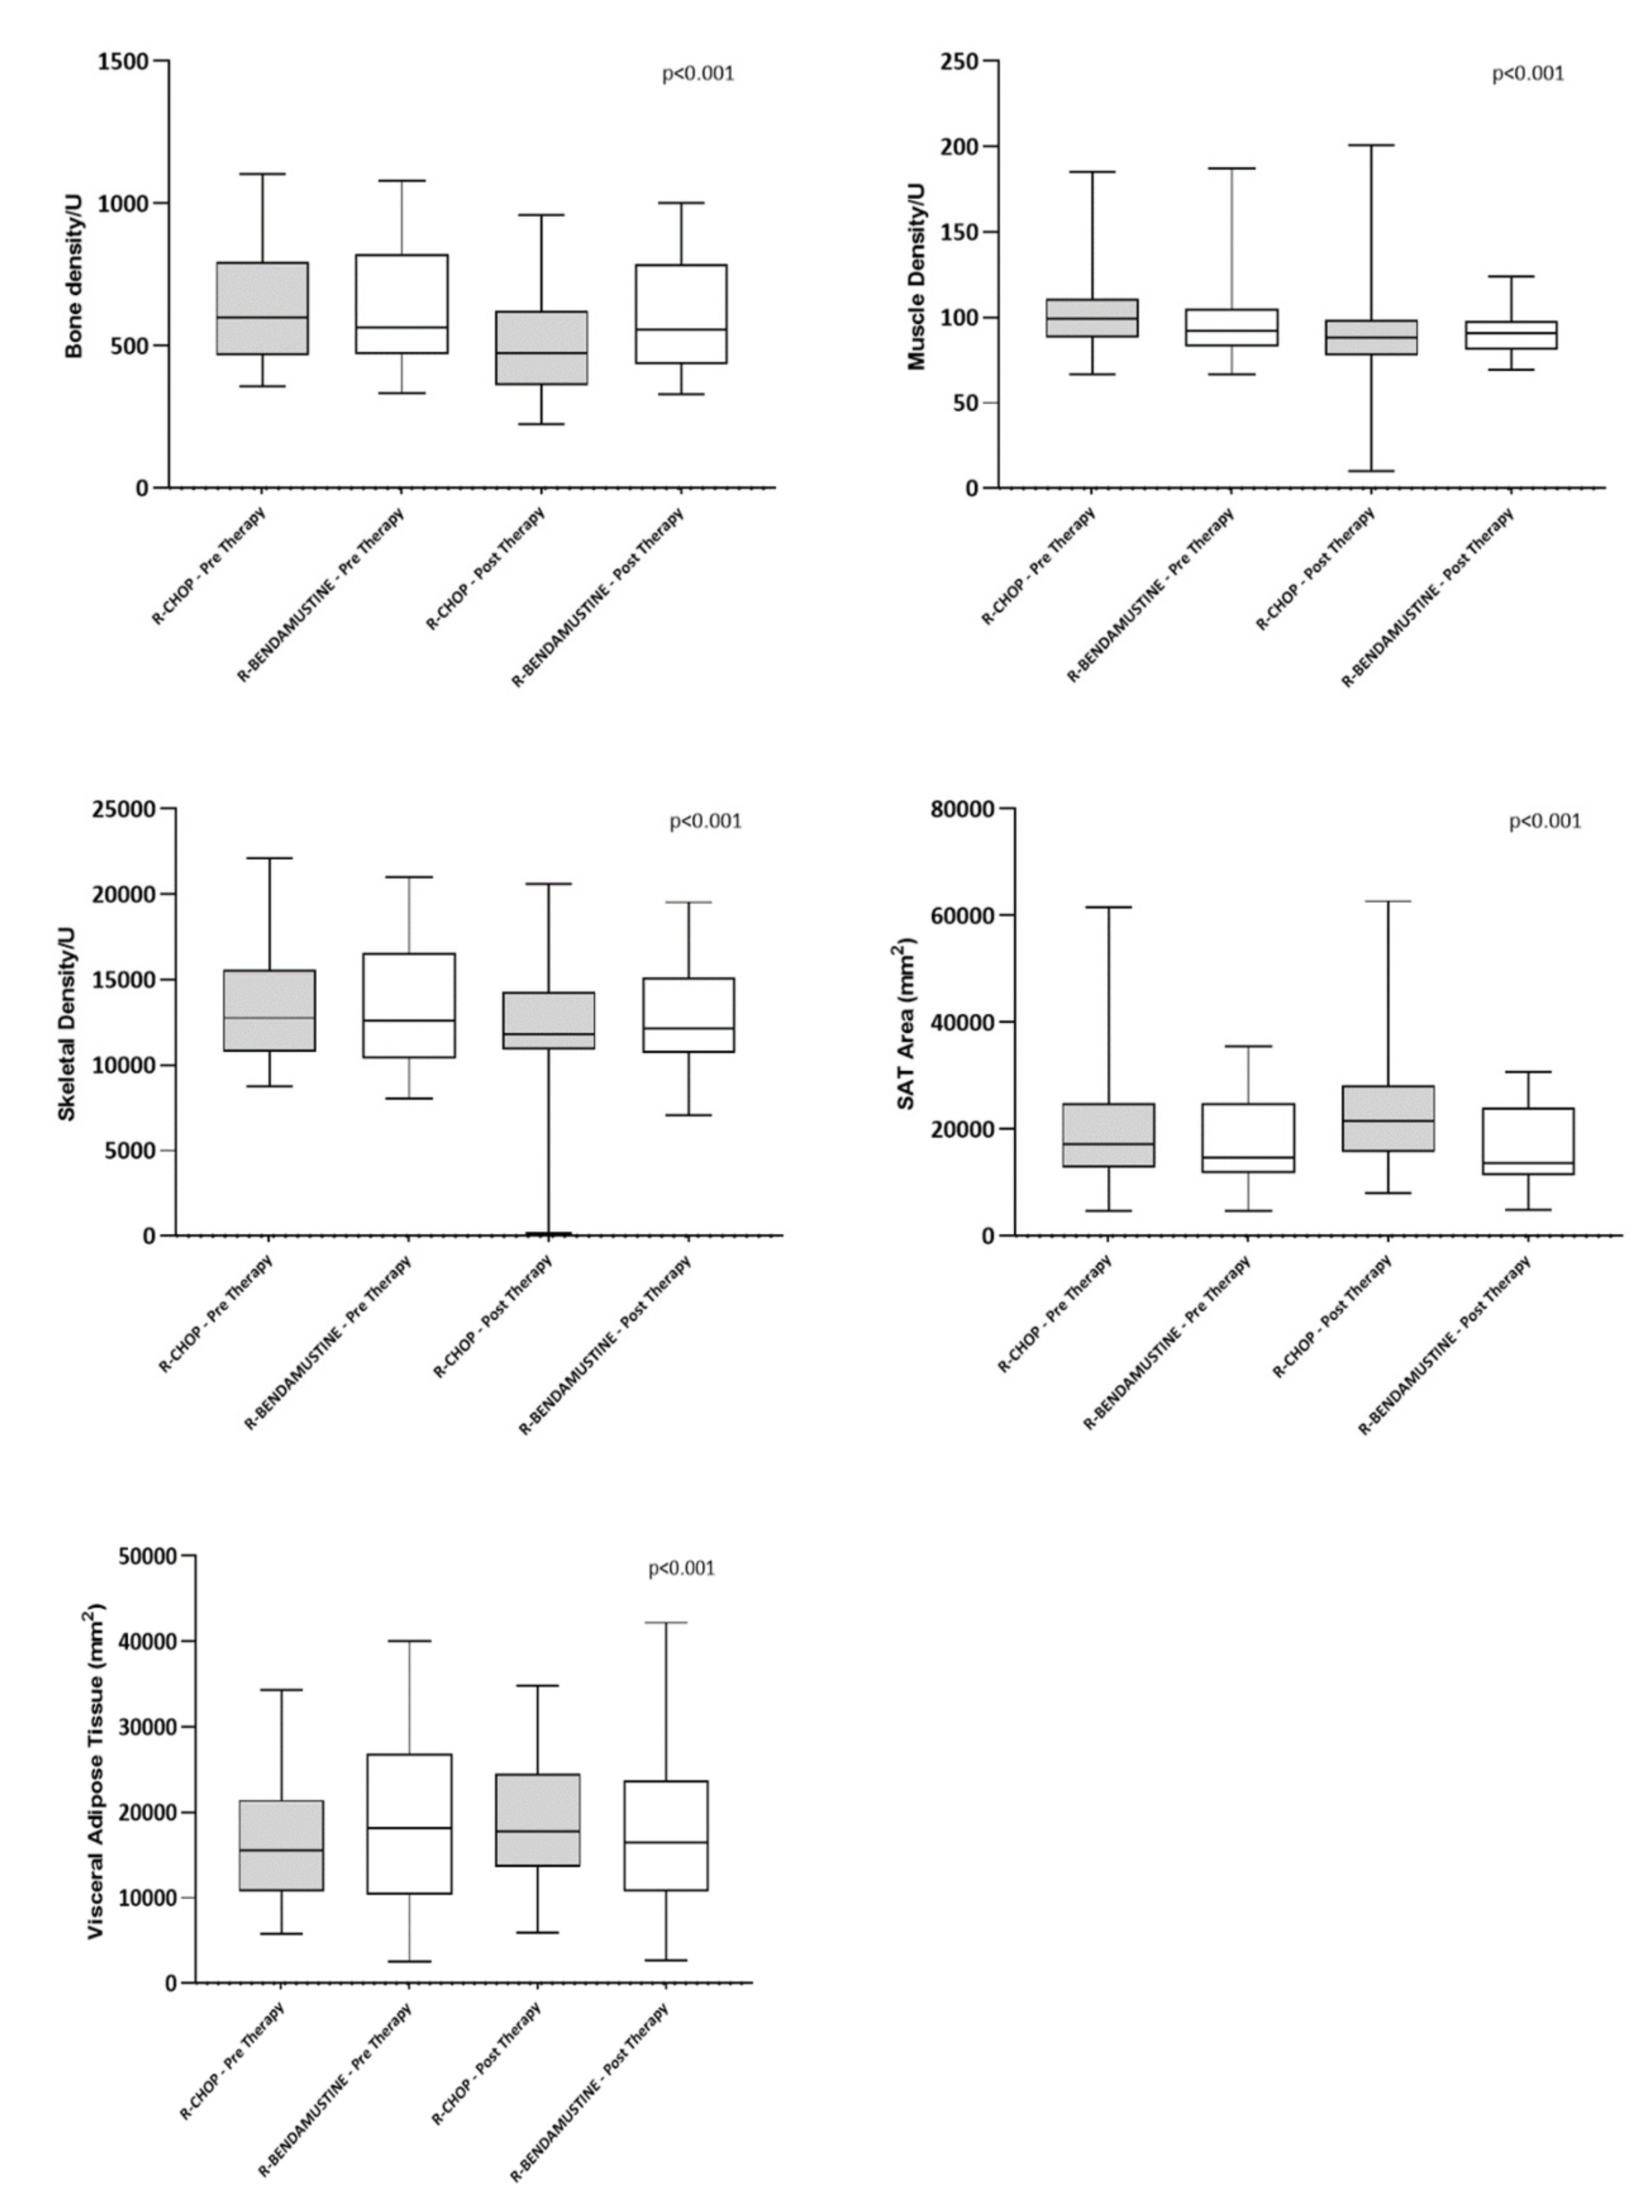
All continuous variables were first evaluated by the Shapiro–Wilk Test. Continuous variables are expressed as the median or mean ± SD; categorical variables are expressed as percentages. Delta (Δ) values (post-therapy mean value–pre-therapy mean value) and delta percentages were performed to evaluate the change in the pre–post-therapy values between radiomic groups. Boxplots were used to show BMD, SAT, and VAT values between pre- and post-therapy.
In the univariate analysis, parametric and non-parametric tests were performed for comparisons between groups (Chi-Squared and Fisher Exact tests in the case of categorical variables; Student’s t-test and Mann−Whitney tests in the case of continuous variables and Wilcoxon signed-rank tests in the case of ordinal variables). Receiver operating characteristic curves (ROCs) were implemented to identify the optimal cut-off for BMD, SAT, and VAT variables with the most effective measure of sensitivity and specificity in the FLIPI score (low vs. high) pre-therapy. Youden’s Index was calculated as (sensitivity + specificity) − 100 using the ROC curves. All tests were two-sided, accepting p < 0.05 as indicating a statistically significant difference. Confidence intervals were calculated at the 95% level. Progression-Free Survival (PFS) distributions were estimated using the Kaplan–Meier product limit estimator. Differences in PFS curves were evaluated using the Log-Rank test. Cox regression models were performed in univariate analyses to assess the effect of FLIPI scores and the BMD cut-off on progression-free survival (PFS).
All analyses were performed using the R system software (R Foundation for Statistical Computing c/o Institute for Statistics and Mathematics, Wirtschaftsuniversität, 1020 Wien, Austria), GraphPad Prism ver. 9.0.0, G*Power (Release 3.1.9.6) and Microsoft Corporation (2022) Microsoft Excel for Mac, retrieved from https://office.microsoft.com/excel, 11 January 2023.

3. Results

The minimum calculated sample size was 39 patients in each group (the minimum total of patients for the study was 76) with probability (1 − β) greater than 0.9 and an effect size δ ≥ 0.75, with a two-way criterion allowing for a maximum type I error rate α = 0.05.
The main demographic and clinical characteristics of the eligible patients are summarized in Table 1. Seventy-nine patients with follicular NHL were treated with immunochemotherapy: 48 according to the R-CHOP scheme and 31 patients according to R-B therapy.
The two groups were homogeneous in terms of age at treatment (66 years vs. 70 years) and weight, height, and BMI parameters. The male-to-female ratio (M:F) is unbalanced toward women in the R-CHOP group (M/F ratio = 0.7) and toward men in the R-B group (M/F ratio = 1.4).
In both patient cohorts, the FLIPI score showed a higher rate in the intermediate risk category (58.3% in R-CHOP and 54.8% in R-B). Patients with low-risk FLIPI scores occurred at a lower rate (2.1% in R-CHOP and 9.7% in R-B), which confirms the correct indication for the start of chemotherapy treatment.
The pre- and post-therapy radiomic data are summarized in Table 2 and Figure 2. These show that the median pre-therapy values were overlapping for both study groups for the radiomic variables.
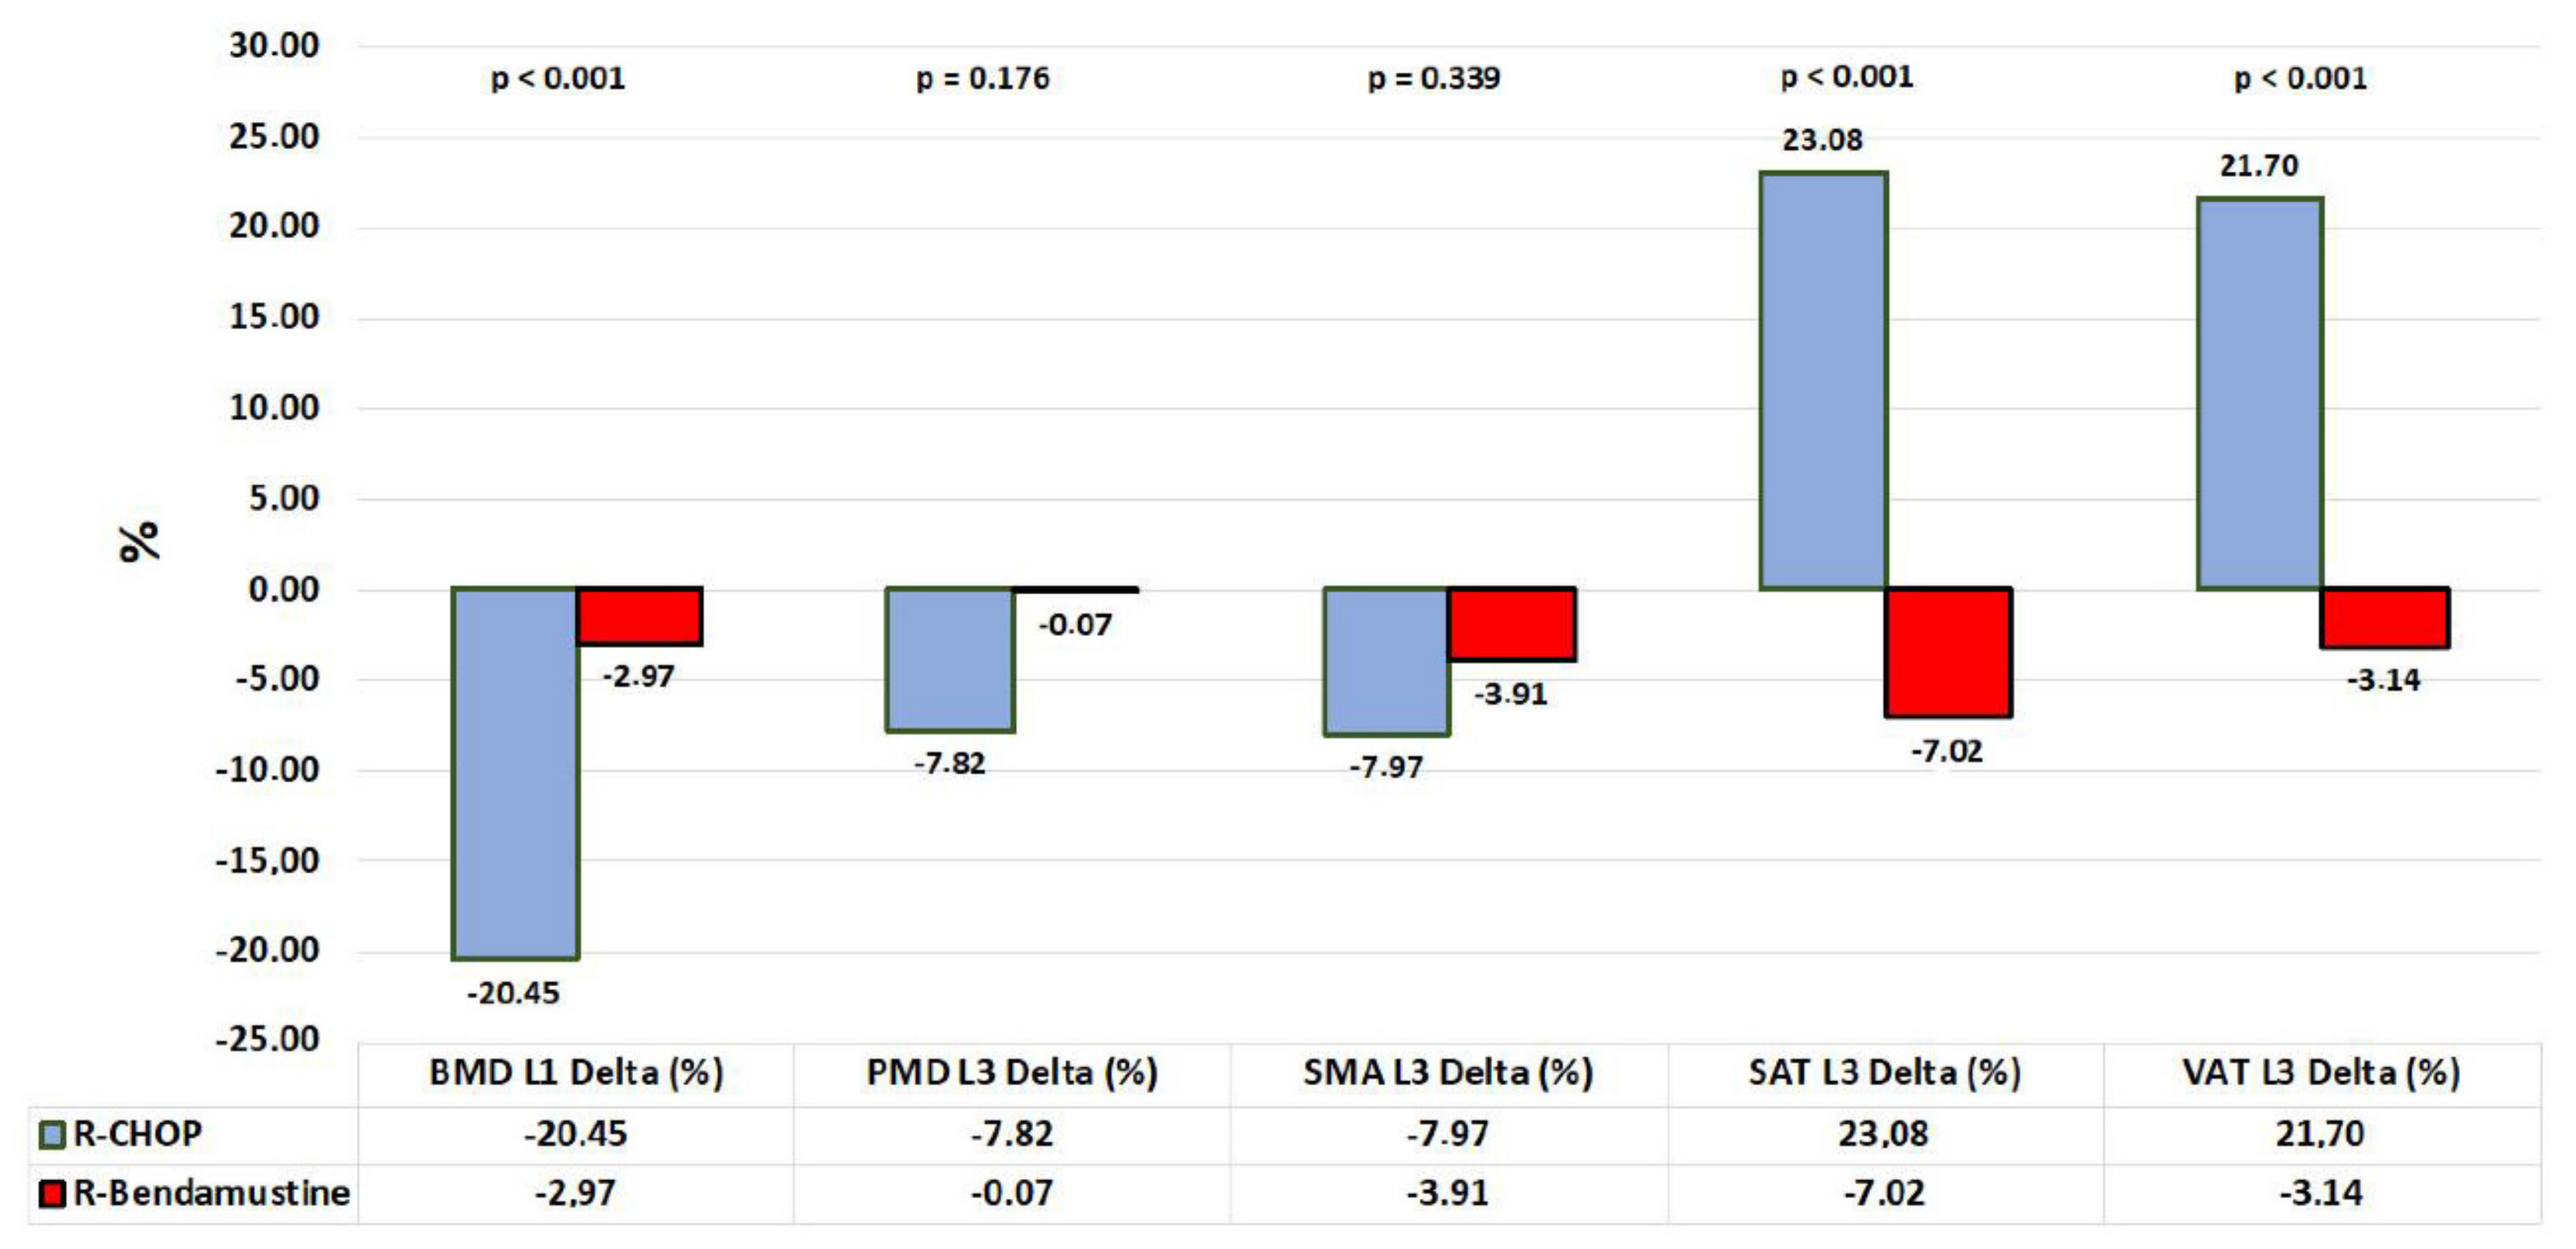
Furthermore, the difference in mean values pre–post-therapy of BMD, SMD, and SMA in the R-CHOP patient group is lower than in the R-B group (Δ(%) = BMD/R-CHOP = −20.45%, Δ(%) = BMD/R-B = −2.97%, p < 0. 001; Δ(%) = SMD/R-CHOP = −7.82, Δ(%) = SMD/R-B = −0.07%, p = 0.176; Δ(%) = SMA/R-CHOP = −7.97%, Δ(%) = SMA/R-B = −3.91%, p = 0.339). In addition, there is an increase in SAT and VAT values in the R-CHOP group; for VAT: Δ(%) = VAT/R-CHOP: 21.70%, Δ(%) = VAT/R-B: −3.14%, p < 0.001; for SAT: Δ(%) = SAT/R-CHOP: 23.08%, Δ(%) = VAT/R-B: −7.02%, p < 0.001; see Table 3 and Figure 3.
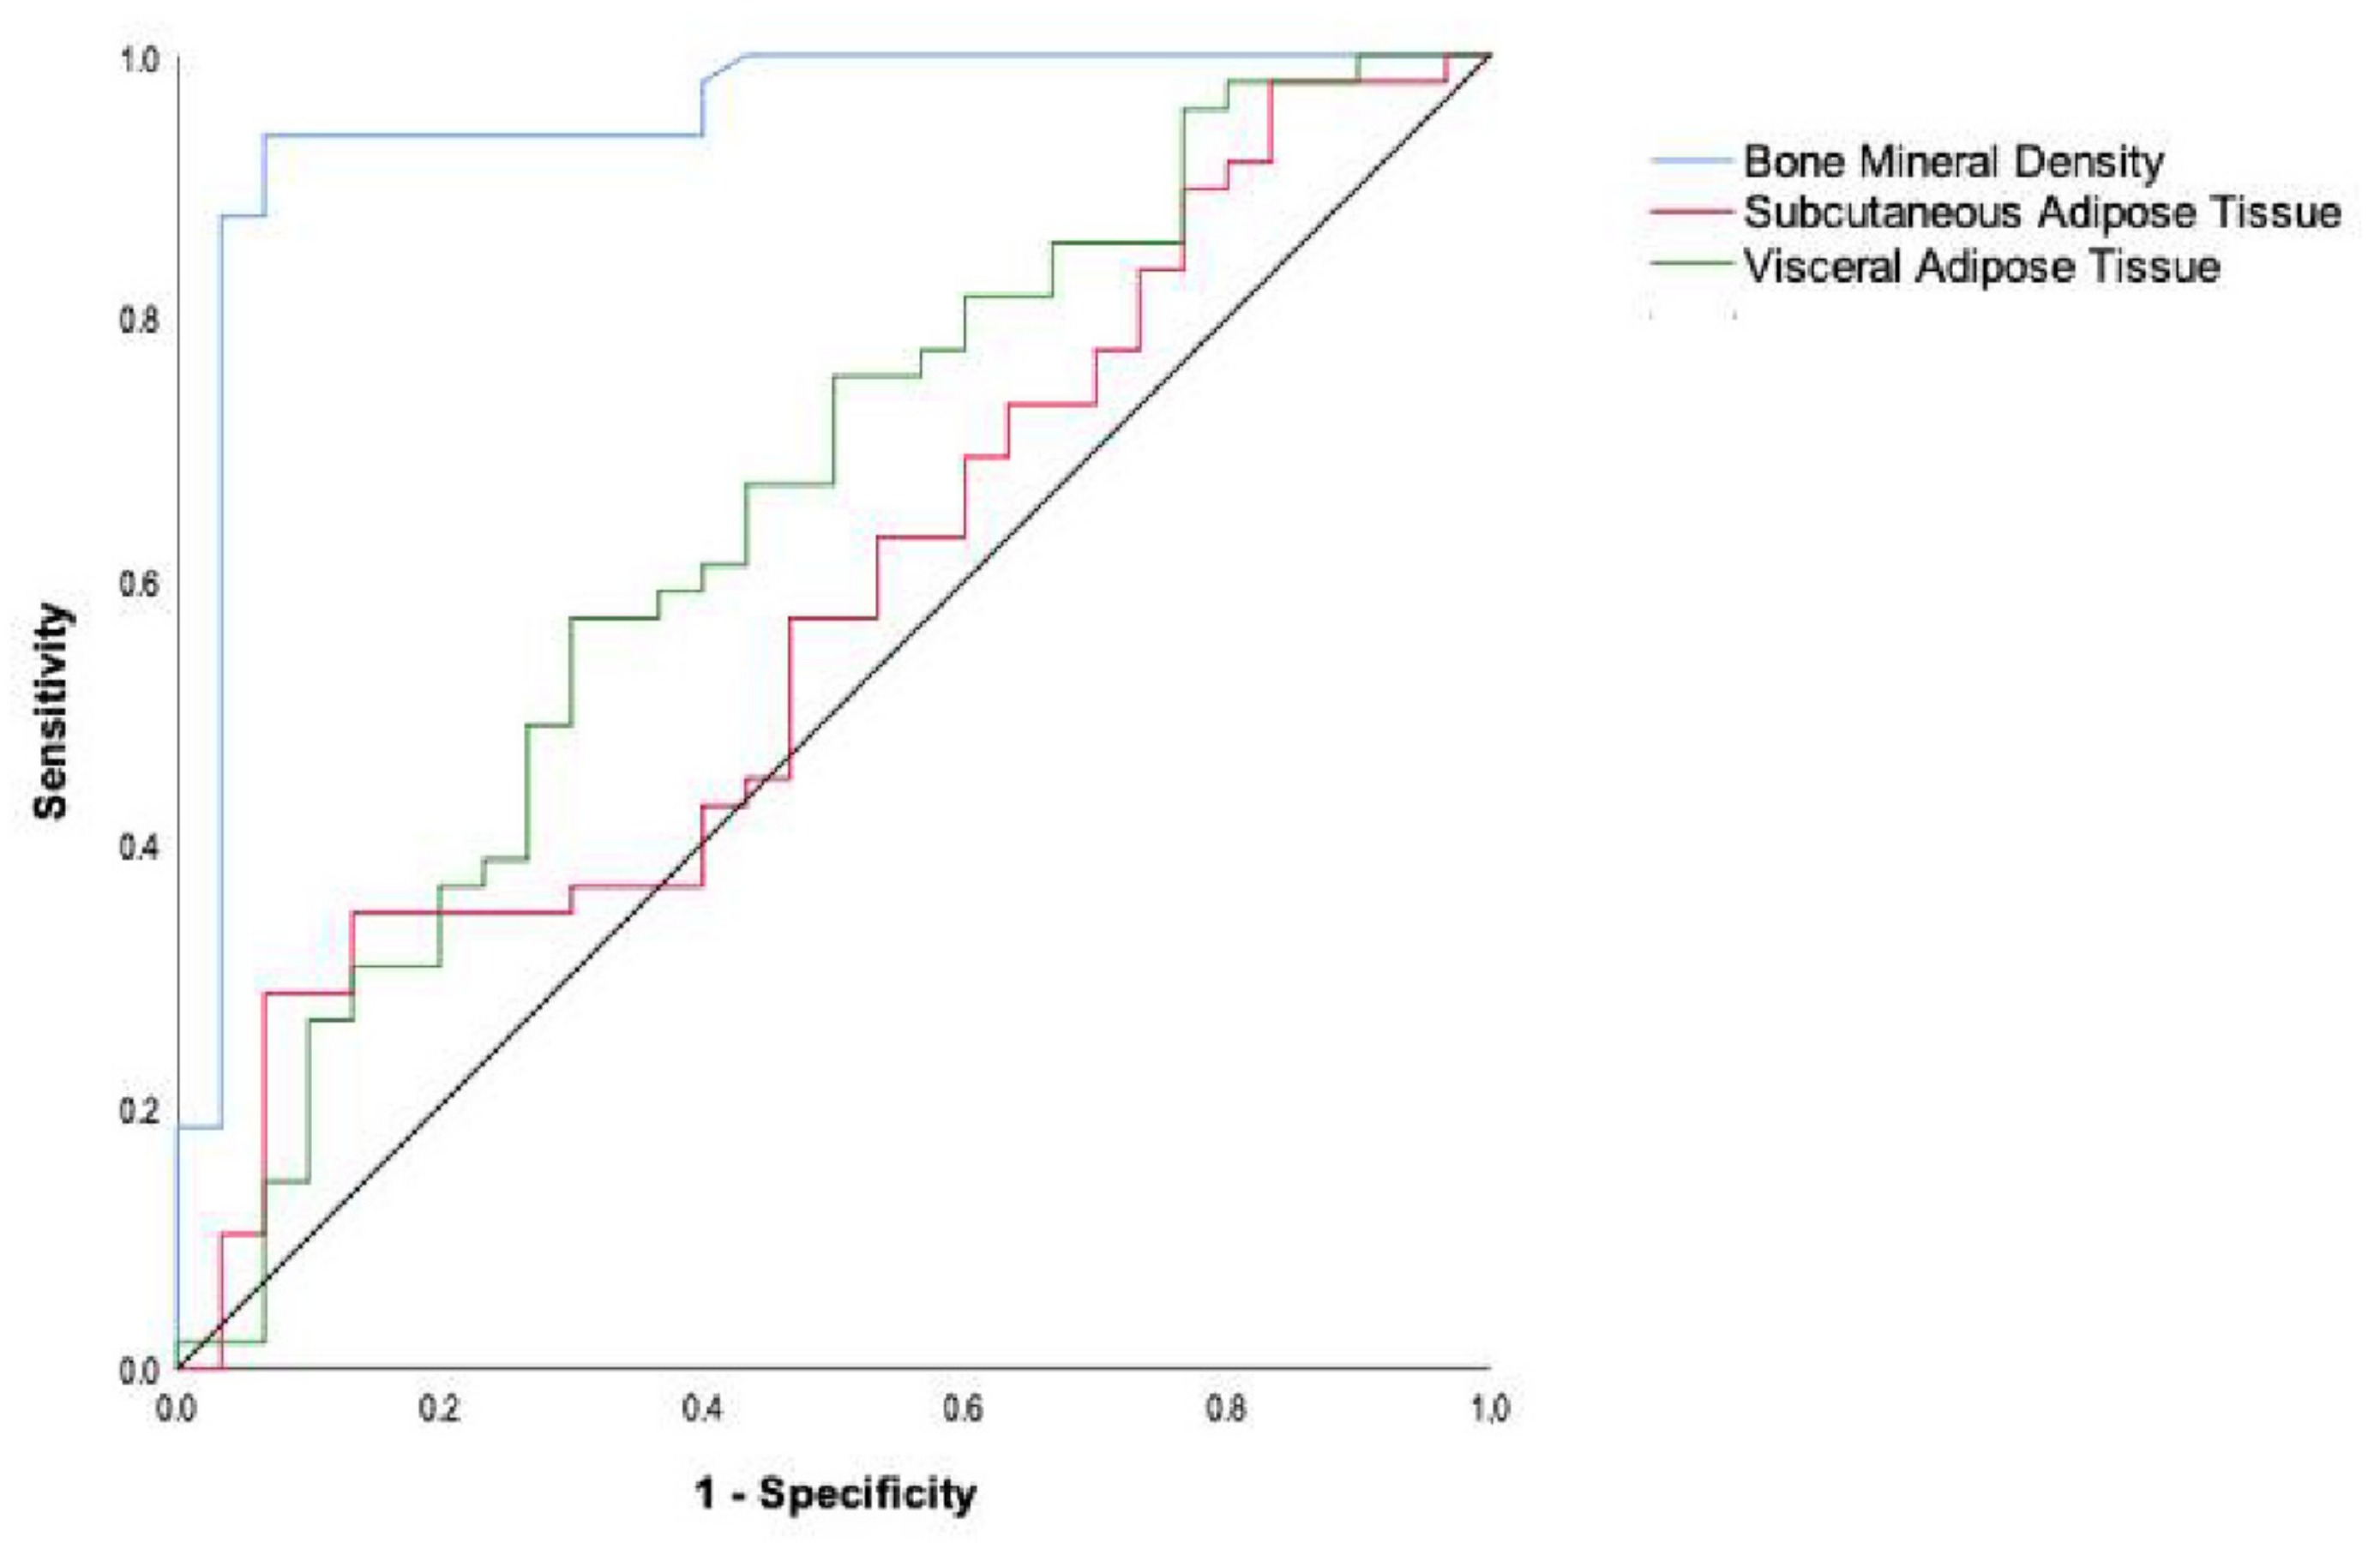
ROC curves were used to analyze the radiomic parameters (BMD, SAT, and VAT) significantly different between low FLIPI Scores (FLIPI Score 1 and 2) and high FLIPI Scores (FLIPI Score ≥ 3). The ROC curves of certain single parameters are shown in Figure 4. The minimum sum of squares of the false-positive rate and the false-negative rate was used as a reference for the choice of the optimal cut-off value. The results have shown that BMD was the best single parameter for predicting the prognosis of patients, with an area under the ROC curve (AUC) of 0.948 [95% confidence interval (CI) 0.889–0.996]. When the BMD cut-off value was 522, the sensitivity and specificity of BMD for predicting the FLIPI Score as low or high were 93.9% and 93.3%, respectively (Table 4).
In addition, we have observed that percentages of patients who have high FLIPI Scores are below the cut-off value of BMD for R-CHOP and B-R (94.7% and 90.9%, p < 0.001), while for patients who have low FLIPI Scores, the cut-off values of BMD for R-CHOP and R-B are higher (96.5% and 85.0%, p < 0.001) (Table 5).
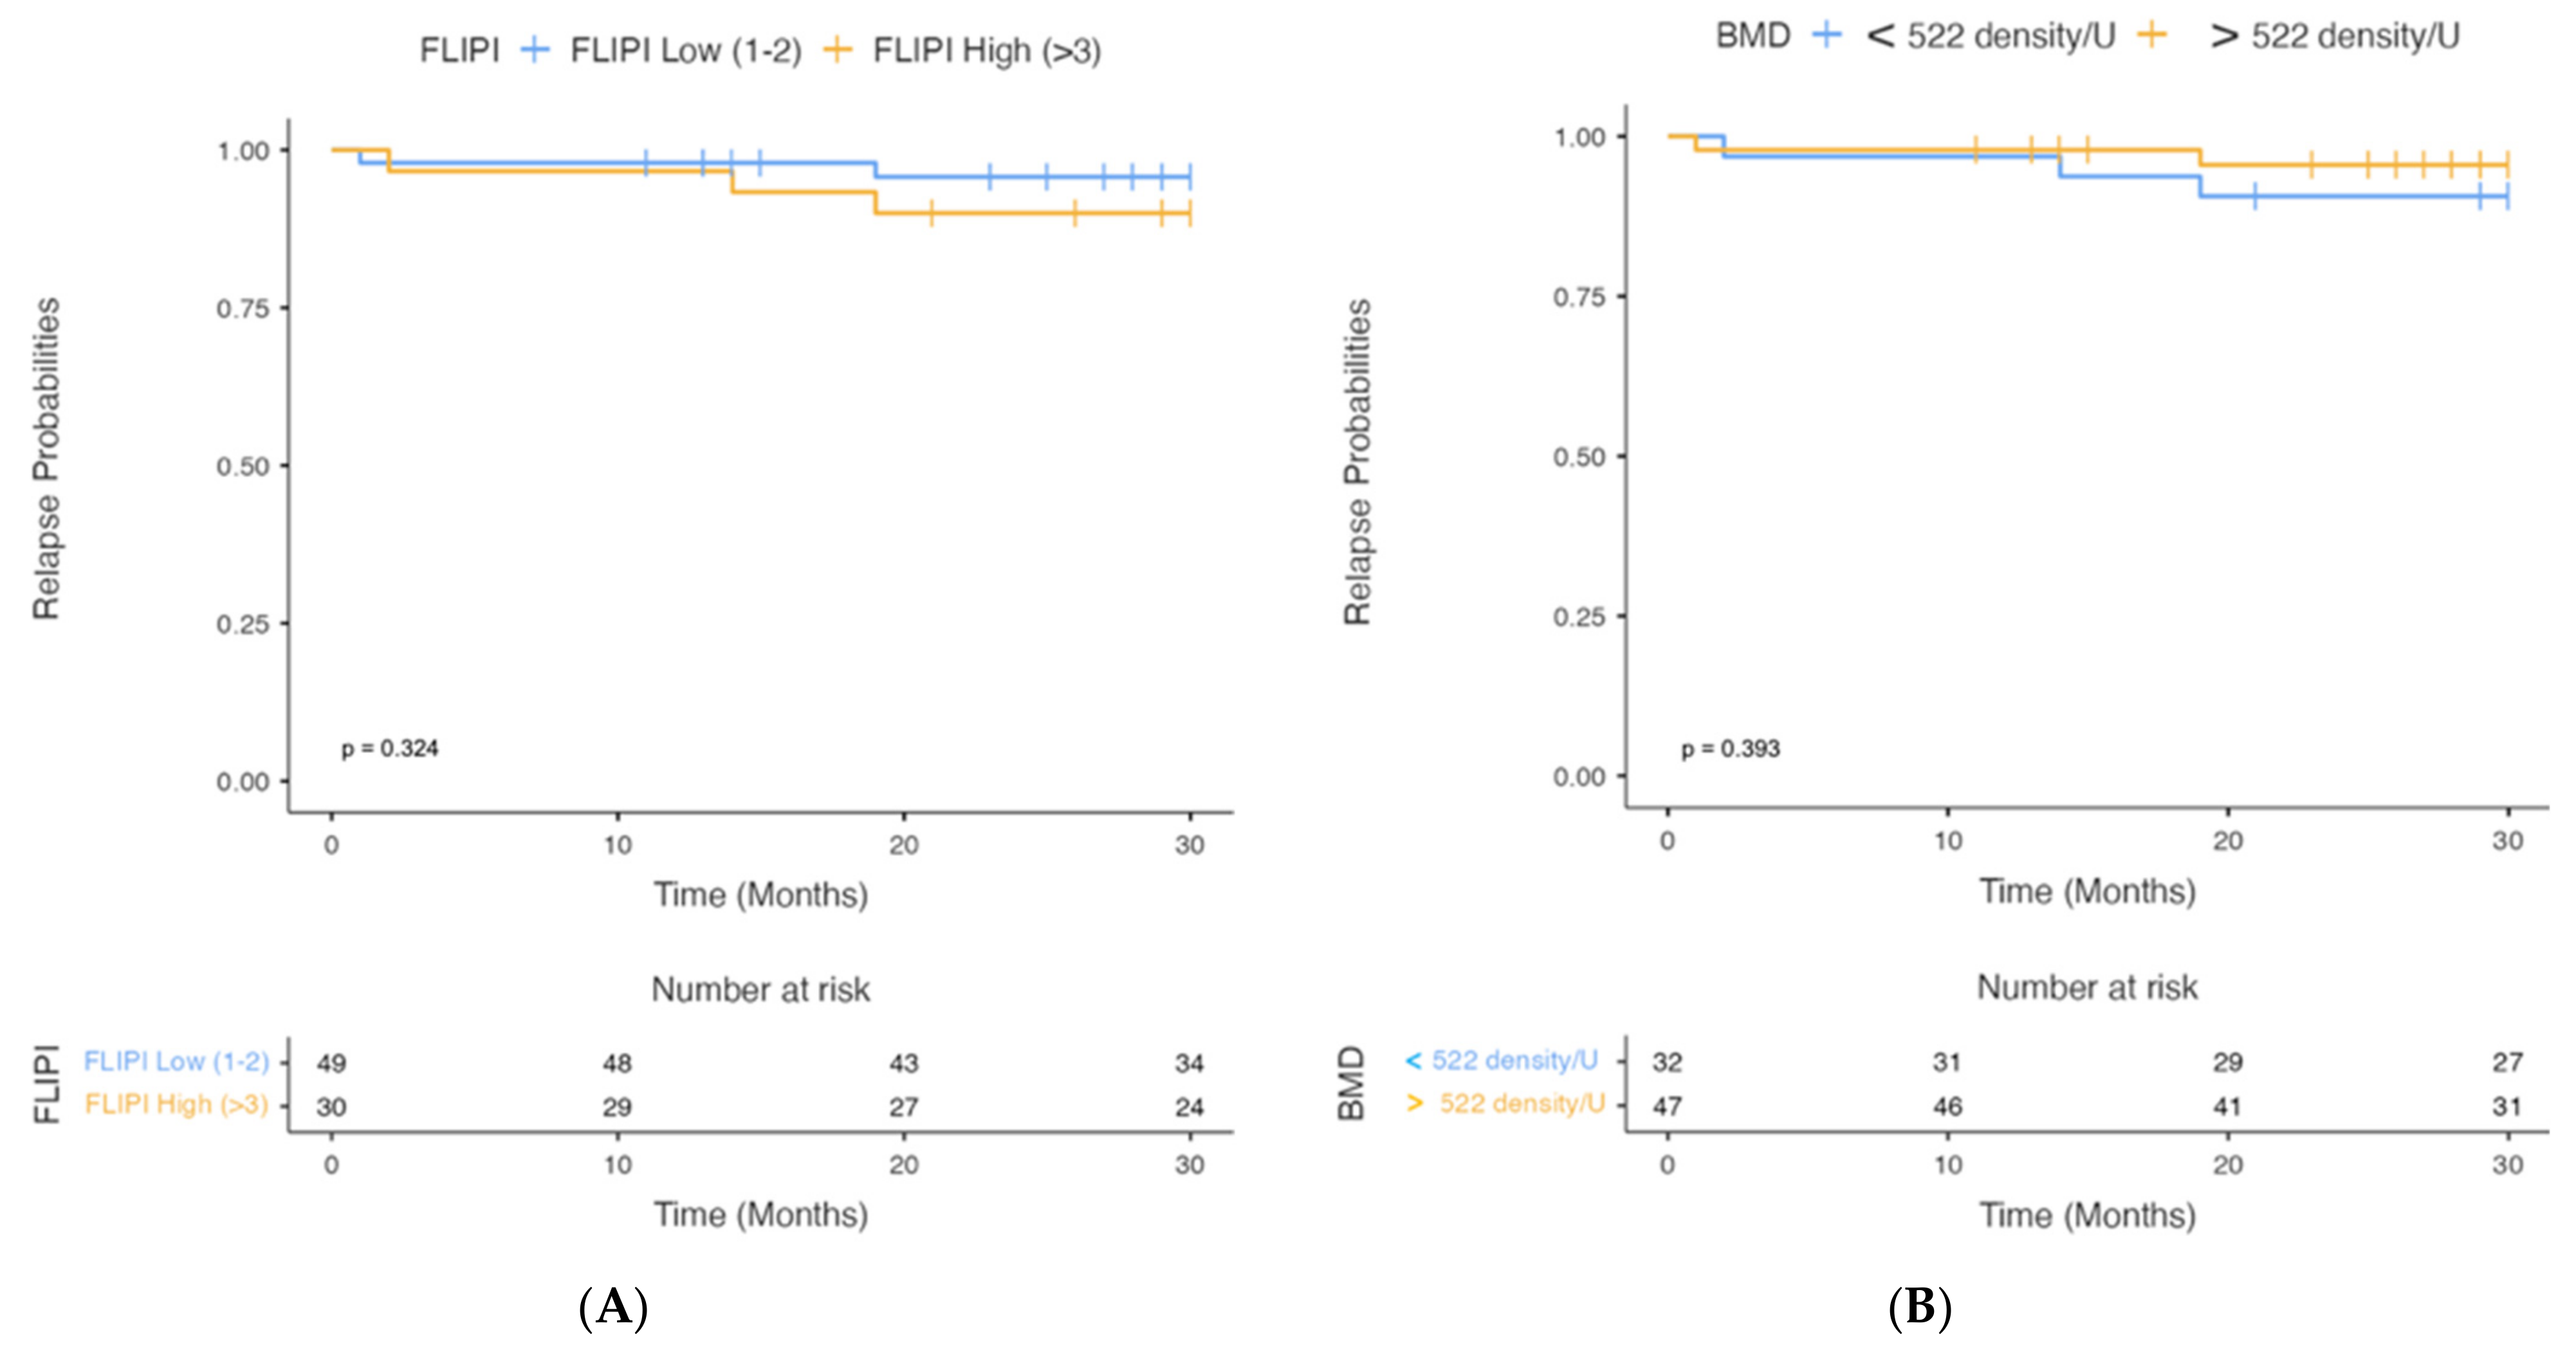
Analysis of PFS according to FLIPI Score (low vs. high) showed a higher level of high FLIPI Scores (p = 0.324), which never reached the median (after 30 months of observation, 95.9% of patients with a low FLIPI Score and 90.0% of patients with a high FLIPI Score did not relapse) (Figure 5A).
Analysis of PFS according to the cut-off of BMD (<522 density/U vs. >522 density/U) showed a higher level of BMD < 522 density/U (p = 0.393), which never reached the median (after 30 months of observation, 90.6% of patients with BMD < 522 density/U and 95.7% of patients with BMD > 522 density/U did not relapse) (Figure 5B).

4. Discussion

In most cases, FL is still an incurable disease, and [3] despite the good response to new therapies with a significant improvement in prognosis, relapses are frequent in its course and histological transformation to DLBCL is also possible [26].
In recent decades, therapeutic advances offer FL patients a perspective of prolonged survival, therefore it is important to identify treatment strategies that offer a better quality of life.
Recently, interest has grown in seeking functional parameters derived from staging PET/CT, and several studies have suggested, with increasing evidence, the potential prognostic value of quantitative parameters when staging PET/CT in patients with different types of non-Hodgkin’s lymphoma [27,28,29,30].
To date, for patients with FL in need of treatment, there are two R-chemotherapy approaches, R-CHOP and R-B, both effective and equally indicated as first-line therapy in patients requiring systemic treatment [9,10]. In addition, the choice to perform one of the two regimens is often based on factors concerning the patient’s age and fitness, as well as the presence of cardiological comorbidities (cardiotoxic effect of anthracyclines [31], the presence of a caregiver, and the refusal of hair loss treatment [10].
Our study arises from the hypothesis that the identification and application of radiomic patterns can improve our ability to make therapeutic choices.
The studies that have investigated this issue have focused on other disciplines such as oncology and rheumatology. In the field of hematology, there are few data in the literature on the effect of chemotherapy on bone metabolism in adult patients with NHL. The available data are those relevant to patients diagnosed with DLBCL and treated according to the R-CHOP regimen [21,22,23,24]. In a prospective study, Anargyrou et al. suggest that first-line chemotherapy leads to high bone turnover, increased bone loss, and reduced BMD at the level of the lumbar and femoral [24]. Likewise, Cabanillas et al., in a large retrospective study of patients over 65 years of age with NHL, showed a significant increase in fractures and osteoporosis [21].
Furthermore, a significant loss of bone mineral density after R-CHOP(-like) treatment was observed in 111 patients with DLBCL. Glucocorticoid-induced osteoporosis may therefore have an impact on survival for a large fraction of patients with DLBCL with durable remissions [23].
Our study is the first to compare radiomic parameters in two cohorts of patients with FL treated with two different immunochemotherapy regimens.
To date, there are no studies on this subject, perhaps also due to the difficulty in collecting data in a heterogeneous population. Therefore, to reduce potential selection bias, we chose to collect patients with a defined age range (60–80 yr), classified by grading and risk class according to FLIPI.
Our results show a marked reduction in BMD in the group of patients who received R-CHOP compared to the ones who received R-B.
This could be due to the administration of the first regimen of corticosteroids, which are known to be associated with an increased risk of reduced BMD, and thus osteoporosis [32,33].
The negative effect that glucocorticoids have on bone mass, and the subsequent risk of fractures, has been documented primarily in patients with Rheumatoid Arthritis in whom average daily dosages generally do not exceed 5–7.5 mg prednisone [34,35].
However, while the effects in patients who receive corticosteroids continuously and for long periods have been studied, only in recent years has the focus been moving to the patient population receiving intermittent doses of steroid-based chemotherapies for a limited number of days, as is the case in the treatment of lymphoid disorders.
Most LNH regimens, such as CHOP and COMP, are administered every 3 weeks for 6 cycles, include prednisone 100 mg orally once a day for 5 days, and are associated with a high incidence of vertebral fractures [21,22]. The pathogenesis of glucocorticoid-induced osteoporosis is multifactorial, with mechanisms partly involving bone cells, and mediated by local and systemic interactions between hormones, growth factors, and cytokines. With regard to the latter, the RANKL/OPG (receptor activator of nuclear factor kappa B-ligand/osteoprotegerin) system is thought to be primarily responsible for the reduction in bone mass and the rapid increase in fracture risk [36,37,38,39].
Indeed, glucocorticoids induce osteoblast expression of RANKL and inhibit osteoblastic production of osteoprotegerin resulting in an increase in osteoclastic activity. Further osteoclast-stimulating action is significantly linked to certain cytokines with pro-inflammatory activity, such as TNF-α and Interleukins 1, 6, and 17 (IL-1, IL-6, IL-17) [40,41,42,43].
According to some studies, cytokines also play an important role in the pathogenesis of lymphoma and are partly responsible for systemic symptoms [44,45].
Elevated serum or tissue cytokine levels may contribute to clinical and histopathological alterations in NHL. Moreover, it has been shown that levels of serum TNF-α, IL-2, and serum CD44 (sCD44) are all increased in NHL and correlate with tumor burden, the presence of symptoms, and other clinical and laboratory variables [46,47].
Our study showed a correlation between initial BMD and FLIPI: Patients who had a high FLIPI (3–4) had an initial BMD lower than 522 HU, which could refer to a higher cytokine release in aggressive diseases [48,49,50].
PFS analysis according to FLIPI and BMD, although only assessed at 30 months and not reaching the median, showed a lower PFS in patients with high FLIPI and low BMD. After 30 months of observation, 95.9% of patients with a low FLIPI Score and 90.0% of patients with a high FLIPI Score did not relapse.
PFS analysis based on the BMD cut-off has shown, after 30 months of observation, that 90.6% of patients with BMD < 522 density/U and 95.7% of patients with BMD > 522 density/U had no relapse.
In addition, the R-CHOP chemotherapy includes the use of drugs such as vincristine, which can cause polyneuropathy as a side effect, with decreased physical activity and increased risk of falls [51].
Neuropathy affects the perception of sensory signals and proprioception, causing gait instability. If we consider the altered muscle mass, with the resulting sarcopenia, and the use of corticosteroids, these patients inevitably have an increased risk of accidental falls [52].
Corticosteroids are also well known to induce most of the main features of metabolic syndromes such as hyperglycemia, insulin resistance, dyslipidemia, hepatic steatosis, and obesity, having a significant effect on the quality of life of patients [53].
On this topic, some studies have also been undertaken with hematological patients, as demonstrated in surviving children with acute lymphoblastic leukemia [54]. The effects of steroid therapy translate into an increased appetite, water retention, and fat redistribution in certain body districts such as the abdomen, neck, and face, resulting in the typical ’full moon’ shape.
The results of our study confirm these observations, as when evaluating the SAT L3 before and after therapy in the two patient cohorts as secondary objectives, we observed a high delta value in the R-CHOP group and a low delta in post-therapy SAT in the R-B group.
We have hypothesized that the reduction in the R-B group could have been related both to the neoplastic disease itself, due to the increase in metabolic cell-induced spending by the tumor cells with a persistence of the chronic inflammatory state, and to the effect of chemotherapy, due to the reduced food intake, decreased appetite, and altered digestive capacity. This process would not be offset by the lipogenic action of cortisone, which is used in the R-CHOP group and is responsible for the increase in SAT L3.
With regard to VAT L3, the results of our study show a post-therapy trend similar to SAT L3. One reason could be attributed to cytokine release by lymphoma cells, which is responsible for systemic symptoms, including weight loss [44,45].
In the R-B group, this effect would not be balanced by the anti-inflammatory action of glucocorticoids, which down-regulate pro-inflammatory cytokines such as IL-1α, IL-1β, IL-2, IL-3, IL-5, IL-6, IL-8, IL-12, IFN-γ, TNF-α, and GMCSF [53,55]. This would lead, over time, to a reduction in visceral fat.
Furthermore, preliminary studies have shown that high blood glucose levels (which occur after taking corticosteroids) would attenuate the increase in IL-6 levels in plasma [56,57].

5. Conclusions

Our study provides initial proof of the hypothesis of a significant change in the body composition of patients treated with R-CHOP compared to those treated with R-B. For the time being, we have provided important descriptive aspects that we can consider in the future choice of therapy between two effective immunochemotherapies, especially in frail patients.
However, the study was conducted as a retrospective analysis, with the limitation of being monocentric and addressing a population observed for a 30-month follow-up period, which did not allow us to assess OS. PFS, although evaluated for a very short time period (30 months), showed higher value in patients with low FLIPI and high BMD. During our analysis, we observed a correlation between BMD and FLIPI. Indeed, the correlation was very significant. This, in our opinion, could have been influenced by the greater cell turnover and cytokine release observed in the more advanced stages of the disease. This could also be influenced by unknown factors. Further analysis is needed to consolidate our initial observations.
Therefore, we will need prospective studies in the future, extended to a larger population, with a follow-up longer than 30 months, which must include questionnaires on patients’ quality of life to assess whether these radiomic parameters can really provide an additional reference tool for the choice of therapy in clinical practice.

Author Contributions

F.E., M.C. and G.M. designed the study; M.R.P., P.E.G., A.L., A.P., R.S., M.M. and F.M. collected the data; C.T. and C.A. performed the statistical analyses and generated the tables; F.E. and M.R.P. drafted the manuscript; M.C., C.T., G.M. and M.P. corrected the manuscript. All authors have read and agreed to the published version of the manuscript.

Funding

This research received no external funding.

Institutional Review Board Statement

The study was conducted in accordance with the Declaration of Helsinki and approved by the Ethics Committee of Policlinico Tor Vergata, Rome on 22 December 2022 (Pro RS 257/22). With respect to privacy, all personal information was treated in a confidential manner, and all clinical data were anonymized.

Informed Consent Statement

Informed consent was obtained from all subjects involved in the study.

Data Availability Statement

The data presented in this study are available on request from the corresponding author.

Acknowledgments

We thank the investigators, nurses, and patients, as well as the central study team at our center, for their efforts in collecting data and conducting the study.

Conflicts of Interest

All authors declare no conflict of interest that are related, directly or indirectly, to the present study.

References

  1. Polyatskin, I.L.; Artemyeva, A.S.; Krivolapov, Y.A. Revised WHO classification of tumors of hematopoietic and lymphoid tissues, 2017 (4th edition): Lymphoid tumors. Arkhiv Patol. 2019, 81, 59–65. [Google Scholar] [CrossRef]
  2. Swerdlow, S.H.; Campo, E.; Pileri, S.A.; Harris, N.L.; Stein, H.; Siebert, R.; Advani, R.; Ghielmini, M.; Salles, G.A.; Zelenetz, A.D.; et al. The updated WHO Classification of hematological malignancies. The 2016 revision of the World Health Organization classification of lymphoid neoplasms. Blood 2016, 127, 2375–2390. [Google Scholar] [CrossRef]
  3. Dreyling, M.; Ghielmini, M.; Rule, S.; Salles, G.; Ladetto, M.; Tonino, S.H.; Herfarth, K.; Seymour, J.; Jerkeman, M. Newly diagnosed and relapsed follicular lymphoma: ESMO Clinical Practice Guidelines for diagnosis, treatment and follow-up. Ann. Oncol. 2021, 32, 298–308. [Google Scholar] [CrossRef]
  4. Freedman, A.; Jacobsen, E. Follicular lymphoma: 2020 update on diagnosis and management. Am. J. Hematol. 2020, 95, 316–327. [Google Scholar] [CrossRef]
  5. Alaggio, R.; Amador, C.; Anagnostopoulos, I.; Attygalle, A.D.; Araujo, I.B.D.O.; Berti, E.; Bhagat, G.; Borges, A.M.; Boyer, D.; Calaminici, M.; et al. The 5th edition of the World Health Organization Classification of Haematolymphoid Tumours: Lymphoid Neoplasms. Leukemia 2022, 36, 1720–1748. [Google Scholar] [CrossRef] [PubMed]
  6. Solal-Céligny, P.; Roy, P.; Colombat, P.; White, J.; Armitage, J.O.; Arranz-Saez, R.; Au, W.Y.; Bellei, M.; Brice, P.; Caballero, D.; et al. Follicular lymphoma international prognostic index. Blood 2004, 104, 1258–1265. [Google Scholar] [CrossRef] [PubMed]
  7. Bachy, E.; Maurer, M.J.; Habermann, T.M.; Gelas-Dore, B.; Maucort-Boulch, D.; Estell, J.A.; Neste, E.V.D.; Bouabdallah, R.; Gyan, E.; Feldman, A.L.; et al. A simplified scoring system in de novo follicular lymphoma treated initially with immunochemotherapy. Blood 2018, 132, 49–58. [Google Scholar] [CrossRef] [PubMed]
  8. Hiddemann, W.; Kneba, M.; Dreyling, M.; Schmitz, N.; Lengfelder, E.; Schmits, R.; Reiser, M.; Metzner, B.; Harder, H.; Hegewisch-Becker, S.; et al. Frontline therapy with rituximab added to the combination of cyclophosphamide, doxorubicin, vincristine, and prednisone (CHOP) significantly improves the outcome for patients with advanced-stage follicular lymphoma compared with therapy with CHOP alone: Results of a prospective randomized study of the German Low-Grade Lymphoma Study Group. Blood 2005, 106, 3725–3732. [Google Scholar]
  9. Rummel, M.J.; Niederle, N.; Maschmeyer, G.; Banat, G.A.; von Grünhagen, U.; Losem, C.; Kofahl-Krause, D.; Heil, G.; Welslau, M.; Balser, C.; et al. Bendamustine plus rituximab versus CHOP plus rituximab as first-line treatment for patients with indolent and mantle-cell lymphomas: An open-label, multicentre, randomised, phase 3 non-inferiority trial. Lancet 2013, 381, 1203–1210. [Google Scholar] [CrossRef]
  10. Flinn, I.W.; van der Jagt, R.; Kahl, B.S.; Wood, P.; Hawkins, T.E.; Macdonald, D.; Hertzberg, M.; Kwan, Y.-L.; Simpson, D.M.; Craig, M.; et al. Randomized trial of bendamustine-rituximab or R-CHOP/R-CVP in first-line treatment of indolent NHL or MCL: The BRIGHT study. Blood 2014, 123, 2944–2952. [Google Scholar] [CrossRef]
  11. Barrington, S.; Barrington, S.F.; Trotman, J. The role of PET in the first-line treatment of the most common subtypes of non-Hodgkin lymphoma. Lancet Haematol. 2021, 8, e80–e93. [Google Scholar] [CrossRef]
  12. Jang, S.; Graffy, P.M.; Ziemlewicz, T.J.; Lee, S.J.; Summers, R.M.; Pickhardt, P.J. Opportunistic osteoporosis screening at routine abdominal and Thoracic CT: Normative L1 trabecular attenuation values in more than 20,000 adults. Radiology 2019, 291, 360–367. [Google Scholar] [CrossRef]
  13. Halpenny, D.; Goncalves, M.; Schwitzer, E.; Golia Pernicka, J.; Jackson, J.; Gandelman, S.; Moskowitz, C.S.; Postow, M.; Mourtzakis, M.; Caan, B.; et al. Computed tomography-derived assessments of regional muscle volume: Validating their use as predictors of whole body muscle volume in cancer patients. Br. J. Radiol. 2018, 91, 20180451. [Google Scholar] [CrossRef]
  14. Daly, L.E.; Prado, C.M.; Ryan, A.M. A window beneath the skin: How computed tomography assessment of body composition can assist in the identification of hidden wasting conditions in oncology that profoundly impact outcomes. Proc. Nutr. Soc. 2018, 77, 135–151. [Google Scholar] [CrossRef]
  15. Mamot, C.; Klingbiel, D.; Hitz, F.; Renner, C.; Pabst, T.; Driessen, C.; Mey, U.; Pless, M.; Bargetzi, M.; Krasniqi, F.; et al. Final results of a prospective evaluation of the predictive value of interim positron emission tomography in patients with diffuse large B-cell lymphoma treated with R-CHOP-14 (SAKK 38/07). J. Clin. Oncol. 2015, 33, 2523–2529. [Google Scholar] [CrossRef]
  16. Pregno, P.; Chiappella, A.; Bellò, M.; Botto, B.; Ferrero, S.; Franceschetti, S.; Giunta, F.; Ladetto, M.; Limerutti, G.; Menga, M.; et al. Interim 18-FDG-PET/CT failed to predict the outcome in diffuse large B-cell lymphoma patients treated at the diagnosis with rituximab-CHOP. Blood 2012, 119, 2066–2073. [Google Scholar] [CrossRef]
  17. Verhoef, G.; Spaepen, K.; Stroobants, S.; Dupont, P.; Vandenberghe, P.; Thomas, J.; de Groot, T.; Balzarini, J.; De Wolf-Peeters, C.; Mortelmans, L.; et al. Early restaging positron emission tomography with 18F-fluorodeoxyglucose predicts outcome in patients with aggressive non-Hodgkin’s lymphoma. Ann. Oncol. 2002, 13, 1356–1363. [Google Scholar]
  18. Cottereau, A.S.; Hapdey, S.; Chartier, L.; Modzelewski, R.; Casasnovas, O.; Itti, E.; Tilly, H.; Vera, P.; Meignan, M.A.; Becker, S. Baseline total metabolic tumor volume measured with fixed or different adaptive thresholding methods equally predicts outcome in peripheral T cell lymphoma. J. Nucl. Med. 2017, 58, 276–281. [Google Scholar] [CrossRef]
  19. Dupuis, J.; Berriolo-Riedinger, A.; Julian, A.; Brice, P.; Tychyj-Pinel, C.; Tilly, H.; Mounier, N.; Gallamini, A.; Feugier, P.; Soubeyran, P.; et al. Impact of [18F]fluorodeoxyglucose positron emission tomography response evaluation in patients with high-tumor burden follicular lymphoma treated with immunochemotherapy: A prospective study from the Groupe d’Etudes des Lymphomes de l’Adulte and GOELAMS. J. Clin. Oncol. 2012, 30, 4317–4322. [Google Scholar] [CrossRef]
  20. Bodden, J.; Sun, D.; Joseph, G.B.; Huang, L.W.; Andreadis, C.; Hughes-Fulford, M.; Lang, T.F.; Link, T.M. Identification of non-Hodgkin lymphoma patients at risk for treatment-related vertebral density loss and fractures. Osteoporos. Int. 2021, 32, 281–291. [Google Scholar] [CrossRef]
  21. Cabanillas, M.E.; Lu, H.; Fang, S.; Du, X.L. Elderly patients with non-Hodgkin lymphoma who receive chemotherapy are at higher risk for osteoporosis and fractures. Leuk. Lymphoma 2007, 48, 1514–1521. [Google Scholar] [CrossRef] [PubMed]
  22. Paccou, J.; Merlusca, L.; Henry-Desailly, I.; Parcelier, A.; Gruson, B.; Royer, B.; Charbonnier, A.; Ursu, D.; Desailloud, R.; Garidi, R.; et al. Alterations in bone mineral density and bone turnover markers in newly diagnosed adults with lymphoma receiving chemotherapy: A 1-year prospective pilot study. Ann. Oncol. 2014, 25, 481–486. [Google Scholar] [CrossRef] [PubMed]
  23. Svendsen, P.; Shekhrajka, N.; Nielsen, K.L.; Vestergaard, P.; Poulsen, M.Ø.; Vistisen, A.K.; Munksgaard, P.S.; Severinsen, M.T.; Jensen, P.; Johnsen, H.E.; et al. R-CHOP(-like) treatment of diffuse large B-cell lymphoma significantly reduces CT-assessed vertebral bone density: A single center study of 111 patients. Leuk. Lymphoma 2017, 58, 1105–1113. [Google Scholar] [CrossRef] [PubMed]
  24. Anargyrou, K.; Fotiou, D.; Vassilakopoulos, T.P.; Christoulas, D.; Makras, P.; Dimou, M.; Ntanasis-Stathopoulos, I.; Masouridou, S.; Angelopoulou, M.K.; Papatheodorou, A.; et al. Low Bone Mineral Density and High Bone Turnover in Patients With Non-Hodgkin’s Lymphoma (NHL) Who Receive Frontline Therapy: Results of a Multicenter Prospective Study. Hemasphere 2019, 3, e303. [Google Scholar] [CrossRef]
  25. Xiao, D.Y.; Luo, S.; O’Brian, K.; Ganti, A.; Riedell, P.; Sanfilippo, K.M.; Lynch, R.C.; Liu, W.; Carson, K.R. Impact of sarcopenia on treatment tolerance in United States veterans with diffuse large B-cell lymphoma treated with CHOP-based chemotherapy. Am. J. Hematol. 2016, 91, 1002–1007. [Google Scholar] [CrossRef]
  26. Montoto, S.; Fitzgibbon, J. Transformation of indolent B-cell lymphomas. J. Clin. Oncol. 2011, 29, 1827–1834. [Google Scholar] [CrossRef]
  27. Chihara, D.; Oki, Y.; Onoda, H.; Taji, H.; Yamamoto, K.; Tamaki, T.; Morishima, Y. High maximum standard uptake value (SUVmax) on PET scan is associated with shorter survival in patients with diffuse large B cell lymphoma. Int. J. Hematol. 2011, 93, 502–508. [Google Scholar] [CrossRef]
  28. Ceriani, L.; Milan, L.; Cascione, L.; Gritti, G.; Dalmasso, F.; Esposito, F.; Pirosa, M.C.; Schär, S.; Bruno, A.; Dirnhofer, S.; et al. Generation and validation of a PET radiomics model that predicts survival in diffuse large B cell lymphoma treated with R-CHOP14: A SAKK 38/07 trial post-hoc analysis. Hematol. Oncol. 2022, 40, 11–21. [Google Scholar] [CrossRef]
  29. Kim, C.Y.; Hong, C.M.; Kim, D.H.; Son, S.H.; Jeong, S.Y.; Lee, S.W.; Lee, J.; Ahn, B.-C. Prognostic value of whole-body metabolic tumour volume and total lesion glycolysis measured on 18F-FDG PET/CT in patients with extranodal NK/T-cell lymphoma. Eur. J. Nucl. Med. Mol. Imaging 2013, 40, 1321–1329. [Google Scholar] [CrossRef]
  30. Ceriani, L.; Martelli, M.; Zinzani, P.L.; Andr’, A.; Ferreri, A.J.M.; Botto, B.; Stelitano, C.; Gotti, M.; Cabras, M.G.; Rigacci, L.; et al. Utility of baseline 18FDG-PET/CT functional parameters in defining prognosis of primary mediastinal (thymic) large B-cell lymphoma. Blood 2015, 126, 950–956. [Google Scholar] [CrossRef]
  31. Sawyer, D.B.; Peng, X.; Chen, B.; Pentassuglia, L.; Lim, C.C. Mechanisms of anthracycline cardiac injury: Can we identify strategies for cardioprotection? Prog. Cardiovasc. Dis. 2010, 53, 105–113. [Google Scholar] [CrossRef]
  32. Compston, J. Glucocorticoid-induced osteoporosis: An update. Endocrine 2018, 61, 7–16. [Google Scholar] [CrossRef] [Green Version]
  33. Chotiyarnwong, P.; McCloskey, E.v. Pathogenesis of glucocorticoid-induced osteoporosis and options for treatment. Nat. Rev. Endocrinol. 2020, 16, 437–447. [Google Scholar] [CrossRef]
  34. Haugeberg, G.; Uhlig, T.; Falch, J.A.; Halse, J.I.; Kvien, T.K. Bone mineral density and frequency of osteoporosis in female patients with rheumatoid arthritis Results from 394 Patients in the Oslo County Rheumatoid Arthritis Register. Arthritis Rheumatol. 2000, 43, 522–530. [Google Scholar] [CrossRef]
  35. Sinigaglia, L.; Nervetti, A.; Mela, Q.; Bianchi, G.; del Puente, A.; di Munno, O.; Frediani, B.; Cantatore, F.; Pellerito, R.; Bartolone, S.; et al. A multicenter cross sectional study on bone mineral density in rheumatoid arthritis. Italian Study Group on Bone Mass in Rheumatoid Arthritis. J. Rheumatol. 2000, 27, 2582–2589. [Google Scholar]
  36. Gravallese, E.M.; Goldring, S.R. Cellular mechanisms and the role of cytokines in bone erosions in rheumatoid arthritis. Arthritis Rheumatol. 2000, 43, 2143–2151. [Google Scholar] [CrossRef]
  37. Kong, Y.; Feige, U.; Sarosi, I.; Bolon, B.; Tafuri, A.; Morony, S.; Capparelli, C.; Li, J.; Elliott, R.; McCabe, S.; et al. Activated T cells regulatebone loss and joint destructionin adjuvant arthritis throughosteoprotegerin ligand. Nature 1999, 402, 304–309. [Google Scholar] [CrossRef]
  38. Boyce, B.F.; Xing, L. Functions of RANKL/RANK/OPG in bone modeling and remodeling. Arch. Biochem. Biophys. 2008, 473, 139–146. [Google Scholar] [CrossRef]
  39. Taxel, P.; Kaneko, H.; Lee, S.K.; Aguila, H.L.; Raisz, L.G.; Lorenzo, J.A. Estradiol rapidly inhibits osteoclastogenesis and RANKL expression in bone marrow cultures in postmenopausal women: A pilot study. Osteoporos. Int. 2008, 19, 193–199. [Google Scholar] [CrossRef]
  40. Teitelbaum, S.L. Postmenopausal osteoporosis, T cells, and immune dysfunction. Proc. Natl. Acad. Sci. USA 2004, 101, 16711–16712. [Google Scholar] [CrossRef]
  41. Zhang, Y.H.; Heulsmann, A.; Tondravi, M.M.; Mukherjee, A.; Abu-Amer, Y. Tumor necrosis factor-α (TNF) stimulates RANKL-induced osteoclastogenesis via coupling of TNF type 1 receptor and RANK signaling pathways. J. Biol. Chem. 2001, 276, 563–568. [Google Scholar] [CrossRef] [PubMed]
  42. O’Gradaigh, D.; Ireland, D.; Bord, S.; Compston, J.E. Joint erosion in rheumatoid arthritis: Interactions between tumour necrosis factor α, interleukin 1, and receptor activator of nuclear factor κB ligand (RANKL) regulate osteoclasts. Ann. Rheum. Dis. 2004, 63, 354–359. [Google Scholar] [CrossRef] [PubMed]
  43. Wang, T.; Yu, X.; He, C. Pro-inflammatory Cytokines: Cellular and Molecular Drug Targets for Glucocorticoid-induced-osteoporosis via Osteocyte. Curr. Drug Targets 2019, 20, 1–15. [Google Scholar] [CrossRef] [PubMed]
  44. Charbonneau, B.; Maurer, M.J.; Ansell, S.M.; Slager, S.L.; Fredericksen, Z.S.; Ziesmer, S.C.; Macon, W.R.; Habermann, T.M.; Witzig, T.E.; Link, B.K.; et al. Pretreatment circulating serum cytokines associated with follicular and diffuse large B-cell lymphoma: A clinic-based case-control study. Cytokine 2012, 60, 882–889. [Google Scholar] [CrossRef]
  45. Duletić-Načinović, A.; Sever-Prebelić, M.; Štifter, S.; Jonjić, N.; Hasan, M.; Labar, B. Interleukin-6 in Patients with Aggressive and Indolent Non-Hodgkin’s Lymphoma: A Predictor of Prognosis? Clin. Oncol. 2006, 18, 367–368. [Google Scholar] [CrossRef]
  46. Hong, J.T.; Son, D.J.; Lee, C.K.; Yoon, D.Y.; Lee, D.H.; Park, M.H. Interleukin 32, inflammation and cancer. Pharmacol. Ther. 2017, 174, 127–137. [Google Scholar] [CrossRef]
  47. Khalifa, K.A.; Alkilani, A.A.; Ismail, H.; Soliman, M.A. Evaluation of some biochemical markers as prognostic factors in malignant lymphoma. J. Egypt. Natl. Cancer Inst. 2008, 20, 47–54. [Google Scholar]
  48. Aschebrook-Kilfoy, B.; Zheng, T.; Foss, F.; Ma, S.; Han, X.; Lan, Q.; Holford, T.; Chen, Y.; Leaderer, B.; Rothman, N.; et al. Polymorphisms in immune function genes and non-Hodgkin lymphoma survival. J. Cancer Surviv. 2012, 6, 102–114. [Google Scholar] [CrossRef]
  49. Mozas, P.; Rivas-Delgado, A.; Rivero, A.; Dlouhy, I.; Nadeu, F.; Balagué, O.; González-Farré, B.; Baumann, T.; Giné, E.; Delgado, J.; et al. High serum levels of IL-2R, IL-6, and TNF-α are associated with higher tumor burden and poorer outcome of follicular lymphoma patients in the rituximab era. Leuk. Res. 2020, 94, 106371. [Google Scholar] [CrossRef]
  50. Fayad, L.; Cabanillas, F.; Talpaz, M.; Mclaughlin, P.; Kurzrock, R. High serum interleukin-6 levels correlate with a shorter failure-free survival in indolent lymphoma. Leuk. Lymphoma 1998, 30, 563–571. [Google Scholar] [CrossRef]
  51. Niederer, D.; Schmidt, K.; Vogt, L.; Egen, J.; Klingler, J.; Hübscher, M.; Thiel, C.; Bernhörster, M.; Banzer, W. Functional capacity and fear of falling in cancer patients undergoing chemotherapy. Gait Posture 2014, 39, 865–869. [Google Scholar] [CrossRef]
  52. Richardson, J.K.; Hurvitz, E.A. Peripheral Neuropathy: A True Risk Factor for Falls. J. Gerontol. Ser. A Biol. Sci. Med. Sci. 1995, 50, M211–M215. [Google Scholar] [CrossRef]
  53. Anagnostis, P.; Athyros, V.G.; Tziomalos, K.; Karagiannis, A.; Mikhailidis, D.P. The pathogenetic role of cortisol in the metabolic syndrome: A hypothesis. J. Clin. Endocrinol. Metab. 2009, 94, 2692–2701. [Google Scholar] [CrossRef]
  54. Collins, L.; Ann Zarzabal, L.; Nayiager, T.; Pollock, B.H.; Barr, R.D. Growth in Children with Acute Lymphoblastic Leukemia during Treatment. J. Pediatr. Hematol. Oncol. 2010, 32, e304–e307. [Google Scholar] [CrossRef]
  55. Mckay, L.I.; Cidlowski, J.A. Molecular Control of Immune/Inflammatory Responses: Interactions between Nuclear Factor-B and Steroid Receptor-Signaling Pathways. Endocr. Rev. 1999, 20, 435–459. [Google Scholar]
  56. Oakley, R.H.; Sar, M.; Cidlowski, J.A. The human glucocorticoid receptor β isoform: Expression, biochemical properties, and putative function. J. Biol. Chem. 1996, 271, 9550–9559. [Google Scholar] [CrossRef]
  57. Starkie, R.L.; Arkinstall, M.J.; Koukoulas, I.; Hawley, J.A.; Febbraio, M.A. Carbohydrate ingestion attenuates the increase in plasma interleukin-6, but not skeletal muscle interleukin-6 mRNA, during exercise in humans. J. Physiol. 2001, 533 Pt 2, 585–591. [Google Scholar] [CrossRef]
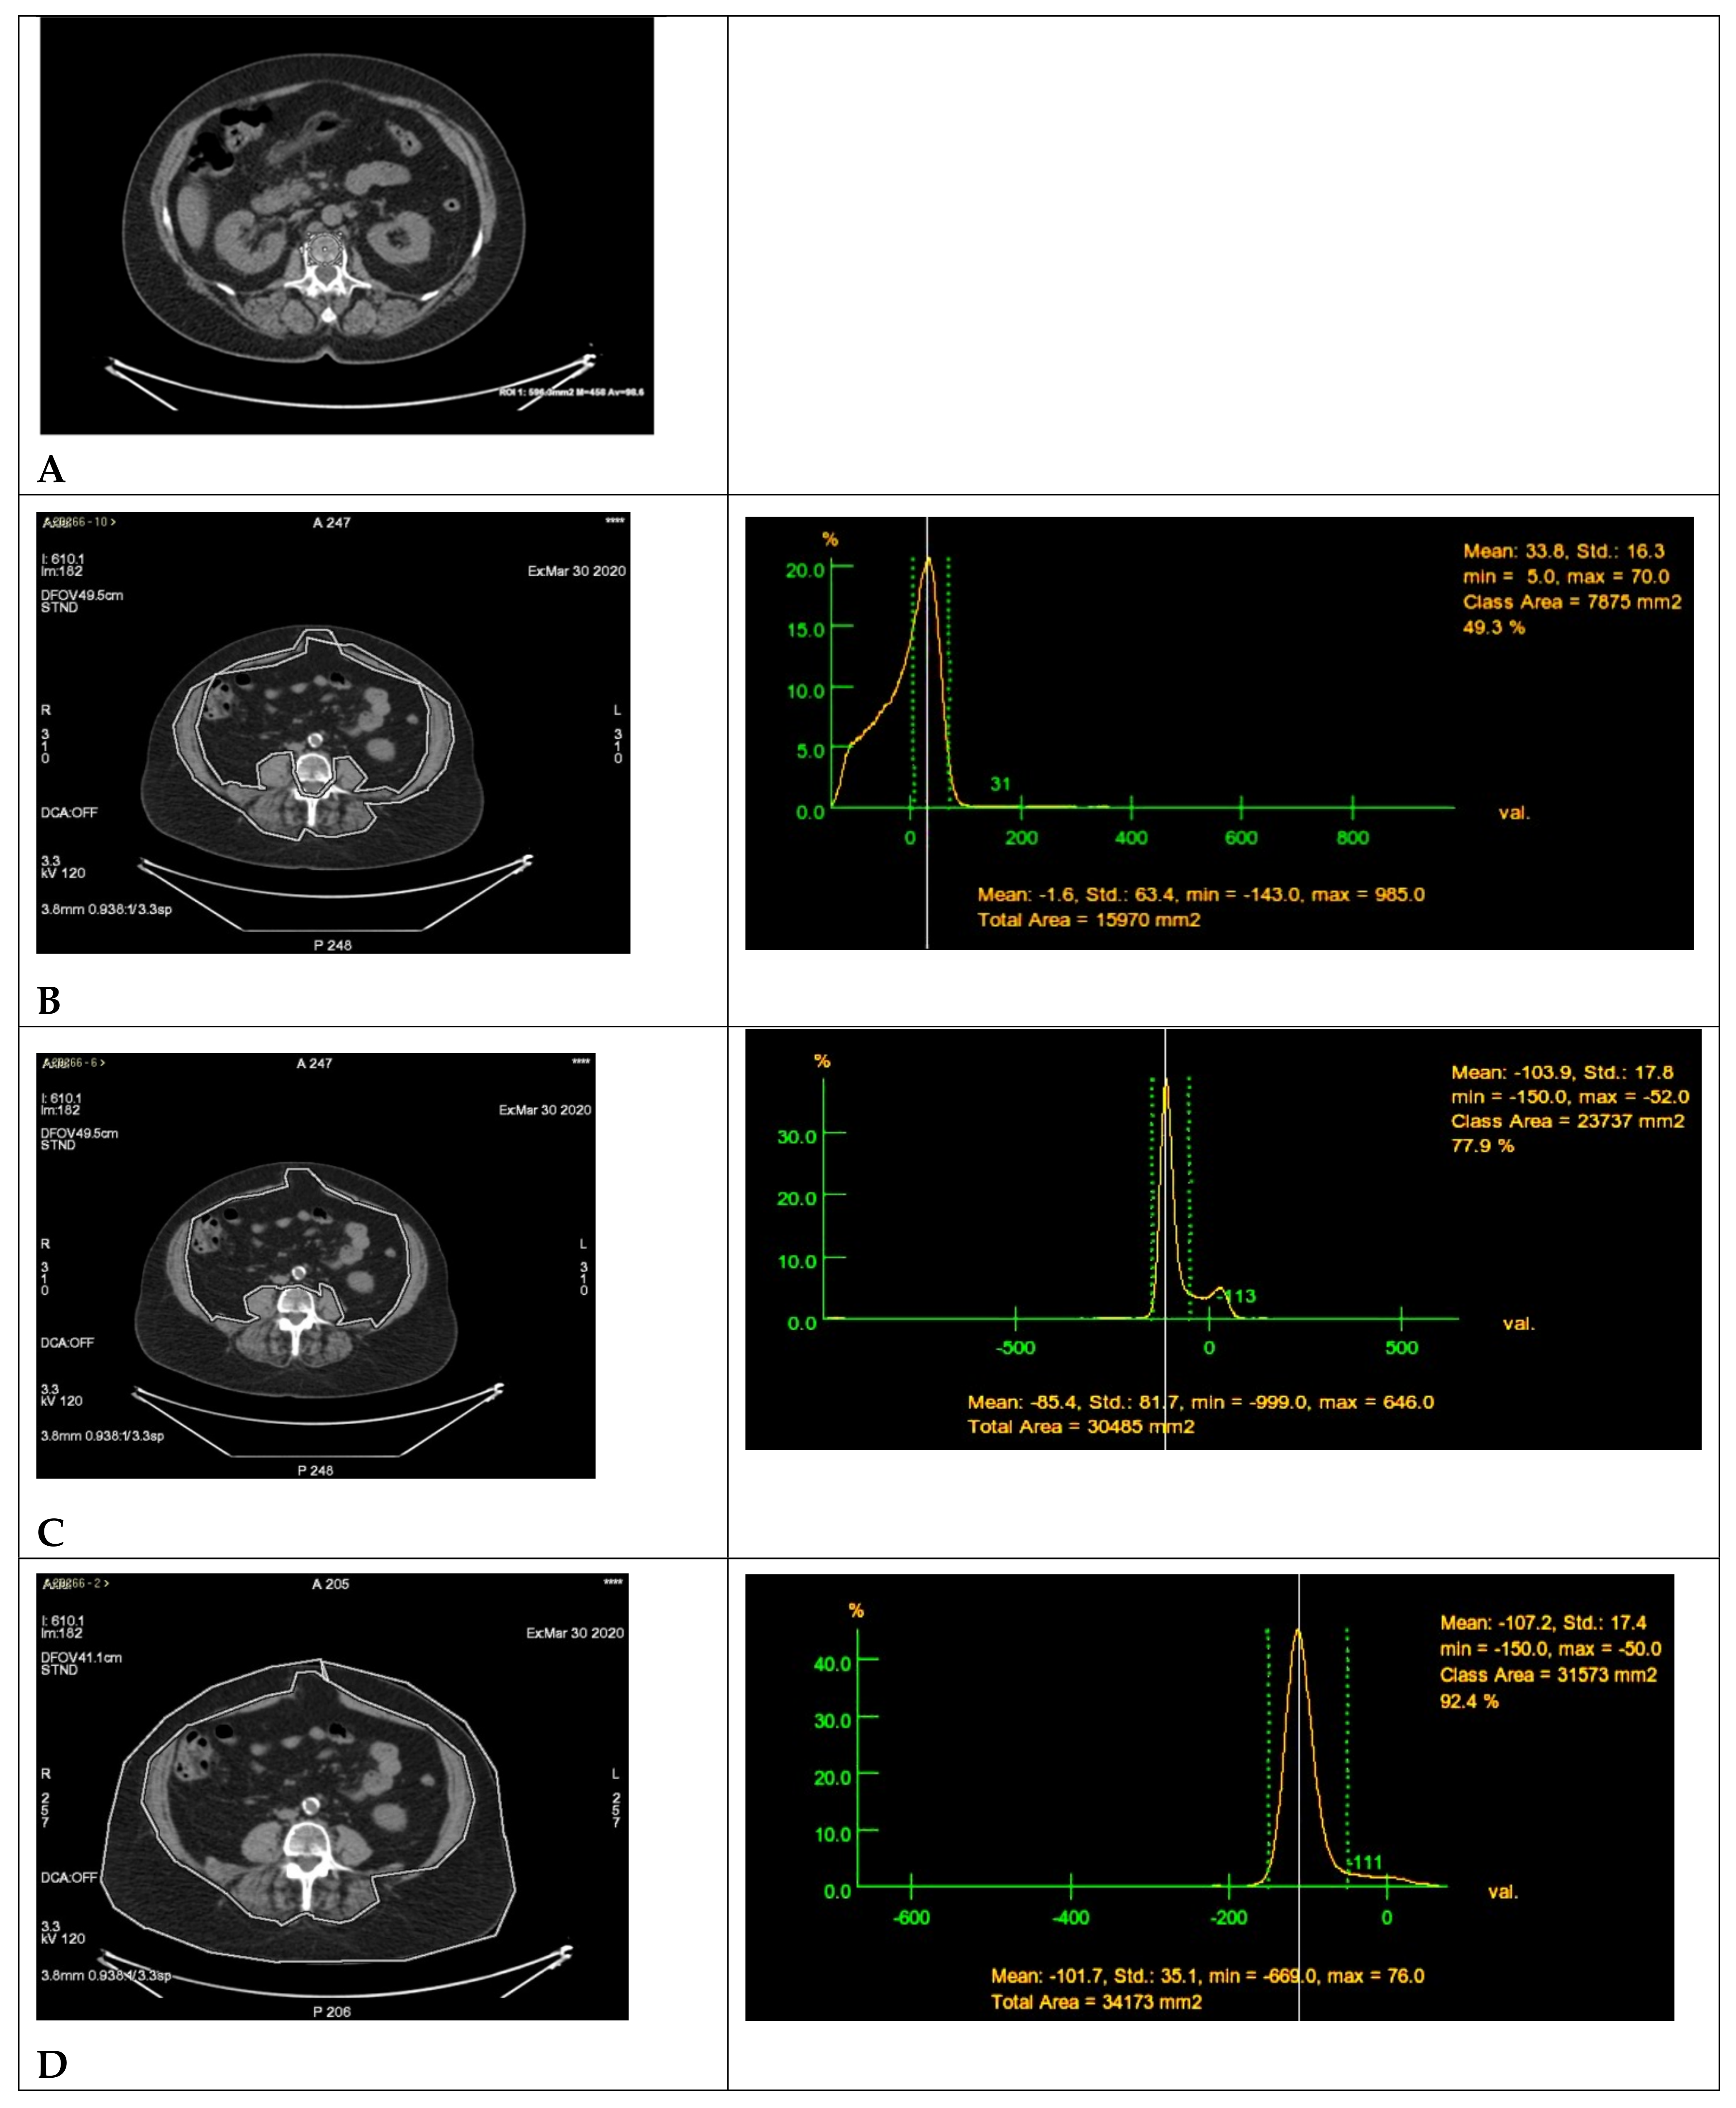
Figure 1. (A) BMD L1: BMD was measured in Hounsfield Units (HUs) and calculated with the Low-dose CT co-registration PET scan slice passing through the middle III of the L1 soma, placing an ROI with an area of approximately 600 mm2. (B) SMA L3: Low-dose CT co-registration PET scan with the slice passing through the middle III of L3 soma (on the left) and the ROI tissue density percent trend graphic (on the right) extrapolated using GE Adw Cross X software on a dedicated workstation (ADVANTAGE WORKSTATION 4.4. GE MEDICAL SYSTEMS). The SMA (measured in mm2, then converted to cm2) was calculated by drawing a freehand ROI at the slice through the middle III of the L3 soma including all abdominal, lumbar, and paravertebral muscles and selecting, within the aforementioned ROI, only those tissues that had muscle density. In the case shown, the SMA is 7875 mm2, represented in the graphic as the area of tissue with density range between the two green dotted lines (maximum density of 70 HU, minimum density of 5 HU), with mean density of 33.8 HU (white line). (C) VAT L3: Low-dose CT co-registration PET scan at the slice passing through the middle III of L3 soma (on the left) and the ROI tissue density percent trend graphic (on the right) extrapolated using GE Adw Cross X software on a dedicated workstation (ADVANTAGE WORKSTATION 4.4. GE MEDICAL SYSTEMS). The VATA (measured in mm2 then converted to cm2) was measured by drawing a free-hand ROI at the slice through the middle III of the L3 soma, which included the abdominal region, excluding the abdominal muscle region and the SAT and selecting, within the aforementioned ROI, only tissues with fat density. In the case shown, the VATA is 23,737 mm2, represented in the graphic as the area of tissue with density range between the two green dotted lines (maximum density of −150 HU, minimum density of −52 HU), with mean density of −103.9 HU (white line). (D) SAT L3: Low-dose CT co-registration PET scan at the slice passing through the middle III of L3 soma (on the left) and the ROI tissue density percent trend graphic (on the right) extrapolated using GE Adw Cross X software on a dedicated workstation (ADVANTAGE WORKSTATION 4.4. GE MEDICAL SYSTEMS). The SATA (measured in mm2, then converted to cm2) was measured by drawing a freehand ROI at the slice through the middle III of the L3 soma, which included the abdominal wall tissues external to the abdominal muscle region and selecting, within the aforementioned ROI, those with adipose density. In the case shown, the SATA is 31,573 mm2, represented in the graphic as the area of tissue with density range between the two green dotted lines (maximum density of −150 HU, minimum density of −50 HU), with mean density of −107.2 HU (white line).
Cancers 15 00999 g001
Figure 2. Boxplot of BMD, PMD, SMA, SAT, and VAT at baseline and after chemotherapy.
Cancers 15 00999 g002
Figure 3. Graphical representation of “delta” mean values stratified by R-CHOP vs. R-Bendamustine therapy.
Cancers 15 00999 g003
Figure 4. Prediction analysis of radiomic parameters and the outcomes of patients with low or high FLIPI Scores.
Cancers 15 00999 g004
Figure 5. Analysis of PFS according to FLIPI Score (A) and BMD Cut-off (B).
Cancers 15 00999 g005
Table 1. Presentation characteristics stratified by R-CHOP vs. R-Bendamustine therapy.
Population (n = 79)R-CHOP (n = 48)R-Bendamustine (n = 31)p-Value
Median age, years (range)66 (52–77)70 (59–81)0.058
Male:Female ratio0.7 (20:28)1.4 (18:13)0.154
Median height, cm± SD (range)166.3 ± 9.1 (150.0–189.0)167.5 ± 7.9 (150.0–184.0)0.556
Median height, cm ± SD (range)-Male170.5 ± 7.5 (162.0–189.0)172.0 ± 5.7 (160.0–184.0)0.652
Median height, cm ± SD (range)-Female162.0 ± 6.8 (150.0–173.0)160.0 ± 6.4 (150.0–172.0)0.988
Median weight, Kg± SD (range)75.8 ± 21.2 (48.0–187.0)72.0 ± 14.2 (48.0–97.0)0.380
Median weight, Kg ± SD (range)-Male79.5 ± 13.0 (65.0–121.0)77.5 ± 12.5 (60.0–97.0)0.810
Median weight, Kg ± SD (range)-Female66.5 ± 25.3 (48.0–187.0)63.0 ± 10.4 (48.0–80.0)0.133
Median BMI± SD (range)22.8 ± 6.3 (16.0–56.7)21.4 ± 3.8 (14.8–28.8)0.510
Median BMI ± SD (range)-Male22.6 ± 3.4 (19.7–34.0)22.7 ± 3.7 (17.1–28.8)0.915
Median BMI ± SD (range)-Female20.0 ± 7.8 (16.0–56.7)19.9 ± 2.8 (14.8–24.4)0.161
Grading
G14.2% (2/47)16.1% (5/31)0.241
G1-G214.9% (7/47)16.1% (5/31)
G249.0% (23/47)42.0% (13/31)
G2-G3A6.4% (3/47)12.9% (4/31)
G3A25.5% (12/47)12.9% (4/31)
FLIPI Score
Low2.1% (1/48)9.7% (3/31)0.322
Intermediate58.3% (28/48)54.8% (17/31)
High39.6% (19/48)35.5% (11/31)
SD: Standard deviation; Mann–Whitney test, Student’s t-test, Wilcoxon signed-rank tests, Chi-square test. p < 0.05 significant.
Table 2. Pre–post-therapy radiomic values.
Population (n = 79)R-CHOPR-Bendamustine
Primary EndpointPre-TherapyPost-Therapyp-ValuePre-TherapyPost-Therapyp-Value
Mean ± SD Bone Mineral Density L1 (density/U)632.79 ± 194.99506.94 ± 180.25<0.001632.58 ± 205.80608.39 ± 193.820.060
Mean ± SD Skeletal Muscle Density L3 (density/U)101.38 ± 22.5791.19 ± 25.130.01795.55 ± 22.2092.03 ± 14.350.432
Mean ± SD Skeletal Muscle Area L3 (mm2)13,283.23 ± 3015.1812,200.69 ± 3622.120.00513,501.45 ± 3387.4612,842.10 ± 3001.800.042
Mean ± SD Subcutaneous Adipose Tissue L3 (mm2)19,404.23 ± 10,027.2422,731.52 ± 9839.26<0.00117,935.26 ± 7897.9616,569.84 ± 7601.680.006
Mean ± SD Visceral Adipose Tissue L3 (mm2)16,445.08 ± 7067.2119,388.00 ± 7229.37<0.00118,591.36 ± 9731.3617,557.81 ± 9150.470.053
SD: Standard deviation; Mann–Whitney test, Student’s t-test. p < 0.05 significant.
Table 3. Descriptive characteristics stratified by R-CHOP vs. R-Bendamustine therapy: Radiomics data-delta.
Population (n = 79)R-CHOP (n = 48)R-Bendamustine (n = 31)
Mean ± SD95% CIMean ± SD95% CIp-Value
BMD L1 Delta−125.85±72.64(−146.40−105.30)−24.19±68.84(−48.420.04)<0.001
BMD L1 Delta (%)−20.45±11.05(−23.58−17.32)−2.97±11.51(−7.021.08)<0.001
SMD L3 Delta−10.19±28.48(−18.25−2.13)−3.52±24.56(−12.175.13)0.232
SMD L3 Delta (%)−7.82±24.96(−14.88−0.76)−0.07±24.14(−8.578.43)0.176
SMA L3 Delta (mm2)−1082.54±2541.00(−1801.38−363.70)−659.36±1724.97(−1266.58−52.14)0.641
SMA L3 Delta (%)−7.97±21.70(−14.11−1.83)−3.91±11.15(−7.840.02)0.339
SAT L3 Delta (mm2)3327.29±2792.39(2537.334117.25)−1365.42±2596.55(−2279.46−451.38)<0.001
SAT L3 Delta (%)23.08±24.71(16.0930.07)−7.02±16.28(−12.75−1.29)<0.001
VAT L3 Delta (mm2)2942.92±2692.75(2181.153704.69)−1033.55±2851.65(−2037.39−29.71)<0.001
VAT L3 Delta (%)21.70±21.36(15.6627.74)−3.14±11.20(−7.080.80)<0.001
Abbreviations. SD: Standard deviation; BMD: Bone Mineral Density; SMD: Skeletal Muscle Density; SMA: Skeletal Muscle Area; SAT: Subcutaneous Adipose Tissue; VAT: Visceral Adipose Tissue. SD: Standard deviation; Mann–Whitney test, Student’s t-test. p < 0.05 significant.
Table 4. Prediction analysis of radiomic parameters of patients with low or high FLIPI Scores.
VariableAUC 95% CICut-Off PointSensitivity (%)Specificity (%)Youden’s Indexp Value
BMD0.9480.889–0.99652293.993.30.872<0.001
SAT0.5770.446–0.70725,97693.387.60.2190.537
VAT0.6460.518–0.77416,69370.075.70.6460.042
AUC, area under the ROC curve; 95% CI, 95% confidence interval.
Table 5. Comparison of FLIPI Score and BMD cut-off results of R-CHOP-like vs. R-B therapy.
Population (n = 79)R-CHOPR-Bendamustine
Primary EndpointBMD < 522BMD > 522p-ValueBMD < 522BMD > 522p-Value
FLIPI Score Low (1–2)3.5% (1/29)96.5% (28/29)<0.00115.0% (3/20)85% (17/20)<0.001
FLIPI Score High (≥3)94.7% (18/19)5.3% (1/19) 90.9% (10/11)9.1% (1/11)
BMD: Bone Mineral Density.
Disclaimer/Publisher’s Note: The statements, opinions and data contained in all publications are solely those of the individual author(s) and contributor(s) and not of MDPI and/or the editor(s). MDPI and/or the editor(s) disclaim responsibility for any injury to people or property resulting from any ideas, methods, instructions or products referred to in the content.