
Comprehensive Analysis of Gene Expression Profiling to Explore Predictive Markers for Eradication Therapy Efficacy against Helicobacter pylori-Negative Gastric MALT Lymphoma
 , , , ,
Abstract
Simple Summary
Abstract
1. Introduction
2. Materials and Methods
2.1. Patients
2.2. Evaluation of the API2-MALT1 Chimeric Transcript and Hp Infection
2.3. Therapy Evaluation
2.4. Quantitative Reverse Transcription Polymerase Chain Reaction
2.5. RNA Sequencing
2.6. Analysis Flow
2.7. Statistical Analysis
3. Results
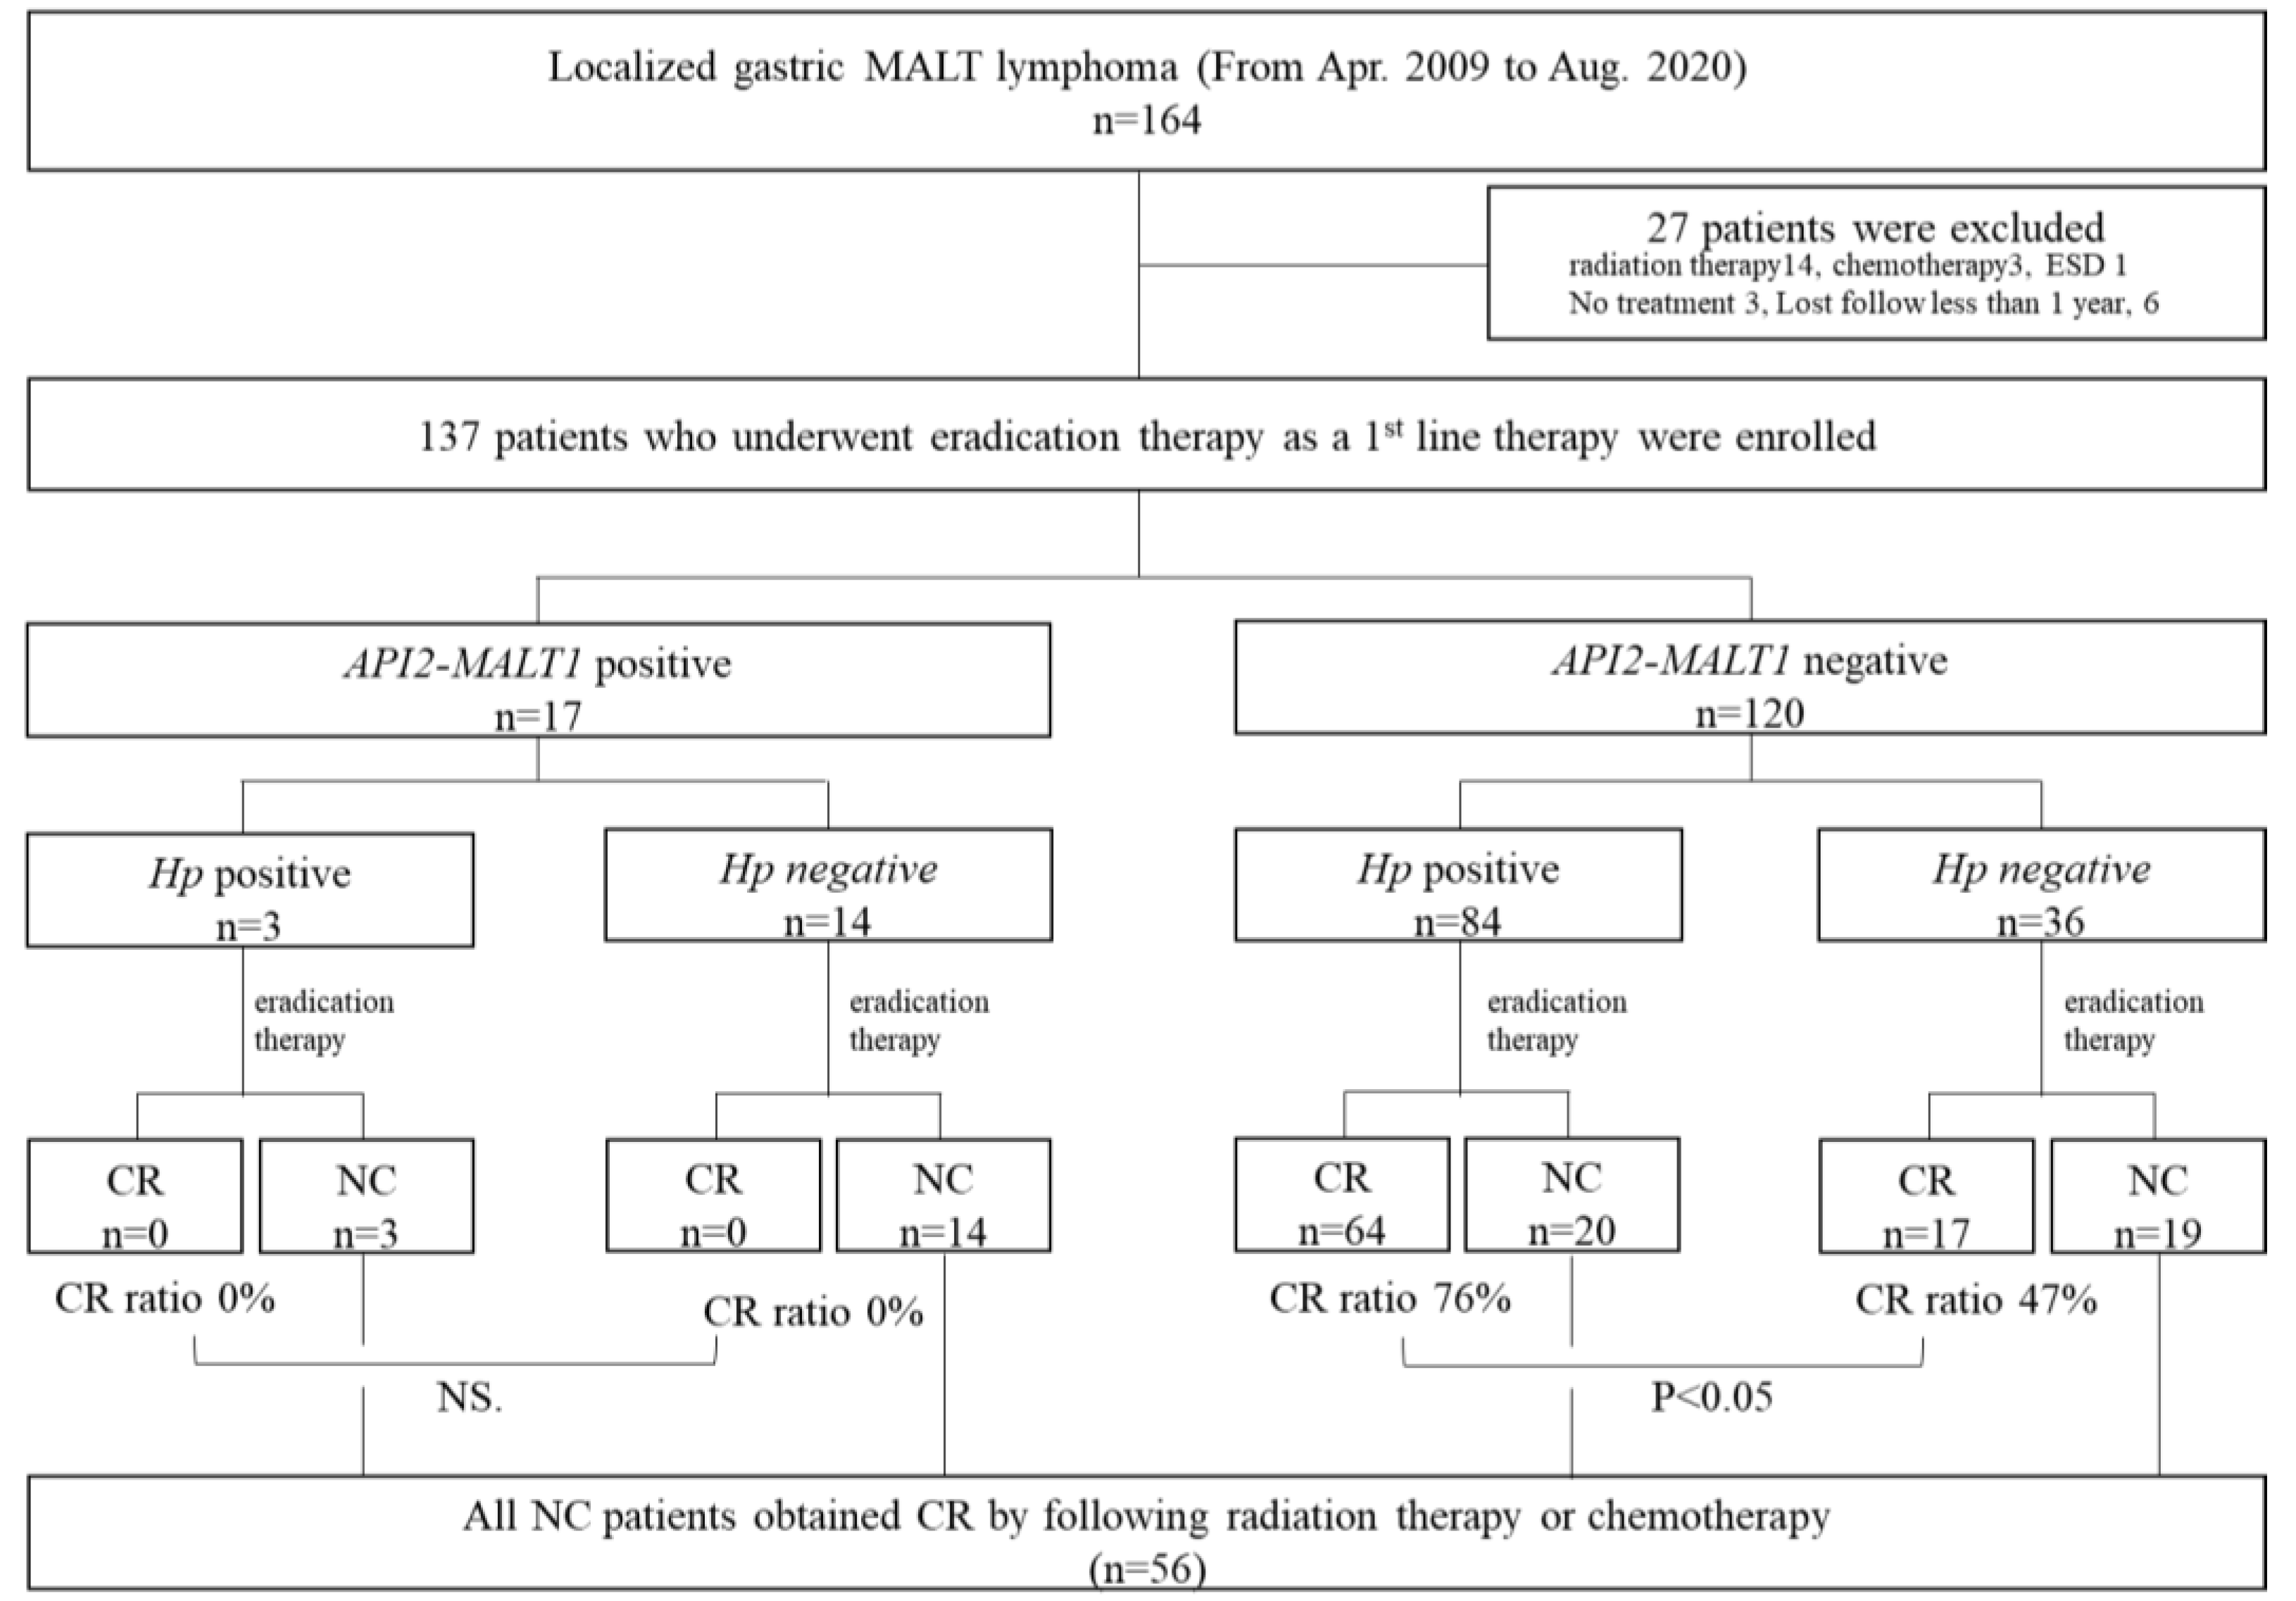
3.1. Patients
3.2. Treatment Outcomes by Eradication Therapy According to API2-MALT1 Chimeric Transcript Status and Hp Infection Status
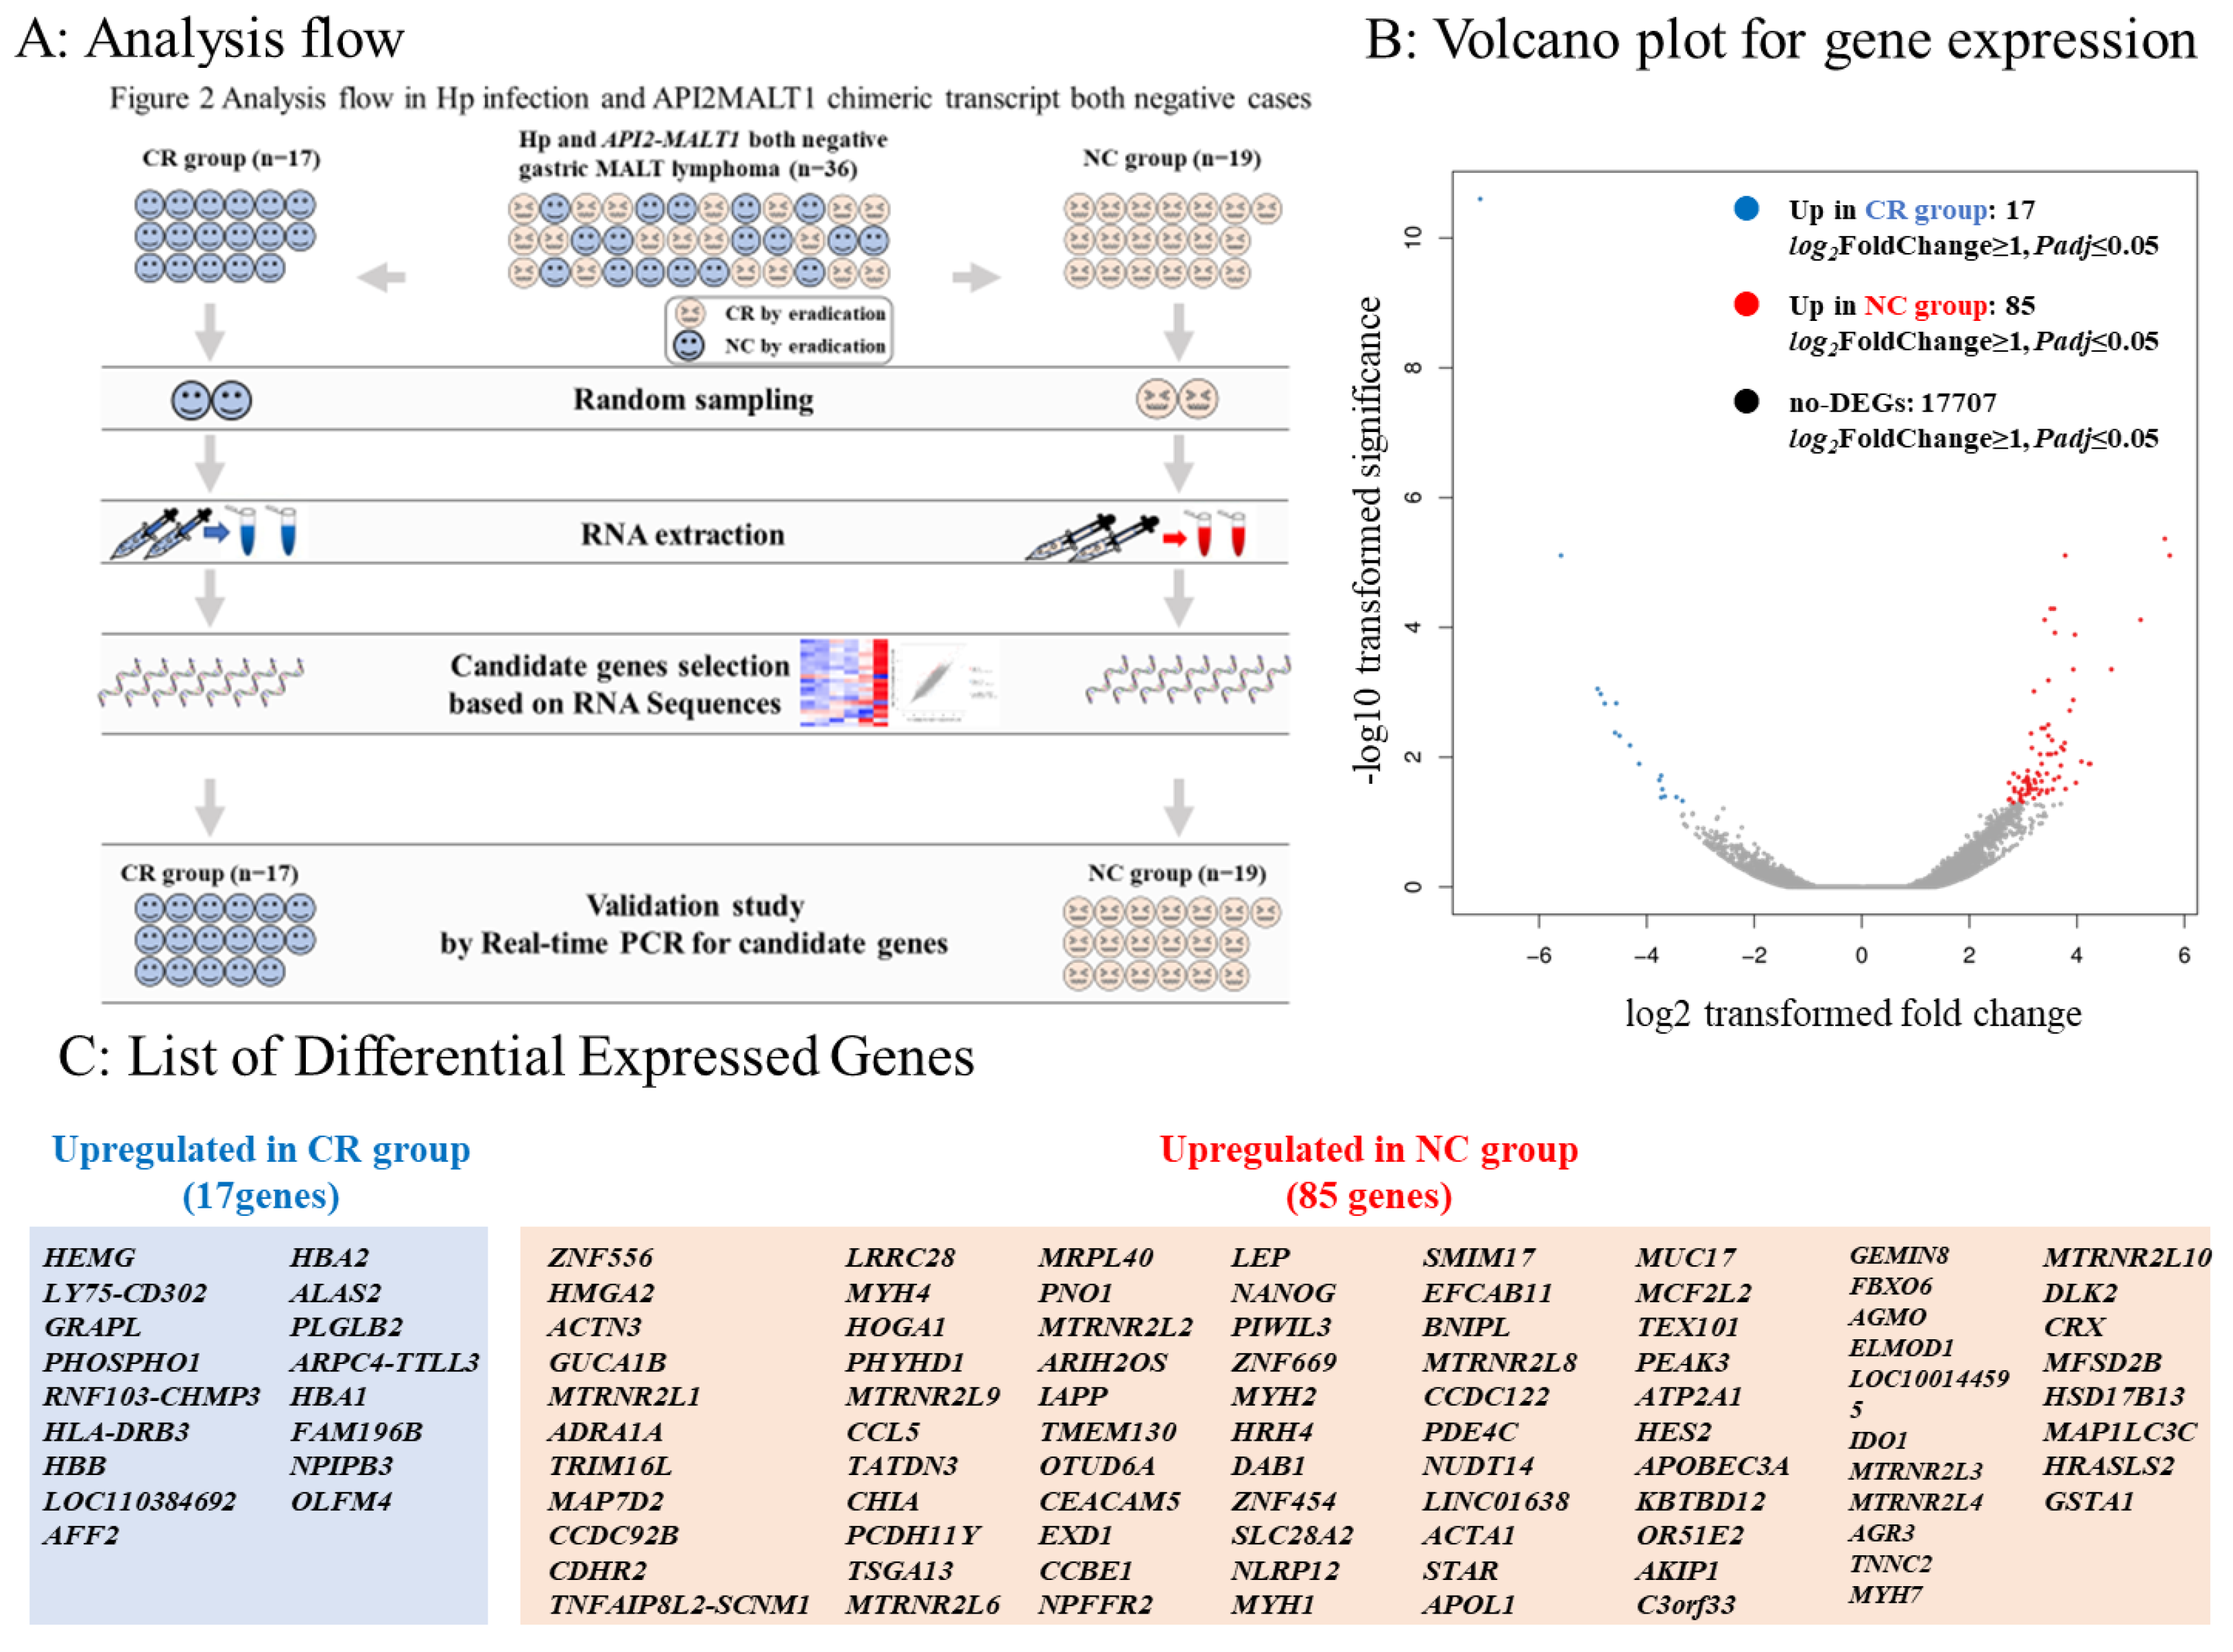
3.3. Comparison between the CR and NC Groups in Gastric MALT Lymphomas Negative for Both Hp and the API2-MALT1 Chimeric Transcript
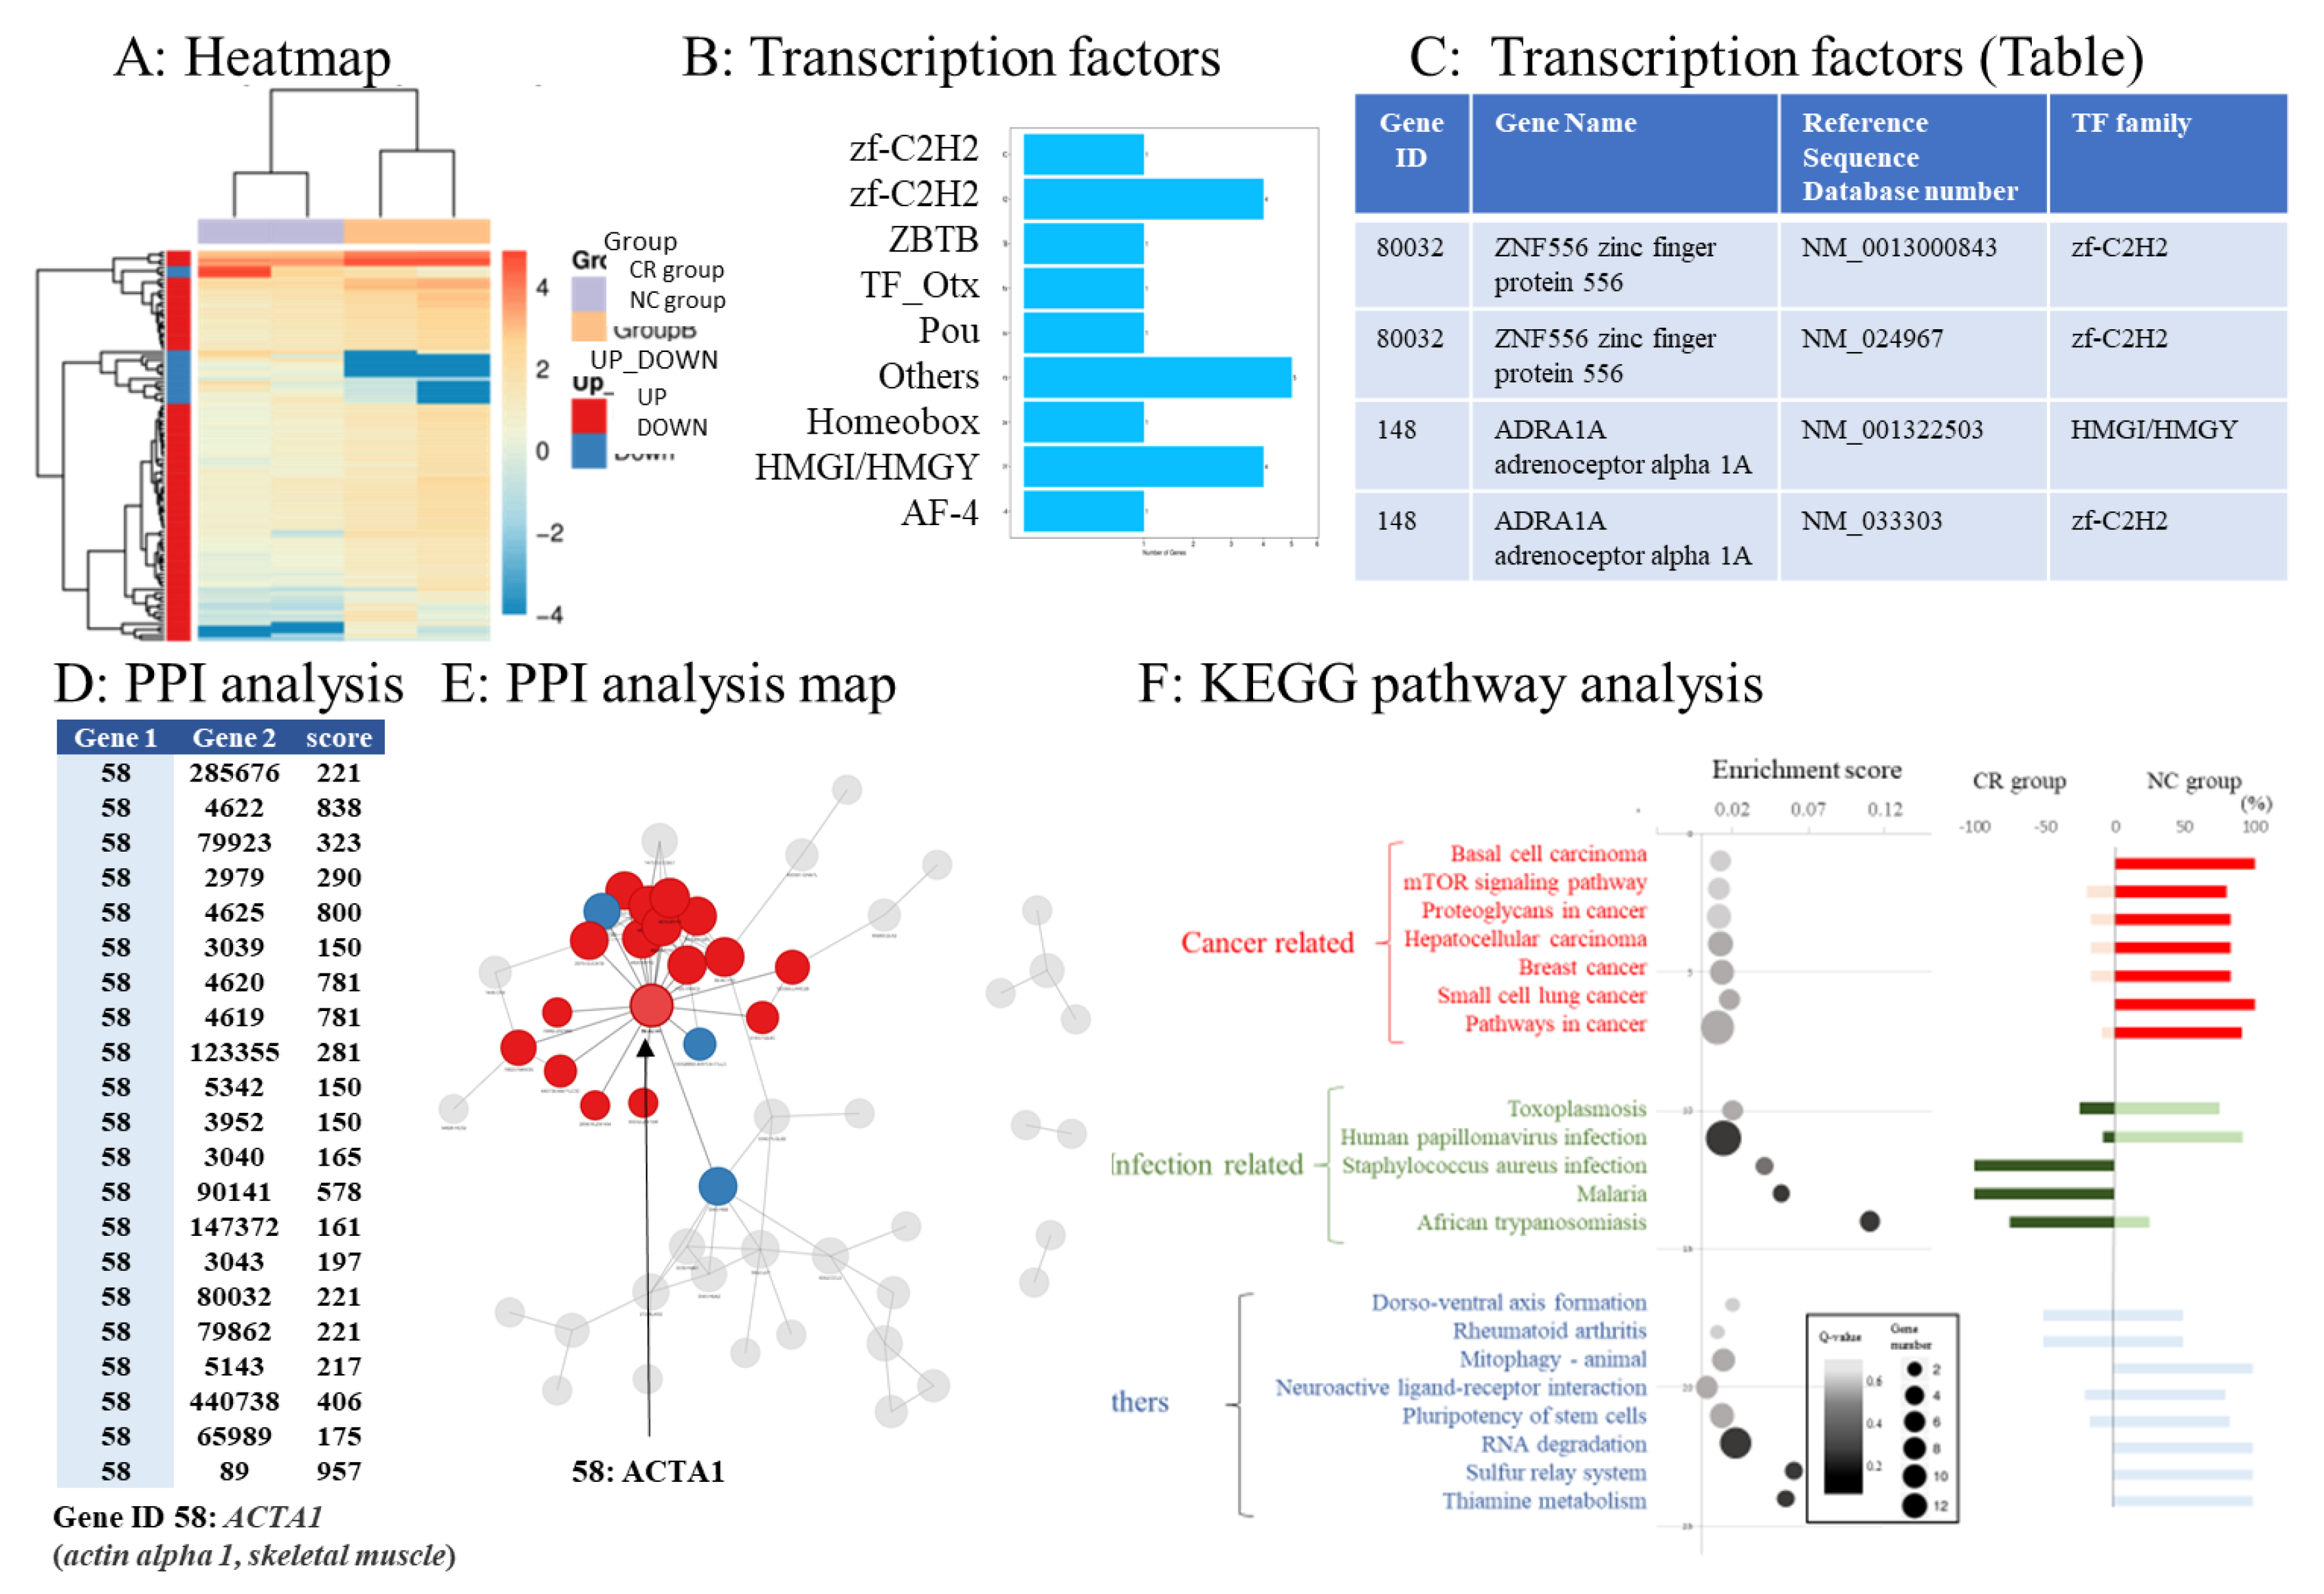
3.4. DEGs in Comparison between CR and NC Groups in RNA Sequences
3.5. Transcription Factor Prediction of DEGs
3.6. Protein–Protein Interaction Networks of DEGs
3.7. Pathway Analysis of DEGs
3.8. Predictive Markers for Eradication Therapy against Hp-Negative Gastric MALT Lymphoma
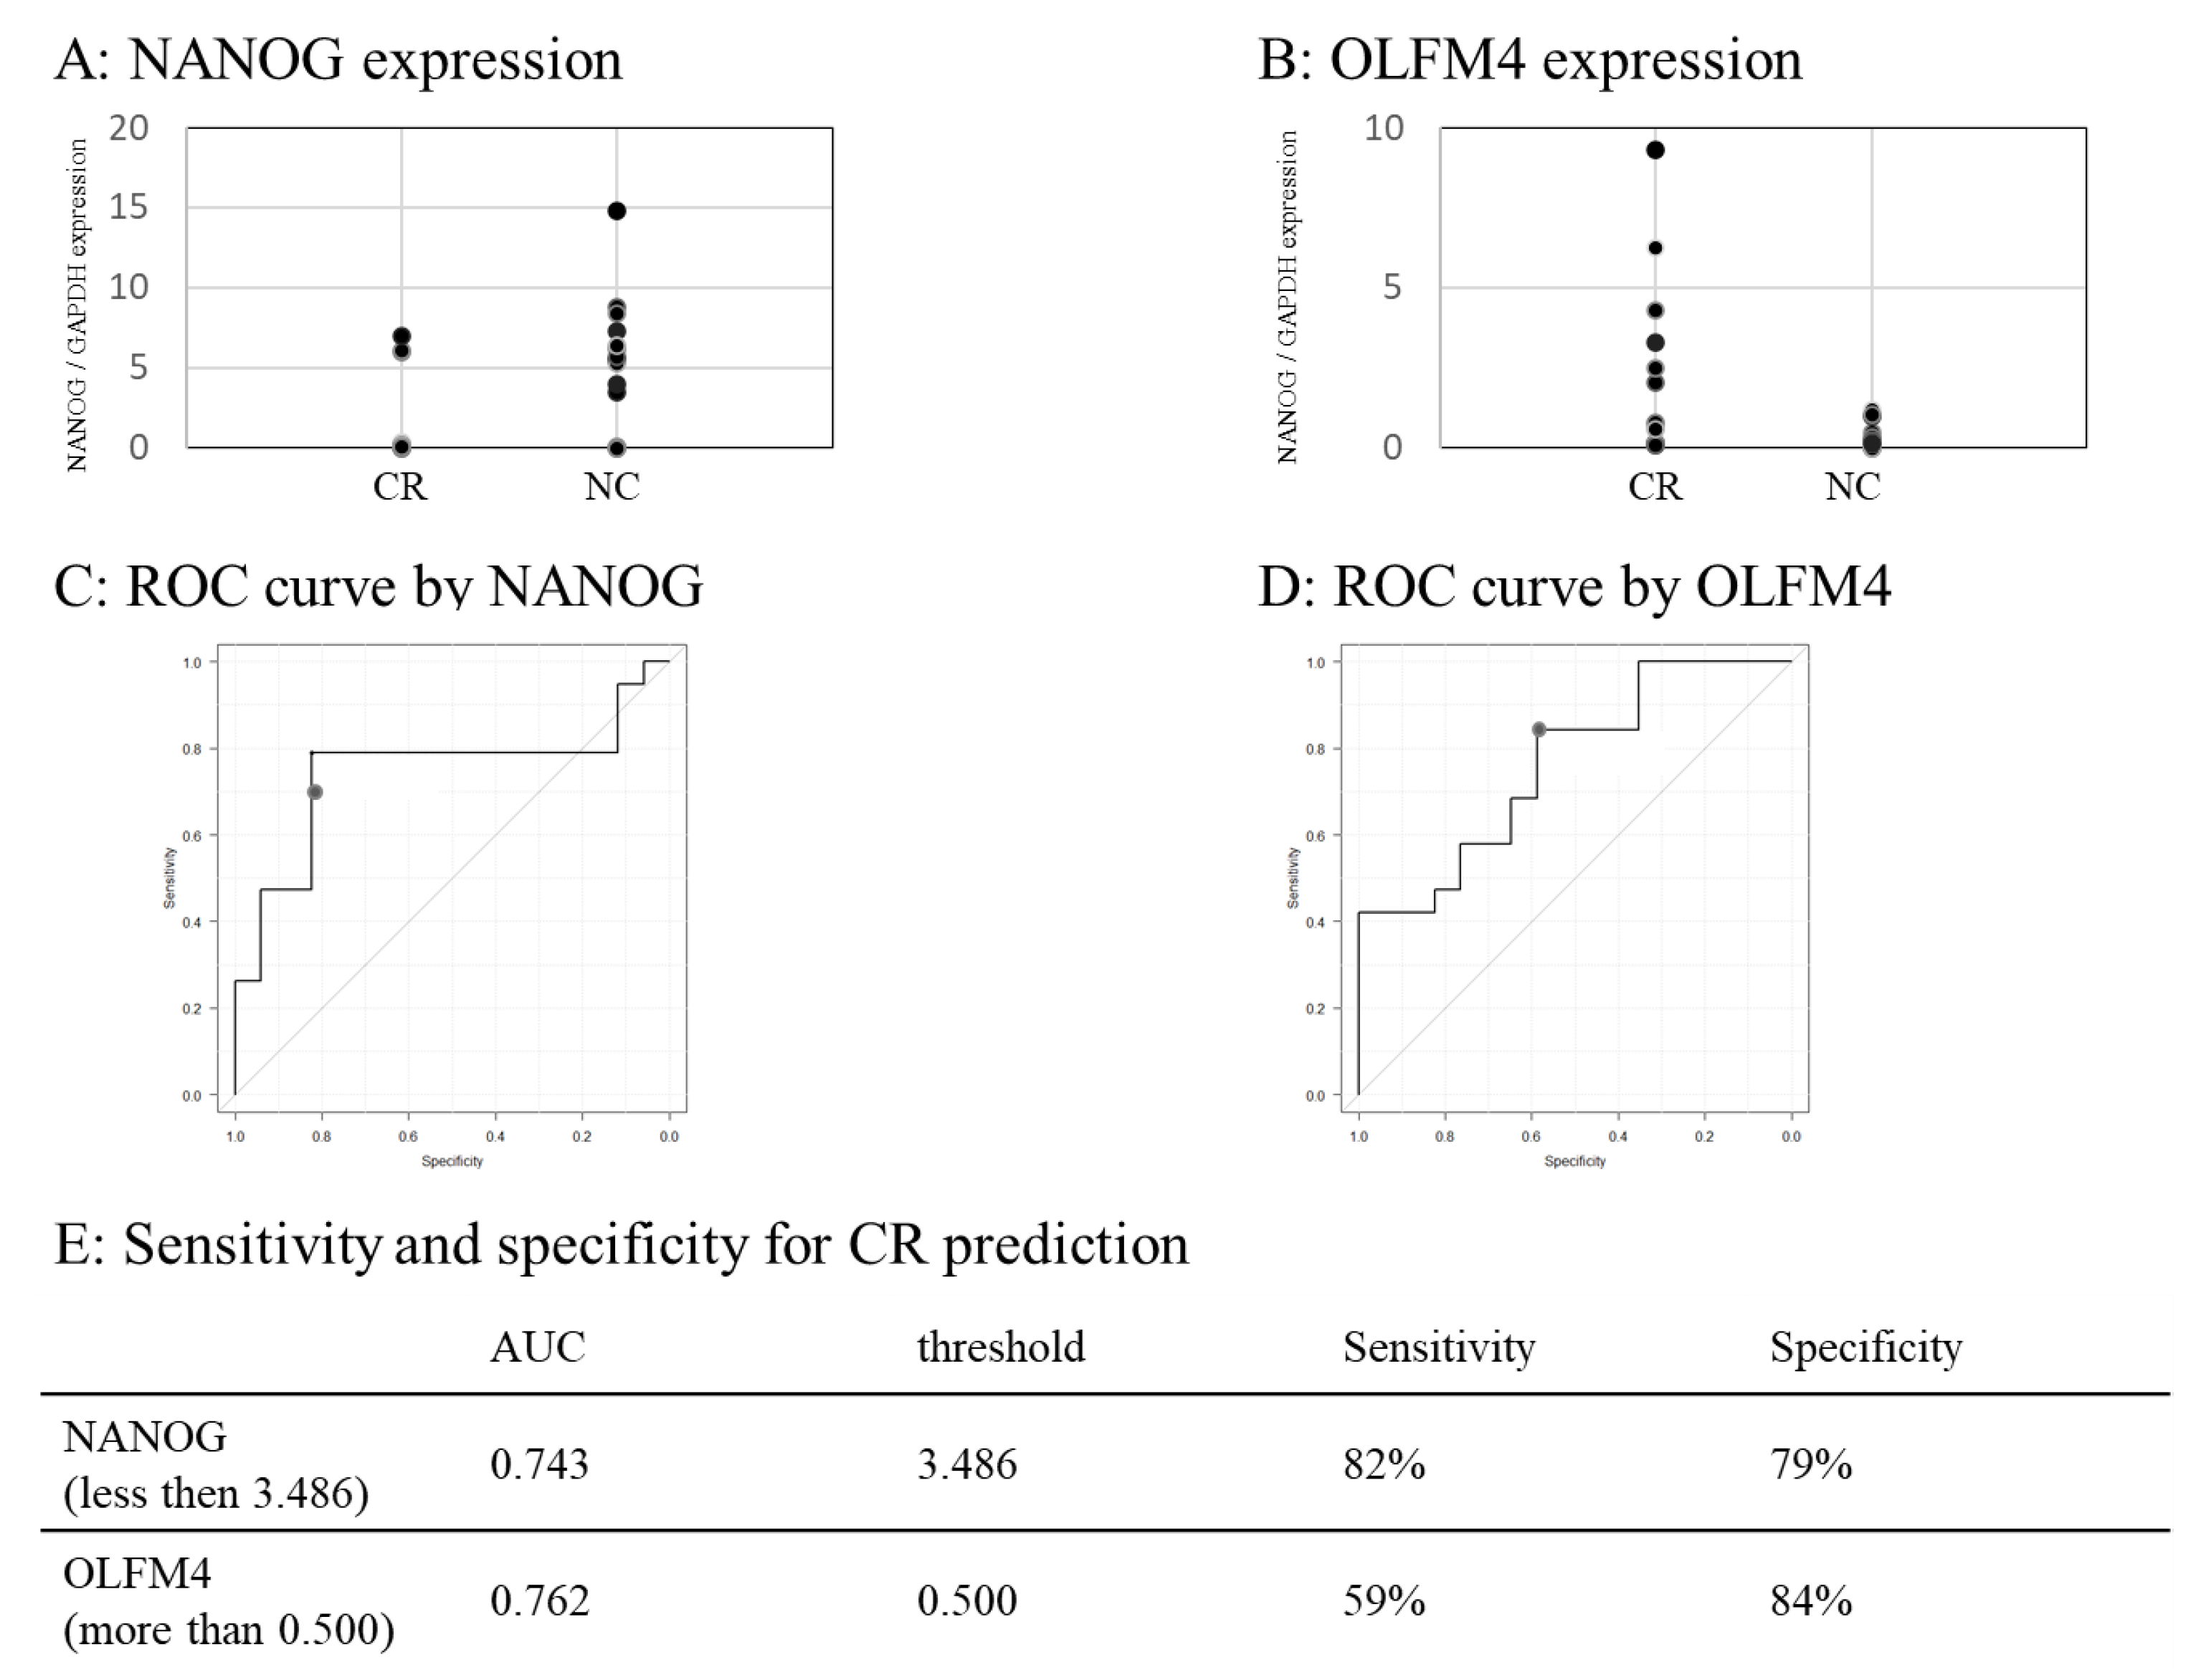
3.9. Real-Time PCR Validation
3.10. Predictability of NANOG and OLFM4
4. Discussion
5. Conclusions
Supplementary Materials
Author Contributions
Funding
Institutional Review Board Statement
Informed Consent Statement
Data Availability Statement
Conflicts of Interest
References
- Nakamura, S.; Sugiyama, T.; Matsumoto, T.; Iijima, K.; Ono, S.; Tajika, M.; Tari, A.; Kitadai, Y.; Matsumoto, H.; Nagaya, T.; et al. Long-Term Clinical Outcome of Gastric MALT Lymphoma After Eradication of Helicobacter pylori: A Multicentre Cohort Follow-Up Study of 420 Patients in Japan. Gut 2012, 61, 507–513. [Google Scholar] [CrossRef]
- Kim, J.S.; Park, J.C.; Lee, J.Y.; Ahn, J.Y.; Kang, S.H.; Yang, H.J.; Kim, S.J.; Joo, M.K.; Park, J.M. Long-Term Clinical Outcomes of Gastric MALT Lymphoma: A Nationwide Multicenter Study in Korea. Front. Oncol. 2021, 11, 681689. [Google Scholar] [CrossRef] [PubMed]
- Wang, L.H.; Wang, W.M.; Lin, C.Y.; Lin, S.H.; Shieh, C.C. Bidirectional Relationship Between Primary Sjogren Syndrome and Non-Hodgkin Lymphoma: A Nationwide Taiwanese Population-Based Study. J. Rheumatol. 2020, 47, 1374–1378. [Google Scholar] [CrossRef] [PubMed]
- Wang, L.H.; Wang, W.M.; Lin, S.H.; Shieh, C.C. Bidirectional Relationship between Systemic Lupus Erythematosus and Non-Hodgkin’s Lymphoma: A Nationwide Population-Based Study. Rheumatology 2019, 58, 1245–1249. [Google Scholar] [CrossRef] [PubMed]
- Fallah, M.; Liu, X.; Ji, J.; Försti, A.; Sundquist, K.; Hemminki, K. Autoimmune Diseases Associated with Non-Hodgkin Lymphoma: A Nationwide Cohort Study. Ann. Oncol. 2014, 25, 2025–2030. [Google Scholar] [CrossRef] [PubMed]
- Ponzoni, M.; Ferreri, A.J. Bacteria Associated with Marginal Zone Lymphomas. Best Pract. Res. Clin. Haematol. 2017, 30, 32–40. [Google Scholar] [CrossRef]
- Ferreri, A.J.; Dolcetti, R.; Magnino, S.; Doglioni, C.; Ponzoni, M. Chlamydial Infection: The Link with Ocular Adnexal Lymphomas. Nat. Rev. Clin. Oncol. 2009, 6, 658–669. [Google Scholar] [CrossRef]
- Liu, J.; He, L.; Haesebrouck, F.; Gong, Y.; Flahou, B.; Cao, Q.; Zhang, J. Prevalence of Coinfection with Gastric Non-Helicobacter pylori Helicobacter (NHPH) Species in Helicobacter pylori-Infected Patients Suffering from Gastric Disease in Beijing, China. Helicobacter 2015, 20, 284–290. [Google Scholar] [CrossRef]
- Takigawa, H.; Yuge, R.; Masaki, S.; Otani, R.; Kadota, H.; Naito, T.; Hayashi, R.; Urabe, Y.; Oka, S.; Tanaka, S.; et al. Involvement of Non-Helicobacter pylori Helicobacter Infections in Helicobacter pylori-Negative Gastric MALT Lymphoma Pathogenesis and Efficacy of Eradication Therapy. Gastric Cancer 2021, 24, 937–945. [Google Scholar] [CrossRef]
- Bonin, S.; Petrera, F.; Niccolini, B.; Stanta, G. PCR Analysis in Archival Postmortem Tissues. Mol. Pathol. 2003, 56, 184–186. [Google Scholar] [CrossRef]
- Huijsmans, C.J.; Damen, J.; van der Linden, J.C.; Savelkoul, P.H.; Hermans, M.H. Comparative Analysis of Four Methods to Extract DNA from Paraffin-Embedded Tissues: Effect on Downstream Molecular Applications. BMC Res. Notes 2010, 3, 239. [Google Scholar] [CrossRef]
- Rimbara, E.; Suzuki, M.; Matsui, H.; Nakamura, M.; Morimoto, M.; Sasakawa, C.; Masuda, H.; Nomura, S.; Osaki, T.; Nagata, N.; et al. Isolation and Characterization of Helicobacter suis from Human Stomach. Proc. Natl. Acad. Sci. USA 2021, 118, e2026337118. [Google Scholar] [CrossRef] [PubMed]
- Takigawa, H.; Masaki, S.; Naito, T.; Yuge, R.; Urabe, Y.; Tanaka, S.; Sentani, K.; Matsuo, T.; Matsuo, K.; Chayama, K.; et al. Helicobacter suis Infection Is Associated with Nodular Gastritis-Like Appearance of Gastric Mucosa-Associated Lymphoid Tissue Lymphoma. Cancer Med. 2019, 8, 4370–4379. [Google Scholar] [CrossRef]
- Nakamura, M.; Øverby, A.; Michimae, H.; Matsui, H.; Takahashi, S.; Mabe, K.; Shimoyama, T.; Sasaki, M.; Terao, S.; Kamada, T.; et al. PCR Analysis and Specific Immunohistochemistry Revealing a High Prevalence of Non-Helicobacter pylori Helicobacters in Helicobacter pylori-Negative Gastric Disease Patients in Japan: High Susceptibility to an HP Eradication Regimen. Helicobacter 2020, 25, e12700. [Google Scholar] [CrossRef]
- Naito, T.; Yuge, R.; Tanaka, S.; Otani, R.; Kadota, H.; Takigawa, H.; Tamura, T.; Sentani, K.; Yasui, W.; Kitadai, Y.; et al. Gastric Mucosa-Associated Lymphoid Tissue Lymphoma in Conjunction with Multiple Lymphomatous Polyposis in the Context of Helicobacter pylori and Helicobacter suis Superinfection. Clin. J. Gastroenterol. 2021, 14, 478–483. [Google Scholar] [CrossRef] [PubMed]
- Kadota, H.; Yuge, R.; Miyamoto, R.; Otani, R.; Takigawa, H.; Hayashi, R.; Urabe, Y.; Oka, S.; Sentani, K.; Oue, N.; et al. Investigation of Endoscopic Findings in Nine Cases of Helicobacter suis-Infected Gastritis Complicated by Gastric Mucosa-Associated Lymphoid Tissue Lymphoma. Helicobacter 2022, 27, e12887. [Google Scholar] [CrossRef] [PubMed]
- Sugizaki, K.; Tari, A.; Kitadai, Y.; Oda, I.; Nakamura, S.; Yoshino, T.; Sugiyama, T. Anti-Helicobacter pylori Therapy in Localized Gastric Mucosa-Associated Lymphoid Tissue Lymphoma: A Prospective, Nationwide, Multicenter Study in Japan. Helicobacter 2018, 23, e12474. [Google Scholar] [CrossRef]
- Zelenetz, A.D.; Gordon, L.I.; Abramson, J.S.; Advani, R.H.; Bertlett, N.L.; Budde, E.; Caimi, F.; de Vos, S.; Dholaria, B.; Fakhri, B.; et al. National Comprehensive Cancer Network. NCCN Clinical Practice Guidelines in Oncology, B-Cell Lymphomas, version 5. JNCCN J. Natl. Compr. Cancer Netw. 2021, 19, 1218–1230. [Google Scholar] [CrossRef]
- Raderer, M.; Wöhrer, S.; Kiesewetter, B.; Dolak, W.; Lagler, H.; Wotherspoon, A.; Muellauer, L.; Chott, A. Antibiotic Treatment as Sole Management of Helicobacter pylori-Negative Gastric MALT Lymphoma: A Single Center Experience with Prolonged Follow-Up. Ann. Hematol. 2015, 94, 969–973. [Google Scholar] [CrossRef]
- Park, H.S.; Kim, Y.J.; Yang, W.I.; Suh, C.O.; Lee, Y.C. Treatment Outcome of Localized Helicobacter pylori-Negative Low-Grade Gastric MALT Lymphoma. World J. Gastroenterol. 2010, 16, 2158–2162. [Google Scholar] [CrossRef]
- Asano, N.; Iijima, K.; Koike, T.; Imatani, A.; Shimosegawa, T. Helicobacter pylori-Negative Gastric Mucosa-Associated Lymphoid Tissue Lymphomas: A Review. World J. Gastroenterol. 2015, 21, 8014–8020. [Google Scholar] [CrossRef]
- Yeh, K.H.; Kuo, S.H.; Chen, L.T.; Mao, T.L.; Doong, S.L.; Wu, M.S.; Hsu, H.C.; Tzeng, Y.S.; Chen, C.L.; Lin, J.T.; et al. Nuclear Expression of BCL10 or Nuclear Factor Kappa B Helps Predict Helicobacter pylori-Independent Status of Low-Grade Gastric Mucosa-Associated Lymphoid Tissue Lymphomas with or Without t(11;18)(q21;q21). Blood 2005, 106, 1037–1041. [Google Scholar] [CrossRef] [PubMed]
- Kuo, S.H.; Chen, L.T.; Chen, C.L.; Doong, S.L.; Yeh, K.H.; Wu, M.S.; Mao, T.L.; Hsu, H.C.; Wang, H.P.; Lin, J.T.; et al. Expression of CD86 and Increased Infiltration of NK Cells Are Associated with Helicobacter pylori-Dependent State of Early Stage High-Grade Gastric MALT Lymphoma. World J. Gastroenterol. 2005, 11, 4357–4362. [Google Scholar] [CrossRef] [PubMed]
- Matsushima, Y.; Kinoshita, Y.; Fukui, H.; Maekawa, T.; Yazumi, S.; Okada, A.; Nakase, H.; Kawanami, C.; Iwano, M.; Hashimoto, K.; et al. Immunological and Molecular Analysis of B Lymphocytes in Low-Grade MALT Lymphoma of the Stomach. Are There Any Useful Markers for Predicting Outcome after Helicobacter Pylori Eradication? J. Gastroenterol. 2002, 37, 428–433. [Google Scholar] [CrossRef] [PubMed]
- Omote, R.; Gion, Y.; Omote, S.; Tari, A.; Tanaka, T.; Nishikori, A.; Yoshino, T.; Sato, Y. Clinicopathologic Analysis of Gastric Mucosa-Associated Lymphoid Tissue Lymphoma with or Without c-Met Expression. Med. Mol. Morphol. 2020, 53, 149–155. [Google Scholar] [CrossRef] [PubMed]
- Hiyama, T.; Haruma, K.; Kitadai, Y.; Ito, M.; Masuda, H.; Miyamoto, M.; Tanaka, S.; Yoshihara, M.; Sumii, K.; Shimamoto, F.; et al. Microsatellite Instability at D18S61 Is Associated with No Regression of Gastric Mucosa-Associated Lymphoid Tissue Lymphoma After Helicobacter pylori Eradication. Oncol. Rep. 2001, 8, 293–297. [Google Scholar] [CrossRef]
- Sumida, T.; Kitadai, Y.; Hiyama, T.; Shinagawa, K.; Tanaka, M.; Kodama, M.; Masuda, H.; Ito, M.; Tanaka, S.; Yoshihara, M.; et al. Antibodies to Helicobacter pylori and CagA Protein Are Associated with the Response to Antibacterial Therapy in Patients with H. pylori-Positive API2-MALT1-Negative Gastric MALT Lymphoma. Cancer Sci. 2009, 100, 1075–1081. [Google Scholar] [CrossRef]
- Streubel, B.; Lamprecht, A.; Dierlamm, J.; Cerroni, L.; Stolte, M.; Ott, G.; Raderer, M.; Chott, A. T(14;18)(q32;q21) Involving IGH and MALT1 Is a Frequent Chromosomal Aberration in MALT Lymphoma. Blood 2003, 101, 2335–2339. [Google Scholar] [CrossRef]
- Akagi, T.; Motegi, M.; Tamura, A.; Suzuki, R.; Hosokawa, Y.; Suzuki, H.; Ota, H.; Nakamura, S.; Morishima, Y.; Taniwaki, M.; et al. A Novel Gene, MALT1 at 18q21, Is Involved in t(11;18) (q21;q21) Found in Low-Grade B-Cell Lymphoma of Mucosa-Associated Lymphoid Tissue. Oncogene 1999, 18, 5785–5794. [Google Scholar] [CrossRef]
- Copie-Bergman, C.; Gaulard, P.; Lavergne-Slove, A.; Brousse, N.; Fléjou, J.F.; Dordonne, K.; de Mascarel, A.; Wotherspoon, A.C. Proposal for a New Histological Grading System for Post-treatment Evaluation of Gastric MALT Lymphoma. Gut 2003, 52, 1656. [Google Scholar] [CrossRef]
- Naito, T.; Yuge, R.; Kitadai, Y.; Takigawa, H.; Higashi, Y.; Kuwai, T.; Kuraoka, K.; Tanaka, S.; Chayama, K. Mesenchymal Stem Cells Induce Tumor Stroma Formation and Epithelial-Mesenchymal Transition through SPARC Expression in Colorectal Cancer. Oncol. Rep. 2021, 45, 1–15. [Google Scholar] [CrossRef] [PubMed]
- Kim, D.; Langmead, B.; Salzberg, S.L. HISAT: A Fast Spliced Aligner with Low Memory Requirements. Nat. Methods 2015, 12, 357–360. [Google Scholar] [CrossRef] [PubMed]
- Langmead, B.; Salzberg, S.L. Fast Gapped-Read Alignment with Bowtie 2. Nat. Methods 2012, 9, 357–359. [Google Scholar] [CrossRef]
- Li, B.; Dewey, C.N. RSEM: Accurate Transcript Quantification from RNA-Seq Data with or Without a Reference Genome. BMC Bioinformatics 2011, 12, 323. [Google Scholar] [CrossRef]
- McKenna, A.; Hanna, M.; Banks, E.; Sivachenko, A.; Cibulskis, K.; Kernytsky, A.; Garimella, K.; Altshuler, D.; Gabriel, S.; Daly, M.; et al. The Genome Analysis Toolkit: A MapReduce Framework for Analyzing Next-Generation DNA Sequencing Data. Genome Res. 2010, 20, 1297–1303. [Google Scholar] [CrossRef] [PubMed]
- Shen, S.; Park, J.W.; Lu, Z.X.; Lin, L.; Henry, M.D.; Wu, Y.N.; Zhou, Q.; Xing, Y. rMATS: Robust and Flexible Detection of Differential Alternative Splicing from Replicate RNA-Seq Data. Proc. Natl. Acad. Sci. USA 2014, 111, E5593–E5601. [Google Scholar] [CrossRef]
- Love, M.I.; Huber, W.; Anders, S. Moderated Estimation of Fold Change and Dispersion for RNA-Seq Data with DESeq2. Genome Biol. 2014, 15, 550. [Google Scholar] [CrossRef]
- Kanda, Y. Investigation of the Freely Available Easy-to-Use Software ‘EZR’ for Medical Statistics. Bone Marrow Transplant. 2013, 48, 452–458. [Google Scholar] [CrossRef] [PubMed]
- von Mering, C.; Jensen, L.J.; Snel, B.; Hooper, S.D.; Krupp, M.; Foglierini, M.; Jouffre, N.; Huynen, M.A.; Bork, P. STRING: Known and Predicted Protein-Protein Associations, Integrated and Transferred Across Organisms. Nucleic Acids Res. 2005, 33, D433–D437. [Google Scholar] [CrossRef]
- Zullo, A.; Hassan, C.; Ridola, L.; De Francesco, V.; Rossi, L.; Tomao, S.; Vaira, D.; Genta, R.M. Eradication Therapy in Helicobacter pylori-Negative, Gastric Low-Grade Mucosa-Associated Lymphoid Tissue Lymphoma Patients: A Systematic Review. J. Clin. Gastroenterol. 2013, 47, 824–827. [Google Scholar] [CrossRef]
- Basati, G.; Mohammadpour, H.; Emami Razavi, A. Association of High Expression Levels of SOX2, NANOG, and OCT4 in Gastric Cancer Tumor Tissues with Progression and Poor Prognosis. J. Gastrointest. Cancer 2020, 51, 41–47. [Google Scholar] [CrossRef]
- Akita, H.; Marquardt, J.U.; Durkin, M.E.; Kitade, M.; Seo, D.; Conner, E.A.; Andersen, J.B.; Factor, V.M.; Thorgeirsson, S.S. MYC Activates Stem-Like Cell Potential in Hepatocarcinoma by a p53-Dependent Mechanism. Cancer Res. 2014, 74, 5903–5913. [Google Scholar] [CrossRef] [PubMed]
- Jeter, C.R.; Badeaux, M.; Choy, G.; Chandra, D.; Patrawala, L.; Liu, C.; Calhoun-Davis, T.; Zaehres, H.; Daley, G.Q.; Tang, D.G. Functional Evidence That the Self-Renewal Gene NANOG Regulates Human Tumor Development. Stem Cells 2009, 27, 993–1005. [Google Scholar] [CrossRef]
- Grubelnik, G.; Boštjančič, E.; Pavlič, A.; Kos, M.; Zidar, N. NANOG Expression in Human Development and Cancerogenesis. Exp. Biol. Med. 2020, 245, 456–464. [Google Scholar] [CrossRef] [PubMed]
- Codony-Servat, J.; Rosell, R. Cancer Stem Cells and Immunoresistance: Clinical Implications and Solutions. Transl. Lung Cancer Res. 2015, 4, 689–703. [Google Scholar]
- Chang, K.C.; Chen, R.Y.; Wang, Y.C.; Hung, L.Y.; Medeiros, L.J.; Chen, Y.P.; Chen, T.Y.; Yang, J.C.; Chiang, P.M. Stem Cell Characteristics Promote Aggressiveness of Diffuse Large B-Cell Lymphoma. Sci. Rep. 2020, 10, 21342. [Google Scholar] [CrossRef]
- van der Flier, L.G.; Haegebarth, A.; Stange, D.E.; van de Wetering, M.; Clevers, H. OLFM4 Is a Robust Marker for Stem Cells in Human Intestine and Marks a Subset of Colorectal Cancer Cells. Gastroenterology 2009, 137, 15–17. [Google Scholar] [CrossRef]
- Luo, Z.; Zhang, Q.; Zhao, Z.; Li, B.; Chen, J.; Wang, Y. OLFM4 Is Associated with Lymph Node Metastasis and Poor Prognosis in Patients with Gastric Cancer. J. Cancer Res. Clin. Oncol. 2011, 137, 1713–1720. [Google Scholar] [CrossRef]
- Yu, L.; Wang, L.; Chen, S. Olfactomedin 4, a Novel Marker for the Differentiation and Progression of Gastrointestinal Cancers. Neoplasma 2011, 58, 9–13. [Google Scholar] [CrossRef]
- Liu, W.; Yan, M.; Sugui, J.A.; Li, H.; Xu, C.; Joo, J.; Kwon-Chung, K.J.; Coleman, W.G.; Rodgers, G.P. Olfm4 Deletion Enhances Defense Against Staphylococcus aureus in Chronic Granulomatous Disease. J. Clin. Investig. 2013, 123, 3751–3755. [Google Scholar] [CrossRef] [PubMed]
- Shinozaki, S.; Nakamura, T.; Iimura, M.; Kato, Y.; Iizuka, B.; Kobayashi, M.; Hayashi, N. Upregulation of Reg 1alpha and GW112 in the Epithelium of Inflamed Colonic Mucosa. Gut 2001, 48, 623–629. [Google Scholar] [CrossRef] [PubMed]
- Gersemann, M.; Becker, S.; Nuding, S.; Antoni, L.; Ott, G.; Fritz, P.; Oue, N.; Yasui, W.; Wehkamp, J.; Stange, E.F. Olfactomedin-4 Is a Glycoprotein Secreted into Mucus in Active IBD. J. Crohns Colitis 2012, 6, 425–434. [Google Scholar] [CrossRef] [PubMed]
- Mannick, E.E.; Schurr, J.R.; Zapata, A.; Lentz, J.J.; Gastanaduy, M.; Cote, R.L.; Delgado, A.; Correa, P.; Correa, H. Gene Expression in Gastric Biopsies from Patients Infected with Helicobacter pylori. Scand. J. Gastroenterol. 2004, 39, 1192–1200. [Google Scholar] [CrossRef] [PubMed]
- Liu, W.; Yan, M.; Liu, Y.; Wang, R.; Li, C.; Deng, C.; Singh, A.; Coleman, W.G.; Rodgers, G.P. Olfactomedin 4 Down-Regulates Innate Immunity Against Helicobacter pylori Infection. Proc. Natl. Acad. Sci. USA 2010, 107, 11056–11061. [Google Scholar] [CrossRef]
- Zainuddin, A.; Chua, K.H.; Abdul Rahim, N.; Makpol, S. Effect of Experimental Treatment on GAPDH mRNA Expression as a Housekeeping Gene in Human Diploid Fibroblasts. BMC Mol. Biol. 2010, 11, 59. [Google Scholar] [CrossRef]
- Kaneko, K.; Furuyama, K.; Aburatani, H.; Shibahara, S. Hypoxia Induces Erythroid-Specific 5-Aminolevulinate Synthase Expression in Human Erythroid Cells Through Transforming Growth Factor-Beta Signaling. FEBS J. 2009, 276, 1370–1382. [Google Scholar] [CrossRef]
- Ma, H.; Tian, T.; Liang, S.; Liu, X.; Shen, H.; Xia, M.; Liu, X.; Zhang, W.; Wang, L.; Chen, S.; et al. Estrogen Receptor-Mediated miR-486-5p Regulation of OLFM4 Expression in Ovarian Cancer. Oncotarget 2016, 7, 10594–10605. [Google Scholar] [CrossRef]
- Vishnubalaji, R.; Sasidharan Nair, V.; Ouararhni, K.; Elkord, E.; Alajez, N.M. Integrated Transcriptome and Pathway Analyses Revealed Multiple Activated Pathways in Breast Cancer. Front. Oncol. 2019, 9, 910. [Google Scholar] [CrossRef]
- Tian, Z.; Palmer, N.; Schmid, P.; Yao, H.; Galdzicki, M.; Berger, B.; Wu, E.; Kohane, I.S. A Practical Platform for Blood Biomarker Study by Using Global Gene Expression Profiling of Peripheral Whole Blood. PLoS ONE 2009, 4, e5157. [Google Scholar] [CrossRef]
- Kumar, J.; Fang, H.; McCulloch, D.R.; Crowley, T.; Ward, A.C. Leptin Receptor Signaling via Janus Kinase 2/Signal Transducer And Activator Of Transcription 3 Impacts on Ovarian Cancer Cell Phenotypes. Oncotarget 2017, 8, 93530–93540. [Google Scholar] [CrossRef]
- Park, S.W.; Do, H.J.; Choi, W.; Song, H.; Chung, H.J.; Kim, J.H. NANOG Gene Expression Is Regulated by the ETS Transcription Factor ETV4 in Human Embryonic Carcinoma NCCIT Cells. Biochem. Biophys. Res. Commun. 2017, 487, 532–538. [Google Scholar] [CrossRef] [PubMed]
- Kim, S.Y.; Kwon, S.K.; Lee, S.Y.; Baek, K.H. Ubiquitin-Specific Peptidase 5 and Ovarian Tumor Deubiquitinase 6A Are Differentially Expressed in p53+/+ and p53−/− HCT116 Cells. Int. J. Oncol. 2018, 52, 1705–1714. [Google Scholar] [PubMed]
- Burns, M.B.; Lackey, L.; Carpenter, M.A.; Rathore, A.; Land, A.M.; Leonard, B.; Refsland, E.W.; Kotandeniya, D.; Tretyakova, N.; Nikas, J.B.; et al. APOBEC3B Is an Enzymatic Source of Mutation in Breast Cancer. Nature 2013, 494, 366–370. [Google Scholar] [CrossRef] [PubMed]
- Swerdlow, S.H.; Campo, E.; Pileri, S.A.; Harris, N.L.; Stein, H.; Siebert, R.; Advani, R.; Ghielmini, M.; Salles, G.A.; Zelenetz, A.D.; et al. The 2016 Revision of the World Health Organization Classification of Lymphoid Neoplasms. Blood 2016, 127, 2375–2390. [Google Scholar] [CrossRef]
- Wotherspoon, A.C.; Ortiz-Hidalgo, C.; Falzon, M.R.; Isaacson, P.G. Helicobacter pylori-Associated Gastritis and Primary B-Cell Gastric Lymphoma. Lancet 1991, 338, 1175–1176. [Google Scholar] [CrossRef]
- Musshoff, K. Clinical Staging Classification of Non-Hodgkin’s Lymphomas (Author’s Transl). Strahlentherapie 1977, 153, 218–221. [Google Scholar] [PubMed]
- Yuge, R.; Kitadai, Y.; Takigawa, H.; Naito, T.; Oue, N.; Yasui, W.; Tanaka, S.; Chayama, K. Silencing of Discoidin Domain Receptor-1 (DDR1) Concurrently Inhibits Multiple Steps of Metastasis Cascade in Gastric Cancer. Transl. Oncol. 2018, 11, 575–584. [Google Scholar] [CrossRef]
- Takigawa, H.; Kitadai, Y.; Shinagawa, K.; Yuge, R.; Higashi, Y.; Tanaka, S.; Yasui, W.; Chayama, K. Mesenchymal Stem Cells Induce Epithelial to Mesenchymal Transition in Colon Cancer Cells Through Direct Cell-to-Cell Contact. Neoplasia 2017, 19, 429–438. [Google Scholar] [CrossRef]
- Mistry, J.; Finn, R.D.; Eddy, S.R.; Bateman, A.; Punta, M. Challenges in Homology Search: HMMER3 and Convergent Evolution of Coiled-Coil Regions. Nucleic Acids Res. 2013, 41, e121. [Google Scholar] [CrossRef]
- Buchfink, B.; Xie, C.; Huson, D.H. Fast and Sensitive Protein Alignment Using DIAMOND. Nat. Methods 2015, 12, 59–60. [Google Scholar] [CrossRef]


| CR Group (n = 17) | NC Group (n = 19) | p-Value | ||
|---|---|---|---|---|
| Median age (range) | 56.4 ± 14.0 (32–79) | 64.9 ± 12.4 (39–88) | 0.063 | |
| Sex | Male | 6 (35%) | 7 (37%) | 1 |
| Female | 11 (65%) | 12 (63%) | ||
| Mucosal atrophy | Closed-type | 14 (82%) | 17 (89%) | 0.650 |
| Open-type | 3 (18%) | 2 (11%) | ||
| Number of lesions | Single | 5 (29%) | 3 (16%) | 0.434 |
| Multiple | 12 (71%) | 16 (84%) | ||
| Location | U | 2 (12%) | 3 (16%) | 0.727 |
| M/L | 15 (88%) | 16 (84%) | ||
| Morphological type | Superficial | 15 (88%) | 17 (90%) | 0.906 † |
| Elevated | 0 | 1 (5%) | 0.337 † | |
| Other | 2 (12%) | 1 (5%) | 0.481 † |
| Detection Method | Gene Symbol | Gene Expression (CR Group) | Gene Expression (NC Group) | Log2 Fold Change | p-Value | FDR | ||
|---|---|---|---|---|---|---|---|---|
| Upregulated in CR group | Infection-related genes | Based on KEGG pathway analysis | HBA1 | 74,654.784 | 2580.948 | −4.854 | 1.08 × 10⁻⁶ * | 0.00106 * |
| HBA2 | 113,119.690 | 3758.04 | −4.911 | 7.96 × 10⁻⁷ * | 0.000886 * | |||
| HBB | 58,139.590 | 2118.052 | −4.778 | 1.76 × 10⁻⁶ * | 0.00149 * | |||
| HLA-DRB3 | 1826.461 | 139.764 | −3.707 | 0.000142 * | 0.0313 * | |||
| Based on DEG | NPIPB3 | 770.699 | 5.639 | −7.094 | 1.40 × 10⁻¹⁵ * | 2.50 × 10⁻¹¹ * | ||
| ALAS2 | 755.955 | 31.467 | −4.586 | 6.15 × 10⁻⁶ * | 0.00421 * | |||
| OLFM4 | 947.359 | 41.761 | −4.503 | 7.62 × 10⁻⁶ * | 0.00468 * | |||
| Upregulated in NC group | Cancer-related genes | Based on KEGG pathway analysis | TMEM130 | 71.323 | 561.849 | 2.977 | 0.00014 * | 0.0313 * |
| GSTA1 | 50.275 | 600.022 | 3.577 | 7.08 × 10⁻⁵ * | 0.0221 * | |||
| Based on DEG | LEP | 25.913 | 404.156 | 3.963 | 8.01 × 10⁻⁸ * | 0.00013 * | ||
| MTRNR2L8 | 25,678.176 | 270,967.1 | 3.399 | 3.87 × 10⁻⁸ * | 7.65 × 10⁻⁵ * | |||
| NANOG | 55.876 | 814.437 | 3.865 | 2.37 × 10⁻⁶ * | 0.00191 * | |||
| OTUD6A | 64.137 | 977.690 | 3.930 | 1.41 × 10⁻⁶ * | 0.00131 * | |||
| ZNF669 | 332.030 | 5072 | 3.933 | 3.49 × 10⁻⁷ * | 0.000444 * | |||
| Transcription factor | ZNF556 | 29.540 | 342.919 | 3.537 | 9.26 × 10⁻⁶ * | 0.00549 * | ||
| Protein–protein interaction | ACTA1 | 7.572 | 275.414 | 5.184 | 3.75 × 10⁻⁸ * | 7.65 × 10⁻⁵ * | ||
| Detection Method | Gene Symbol | Gene Expression (CR Group) | Gene Expression (NC Group) | p-Value | FDR | ||
|---|---|---|---|---|---|---|---|
| Upregulated in CR group | Infection-related genes | Based on KEGG pathway analysis | HBA1 | 1.03 | 0.52 | 0.343 | 0.686 |
| HBA2 | 1.47 | 0.40 | 0.236 | 0.629 | |||
| HBB | 2.91 | 1.66 | 0.564 | 0.752 | |||
| HLA-DRB3 | 0.00 | 0.01 | 0.6 | 0.738 | |||
| Based on DEG | NPIPB3 | 0.11 | 0.04 | 0.033 * | 0.132 | ||
| ALAS2 | 0.06 | 0.00 | 0.112 | 0.358 | |||
| OLFM4 | 1.84 | 0.32 | 0.005 * | 0.04 * | |||
| Upregulated in NC group | Cancer-related genes | Based on KEGG pathway analysis | TMEM130 | 0.82 | 0.72 | 0.887 | 0.887 |
| GSTA1 | 1.95 | 2.57 | 0.785 | 0.837 | |||
| Based on DEG | LEP | 0.23 | 0.28 | 0.382 | 0.611 | ||
| MTRNR2L8 | 0.67 | 0.60 | 0.768 | 0.878 | |||
| NANOG | 1.36 | 6.11 | 0.003 * | 0.048 * | |||
| OTUD6A | 0.20 | 0.27 | 0.286 | 0.654 | |||
| ZNF669 | 0.28 | 0.98 | 0.365 | 0.649 | |||
| Transcription factor | ZNF556 | 0.26 | 0.52 | 0.018 * | 0.096 | ||
| Protein–protein interaction | ACTA1 | 0.25 | 0.67 | 0.383 | 0.557 | ||
Disclaimer/Publisher’s Note: The statements, opinions and data contained in all publications are solely those of the individual author(s) and contributor(s) and not of MDPI and/or the editor(s). MDPI and/or the editor(s) disclaim responsibility for any injury to people or property resulting from any ideas, methods, instructions or products referred to in the content. |
© 2023 by the authors. Licensee MDPI, Basel, Switzerland. This article is an open access article distributed under the terms and conditions of the Creative Commons Attribution (CC BY) license (https://creativecommons.org/licenses/by/4.0/).
Share and Cite
Takigawa, H.; Yuge, R.; Miyamoto, R.; Otani, R.; Kadota, H.; Hiyama, Y.; Hayashi, R.; Urabe, Y.; Sentani, K.; Oue, N.; et al. Comprehensive Analysis of Gene Expression Profiling to Explore Predictive Markers for Eradication Therapy Efficacy against Helicobacter pylori-Negative Gastric MALT Lymphoma. Cancers 2023, 15, 1206. https://doi.org/10.3390/cancers15041206
Takigawa H, Yuge R, Miyamoto R, Otani R, Kadota H, Hiyama Y, Hayashi R, Urabe Y, Sentani K, Oue N, et al. Comprehensive Analysis of Gene Expression Profiling to Explore Predictive Markers for Eradication Therapy Efficacy against Helicobacter pylori-Negative Gastric MALT Lymphoma. Cancers. 2023; 15(4):1206. https://doi.org/10.3390/cancers15041206
Chicago/Turabian StyleTakigawa, Hidehiko, Ryo Yuge, Ryo Miyamoto, Rina Otani, Hiroki Kadota, Yuichi Hiyama, Ryohei Hayashi, Yuji Urabe, Kazuhiro Sentani, Naohide Oue, and et al. 2023. "Comprehensive Analysis of Gene Expression Profiling to Explore Predictive Markers for Eradication Therapy Efficacy against Helicobacter pylori-Negative Gastric MALT Lymphoma" Cancers 15, no. 4: 1206. https://doi.org/10.3390/cancers15041206
APA StyleTakigawa, H., Yuge, R., Miyamoto, R., Otani, R., Kadota, H., Hiyama, Y., Hayashi, R., Urabe, Y., Sentani, K., Oue, N., Kitadai, Y., Oka, S., & Tanaka, S. (2023). Comprehensive Analysis of Gene Expression Profiling to Explore Predictive Markers for Eradication Therapy Efficacy against Helicobacter pylori-Negative Gastric MALT Lymphoma. Cancers, 15(4), 1206. https://doi.org/10.3390/cancers15041206