Article

IGF1 and Insulin Receptor Single Nucleotide Variants Associated with Response in HER2-Negative Breast Cancer Patients Treated with Neoadjuvant Chemotherapy with or without a Fasting Mimicking Diet (BOOG 2013-04 DIRECT Trial)

1
Department of Medical Oncology, Leiden University Medical Center, 2333 ZA Leiden, The Netherlands
2
Department of Medical Statistics and Bioinformatics, Leiden University Medical Center, 2333 ZA Leiden, The Netherlands
3
Department of Endocrinology, Leiden University Medical Center, 2333 ZA Leiden, The Netherlands
4
Department of Clinical Pharmacy and Toxicology, Leiden University Medical Center, 2333 ZA Leiden, The Netherlands
*
Authors to whom correspondence should be addressed.
Cancers 2023, 15(24), 5872; https://doi.org/10.3390/cancers15245872
Submission received: 25 October 2023 / Revised: 13 December 2023 / Accepted: 13 December 2023 / Published: 17 December 2023
(This article belongs to the Topic Recent Advances in Anticancer Strategies)

Abstract

:

Simple Summary

Insulin and insulin-like growth factor 1 (IGF1) are metabolic hormones, which are often upregulated to stimulate proliferation in breast cancer. A fasting mimicking diet (FMD) targets insulin signaling pathway downregulation to hamper tumor growth. Genes encoding for the insulin receptors on the cell’s surface contain genetic variation between patients, which can affect insulin receptor function and cellular response. Therefore, a group of 113 patients with HER2-negative breast cancer receiving neoadjuvant chemotherapy with or without a fasting mimicking diet were investigated. We found that two IGF1 receptor variants were associated with worse pathological response compared to the reference alleles, out of the 17 interrogated common variants. Additionally, two IGF1 receptor variants could interact negatively within the FMD group regarding radiological response. These results emphasize that genetic variation harbors predictive clinical relevance to optimize and personalize cancer therapy.

Abstract

Aim: We aimed to investigate associations between IGF1R and INSR single nucleotide variants (SNVs) and clinical response in patients with breast cancer treated with neoadjuvant chemotherapy with or without a fasting mimicking diet (FMD) from the DIRECT trial (NCT02126449), since insulin-like growth factor 1 (IGF1) and the insulin pathway are heavily involved in tumor growth and progression. Methods: Germline DNA from 113 patients was tested for 17 systematically selected candidate SNVs in IGF1R and INSR with pathological and radiological response. Results: IGF1R variants A > G (rs3743259) and G > A (rs3743258) are associated with worse pathological response compared to reference alleles p = 0.002, OR = 0.42 (95%CI: 0.24; 0.73); p = 0.0016; OR = 0.40 (95%CI: 0.23; 0.70). INSR T > C (rs1051690) may be associated with worse radiological response p = 0.02, OR = 2.92 (95%CI: 1.16; 7.36), although not significant after Bonferroni correction. Exploratory interaction analysis suggests that IGF1R SNVs rs2684787 and rs2654980 interact negatively with the FMD group regarding radiological response p = 0.036, OR = 5.13 (95%CI: 1.12; 23.63); p = 0.024, OR = 5.71 (95%CI: 1.26; 25.85). Conclusions: The IGF1R variants rs3743259 and rs3743258 are negatively associated with pathological response in this cohort, suggesting potential relevance as a predictive biomarker. Further research is needed to validate these findings and elucidate the underlying mechanisms and interaction with FMD.

1. Introduction

The insulin-like growth factor 1 (IGF1) and insulin pathway are both involved in tumor proliferation and progression [1,2]. Elevated IGF1 levels are specifically associated with increased risk of breast cancer [3], and high IGF1 levels are associated with increased breast cancer mortality, with a hazard ratio of 3.1. Increased IGF1 receptor (IGF1R) expression is found in 50% of breast cancers. Therefore, it is hypothesized that genetic variation affecting the IGF1/insulin axis may also influence cancer risk, progression and therapy response [4].
De Groot et al. previously showed that the IGF1R SNV G > T rs2016347 is associated with pathological response after neoadjuvant chemotherapy in patients with human epidermal growth factor receptor 2 (HER2)-negative breast cancer, emphasizing that genetic variation could impact treatment response in these patients [5]. The insulin receptor (INSR) gene has been studied less extensively in cancer, even though its protein can bind the same ligands as the IGF1R.
Moreover, IGF1R and INSR SNVs may influence the effects of short-term fasting or a fasting mimicking diet (FMD), since the FMD is suggested to operate at least partially through the IGF1 and insulin pathways [6]. Fasting has repeatedly been shown to have anti-cancer effects in preclinical research by sensitizing tumor cells for chemotherapy [7,8,9]. The underlying mechanism of FMD on the anti-cancer effect is that a decrease in the blood concentration of glucose, insulin and IGF1 causes IGF1R- protein kinase B(Akt)-mammalian target of rapamycin (mTOR) pathway downregulation [10,11], which leads to gene expression profile alterations that ultimately promote autophagy and cell death in cancer cells [12]. Subsequently, our phase 2 DIRECT study (NCT02126449) suggested a positive effect of the FMD compared to regular diet in addition to neoadjuvant chemotherapy on pathological and radiological response, in patients with early-stage HER2-negative breast cancer [13].
Therefore, we hypothesize that genetic variation affecting the IGF1/insulin axis may influence chemotherapy response and interact with FMD therapy, such as reported in the DIRECT study (NCT02126449). Here, we investigated IGF1R and INSR SNVs and, subsequently, IGF1R expression for association with pathological and radiological response.

2. Materials and Methods

The 131 patients who participated from February 2014 to January 2018 in the phase II randomized DIRECT trial (NCT02126449) were randomized to receive standard neoadjuvant chemotherapy with or without FMD [13]. Patient characteristics are shown in Table 1, and the study inclusion and exclusion criteria were described previously [13]. Further, 2 patients were excluded from analysis due to informed consent withdrawal and metastasis at inclusion.
Pathological response was evaluated by the Miller–Payne (MP) score on a 1 to 5 scale [14]. Radiological response was assessed after chemotherapy and scored according to the RECIST1.1 criteria [15]. MP score was also grouped, with responders defined as score 4–5, less than 10% tumor cells, and the non-responders as score 1–3, as shown in Table 1. Radiological response is grouped as responders comprising complete response (CR) and partial response (PR) and the non-responders of stable disease (SD) and progressive disease (PD). The response data are primarily analyzed as intention-to-treat (ITT) and secondary in per protocol (PP) analysis with FMD-compliant versus control group, since 22 (33.8%) out of 65 FMD patients were able to comply with at least half of the planned FMD cycles. All patients provided written informed consent at the start of the study participation. The study was conducted in accordance with the Declaration of Helsinki (2008) and approved by the Medical Ethics Committee of the Leiden University Medical Center in agreement with the Dutch law for medical research involving humans.
The 1000 Genomes database [16,17], version GRCh37p13, provided all SNVs for IGF1R (n = 1364) and INSR (n = 1244) genes. Selection criteria for SNV selection included (1) localization in exon positions, (2) minor allele frequency ≥0.2 in the sub-population with Northern and Western European ancestry (CEU) and (3) non-duplicates. These selection criteria resulted in a total of 24 SNVs, 15 for IGF1R and 9 for INSR. Due to technical limitations in primer design of the custom Open Array chip, 6 SNVs had to be replaced with proxy SNVs. Haploview software (version 4.1) identified 4 SNVs in high linkage disequilibrium r2 > 0.9, namely IGF1R rs1815009 for rs66745311, rs2684788 for rs3051367, rs2654980 for rs9282714 and INSR rs2252673 for rs2352955 (Table S1). INSR rs34045095 and rs2352954 had to be excluded due to lack of proxy SNV and internal quality control. Ultimately, 17 candidate SNVs were selected, 11 in IGF1R and 6 in INSR (Table S2).
DNA was isolated from baseline blood samples (n = 113) collected in Ethylene diamine tetra acetic acid tubes stored at from −80 °C. Isolated DNA samples were stored at −20 °C until genotyping for the 17 candidate IGF1R and INSR SNVs. Genotyping was performed using a PCR-based fixed-format OpenArray™ Panel (Thermo Fisher Scientific, Waltham, MA, USA) to detect SNVs using specific probes for the genes IGF1R and INSR. Reactions were run on the QuantStudio™ 12 K Flex OpenArray Genotyping system (Thermo Fisher Scientific, Waltham, MA, USA) and analyzed with the TaqMan Genotyper Software® (version 1.3). The predefined minimum call rate was >85%.
Formalin-fixed paraffin-embedded blocks of the diagnostic biopsies and resection material were sectioned (4 µm) and immunohistochemically stained for membranous IGF-1R expression, as described elsewhere more extensively [5]. For positive controls, placenta tissue with previously confirmed IGF1R expression was used, while negative control sections underwent the same IHC procedure without the primary antibody. Scoring the membranous IGF1R expression was performed by two assessors (SdG, NdG) simultaneously and, if necessary, sections were checked by a pathologist to reach consensus. The scoring method, as described elsewhere in more detail [5], was, in short, carried out on a scale from 0 to 3+. A score 0 was given if <10% of the tumor cells were incompletely stained, 1 if >10% of tumor cells showed incomplete staining, 2 if weak to moderate staining in >10% of the tumor cells was observed and 3+ if strong complete staining was observed in >10% of tumor cells. A score of 0 and 1+ was considered negative and 2+ and 3+ as positive [5]. Statistical analysis was performed in Statistical Package for Social Sciences (IBM SPSS, version 24.0 and 25.0, Armonk, NY, USA: IBM Corp). Genotype distribution in 1000 Genomes and the DIRECT cohort were compared and tested for deviation from Hardy–Weinberg equilibrium (HWE) using a goodness-of-fit test with p-value of <0.05 as significance threshold. Ordinal and binary logistic regression using univariate and multivariate models was used for pathological and radiological response and IGF1R expression. The proportional odds assumption was not violated for the significant SNVs, as assessed by comparing regression coefficients to a separate multinomial regression analysis (Table S3). For the primary analysis, the ITT population was used. First, model selection was performed with univariate regressions performed on potential confounders and influential variables. Variables with p-values < 0.1 were carried forward into the primary multivariate analysis. In the genetic association models, genotypes were used with additive coding. Coding of genotypes was performed according to the variant allele, i.e., the genotype represents how often the variant allele is present, and associations are interpreted in terms of the variant allele. In secondary analyses, the PP population was considered. Further analyses were conducted in an explorative way to investigate possible interactions between SNV and treatment group. For the primary analysis, Bonferroni correction was applied to account for multiple testing of 17 SNVs, with a significance threshold of 0.05/17 = 0.003.

3. Results

3.1. IGF1R and INSR SNV Distribution

Baseline blood samples from 113 out of 131 patients were available for analysis. The SNV distribution among the study cohort shown in Table 2 is comparable to the frequencies observed in the publicly available databases of PubMed and 1000 Genomes GRCh37p13 (Table S4). Furthermore, all the SNVs followed HWE at the 0.05 threshold. The predetermined minimum call rate of >85% was achieved with a minimum of 92% (Table S4).

3.2. IGF1 Receptor SNVs Are Associated with Worsened Pathological Response and INSR SNV Is Potentially Associated with Worse Radiological Response

In the model selection step, tumor and lymph node status, age, randomization and hormone receptor (HR) status were selected as covariates for the primary analysis (Table S5). Tumor type and HR status are biologically similar factors; therefore, only HR status was entered into the final ordinal regression model to optimize the noise-to-signal ratio.
IGF1R rs3743259 and rs3743258 SNVs were associated with worse pathological response compared to the reference genotype in the ITT analysis with an additive model, p = 0.002, OR = 0.42 (95%CI: 0.24; 0.73); p = 0.0016; OR = 0.40 (95%CI: 0.23; 0.70), respectively, as shown in Table 3.
Multivariate analysis in a PP fashion yielded associations with the same SNVs and similar effect sizes, though these were not statistically significant after Bonferroni correction for multiple testing (See Table 4).
Furthermore, INSR rs1051690 presence suggested association with worse radiological response compared to patients with the reference genotype (Table 3: OR = 2.92 (95%CI: 1.16; 7.36); p = 0.02), although this association was not significant after Bonferroni correction. The logistic regression model with responders vs. non-responders for radiological and pathological response showed no significant correlation after correction for multiple testing for ITT, which suggests that the ordinal regression analysis best retains information on the association (Table S6).

3.3. IGF1R SNVs and FMD Interaction

Further ordinal regression analyses were conducted to analyze potential interaction between SNVs and FMD. This analysis suggested that the presence of IGF1R SNVs rs2684787 and rs2654980 might interact with the ITT FMD group differently compared to the control group, affecting radiological response negatively, p = 0.036, OR = 5.13 (95%CI: 1.12–23.63); p = 0.024, OR = 5.71 (95%CI: 1.26–25.85), respectively (Table S7), but not in PP. For pathological response, there was no indication of interaction in the ITT or PP.
Secondary models included responders vs. non-responders, which revealed that there were no indications for interaction between SNVs and treatment group affecting radiological response and pathological responders vs. non-responders after correction for multiple comparison (Table S8).

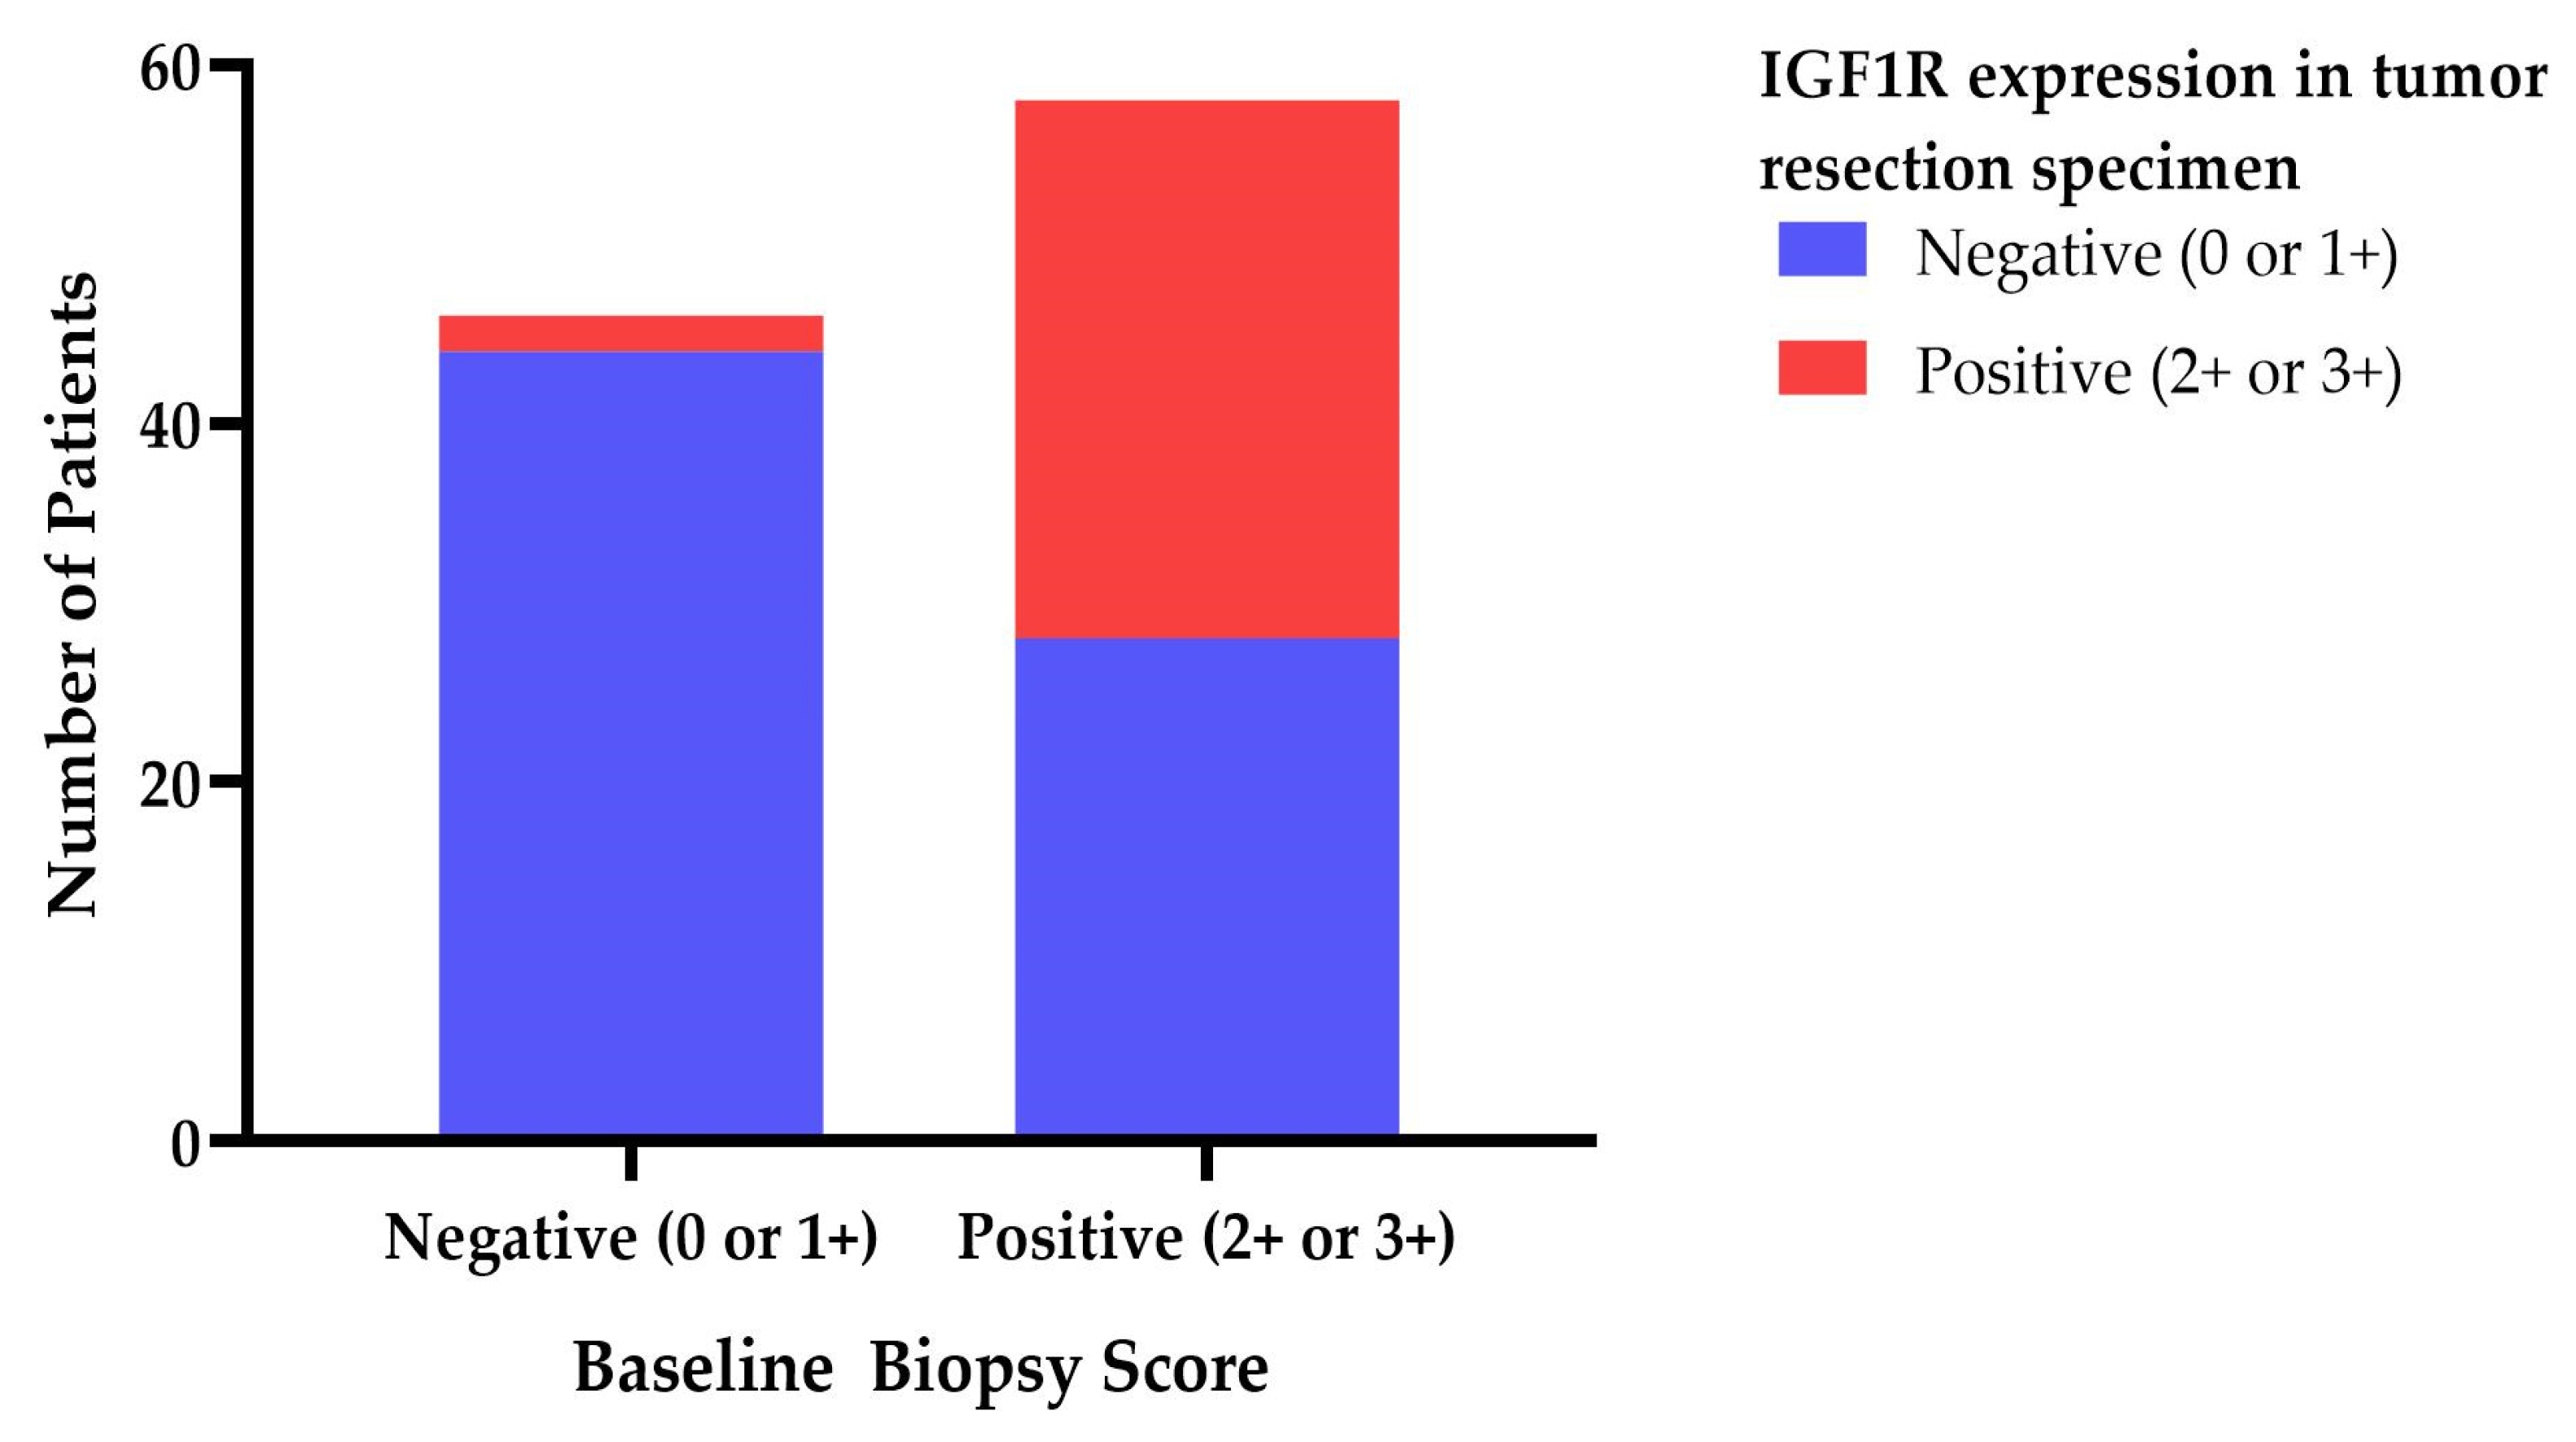
3.4. IGF1R Expression Score Is Not Associated with Clinical Response

We found that 58 of the total 104 biopsies (55.8%) were IGF1R-positive at baseline; 28 positive IGF1R biopsies at baseline became negative (48.3% of positive biopsies; 26.9% of total), while 30 remained IGF1R positive (51.7% of positive biopsies; 28.8% of total) at resection, as seen in Figure 1. Further, 44 of 46 (42.3% of total) biopsies remained IGF1R negative at resection (95.7% negative biopsies; 42.3% of total), while 2 became positive (4.3% of negative biopsies; 1.9% of total) (see Figure 1). Multivariate regression analysis uncovered no association between IGF1R biopsy or resection score and pathological or radiological response in both the ITT and PP multivariate model.

4. Discussion

This study shows that the presence of IGF1R SNVs rs3743259 and rs3743258 is associated with worse pathological response compared to the reference genotype in this cohort of patients with breast cancer treated with neoadjuvant chemotherapy (see Table 3). Additionally, our results suggest that INSR rs1051690 may be associated with worse radiological response compared to patients with the reference genotype in this study, although this association was not significant after Bonferroni correction. These findings indicate that patients with rs3743259 and rs3743258 may respond less to chemotherapy, which could imply treatment consequences, for example, to consider an alternative systemic therapy regimen. The association between rs3743259 and rs3743258 was not significant in the PP analysis, most likely due to the smaller sample size of 72 compared to 112 in the ITT analysis. Furthermore, there might be an interaction between FMD and the presence of SNVs, as shown by the exploratory analysis, and IGF1R SNVs rs2684787 and rs2654980 might interact with the FMD group differently compared to the control group regarding radiological response (Table S7).
To assess whether the observed associations could be attributed to other genes as indicated by SNVs exhibiting high linkage disequilibrium (LD), online tools LDlink and Haploreg (version 4.1) were used [18,19]. Firstly, IGF1R rs3743259 shows high LD with six other SNVs (r2 > 0.8), including IGF1R rs3743258 (r2 = 0.9). All six SNVs have not been associated with disease or pathologic processes according to PubMed. Furthermore, LDlink reports that IGF1R rs3743258 is in LD with five SNVs with an r2 > 0.8, whereas HaploReg only reports rs3743259. Nevertheless, all associated SNVs hail from the IGF1R gene, and it is, therefore, unlikely that the observed effect is originating from another gene or SNV.
Biong et al. found that rs3743259 was associated with increased mammographic density [20], which is a known risk factor for breast cancer development [21]. Together with our findings on rs3743259, this study supports the hypothesis that there could be a biological mechanism to drive breast cancer. Nevertheless, the structural and functional consequences of these SNVs on IGF1 receptor signaling have yet to be investigated.
The limitations of this study are the relatively small sample size for a genetic association study. In order to decrease the risk of reporting false-positive results, we applied a strict Bonferroni correction. The statistical limitation of this study is illustrated by the exploratory generalized linear models used to investigate the interaction between SNVs and FMD versus SNVs and control group. These results should be interpreted carefully, since analyzing the cohort in smaller groups or more complex models decreases statistical power. Therefore, the interaction between the IGF1R/INSR SNVs and FMD is important to investigate in future studies. Furthermore, radiological response data were missing for 21/129 patients (16.3%), although separate regression analysis confirmed that these missing data did not arise due to other variables.
Lastly, future research could focus on the structural effect of these IGF1R SNVs on the protein in silico, for example. Subsequently, the functional consequences, in terms of receptor affinity for ligands, should be investigated as well. In parallel, the findings of this study need validation in another, preferably larger, breast cancer cohort or a genetic databank cohort. Moreover, future studies, such as the ongoing phase III DIRECT2 (NCT05503108) study, are necessary to validate the currently reported associations. In conclusion, more translational research is needed to reveal the underlying mechanisms between the genetic variation in IGF1R and INSR in the context of fasting and clinical response in cancer.

5. Conclusions

This study identified IGF1R SNVs rs3743259 and rs3743258 as potential predictive markers for worse pathological response on neoadjuvant chemotherapy in patients with HER2-negative breast cancer. Validation and further research are essential before any clinical recommendations can be made.

Supplementary Materials

The following supporting information can be downloaded at: https://www.mdpi.com/article/10.3390/cancers15245872/s1, Table S1: Haploview; Table S2: SNV information; Table S3: Proportional odds assumption; Table S4: SNV information; Table S5: Univariate model for covariates; Table S6: Logistic regression models responders versus non-responders; Table S7: Generalized linear model SNVs and treatment interaction; Table S8: Generalized linear model SNVs and treatment interaction responders versus non-responders.

Author Contributions

Conceptualization, N.d.G., S.d.G., H.P., J.R.K. and J.J.S.; methodology, S.B. and J.J.S.; software, N.d.G. and S.B.; formal analysis, N.d.G., S.B., J.R.K. and J.J.S.; investigation, N.d.G., S.B., J.R.K. and J.J.S.; resources, S.B., J.R.K. and J.J.S.; data curation, N.d.G., S.d.G. and J.R.K.; writing—original draft preparation, N.d.G.; writing—review and editing, S.B., S.d.G., H.P., J.R.K. and J.J.S.; visualization, N.d.G. and J.J.S.; supervision, H.P., J.R.K. and J.J.S.; project administration, N.d.G. and S.d.G.; funding acquisition, S.d.G., H.P. and J.R.K. All authors have read and agreed to the published version of the manuscript.

Funding

This research was funded by Pink ribbon (grant number 2012.WO31.C155) and Amgen (20139098). The Dutch Breast Cancer Research Group (BOOG), Utrecht, the Netherlands is sponsor of this study. The APC was funded by the Leiden University Medical Center.

Institutional Review Board Statement

The study was conducted in accordance with the Declaration of Helsinki (October 2013) and approved by the Ethics Committee of Leiden University Medical Center (P13.135, date of approval l2 September 2013).

Informed Consent Statement

Informed consent was obtained from all subjects involved in the study.

Data Availability Statement

The data that support the findings of this study are available from the corresponding author, J.R.K., upon reasonable request.

Acknowledgments

The authors sincerely thank all the patients participating in this trial as well as all the participating centers, not to mention the LUMC clinical research center for trial coordination and data collection.

Conflicts of Interest

The authors declare no conflict of interest. The funders had no role in the design of the study; in the collection, analyses, or interpretation of data; in the writing of the manuscript; or in the decision to publish the results.

References

  1. Pollak, M. Insulin and insulin-like growth factor signalling in neoplasia. Nat. Rev. Cancer 2008, 8, 915–928. [Google Scholar] [CrossRef] [PubMed]
  2. Hanahan, D.; Weinberg, R.A. Hallmarks of Cancer: The Next Generation. Cell 2011, 144, 646–674. [Google Scholar] [CrossRef] [PubMed]
  3. Endogenous Hormones and Breast Cancer Collaborative Group; Key, T.J.; Appleby, P.N.; Reeves, G.K.; Roddam, A.W. Insulin-like growth factor 1 (IGF1), IGF binding protein 3 (IGFBP3), and breast cancer risk: Pooled individual data analysis of 17 prospective studies. Lancet Oncol. 2010, 11, 530–542. [Google Scholar] [PubMed]
  4. Key, T.J. Diet, insulin-like growth factor-1 and cancer risk. Proc. Nutr. Soc. 2011, 70, 385–388. [Google Scholar] [CrossRef] [PubMed]
  5. de Groot, S.; Charehbili, A.; van Laarhoven, H.W.; Mooyaart, A.L.; Dekker-Ensink, N.G.; van de Ven, S.; Janssen, L.G.M.; Swen, J.J.; Smit, V.T.H.B.M.; Heijns, J.B.; et al. Insulin-like growth factor 1 receptor expression and IGF1R 3129G > T polymorphism are associated with response to neoadjuvant chemotherapy in breast cancer patients: Results from the NEOZOTAC trial (BOOG 2010-01). Breast Cancer Res BCR. 2016, 18, 3. [Google Scholar] [CrossRef] [PubMed]
  6. Nencioni, A.; Caffa, I.; Cortellino, S.; Longo, V.D. Fasting and cancer: Molecular mechanisms and clinical application. Nat. Rev. Cancer 2018, 18, 707–719. [Google Scholar] [CrossRef] [PubMed]
  7. Raffaghello, L.; Lee, C.; Safdie, F.M.; Wei, M.; Madia, F.; Bianchi, G.; Longo, V.D. Starvation-dependent differential stress resistance protects normal but not cancer cells against high-dose chemotherapy. Proc. Natl. Acad. Sci. USA 2008, 105, 8215–8220. [Google Scholar] [CrossRef] [PubMed]
  8. Lee, C.; Safdie, F.M.; Raffaghello, L.; Wei, M.; Madia, F.; Parrella, E.; Hwang, D.; Cohen, P.; Bianchi, G.; Longo, V.D. Reduced levels of IGF-I mediate differential protection of normal and cancer cells in response to fasting and improve chemotherapeutic index. Cancer Res. 2010, 70, 1564–1572. [Google Scholar] [CrossRef]
  9. Longo, V.D.; Mattson, M.P. Fasting: Molecular mechanisms and clinical applications. Cell Metab. 2014, 19, 181–192. [Google Scholar] [CrossRef]
  10. Brandhorst, S.; Choi, I.Y.; Wei, M.; Cheng, C.W.; Sedrakyan, S.; Navarrete, G.; Dubeau, L.; Yap, L.P.; Park, R.; Vinciguerra, M.; et al. A Periodic Diet that Mimics Fasting Promotes Multi-System Regeneration, Enhanced Cognitive Performance, and Healthspan. Cell Metab. 2015, 22, 86–99. [Google Scholar] [CrossRef]
  11. Merimee, T.J.; Zapf, J.; Froesch, E.R. Insulin-like growth factors in the fed and fasted states. J. Clin. Endocrinol. Metab. 1982, 55, 999–1002. [Google Scholar] [CrossRef] [PubMed]
  12. Vernieri, C.; Fuca, G.; Ligorio, F.; Huber, V.; Vingiani, A.; Iannelli, F.; Raimondi, A.; Rinchai, D.; Frigè, G.; Belfiore, A.; et al. Fasting-mimicking diet is safe and reshapes metabolism and antitumor immunity in cancer patients. Cancer Discov. 2021, 12, 90–107. [Google Scholar] [CrossRef] [PubMed]
  13. de Groot, S.; Lugtenberg, R.T.; Cohen, D.; Welters, M.J.P.; Ehsan, I.; Vreeswijk, M.P.G.; Smit, V.T.; de Graaf, H.; Heijns, J.B.; Portielje, J.E.; et al. Fasting mimicking diet as an adjunct to neoadjuvant chemotherapy for breast cancer in the multicentre randomized phase 2 DIRECT trial. Nat. Commun. 2020, 11, 3083. [Google Scholar] [CrossRef] [PubMed]
  14. Ogston, K.N.; Miller, I.D.; Payne, S.; Hutcheon, A.W.; Sarkar, T.K.; Smith, I.; Schofield, A.; Heys, S.D. A new histological grading system to assess response of breast cancers to primary chemotherapy: Prognostic significance and survival. Breast 2003, 12, 320–327. [Google Scholar] [CrossRef]
  15. Schwartz, L.H.; Litière, S.; de Vries, E.; Ford, R.; Gwyther, S.; Mandrekar, S.; Shankar, L.; Bogaerts, J.; Chen, A.; Dancey, J.; et al. RECIST 1.1—Update and Clarification: From the RECIST Committee. Eur. J. Cancer 2016, 62, 132–137. [Google Scholar] [CrossRef] [PubMed]
  16. Kent, W.J.; Sugnet, C.W.; Furey, T.S.; Roskin, K.M.; Pringle, T.H.; Zahler, A.M.; Haussler, D. The human genome browser at UCSC. Genome Res. 2002, 12, 996–1006. [Google Scholar] [CrossRef] [PubMed]
  17. Nassar, L.R.; Barber, G.P.; Benet-Pagès, A.; Casper, J.; Clawson, H.; Diekhans, M.; Fischer, C.; Gonzalez, J.N.; Hinrichs, A.S.; Lee, B.T.; et al. The UCSC Genome Browser database: 2023 update. Nucleic Acids Res. 2023, 51, D1188–D1195. [Google Scholar] [CrossRef]
  18. Ward, L.D.; Kellis, M. HaploReg: A resource for exploring chromatin states, conservation, and regulatory motif alterations within sets of genetically linked variants. Nucleic Acids Res. 2012, 40, D930–D934. [Google Scholar] [CrossRef]
  19. Machiela, M.J.; Chanock, S.J. LDlink: A web-based application for exploring population-specific haplotype structure and linking correlated alleles of possible functional variants. Bioinformatics 2015, 31, 3555–3557. [Google Scholar] [CrossRef]
  20. Biong, M.; Gram, I.T.; Brill, I.; Johansen, F.; Solvang, H.K.; Alnaes, G.I.; Fagerheim, T.; Bremnes, Y.; Chanock, S.J.; Burdett, L.; et al. Genotypes and haplotypes in the insulin-like growth factors, their receptors and binding proteins in relation to plasma metabolic levels and mammographic density. BMC Med. Genom. 2010, 3, 9. [Google Scholar] [CrossRef]
  21. Tice, J.A.; Cummings, S.R.; Smith-Bindman, R.; Ichikawa, L.; Barlow, W.E.; Kerlikowske, K. Using clinical factors and mammographic breast density to estimate breast cancer risk: Development and validation of a new predictive model. Ann. Intern. Med. 2008, 148, 337–347. [Google Scholar] [CrossRef] [PubMed]
Figure 1. IGF1R expression in baseline tumor biopsy and tumor resection specimen.
Cancers 15 05872 g001
Table 1. Patient characteristics.
CharacteristicsLabeln Cases (Median)%Missing CasesTotal Cases
Median Age (range) years50 (27–71) 0129
Median BMI (range) kg/m2 25.8 (19.7–41.2) 0129
Randomizationchemo + FMD6550.4%0129
chemo6449.6%
Per-protocol *chemo + FMD compliant2217.1%0124
chemo + FMD non-compliant4334.7%
chemo5947.6%
HR statusER−/Progesterone−2116.3%1 (0.8%)128
ER+/Progesterone−1814.0%
ER+/Progesterone+8969.8%
Tumor TypeOther53.5%0129
Lobular2220.2%
Ductal/Carcinoma10276.3%
Tumor status **cT1118.4%0129
cT28364.9%
cT33224.4%
cT432.3%
Lymph node status **cN06348.1%0129
cN15542.0%
cN2118.4%
cN321.5%
Miller&Payne scoregrade 1 no reduction3527.1%1 (0.8%)128
grade 2 < 30% tumor reduction2620.9%
grade 3 30–90% tumor reduction3325.6%
grade 4 > 90% tumor reduction2015.5%
grade 5 no tumor1410.9%
Miller&Payne pooledgrade 1–3 non-responders9473.3%2 (1.5%)128
grade 4–5 responders3426.4%
Radiological responseCR 1614.8%23 (17.6%)108
PR 6963.9%
SD 2220.4%
PD 10.9%
Radiological response pooledCR or PR responders8578.7%23 (17.6%)108
SD or PD non-responders2321.3%
* Per protocol groups consisted of chemo + FMD compliant (≥half of the planned FMD cycles), chemo + FMD non-compliant (≤half of the planned FMD cycles) and the control group chemo. ** Tumor and lymph node status according to TNM classification. BMI body mass index (kg/m2). HR-status hormone receptor status. ER estrogen receptor. Progesterone progesterone receptor. CR complete response. PR partial response. SD stable disease. PD progression of disease.
Table 2. SNV distribution.
SNVReference GenotypeHeterozygous GenotypeHomozygous GenotypeMAF Ref AlleleNHWEp-Value *
IGF1R rs201634732562553%1130.0030.957
IGF1R rs222976535601758%1121.1160.291
IGF1R rs18150095495926%1131.7350.188
INSR rs10516517828682%1122.4470.118
INSR rs374555112505033%1120.0090.924
IGF1R rs374325958411271%1111.2970.255
IGF1R rs268478760421072%1120.4490.503
IGF1R rs265498125553346%1130.0530.818
IGF1R rs265498061421073%1130.4990.480
IGF1R rs268478827553148%1130.0720.788
IGF1R rs37432495947773%1130.3460.556
IGF1R rs4548409651461665%1131.1180.290
INSR rs38332387730681%1131.7000.192
INSR rs10516902298215%1130.0950.757
INSR rs17998178524486%1131.8020.179
INSR rs22526733238213%1080.7600.383
IGF1R rs374325857351272%1043.0720.080
SNV single nucleotide variant, INSR insulin receptor gene, IGF1R insulin like growth factor 1 receptor gene, MAF mean allele frequency, HWE Hardy–Weinberg equation. * if <0.05—not consistent with HWE. Call rate minimum is 92%.
Table 3. Primary multivariate ordinal regression model intention to treat.
Miller & Payne Radiological Response
SNVsNOR95%CI Lower-Upperp-ValueNOR95%CI Lower-Upperp-Value
IGF1R rs20163471121.520.94-2.460.09920.890.48-1.670.72
IGF1R rs22297651111.030.61-1.730.91911.140.58-2.250.70
IGF1R rs18150091120.830.46-1.500.53920.920.43-1.980.84
INSR rs10516511111.460.82-2.620.20911.690.80-3.590.17
INSR rs37455511110.990.60-1.660.98911.880.93-3.770.08
IGF1R rs37432591100.420.24-0.730.002911.100.56-2.160.79
IGF1R rs26847871111.230.73-2.070.44910.920.47-1.800.80
IGF1R rs26549811121.230.77-1.980.39920.980.54-1.780.96
IGF1R rs26549801121.250.75-2.110.39920.880.45-1.720.71
IGF1R rs26847881121.540.96-2.490.08921.000.54-1.830.99
IGF1R rs37432491121.390.79-2.450.25920.950.47-1.940.89
IGF1R rs454840961121.030.64-1.650.91921.040.56-1.940.89
INSR rs38332381121.320.75-2.350.34921.750.83-3.670.14
INSR rs10516901120.530.27-1.060.07922.921.16-7.360.02
INSR rs17998171120.780.40-1.490.45921.890.74-4.810.18
INSR rs22526731070.870.42-1.780.70882.370.89-6.340.09
IGF1R rs37432581030.400.23-0.700.002861.120.57-2.200.75
Cut off value Bonferroni correction for multiple testing is 0.05/17 = 0.0029. OR odds ratio, CI confidence interval, SNV single nucleotide variant, INSR insulin receptor, IGF1R insulin like growth factor 1 receptor. Bold: statistically significant.
Table 4. Primary multivariate ordinal regression model per protocol.
SNVsMiller & PayneRadiological Response
NOR95%CIp-ValueNOR95%CIp-Value
IGF1R rs2016347721.400.74-2.630.30610.760.34-1.740.52
IGF1R rs2229765721.210.63-2.330.57610.930.41-2.130.87
IGF1R rs1815009721.070.52-2.190.86610.560.22-1.410.22
INSR rs1051651721.110.56-2.210.77611.670.71-3.940.24
INSR rs3745551721.490.79-2.800.22611.720.77-3.870.19
IGF1R rs3743259720.490.25-0.940.03611.240.56-2.720.59
IGF1R rs2684787711.290.66-2.520.46600.450.18-1.120.09
IGF1R rs2654981720.980.51-1.880.94610.910.42-2.000.82
IGF1R rs2654980721.360.70-2.640.37610.430.17-1.050.06
IGF1R rs2684788721.330.71-2.500.37610.850.38-1.870.68
IGF1R rs3743249721.100.54-2.210.80611.370.57-3.300.49
IGF1R rs45484096721.070.59-1.940.83610.680.31-1.490.33
INSR rs3833238721.010.51-2.020.97611.580.67-3.730.29
INSR rs1051690720.410.16-1.040.061613.411.09-10.630.035
INSR rs1799817720.510.21-1.280.15611.550.46-5.310.48
INSR rs2252673691.300.56-3.040.54591.680.56-5.020.35
IGF1R rs3743258680.460.24-0.910.03591.230.56-2.700.61
Cut off value Bonferroni correction for multiple testing is 0.05/17 = 0.0029. OR odds ratio, CI confidence interval, SNV single nucleotide variant, INSR insulin receptor, IGF1R insulin-like growth factor 1 receptor.
Disclaimer/Publisher’s Note: The statements, opinions and data contained in all publications are solely those of the individual author(s) and contributor(s) and not of MDPI and/or the editor(s). MDPI and/or the editor(s) disclaim responsibility for any injury to people or property resulting from any ideas, methods, instructions or products referred to in the content.

