Article

Photodynamic Therapy with an Association of Methylene Blue and Toluidine Blue Promoted a Synergic Effect against Oral Squamous Cell Carcinoma

1
Department of Life Sciences, State University of Bahia, 2555, Salvador 41150-000, BA, Brazil
2
Gonçalo Moniz Institute, Oswaldo Cruz Foundation (FIOCRUZ), 121, Salvador 40296-710, BA, Brazil
3
Institute of Innovation in Advanced Health Systems (ISI SAS), University Center SENAI/CIMATEC, 1845, Salvador 41650-010, BA, Brazil
4
Institute of Health Sciences, Federal University of Bahia, Salvador 40231-300, BA, Brazil
*
Authors to whom correspondence should be addressed.
Cancers 2023, 15(23), 5509; https://doi.org/10.3390/cancers15235509
Submission received: 17 October 2023 / Revised: 3 November 2023 / Accepted: 7 November 2023 / Published: 22 November 2023
(This article belongs to the Special Issue Advances in Anticancer Drugs and Pharmacotherapy of Cancer)

Abstract

:

Simple Summary

Among the most malignant cancers, oral squamous cell carcinoma stands out as the most common malignant head and neck tumor, with high prevalence around the world, mainly in developing countries. Despite advances in the field of treatment, the prognosis of patients with oral squamous cell carcinoma remains poor, with a 5-year survival rate of less than 50%. Aiming to overcome the limitations of currently existing therapies, the present work proposes to investigate the potential of photodynamic therapy with methylene blue or toluidine blue. We found higher incorporation rates of both drugs in tumor cells compared to the non-tumor cell line. In addition, photodynamic therapy increases cytotoxic activity of both compounds for all lineages evaluated. Moreover, combination of both compounds promotes a synergistic effect on the viability of oral squamous cell carcinoma, opening up possibilities for the use of photodynamic therapy against other cancer cell types using combinations of these photosensitizers.

Abstract

Among the most malignant cancers, oral squamous cell carcinoma (OSCC) stands out as the most common malignant head and neck tumor. Despite advances in the field of treatment, the prognosis of patients with OSCC remains poor. Aiming to overcome the limitations of the currently existing therapies against OSCC, the present work aims to investigate the potential of photodynamic therapy (PDT) with phenothiazine derivatives used alone or in combination. The incorporation of methylene blue (MB) and toluidine blue (TB) was evaluated in OSCC cell lines (HSC-3 and SCC-9) and a nontumor cell line (Hfib). Both compounds exhibited concentration and time-dependent incorporation, with higher rates observed in tumor cells. Regarding dark-phase cytotoxic activity, SCC-9 cells were the most sensitive cell line with an IC50 value of 362.6 µM and 41.4 µM for MB and TB, respectively. Using PDT, all lineages showed greater sensitivity, presenting lower IC50 values when compared to the dark phase values. The combination index values of 0.69 (dark phase) and 0.73 (clear phase) associated with concave isobolograms, in both phases, revealed that MB and TB have synergistic effects when combined against SCC-9 cells. These findings suggest that MB or TB assisted with PDT holds promise for OSCC treatment.

1. Introduction

Among the most malignant cancers, oral squamous cell carcinoma (OSCC) stands out as the most common malignant head and neck tumor, with high prevalence around the world, mainly in developing countries [1,2]. OSCC comprises more than 90% of oral cancers and approximately two thirds of cases occur in developing countries [2]. The first-line treatment is surgical resection associated with chemotherapy or radiotherapy, which can be performed before or after the surgical procedure [3]. Despite advances in the field of treatment, the prognosis of patients with OSCC remains poor, with a 5-year survival rate of less than 50% being reported in the literature [4]. Therefore, new therapies for OSCC are still required.
An attractive option for the treatment of OSCC is the use of photodynamic therapy (PDT). PDT involves the use of a photosensitizer along with a special type of light that, when combined, induce the production of a form of oxygen that is harmful to various cell types, including tumor cells [5,6,7]. PDT presents itself as a potentially applicable, safe and accessible option, being an attractive option compared to the use of conventional chemotherapy, mainly with regard to not inducing resistance and not requiring multiple treatment sessions [8]. PDT is a minimally invasive therapeutic modality that is based on the administration (systemic or topical) of a photosensitizer followed by light activation. The photosensitizer is a type of photoactive pigment that generates singlet oxygen by irradiating visible light using a wavelength that corresponds to its absorption spectrum [9,10]. The activated photosensitizer can react with molecules in its vicinity by transferring electrons or hydrogen, leading to the production of free radicals (type I reaction) or by transferring energy to oxygen, leading to the production of singlet oxygen, causing damage in a more effective way in tumor cells than in normal cells, resulting in the selective death of these cells via apoptotic or necrotic mechanisms (type II reaction). Both pathways can lead to cell death and destruction of diseased tissue [11]. This therapeutic approach has been shown to be a promising alternative for the treatment of several histotypes of cancer, such as: oropharyngeal cancer, esophageal cancer and cutaneous carcinoma [12,13,14].
Among the various classes of photosensitizers, phenothiazines stand out for being molecules with great potential and propensity for the formation of reactive oxygen species [15]. So far, more than 5000 phenothiazine derivatives have been obtained and this class has been highlighted for its variety of chemical and biological properties, low cost and use associated with few adverse effects, since it is activated by ambient light and quickly eliminated from the body [16]. Within the class, methylene blue (MB) and toluidine blue (TB) stand out for their use in the medical and dental fields, both for diagnosis (histopathological stains, tumor identification) and for treatments of diseases such as: cancer, septic shock, malaria, methemoglobinemia and Alzheimer’s [17,18,19,20,21]. Aiming to overcome the limitations of currently existing therapies for OSCC, the present work proposes to investigate the potential of PDT with phenothiazine derivatives used alone or in combination.

2. Materials and Methods

2.1. Drugs

Methylene blue (MB) and toluidine blue (TB) were purchased from Sigma-Aldrich (St. Louis, MO, USA). Both compounds were diluted in PBS and filtered with a 0.22 µm syringe filter. Both compounds were stored in a −20 °C freezer until use.

2.2. Cell Culture

HSC-3 (human tongue squamous cell carcinoma) and SCC-9 (human tongue squamous cell carcinoma) cell lines were obtained from the American Type Culture Collection (ATCC, Manassas, VA, USA). Both cell lines were cultured in DMEM/F12 medium (1:1 mixture of Dulbecco’s modified Eagle’s medium and Ham’s F12 medium, Waltham, MA, USA,) supplemented with 10% fetal bovine serum (FBS; GIBCO-BRL, Gaithersburg, MD, USA), 400 ng/mL hydrocortisone (Sigma-Aldrich) and 50 µg/mL of gentamicin (Life, Carlsbad, CA, USA). The normal human epithelial fibroblast cell line (Hfib) was isolated from a healthy donor skin biopsy and cultured in DMEM medium (GIBCO) supplemented with 10% FBS and 50 µg/mL of gentamicin, as previously described [22]. The cells were maintained in a humidified incubator at 37 °C and 5% CO2. All cell lines were regularly tested for mycoplasma contamination using MycoAlert® Mycoplasma Detection Kit (Lonza, Basel, Switzerland).

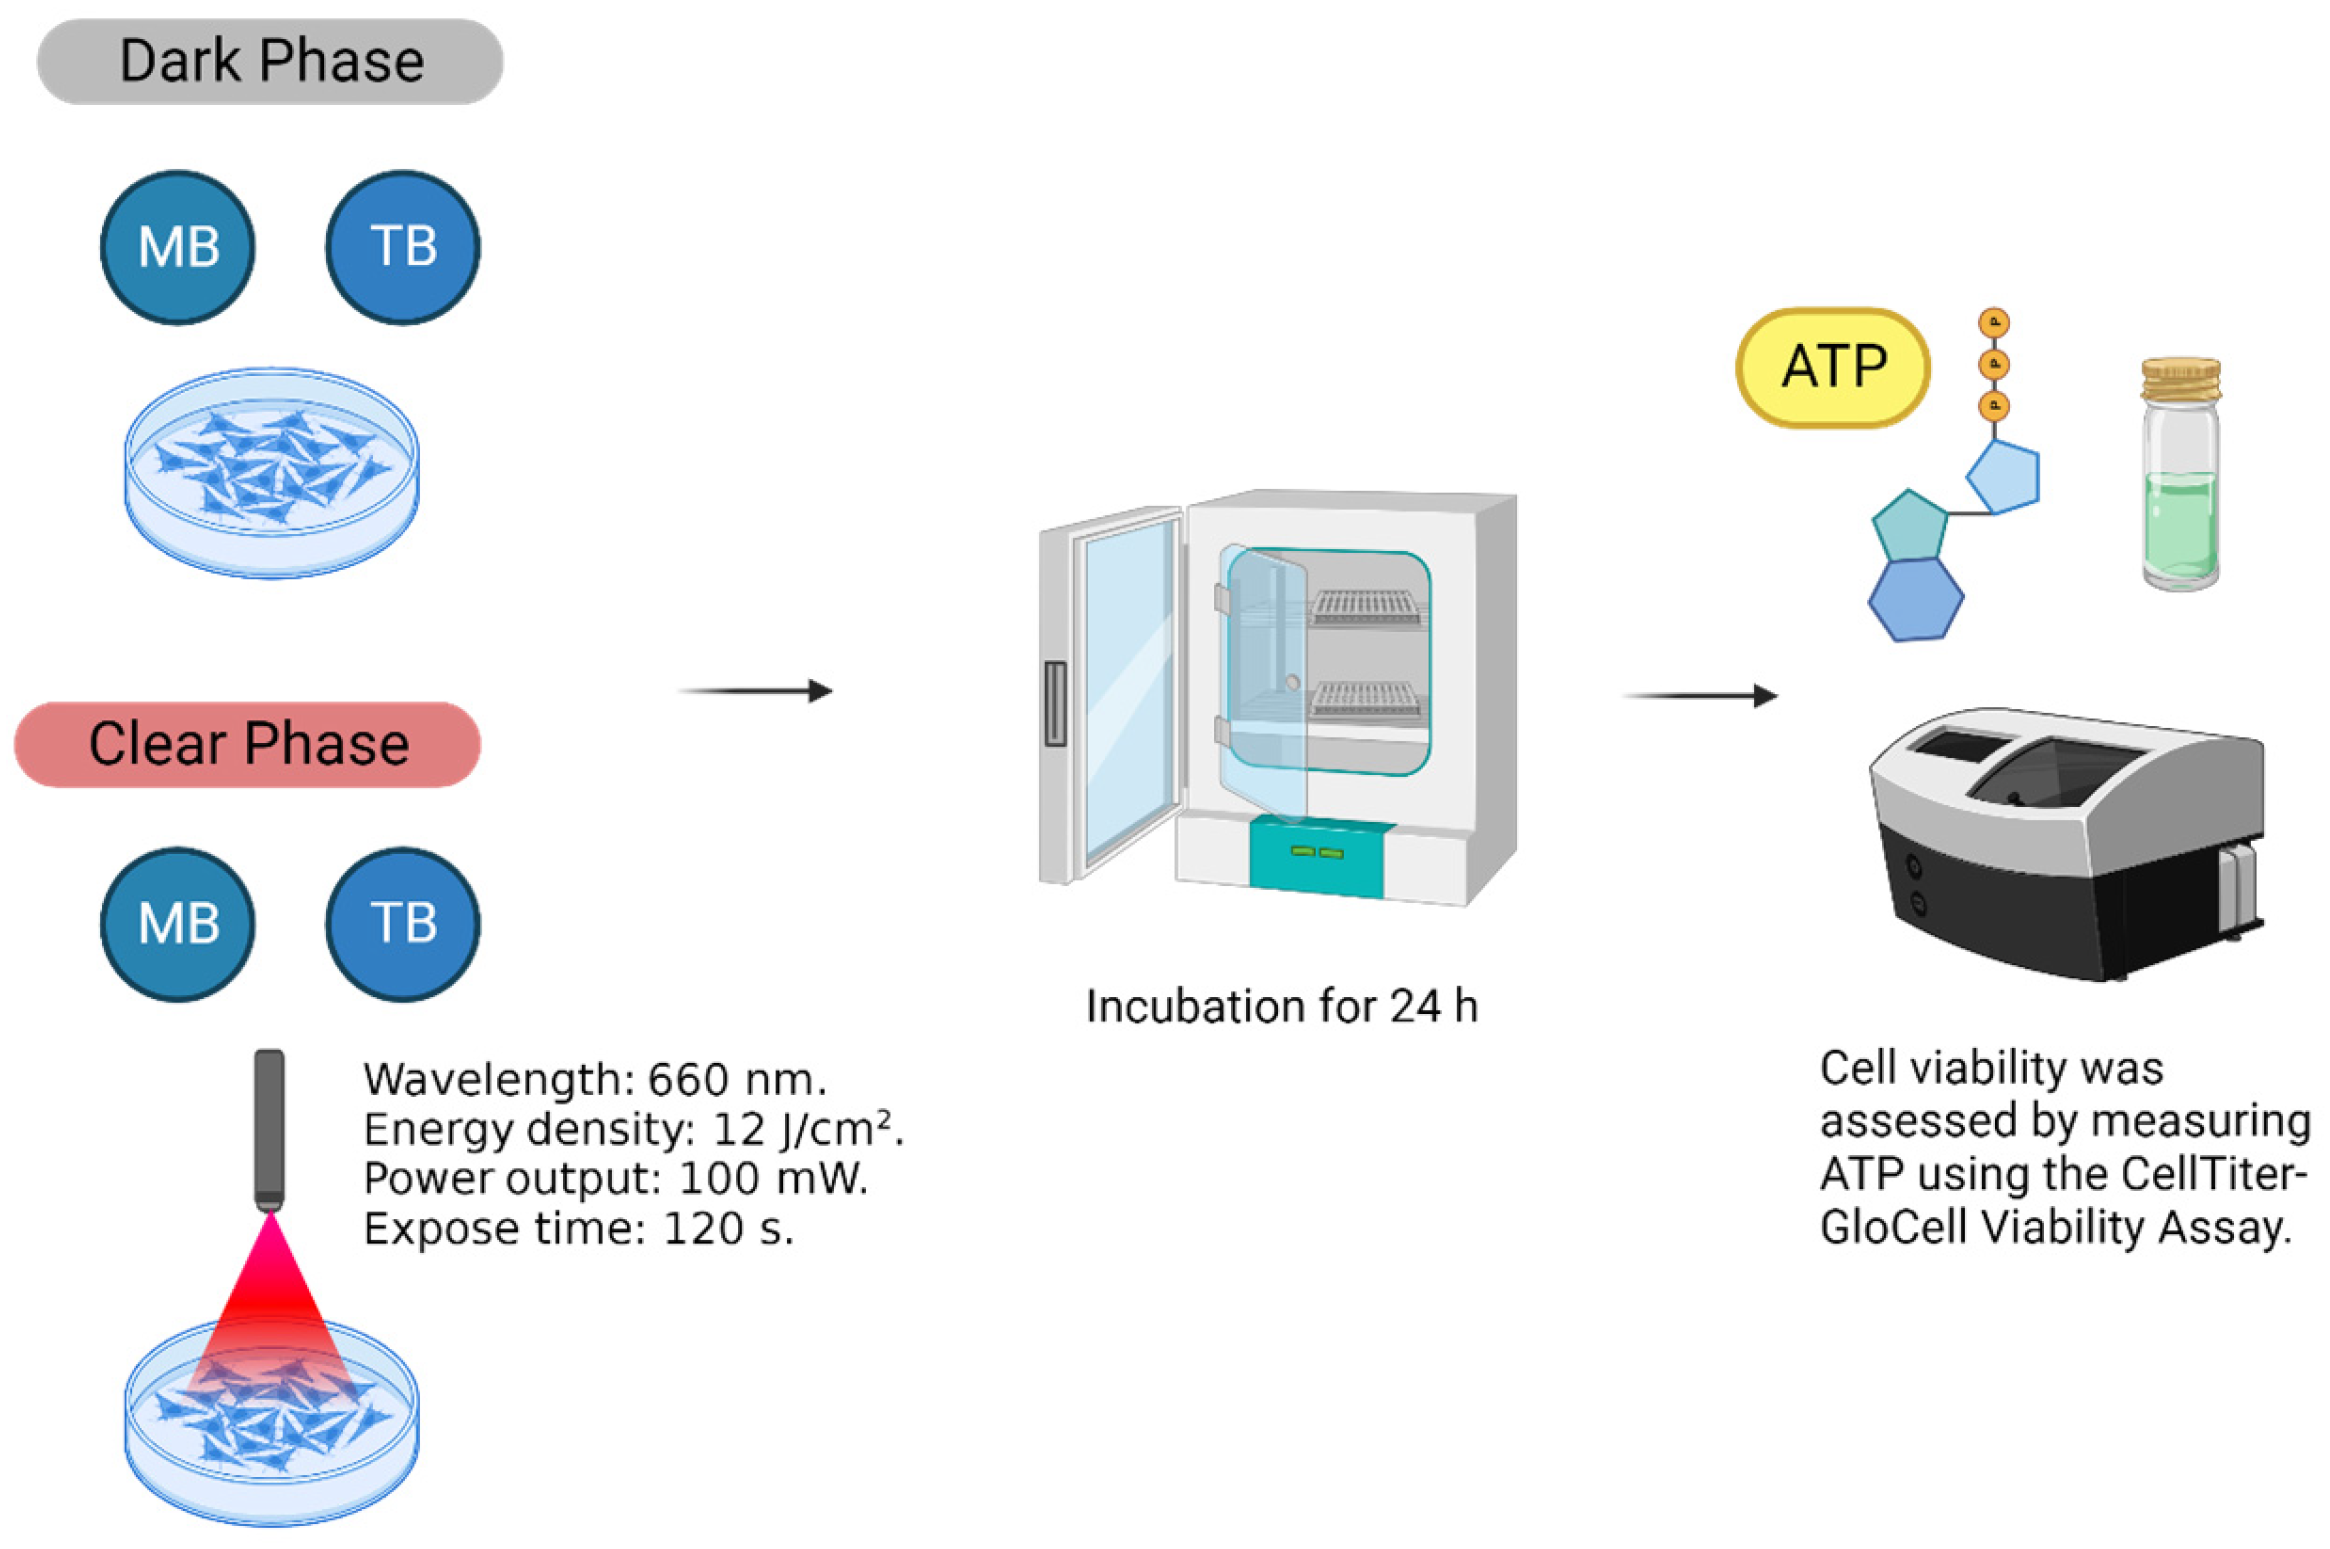
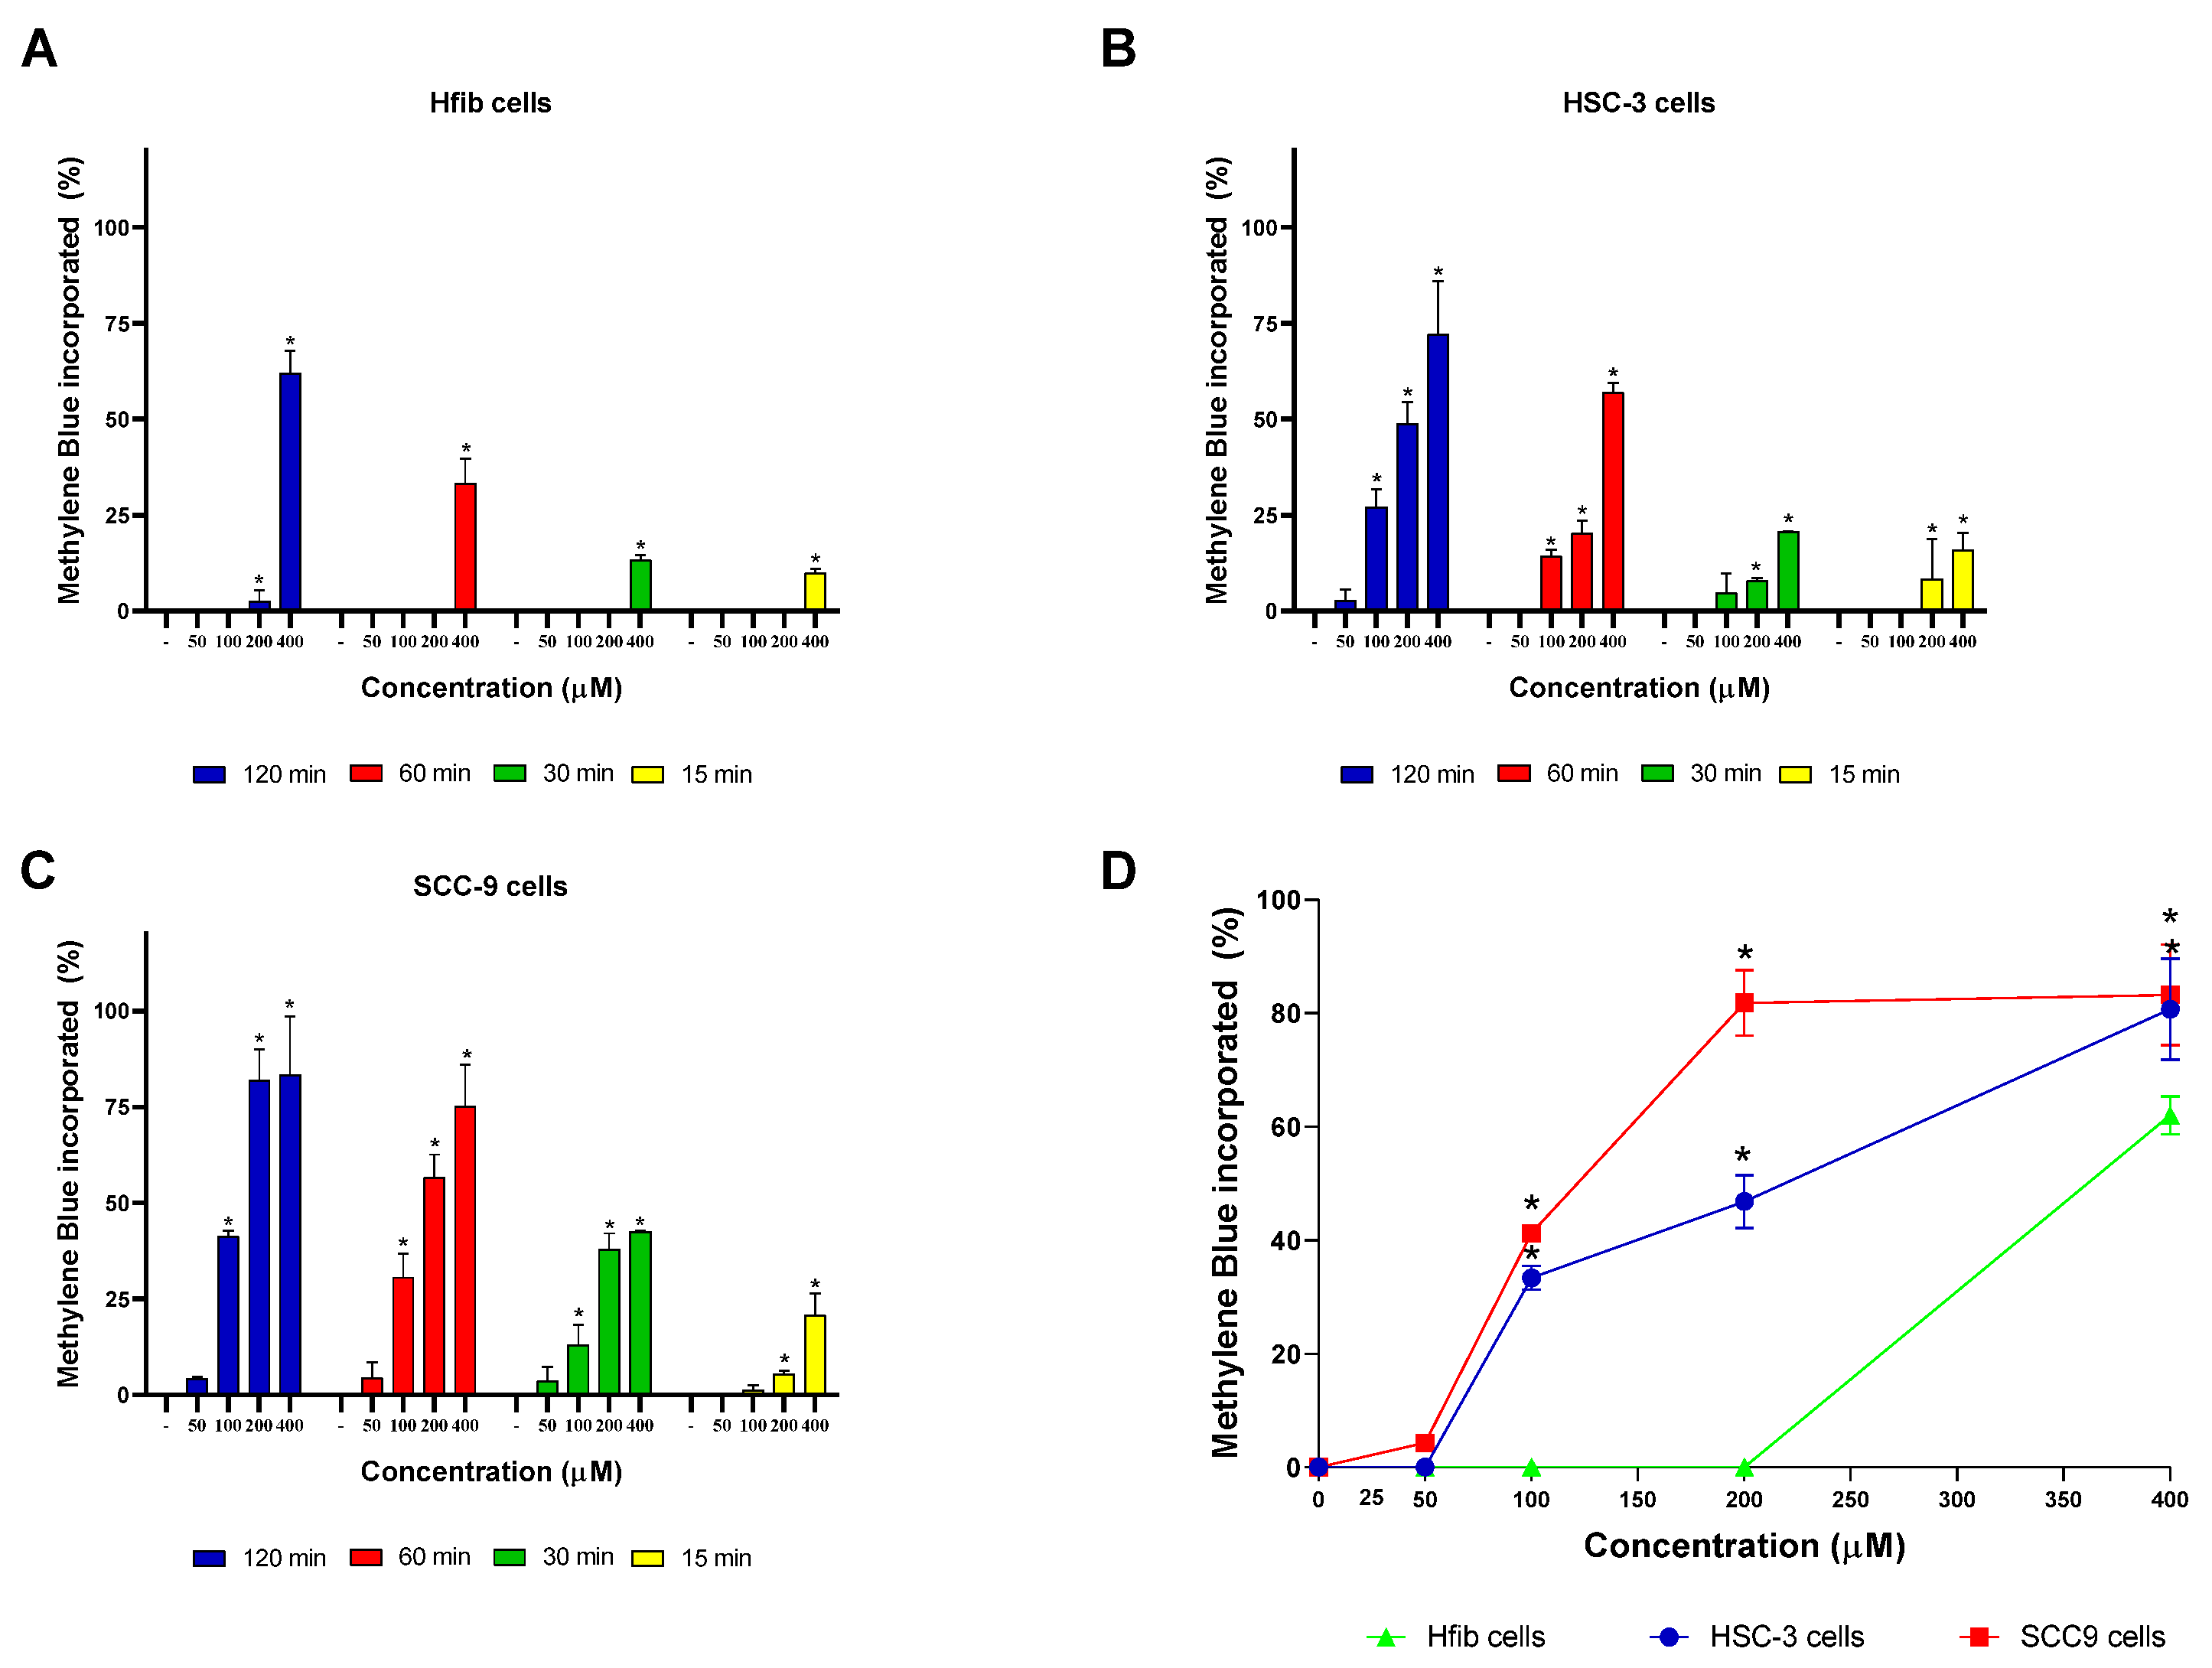
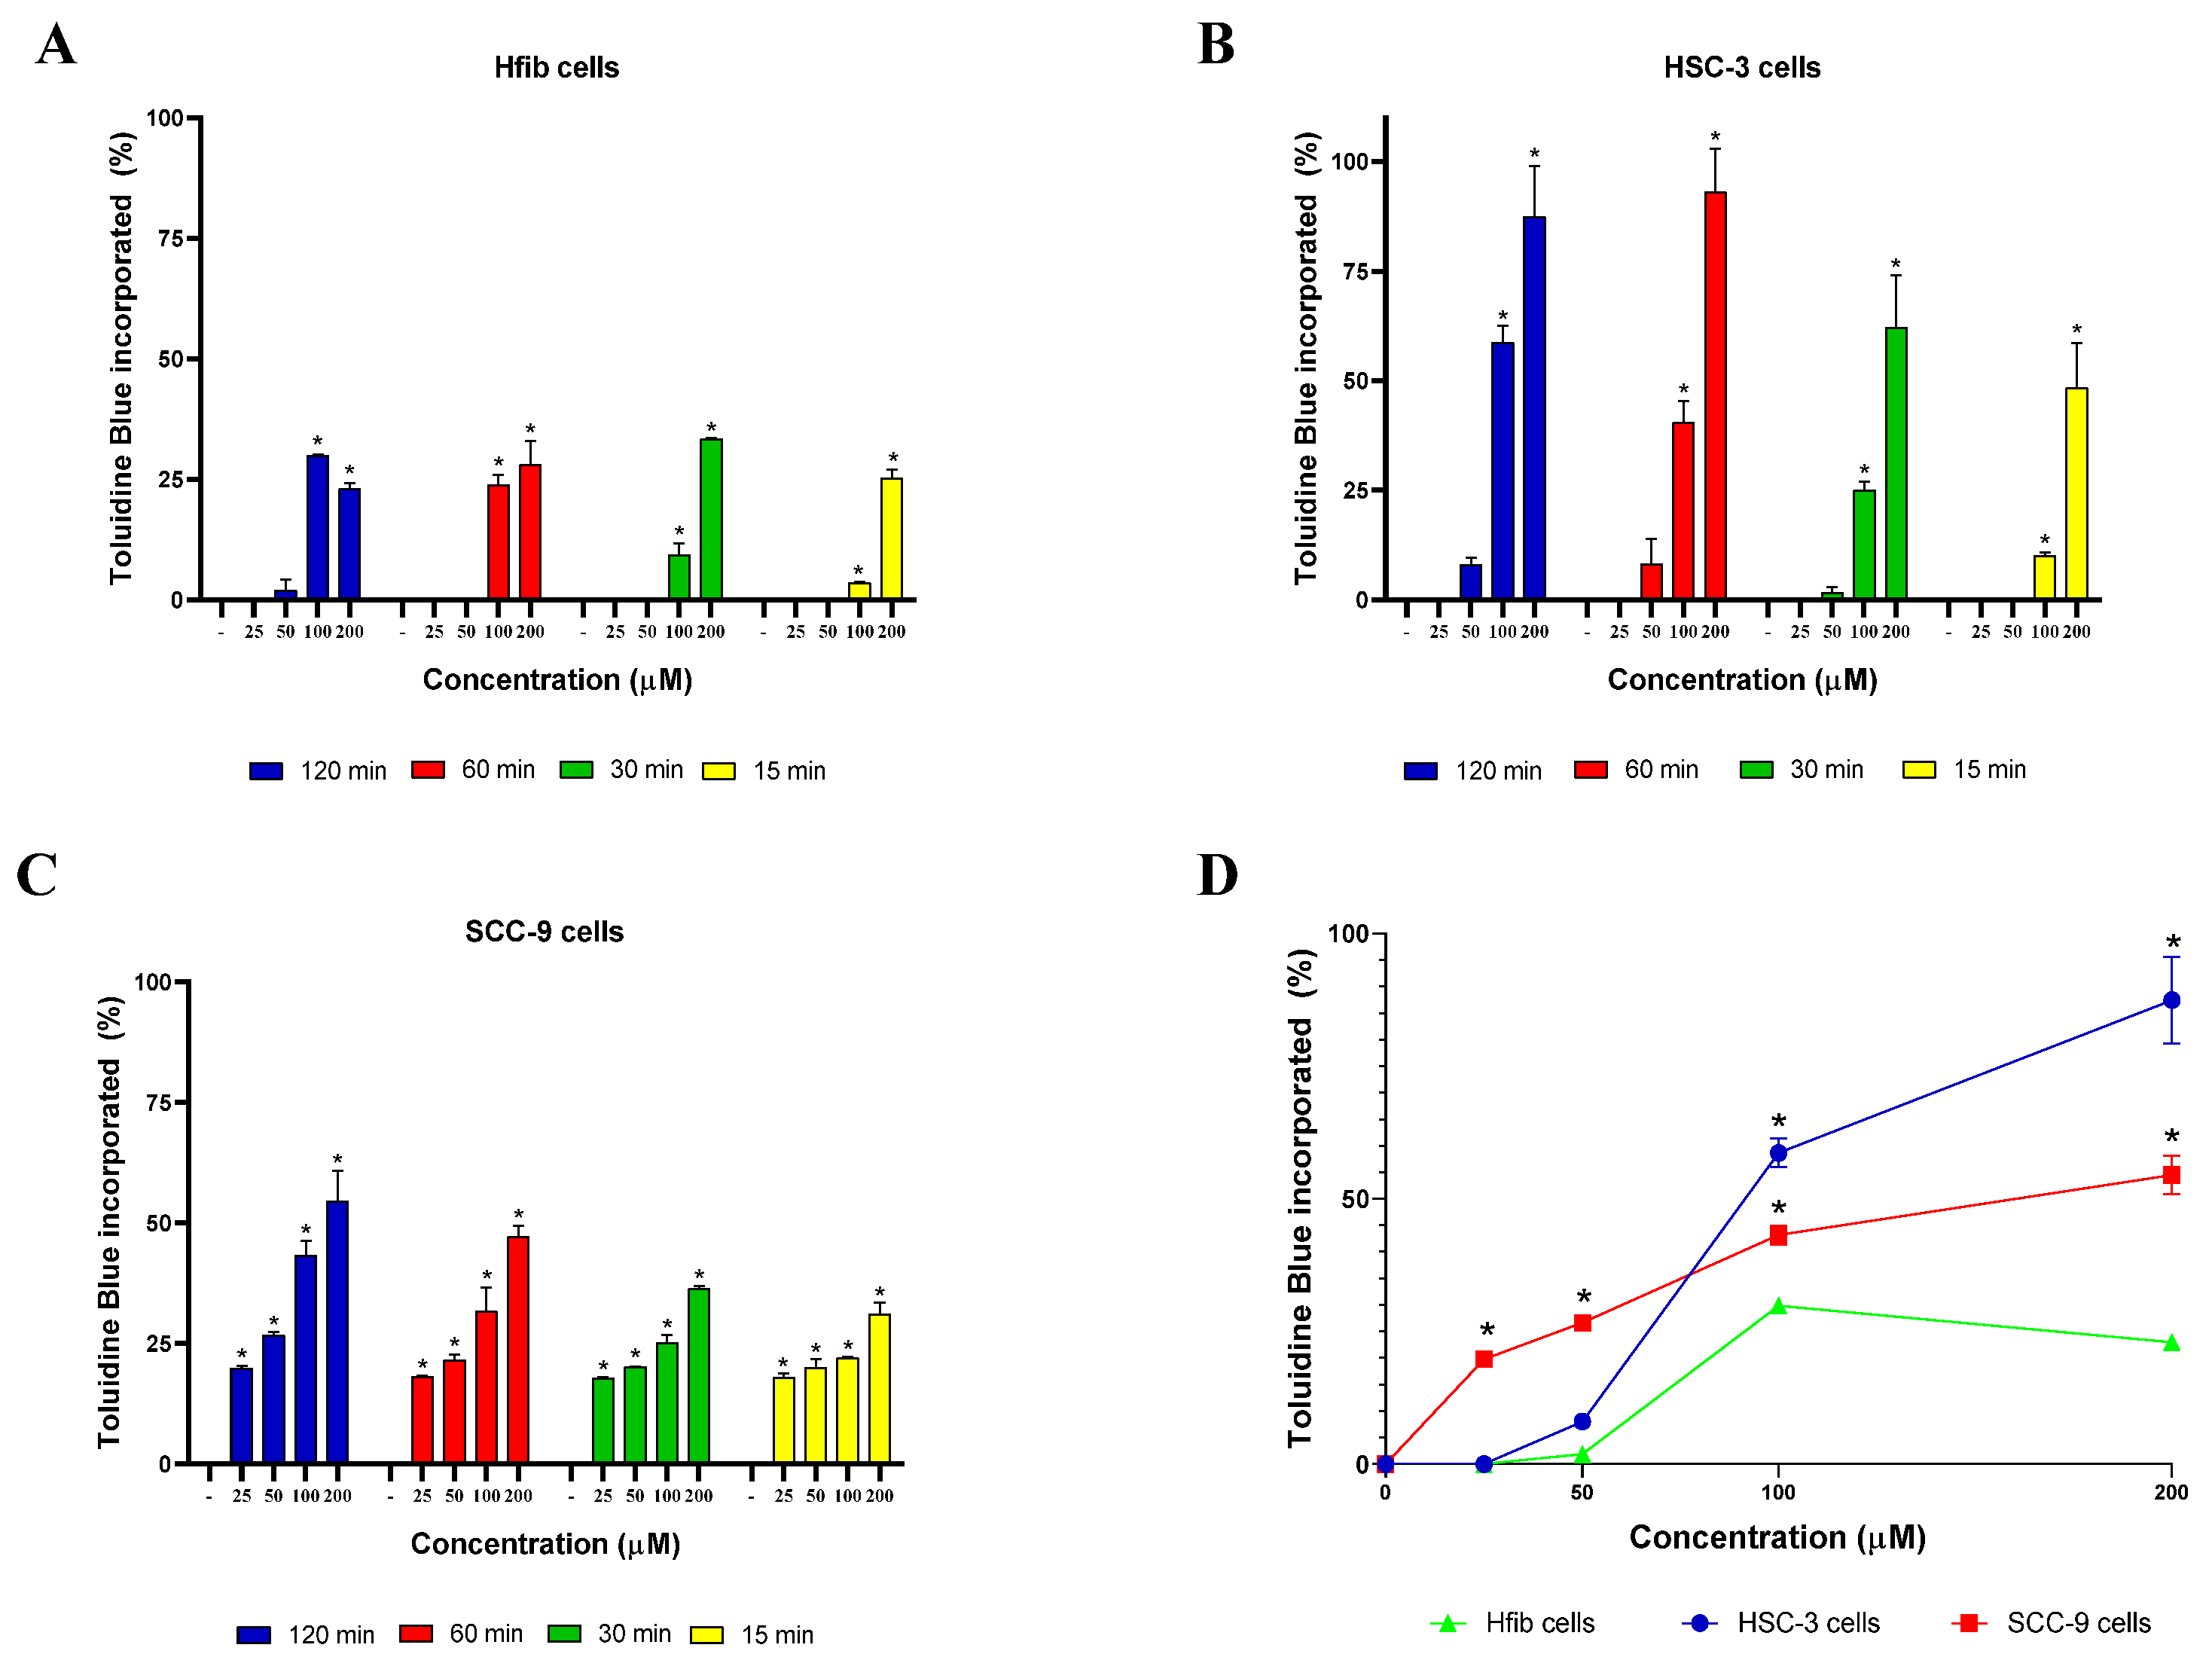
2.3. MB and TB Incorporation Test

Initially, all the cell lines were plated into 96-well plates at a cell density of 2 × 10⁴ cells/well in their respective medium described above for 24 h at 37 °C and 5% CO2. After that time, different concentrations of MB (12.5–400 µM) or TB (6.25–200 µM) were added to the plate, in triplicate, and the plates were incubated for different times (15, 30, 60 and 120 min). Then, the plates were washed twice with PBS and the cells were incubated with sodium dodecyl sulfate (SDS; Sigma-Aldrich; 100 µL of a solution of 50 mM diluted in PBS) to promote cell membrane lysis and release of MB or TB incorporated by the cells for 30 min in room temperature. The absorbance of the incorporated MB or TB was measured in a spectrophotometer at a wavelength of 660 nm. Three independent experiments were performed.

2.4. Cell Viability

The cells were plated into 96-well plates at a cell density of 2 × 10⁴ cells/well in in their respective medium described above for 24 h at 37 °C and 5% CO2. After that time, different concentrations of MB (12.5–400 µM) or TB (6.25–200 µM) were added to the plate, in quadruplicate, and the plates were incubated were at 37 °C for 2 h. Then, the plates were washed twice with PBS, the medium was replaced, and the plates were incubated at 37 °C for an additional 24 h. Finally, cell viability was measured using CellTiter-Glo® Luminescent Cell viability assay, which indicates cell viability by measuring ATP, following the manufacturer’s instructions. Both compounds were tested in the absence of light (dark phase) or after photodynamic exposure (clear phase) with a diode laser which has a semiconductor active medium InGaAlP (λ 660 nm, 100 mW, 12 J/cm2, CW, Flash Lase III, DMC equipamentos, São Carlos, São Paulo, Brazil) (Figure 1). The photodynamic exposure was carried out after the washes with PBS in wells with 200 µL of DMEM.

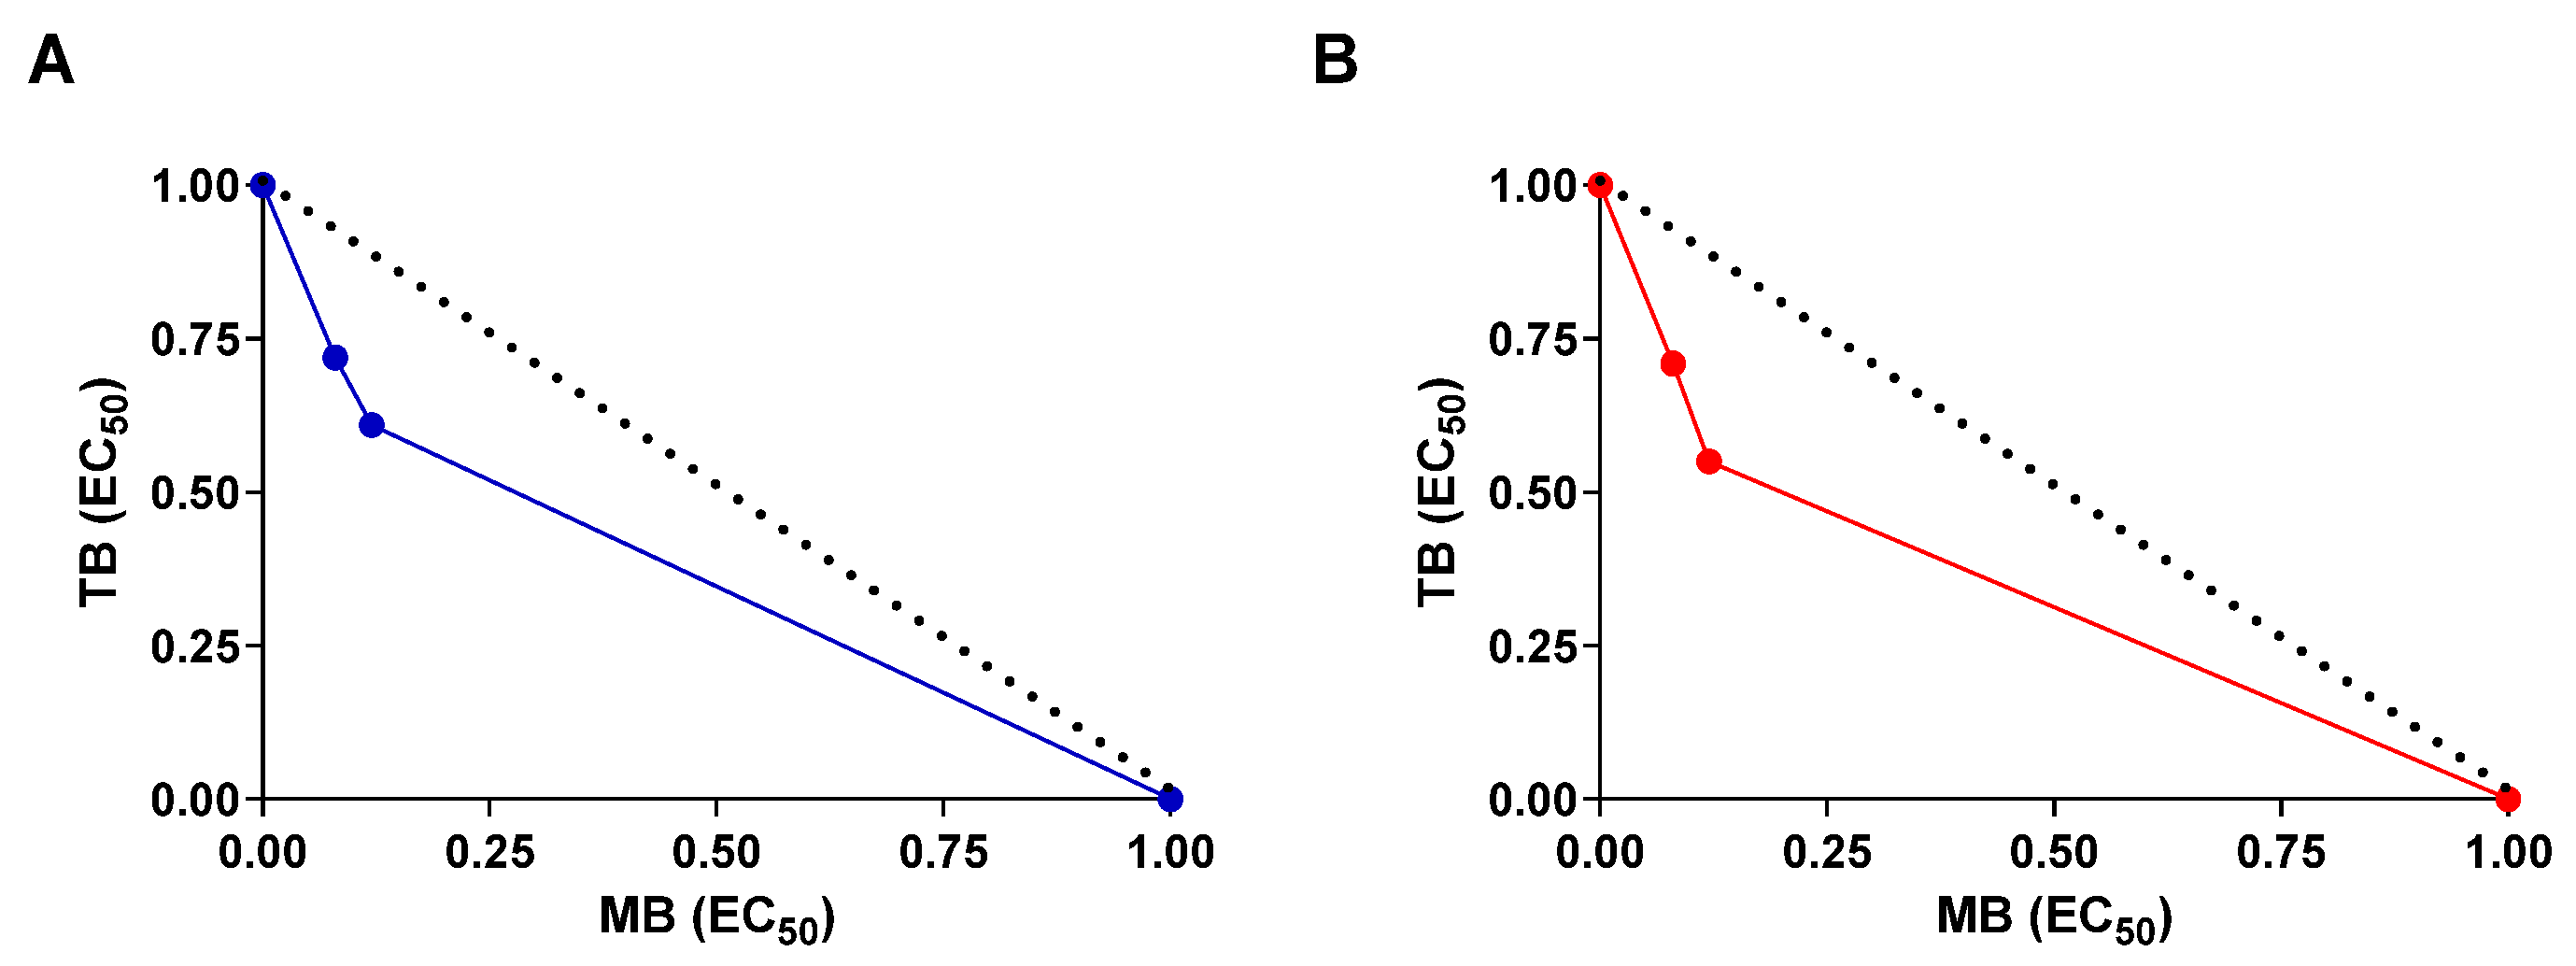
2.5. Drug Combination Assay

For in vitro drug combinations, each one of the drugs was tested in eight concentrations alone (12.5–400 µM) or combined in a ratio of 1:1 or 2:1 MB/TB (3.12–200 µM) against SCC-9 cells following the protocol described above. The combined therapy was performed during both the dark and clear phase. The analysis of the combined effects was performed by determining the combination index (CI), used as cutoff to determine synergism, by using the Chou–Talalay CI method [23], and through the construction of an isobologram using the fixed ratio method, as described previously [24].

2.6. Statistical Analyses

We used non-linear regression for calculating the IC50 values. One-way analysis of variance and Newman–Keuls multiple comparison tests were used to determine the statistical significance of the group comparisons in the in vitro assays. The results were considered statistically significant when p was <0.05. All analyses were performed using Graph Pad Prism version 8.0 (Graph Pad Software, San Diego, CA, USA).

3. Results and Discussion

Initially, the incorporation of phenothiazine derivatives (MB and TB) was determined in oral squamous cell carcinomas (HSC-3 and SCC-9) and in a non-tumor cell line (Hfib). As revealed in Figure 2, MB incorporation showed a concentration and time-dependent profile for all cell lines, with the highest incorporation rates after two hours of incubation for all lineages. Interestingly, significant rates (p < 0.05) of MB incorporation by non-tumor cells were only observed at the highest concentration evaluated (400 µM), which is different to what was observed in tumor cells that had significant rates (p < 0.05) of MB incorporation at concentrations ranging from 100 to 400 µM (Figure 2). Among the three evaluated lineages, the SCC-9 cell line showed the highest MB incorporation rates (Figure 2).
The TB incorporation rate was also evaluated in the three cell lines. An incorporation profile similar to that of MB was observed, with the two tumor cell lines having more significant incorporation rates (p < 0.05) than the non-tumor cell line, especially at 100 or 200 µM (Figure 3). A concentration and time-dependent incorporation of TB was also observed in the tumor cell lines, with the time of 2 h showing the highest TB incorporation rates for both tumor cell lines. Regarding the lineage with the highest TB incorporation rates, we observed that at high concentrations (100 and 200 µM), the HSC-3 lineage had greater absorption and at lower concentrations (25 and 50 µM) the SCC-9 cell line had higher rates of incorporation (Figure 3).
The tendency of both compounds being better incorporated by tumor cells than non-tumor cells is well described in the literature [25,26,27]. This feature justifies the employment of both compounds as a visual tumor marker to detect and delineate certain types of cancers, especially on oral cavity, and their use as photosensitizers for the treatment of different types of cancer [28,29]. The selectivity of the evaluated phenothiazine derivatives may be related to the compounds’ affinity for low-density lipoproteins (LDLs), which are found in greater amounts in tumor cells [30]. LDLs promote the cholesterol uptake that is necessary for membrane formation during cell division and work as a “transporter” of the photosensitizers into intracellular space [31,32]. Once tumor cells have increased mitotic division rates, they have a high expression of lipoprotein receptors on the cell surface and a higher LDL uptake [30,33].
Regarding cytotoxic activity in the dark phase, MB showed a significant inhibitory effect on cell viability, especially at 400 µM for all lineages, with the SCC-9 cell line being the most sensitive with an IC50 value of 362.6 µM (Figure 4; Table 1). After using a fixed energy density (J/cm2) to excite MB, we found an increase in cytotoxic effect, with IC50 values of 234.5, 307.4 and 294.4 µM against HSC-3, SCC-9 and Hfib cells, respectively, versus IC50 values of >400, 362.6 and >400 in the dark phase, respectively (Table 1). The largest difference was observed in HSC-3 cells at 400 μM. When tested in the absence of light, MB (400 μM) caused an inhibition of 34.3% in cell viability. Under the same conditions, however, in the presence of light, MB (400 μM) inhibited 70.3% of cell viability (Figure 4). The difference observed between the groups was statistically significant (p < 0.05). MB-PDT is well employed against several types of cancer such as: cervical carcinoma, leukemia, osteosarcoma, mammary adenocarcinoma, melanoma and lung adenocarcinoma [7,29,34,35,36]. However, MB-PDT effects on OSCCs are poorly described and also evaluated with methodologies less sensitive than the ATP-based assay as was used in the present work [37,38,39]. Previously, KOFLER and colleagues [37] demonstrated cytotoxic activity of MB alone or with PDT in CA-9-22 cells, and LE and colleagues [38] showed the cytotoxic activity of MB in SCC-25 cells.
In comparison to MB, TB showed a more prominent cytotoxic effect on cell viability in the dark phase for all lineages, especially in concentrations between 50 and 200 µM (Figure 4). As revealed in Table 1, the lowest IC50 value found was obtained using the SCC-9 cell line (41.4 µM). The dark toxicity of TB is well characterized in the literature and also associated with undesired side effects, thereby limiting the concentrations and doses that can be used [40,41,42].
In the clear phase, all lineages showed greater sensitivity, presenting lower IC50 values when compared to the dark phase values, again with the SCC-9 cell line showing the highest sensitivity with an IC50 value of 33.8 µM (Table 1). The largest difference was observed in SCC-9 cells at 50 μM. When tested in the dark phase, TB caused an inhibition of 52.6% in cell viability. Under the same conditions, however, in the presence of light, TB inhibited 86% of cell viability (Figure 4). The difference observed between groups was statistically significant (p < 0.05). Similar results using TB-PDT were found using breast cancer cell lines, where TB presented an IC50 value of 1.13 µM in the dark phase and 0.88 µM in the presence of light, reinforcing the advantages of PDT [41]. Despite its already established use in conjunction with other techniques in the field of cancer diagnosis, the use of TB as a photosensitizer for the treatment of oral cancer is not much discussed in the literature [42]. It is also important to report that exposure to PDT without a photosensitizer did not cause loss of cell viability in the three lineages evaluated, suggesting that the phototoxicity must be attributed exclusively to phenothiazine derivatives as previously reported [41,43].
Lastly, the cytotoxic activity of MB and TB in combination was investigated against SCC-9 cells, the most sensitive lineage for both compounds. First the combination was carried out in the absence of light, where MB and TB presented IC50 values of 368.5 and 43.8 µM when tested individually, and 30.5 and 26.9 µM when tested in combination, respectively. These data demonstrate an approximately 13-fold reduction in the IC50 value for MB and an approximately 2-fold reduction in the IC50 value for TB (Table 2).
Drug combination was also performed in the presence of light. As shown in Table 2, in the clear phase, MB and TB showed IC50 values of 302.3 and 33.7 µM when tested separately and 23.4 and 22.4 µM when combined, respectively. These data demonstrate an approximately 13-fold reduction in the IC50 value for MB and an approximately 1.5-fold in the IC50 value for TB.
Moreover, the combination index values of 0.69 (dark phase) and 0.73 (clear phase) associated with concave isobolograms, in both phases, revealed that MB and TB have synergistic effects when combined against the cell viability of SCC-9 cells (Table 2; Figure 5). Interestingly, the synergistic effect of MB and TB in the dark phase has already been demonstrated on the inhibition of the proliferation of amastigotes of T. cruzi with a combination index of 0.89 [44]. In addition, combination of MB plus TB in the clear phase eliminated the bacterial growth of Xanthomonas campestris pv. campestris found in naturally contaminated canola seeds, which did not occur when the photosensitizers were tested alone [45]. For treatment of OSCC, this is the first report related to the synergic effect of a combination of MB plus TB in the dark phase and clear phase. However, combinations of phenothiazine derivatives assisted with photodynamic therapy already show synergistic effects with other molecules and with recognized cytotoxic activity. For example, combination therapy with MB-assisted photodynamic therapy and salicylic acid or with doxorubicin against breast cancer cells improve the efficacy of chemotherapy [46,47].

4. Conclusions

In sum, MB or TB assisted with PDT as a useful strategy for the treatment of oral carcinoma was reinforced in the present investigation. In addition, it was shown that the combination of MB and TB has a synergistic effect on the viability of oral squamous cell carcinoma, opening up possibilities for the use of PDT against other cancer cell types using combinations of these phenothiazine derivatives already well characterized as promising photosensitizers.

Author Contributions

Conceptualization, G.S., C.M. and M.S.; formal analysis, É.R., L.B., S.J. and G.S.; funding acquisition, M.S.; methodology, É.R. and S.J.; supervision, C.M. and M.S.; validation, É.R., S.J. and C.M.; writing—original draft, É.R. and L.B.; writing—review and editing, C.M. and M.S. All authors have read and agreed to the published version of the manuscript.

Funding

This work was supported by grants from Fundação de Amparo à Pesquisa do Estado da Bahia (FAPESB; (grant number 0002/2014).

Institutional Review Board Statement

Ethics Committee of Integrated Manufacturing and Technology Campus (CIMATEC)–SENAI/BAHIA (CAAE: 20244619.1.0000.9287).

Informed Consent Statement

Informed consent was obtained from all subjects involved in the study.

Data Availability Statement

The data presented in this study are available on request from the corresponding author.

Conflicts of Interest

The authors declare no conflict of interest.

References

  1. Sung, H.; Ferlay, J.; Siegel, R.L.; Laversanne, M.; Soerjomataram, I.; Jemal, A.; Bray, F. Global Cancer Statistics 2020: GLOBOCAN Estimates of Incidence and Mortality Worldwide for 36 Cancers in 185 Countries. CA Cancer J. Clin. 2021, 71, 209–249. [Google Scholar] [CrossRef] [PubMed]
  2. Warnakulasuriya, S.; Kerr, A.R. Oral Cancer Screening: Past, Present, and Future. J. Dent. Res. 2021, 100, 1313–1320. [Google Scholar] [CrossRef] [PubMed]
  3. Imbesi Bellantoni, M.; Picciolo, G.; Pirrotta, I.; Irrera, N.; Vaccaro, M.; Vaccaro, F.; Squadrito, F.; Pallio, G. Oral Cavity Squamous Cell Carcinoma: An Update of the Pharmacological Treatment. Biomedicines 2023, 11, 1112. [Google Scholar] [CrossRef] [PubMed]
  4. Ferreira, A.K.; Carvalho, S.H.; Granville-Garcia, A.F.; Sarmento, D.J.; Agripino, G.G.; Abreu, M.H.; Melo, M.C.; Caldas, A.D., Jr.; Godoy, G.P. Survival and Prognostic Factors in Patients with Oral Squamous Cell Carcinoma. Med. Oral Patol. Oral Cir. Bucal 2021, 26, e387–e392. [Google Scholar] [CrossRef]
  5. Correia, J.H.; Rodrigues, J.A.; Pimenta, S.; Dong, T.; Yang, Z. Photodynamic Therapy Review: Principles, Photosensitizers, Applications, and Future Directions. Pharmaceutics 2021, 13, 1332. [Google Scholar] [CrossRef]
  6. Nelke, K.H.; Pawlak, W.; Gerber, H.; Leszczyszyn, J. Head and Neck Cancer Patients’ Quality of Life. Adv. Clin. Exp. Med. 2014, 23, 1019–1027. [Google Scholar] [CrossRef] [PubMed]
  7. Dos Santos, A.F.; Terra, L.F.; Wailemann, R.A.; Oliveira, T.C.; Gomes, V.M.; Mineiro, M.F.; Meotti, F.C.; Bruni-Cardoso, A.; Baptista, M.S.; Labriola, L. Methylene Blue Photodynamic Therapy Induces Selective and Massive Cell Death in Human Breast Cancer Cells. BMC Cancer 2017, 17, 194. [Google Scholar] [CrossRef] [PubMed]
  8. Wang, X.; Luo, D.; Basilion, J.P. Photodynamic Therapy: Targeting Cancer Biomarkers for the Treatment of Cancers. Cancers 2021, 13, 2992. [Google Scholar] [CrossRef]
  9. Nafee, N.; Youssef, A.; El-Gowelli, H.; Asem, H.; Kandil, S. Antibiotic-free nanotherapeutics: Hypericin nanoparticles thereof for improved in vitro and in vivo antimicrobial photodynamic therapy and wound healing. Int. J. Pharm. 2013, 454, 249–258. [Google Scholar] [CrossRef]
  10. Li, G.; Sun, L.; Ji, L.; Chao, H. Ruthenium(II) Complexes with dppz: From Molecular Photoswitch to Biological Applications. Dalton Trans. 2016, 45, 13261–13276. [Google Scholar] [CrossRef]
  11. Agostinis, P.; Berg, K.; Cengel, K.A.; Foster, T.H.; Girotti, A.W.; Gollnick, S.O.; Hahn, S.M.; Hamblin, M.R.; Juzeniene, A.; Kessel, D.; et al. Photodynamic Therapy of Cancer: An Update. CA Cancer J. Clin. 2011, 61, 250–281. [Google Scholar] [CrossRef]
  12. Pantiushenko, I.V.; Rudakovskaya, P.G.; Starovoytova, A.V.; Mikhaylovskaya, A.A.; Abakumov, M.A.; Kaplan, M.A.; Tsygankov, A.A.; Majouga, A.G.; Grin, M.A.; Mironov, A.F. Development of Bacteriochlorophyll a-Based Near-Infrared Photosensitizers Conjugated to Gold Nanoparticles for Photodynamic Therapy of Cancer. Biochemistry 2015, 80, 752–762. [Google Scholar] [CrossRef]
  13. Mallidi, S.; Anbil, S.; Bulin, A.L.; Obaid, G.; Ichikawa, M.; Hasan, T. Beyond the Barriers of Light Penetration: Strategies, Perspectives and Possibilities for Photodynamic Therapy. Theranostics 2016, 6, 2458–2487. [Google Scholar] [CrossRef] [PubMed]
  14. Zhang, Q.; Li, L. Photodynamic Combinational Therapy in Cancer Treatment. J. BUON 2018, 23, 561–567. [Google Scholar]
  15. Varga, B.; Csonka, Á.; Csonka, A.; Molnár, J.; Amaral, L.; Spengler, G. Possible Biological and Clinical Applications of Phenothiazines. Anticancer Res. 2017, 37, 5983–5993. [Google Scholar] [CrossRef]
  16. Andreadis, D.; Pavlou, A.-M.; Sotiriou, E.; Vrani, F.; Ioannides, D.; Kolokotronis, A. Utility of Photodynamic Therapy for the Management of Oral Potentially Malignant Disorders and Oral Cancer. Transl. Res. Oral Oncol. 2016, 1, 2057178X16669161. [Google Scholar] [CrossRef]
  17. Preiser, J.C.; Lejeune, P.; Roman, A.; Carlier, E.; De Backer, D.; Leeman, M.; Kahn, R.J.; Vincent, J.L. Methylene Blue Administration in Septic Shock: A Clinical Trial. Crit. Care Med. 1995, 23, 259–264. [Google Scholar] [CrossRef] [PubMed]
  18. Clifton, J., 2nd; Leikin, J.B. Methylene Blue. Am. J. Ther. 2003, 10, 289–291. [Google Scholar] [CrossRef] [PubMed]
  19. Meissner, P.E.; Mandi, G.; Coulibaly, B.; Witte, S.; Tapsoba, T.; Mansmann, U.; Rengelshausen, J.; Schiek, W.; Jahn, A.; Walter-Sack, I.; et al. Methylene Blue for Malaria in Africa: Results from a Dose-finding Study in Combination with Chloroquine. Malar J. 2006, 5, 84. [Google Scholar] [CrossRef]
  20. Yin, R.; Hamblin, M.R. Antimicrobial Photosensitizers: Drug Discovery Under the Spotlight. Curr. Med. Chem. 2015, 22, 2159–2185. [Google Scholar] [CrossRef]
  21. Oz, M.; Lorke, D.E.; Petroianu, G.A. Methylene Blue and Alzheimer’s Disease. Biochem. Pharmacol. 2009, 78, 927–932. [Google Scholar] [CrossRef]
  22. Martins, G.L.S.; Paredes, B.D.; Sampaio, G.L.A.; Nonaka, C.K.V.; da Silva, K.N.; Allahdadi, K.J.; França, L.S.A.; Soares, M.B.P.; Dos Santos, R.R.; Souza, B.S.F. Generation of human iPS cell line CBTCi001-A from dermal fibroblasts obtained from a healthy donor. Stem Cell Res. 2019, 41, 101630. [Google Scholar] [CrossRef] [PubMed]
  23. Chou, T.C.; Talalay, P. Quantitative Analysis of Dose-Effect Relationships: The Combined Effects of Multiple Drugs or Enzyme Inhibitors. Adv. Enzyme Regul. 1984, 22, 27–55. [Google Scholar] [CrossRef] [PubMed]
  24. Fivelman, Q.L.; Adagu, I.S.; Warhurst, D.C. Modified Fixed-Ratio Isobologram Method for Studying In Vitro Interactions Between Atovaquone and Proguanil or Dihydroartemisinin Against Drug-Resistant Strains of Plasmodium falciparum. Antimicrob. Agents Chemother. 2004, 48, 4097–4102. [Google Scholar] [CrossRef] [PubMed]
  25. Peng, Q.; Brown, S.B.; Moan, J.; Nesland, J.M.; Wainwright, M.; Griffiths, J.; Dixon, B.; Cruse-Sawyer, J.; Vernon, D. Biodistribution of a Methylene Blue Derivative in Tumor and Normal Tissues of Rats. J. Photochem. Photobiol. B 1993, 20, 63–71. [Google Scholar] [CrossRef]
  26. Tremblay, J.F.; Dussault, S.; Viau, G.; Gad, F.; Boushira, M.; Bissonnette, R. Photodynamic Therapy with Toluidine Blue in Jurkat Cells: Cytotoxicity, Subcellular Localization and Apoptosis Induction. Photochem. Photobiol. Sci. 2002, 1, 852–856. [Google Scholar] [CrossRef]
  27. Gandolfo, S.; Pentenero, M.; Broccoletti, R.; Pagano, M.; Carrozzo, M.; Scully, C. Toluidine Blue Uptake in Potentially Malignant Oral Lesions In Vivo: Clinical and Histological Assessment. Oral Oncol. 2006, 42, 89–95. [Google Scholar] [CrossRef]
  28. Warnakulasuriya, K.A.; Johnson, N.W. Sensitivity and Specificity of OraScan® Toluidine Blue Mouthrinse in the Detection of Oral Cancer and Precancer. J. Oral Pathol. Med. 1996, 25, 97–103. [Google Scholar] [CrossRef]
  29. Kirszberg, C.; Rumjanek, V.M.; Capella, M.A. Methylene Blue Is More Toxic to Erythroleukemic Cells Than to Normal Peripheral Blood Mononuclear Cells: A Possible Use in Chemotherapy. Cancer Chemother. Pharmacol. 2005, 56, 659–665. [Google Scholar] [CrossRef]
  30. Kwiatkowski, S.; Knap, B.; Przystupski, D.; Saczko, J.; Kędzierska, E.; Knap-Czop, K.; Kotlińska, J.; Michel, O.; Kotowski, K.; Kulbacka, J. Photodynamic Therapy-Mechanisms, Photosensitizers and Combinations. Biomed. Pharmacother. 2018, 106, 1098–1107. [Google Scholar] [CrossRef]
  31. Hamblin, M.R.; Newman, E.L. Photosensitizer Targeting in Photodynamic Therapy. II. Conjugates of Haematoporphyrin with Serum Lipoproteins. J. Photochem. Photobiol. B 1994, 26, 147–157. [Google Scholar] [CrossRef]
  32. Castano, A.P.; Demidova, T.N.; Hamblin, M.R. Mechanisms in Photodynamic Therapy: Part Three-Photosensitizer Pharmacokinetics, Biodistribution, Tumor Localization and Modes of Tumor Destruction. Photodiagnosis Photodyn. Ther. 2005, 2, 91–106. [Google Scholar] [CrossRef]
  33. Cruz, P.M.; Mo, H.; McConathy, W.J.; Sabnis, N.; Lacko, A.G. The Role of Cholesterol Metabolism and Cholesterol Transport in Carcinogenesis: A Review of Scientific Findings, Relevant to Future Cancer Therapeutics. Front. Pharmacol. 2013, 4, 119. [Google Scholar] [CrossRef]
  34. de Freitas, L.M.; Serafim, R.B.; de Sousa, J.F.; Moreira, T.F.; Dos Santos, C.T.; Baviera, A.M.; Valente, V.; Soares, C.P.; Fontana, C.R. Photodynamic Therapy Combined to Cisplatin Potentiates Cell Death Responses of Cervical Cancer Cells. BMC Cancer 2017, 17, 123. [Google Scholar] [CrossRef]
  35. Guan, J.; Lai, X.; Wang, X.; Leung, A.W.; Zhang, H.; Xu, C. Photodynamic Action of Methylene Blue in Osteosarcoma Cells In Vitro. Photodiagnosis Photodyn. Ther. 2014, 11, 13–19. [Google Scholar] [CrossRef] [PubMed]
  36. Rodríguez-Córdova, R.J.; Gutiérrez-Valenzuela, C.A.; Bojang, P.; Esquivel, R.; Hernández, P.; Ramos, K.S.; Guzmán-Zamudio, R.; Lucero-Acuña, A. Differential Response of BEAS-2B and H-441 Cells to Methylene Blue Photoactivation. Anticancer Res. 2019, 39, 3739–3744. [Google Scholar] [CrossRef] [PubMed]
  37. Kofler, B.; Romani, A.; Pritz, C.; Steinbichler, T.B.; Schartinger, V.H.; Riechelmann, H.; Dudas, J. Photodynamic Effect of Methylene Blue and Low Level Laser Radiation in Head and Neck Squamous Cell Carcinoma Cell Lines. Int. J. Mol. Sci. 2018, 19, 1107. [Google Scholar] [CrossRef] [PubMed]
  38. Le, M.N.; Wuertz, B.R.; Biel, M.A.; Thompson, R.L.; Ondrey, F.G. Effects of Methylene Blue Photodynamic Therapy on Oral Carcinoma and Leukoplakia Cells. Laryngoscope Investig. Otolaryngol. 2022, 7, 982–987. [Google Scholar] [CrossRef] [PubMed]
  39. Nowak, E.; Kammerer, S.; Küpper, J.H. ATP-Based Cell Viability Assay Is Superior to Trypan Blue Exclusion and XTT Assay in Measuring Cytotoxicity of Anticancer Drugs Taxol and Imatinib, and Proteasome Inhibitor MG-132 on Human Hepatoma Cell Line HepG2. Clin. Hemorheol. Microcirc. 2018, 69, 327–336. [Google Scholar] [CrossRef]
  40. Blázquez-Castro, A.; Stockert, J.C.; Sanz-Rodríguez, F.; Zamarrón, A.; Juarranz, A. Differential Photodynamic Response of Cultured Cells to Methylene Blue and Toluidine Blue: Role of Dark Redox Processes. Photochem. Photobiol. Sci. 2009, 8, 371–376. [Google Scholar] [CrossRef] [PubMed]
  41. Guo, H.; Wang, H.; Deng, H.; Zhang, Y.; Yang, X.; Zhang, W. Facile Preparation of Toluidine Blue-Loaded DNA Nanogels for Anticancer Photodynamic Therapy. Front. Bioeng. Biotechnol. 2023, 11, 1180448. [Google Scholar] [CrossRef]
  42. Mills, S. How Effective Is Toluidine Blue for Screening and Diagnosis of Oral Cancer and Premalignant Lesions? Evid. Based Dent. 2022, 23, 34–35. [Google Scholar] [CrossRef]
  43. Barbosa, A.F.S.; Santos, I.P.; Santos, G.M.P.; Bastos, T.M.; Rocha, V.P.C.; Meira, C.S.; Soares, M.B.P.; Pitta, I.R.; Pinheiro, A.L.B. Anti-Trypanosoma cruzi Effect of the Photodynamic Antiparasitic Chemotherapy Using Phenothiazine Derivatives as Photosensitizers. Lasers Med. Sci. 2020, 35, 79–85. [Google Scholar] [CrossRef] [PubMed]
  44. Bulhões Portapilla, G.; Pereira, L.M.; Bronzon da Costa, C.M.; Voltarelli Providello, M.; Sampaio Oliveira, P.A.; Goulart, A.; Ferreira Anchieta, N.; Wainwright, M.; Leite Braga, G.Ú.; de Albuquerque, S. Phenothiazinium Dyes Are Active against Trypanosoma cruzi In Vitro. Biomed Res. Int. 2019, 2019, 8301569. [Google Scholar] [CrossRef] [PubMed]
  45. Zancan, N.L.B.; Tebaldi, N.D. Terapia fotodinâmica no controle de Xanthomonas campestris pv. campestris in vitro e no tratamento de sementes de canola naturalmente contaminadas. Summa Phytopathol. 2020, 46, 327–332. [Google Scholar] [CrossRef]
  46. Hosseinzadeh, R.; Khorsandi, K.; Jahanshiri, M. Combination Photodynamic Therapy of Human Breast Cancer Using Salicylic Acid and Methylene Blue. Spectrochim. Acta A Mol. Biomol. Spectrosc. 2017, 184, 198–203. [Google Scholar] [CrossRef]
  47. Yousefi Sadeghloo, A.; Khorsandi, K.; Kianmehr, Z. Synergistic Effect of Photodynamic Treatment and Doxorubicin on Triple Negative Breast Cancer Cells. Photochem. Photobiol. Sci. 2020, 19, 1580–1589. [Google Scholar] [CrossRef]
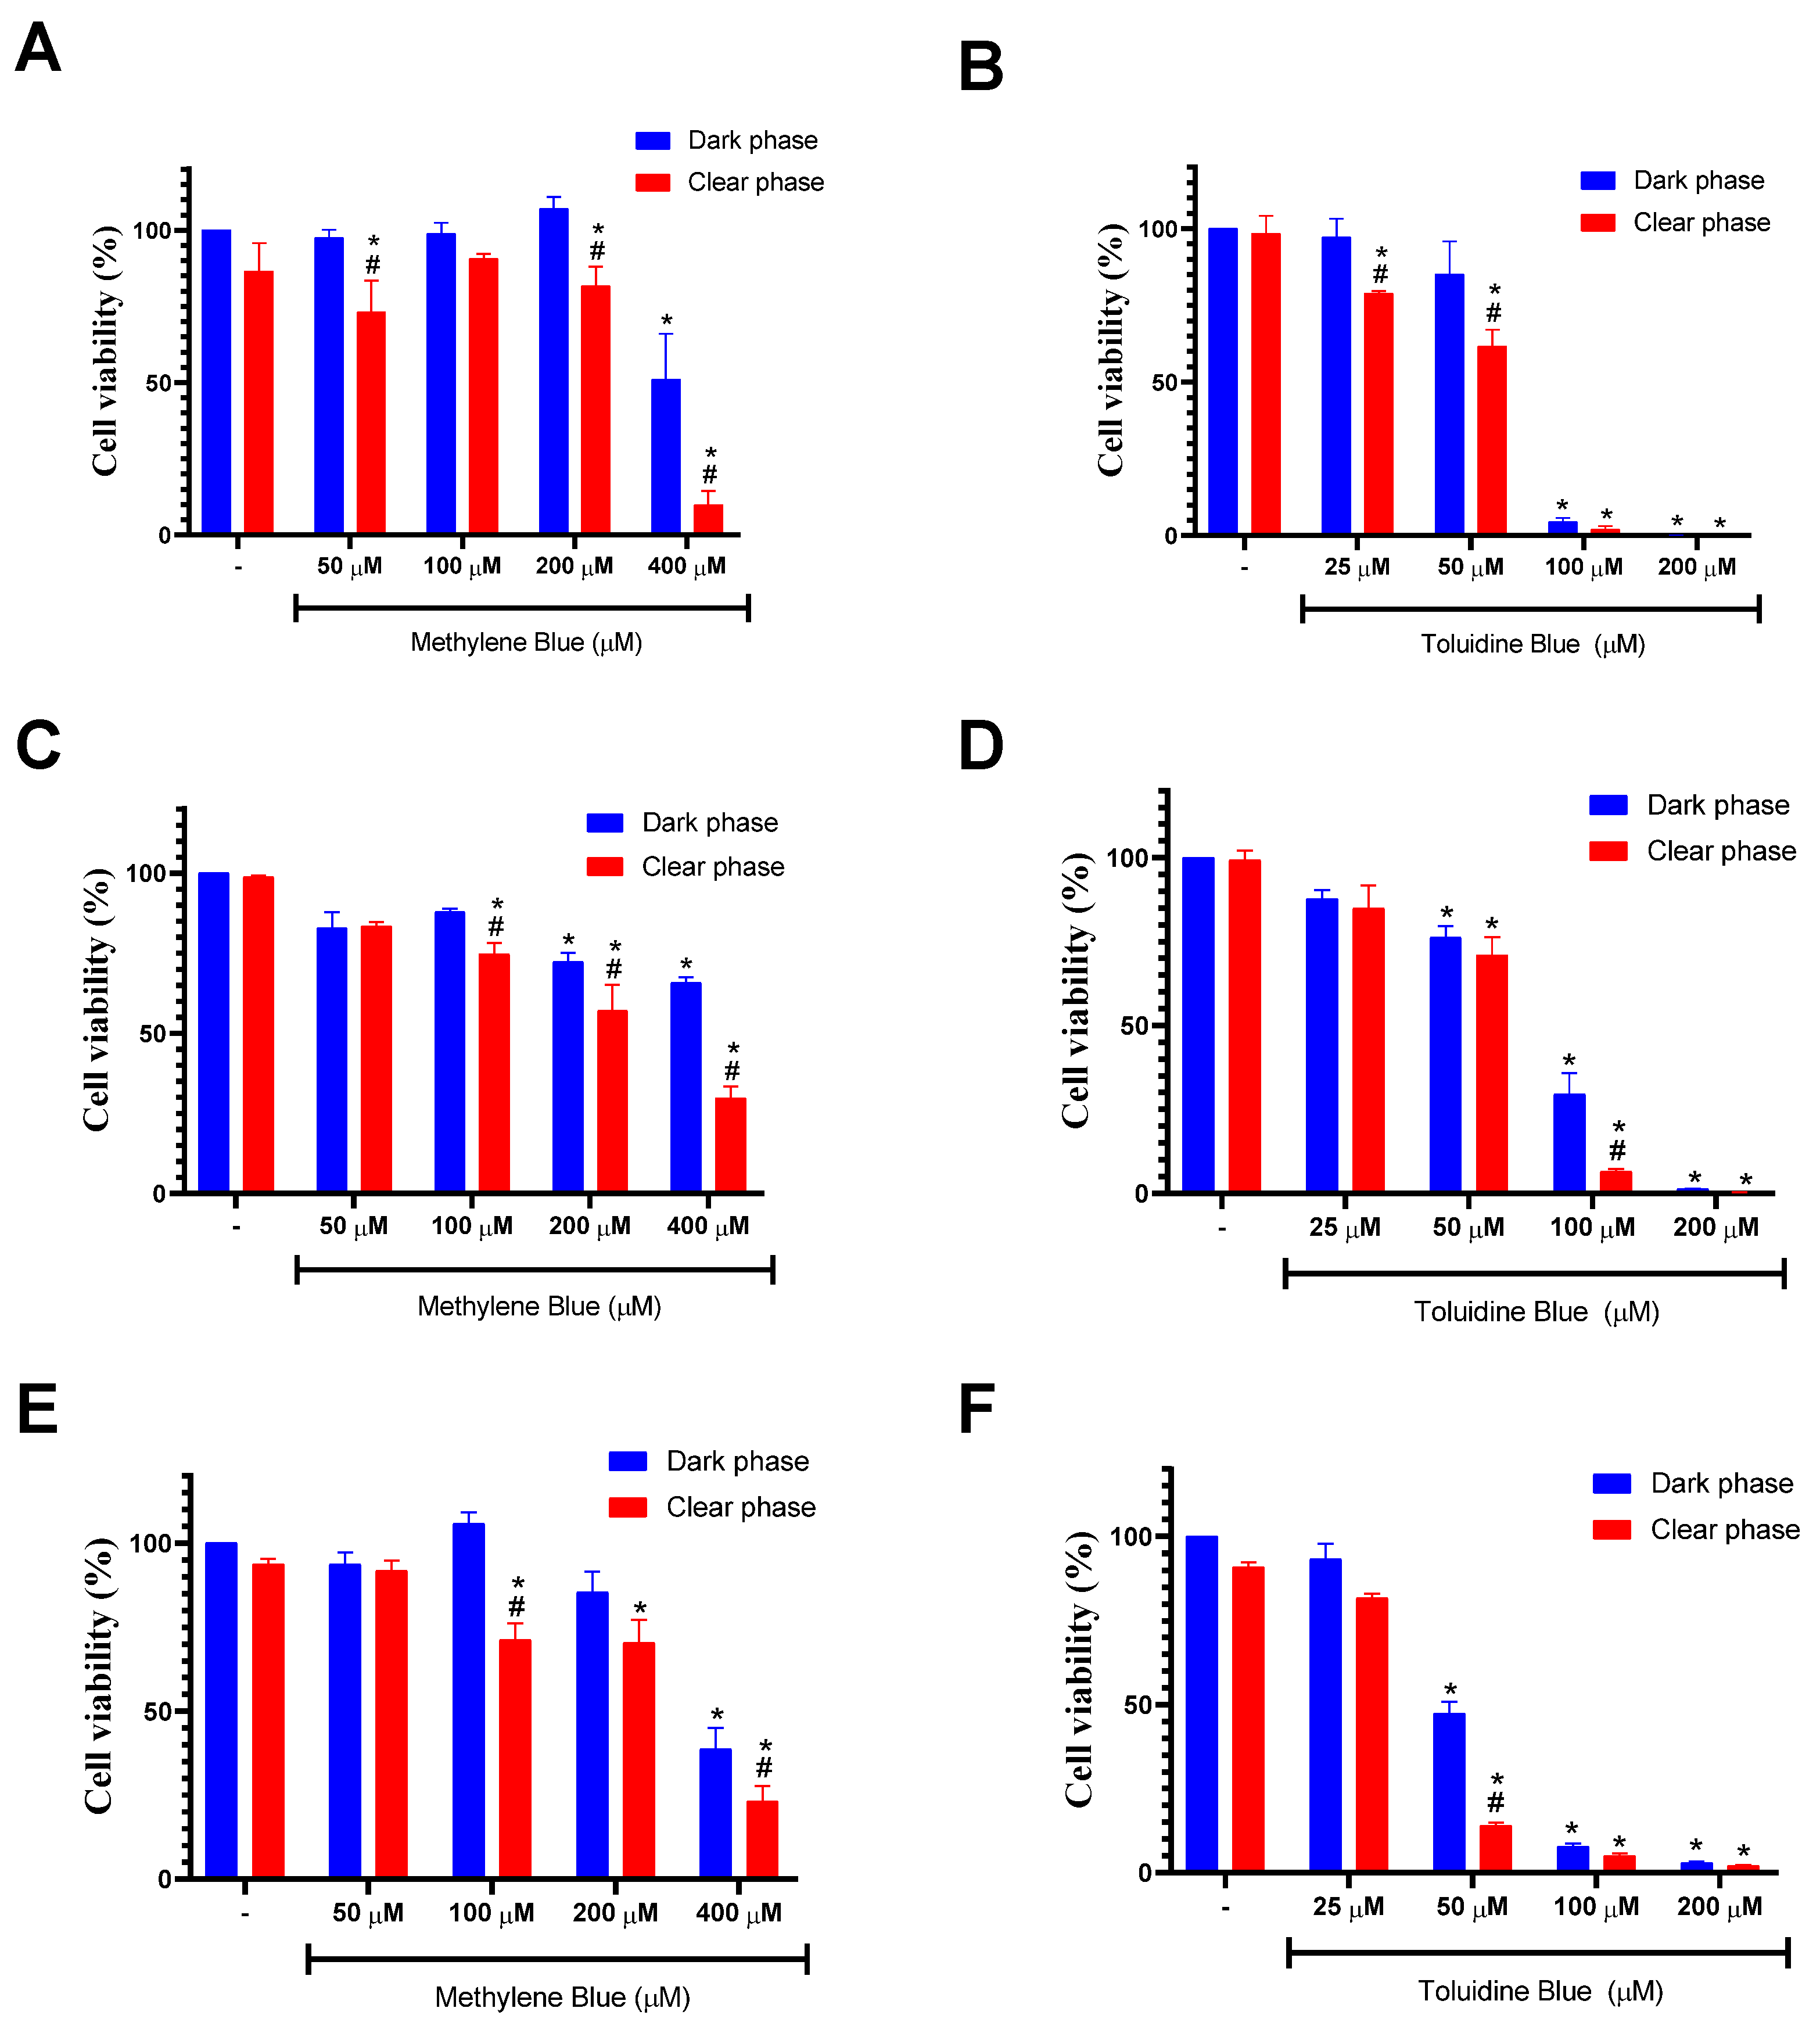
Figure 1. Experiment design. Phenothiazine derivatives (MB and TB) were tested on three cell lines: human fibroblasts (Hfib), HSC-3 (human tongue squamous cell carcinoma) and SCC-9 (human tongue squamous cell carcinoma). Cell viability was measured using CellTiter-Glo® Luminescent Cell viability assay. The experiments were performed in the absence (dark phase) or presence (clear phase) of PDT.
Cancers 15 05509 g001
Figure 2. MB incorporation over time in different cell lines. (A) Incorporation rate of MB in Hfib cells. (B) Incorporation of MB in HSC-3 cells. (C) Incorporation of MB in SCC-9 cells. (D) Comparison of the MB incorporation rate between the cell lines evaluated after 2 h of treatment. Values represent the means ± SD of four determinations obtained in one of the three experiments performed. * p < 0.05 compared to untreated cells (-) in graphs (AC). * p < 0.05 compared to the incorporation rate of MB by Hfib in the same concentration in graph (D).
Cancers 15 05509 g002
Figure 3. TB incorporation over time in different cell lines. (A) Incorporation of TB in Hfib cells. (B) Incorporation of TB in HSC-3 cells. (C) Incorporation of TB in SCC-9 cells. (D) Comparison of the TB incorporation rate between the cell lines evaluated after 2 h of treatment. Values represent the means ± SD of four determinations obtained in one of the three experiments performed. * p < 0.05 compared to untreated cells (-) in graphs (AC). * p < 0.05 compared to the incorporation rate of TB by Hfib in the same concentration in graph (D).
Cancers 15 05509 g003
Figure 4. Effects of MB and TB on the cell viability of Hfib (A,B), HSC-3 (C,D) and SCC-9 cell lines (E,F). Cells were treated with different concentrations of methylene blue (50–400 µM) or toluidine blue (25–200 µM) in the absence (dark phase; blue columns) or presence (clear phase; red columns) of PDT. Cell viability was determined by ATP measurement using the CellTiter-Glo Luminescent Cell Viability Assay. Values represent the means ± SD of four determinations obtained in one of the three experiments performed. * p < 0.05 compared to untreated cells (-). # p < 0.05 compared to the same concentration in the dark phase.
Cancers 15 05509 g004
Figure 5. Isobologram describing the synergistic effects of MB and TB on SCC-9 cell viability. The test was conducted in the absence of light (dark phase) (A) or in the presence (clear phase) of PDT (B). Cell viability was determined by ATP measurement after 24 h of incubation. Broken lines correspond to the predicted positions of the experimental points for additive effects.
Cancers 15 05509 g005
Table 1. Cytotoxic activity of MB and TB in different cell lines in the absence (dark phase) or presence (clear phase) of light.
SampleIC50 ± S.D (μM)
HSC-3
IC50 ± S.D. (μM)
SCC-9
IC50 ± S.D. (μM)
Hfib
Dark
Phase
Clear
Phase
Dark
Phase
Clear
Phase
Dark
Phase
Clear
Phase
MB>400234.5 ± 9.6362.6 ± 15.6307.4 ± 28.8>400294.4 ± 12.1
TB73.2 ± 2.658.7 ± 2.341.4 ± 4.033.8. ± 1.466.6 ± 5.953.7 ± 3.6
Values represent the mean ± SD and were calculated from three independent experiments. IC50 = inhibitory concentration of 50%. MB = methylene blue. TB = toluidine blue. SD = standard deviation.
Table 2. Cytotoxic activity of MB and TB on SCC-9 cells alone or in combination.
SampleIC50 ± S.D. (μM)
Dark Phase
IC50 ± S.D. (μM)
Clear Phase
CI a
Drug AloneCombinationDrug AloneCombinationCI
Dark Phase
CI
Clear Phase
MB368.5 ± 10.830.5 ± 4.8302.3 ± 25.723.4 ± 1.40.69 ± 0.050.73 ± 0.08
TB43.8 ± 2.926.9 ± 1.433.7 ± 1.222.4 ± 2.4
Values represent the mean ± SD and were calculated from two independent experiments. a Combination index (CI). Cutoff: CI value of 0.3–0.7, synergism; 0.7–0.85, moderate synergism; 0.85–0.9, slight synergism; 0.9–1.1, additivity; > 1.1, antagonism. IC50 = inhibitory concentration of 50%. MB = methylene blue. TB = toluidine blue. SD = standard deviation.
Disclaimer/Publisher’s Note: The statements, opinions and data contained in all publications are solely those of the individual author(s) and contributor(s) and not of MDPI and/or the editor(s). MDPI and/or the editor(s) disclaim responsibility for any injury to people or property resulting from any ideas, methods, instructions or products referred to in the content.

