
C-Reactive Protein as an Early Predictor of Efficacy in Advanced Non-Small-Cell Lung Cancer Patients: A Tumor Dynamics-Biomarker Modeling Framework

 , , , ,
  ,
,  ,
,  and
and
Abstract
:Simple Summary
Abstract
1. Introduction
2. Materials and Methods
2.1. Clinical Data
2.2. Modeling Framework
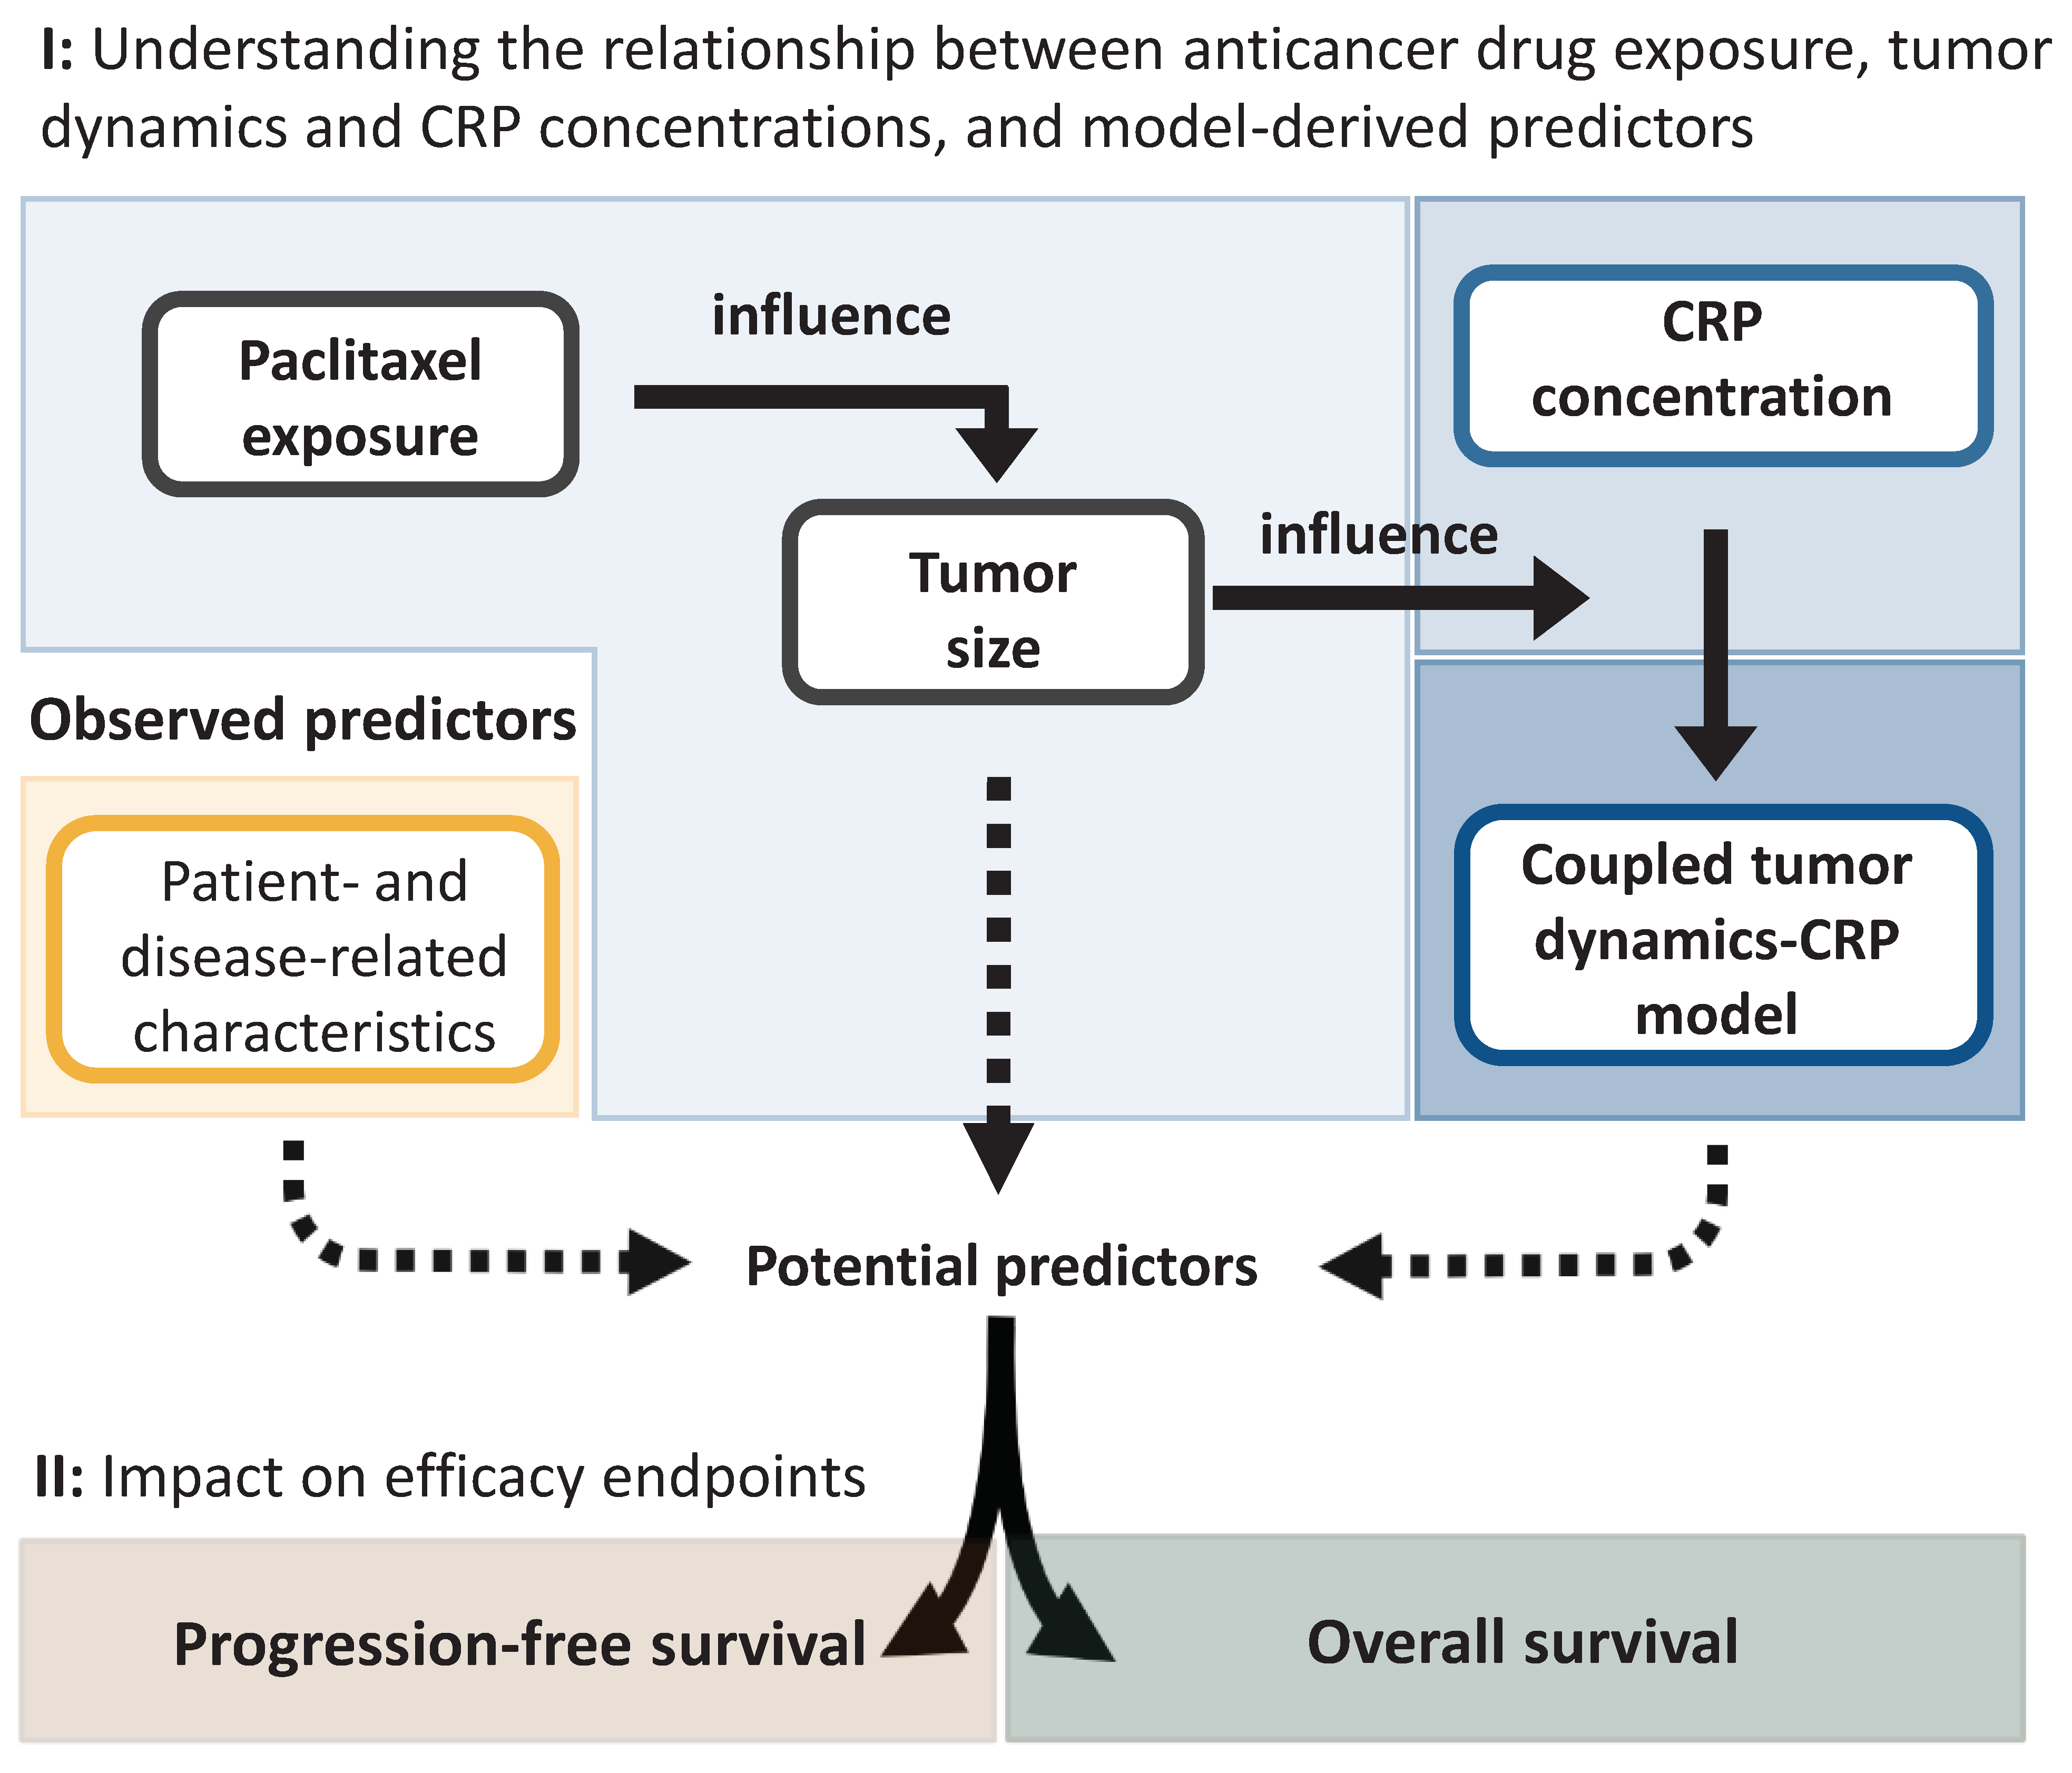
2.2.1. Characterization of the Relationship between Drug Exposure, Tumor Dynamics, and C-Reactive Protein Concentration
Characterization of Tumor Dynamics
Characterization of C-Reactive Protein Concentration-Time Course
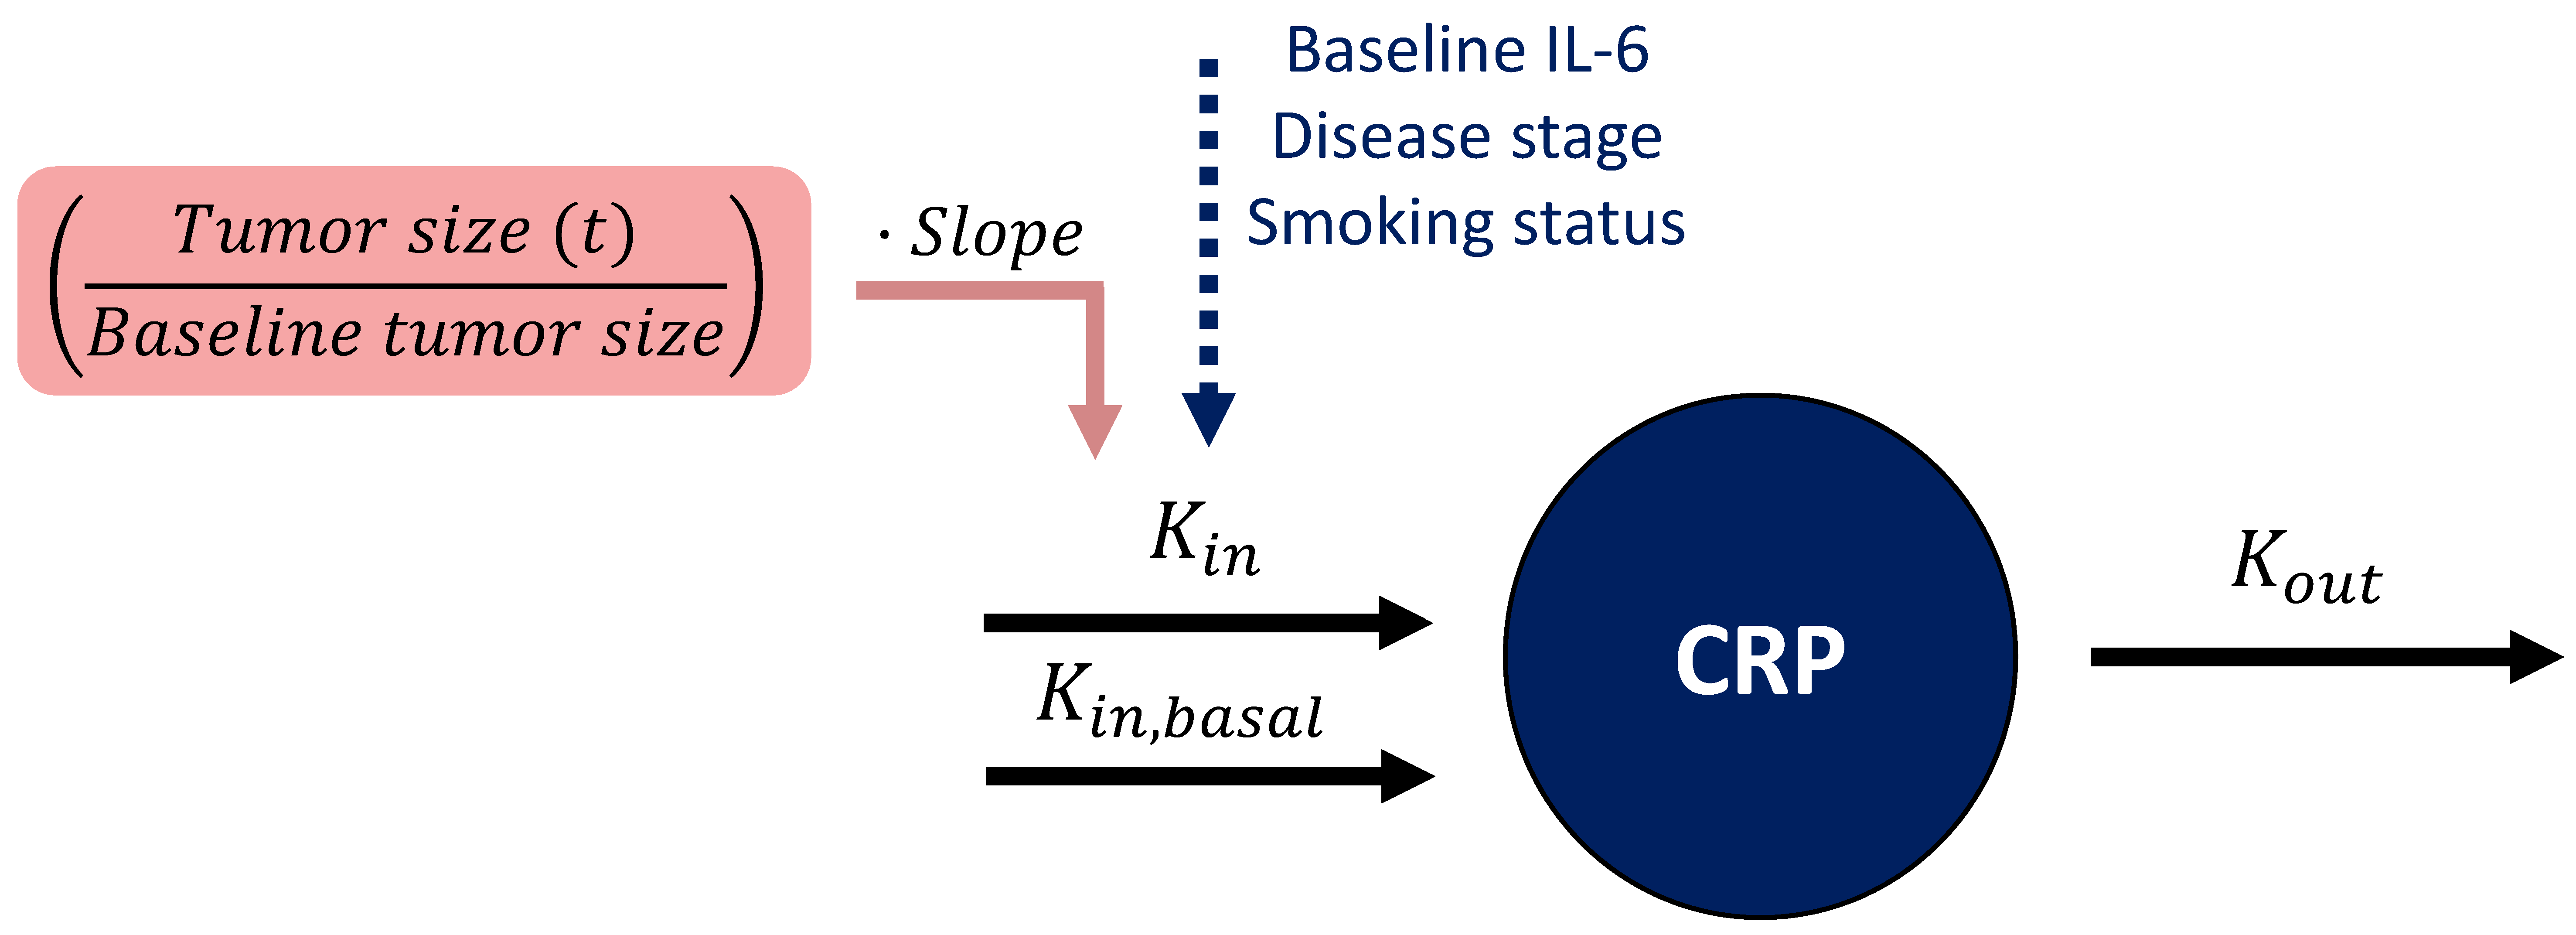
Linking Tumor Dynamics to C-Reactive Protein Concentration-Time Course
2.2.2. Characterization of Efficacy Endpoints and Their Predictors
2.2.3. Assessment of the Impact of Identified Predictors of Efficacy
2.3. Data Analysis and Software
3. Results
3.1. Clinical Data
3.2. Modeling Framework
3.2.1. Characterization of the Relationship between Drug Exposure, Tumor Dynamics, and C-Reactive Protein Concentration
Characterization of Tumor Dynamics
Characterization of C-Reactive Protein Concentration-Time Course
Linking Tumor Dynamics to C-Reactive Protein Concentration-Time Course
3.2.2. Characterization of Efficacy Endpoints and Their Predictors
Progression-Free Survival Model
Overall Survival Model
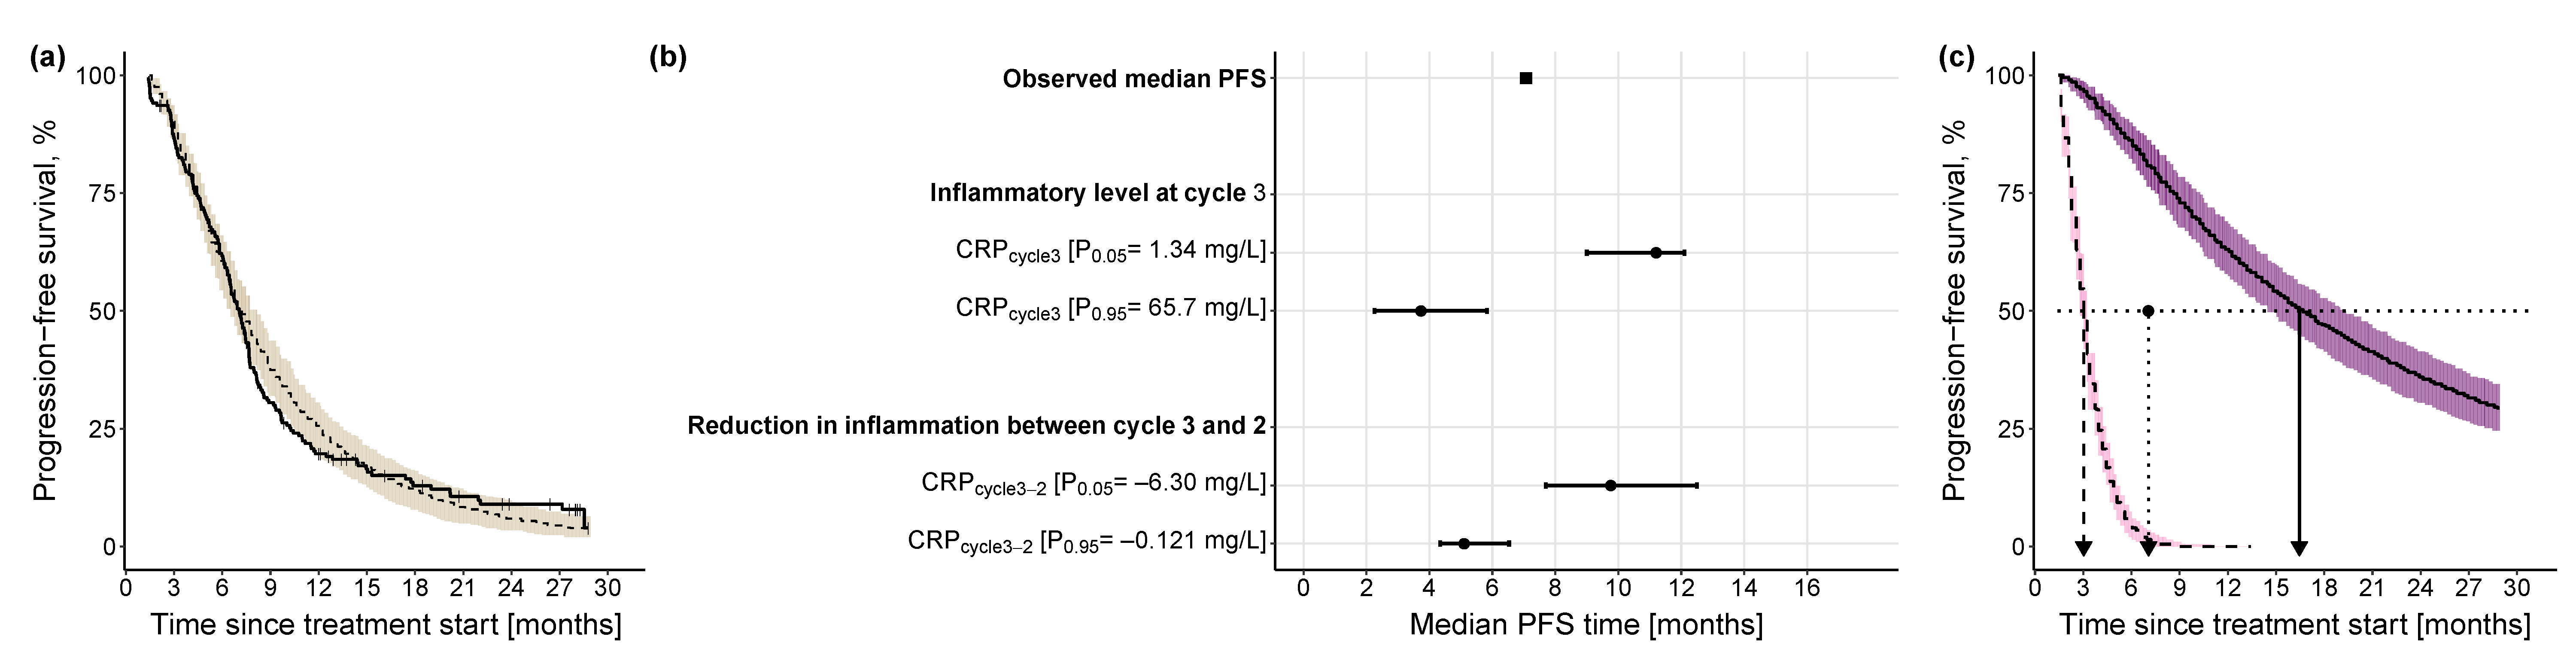
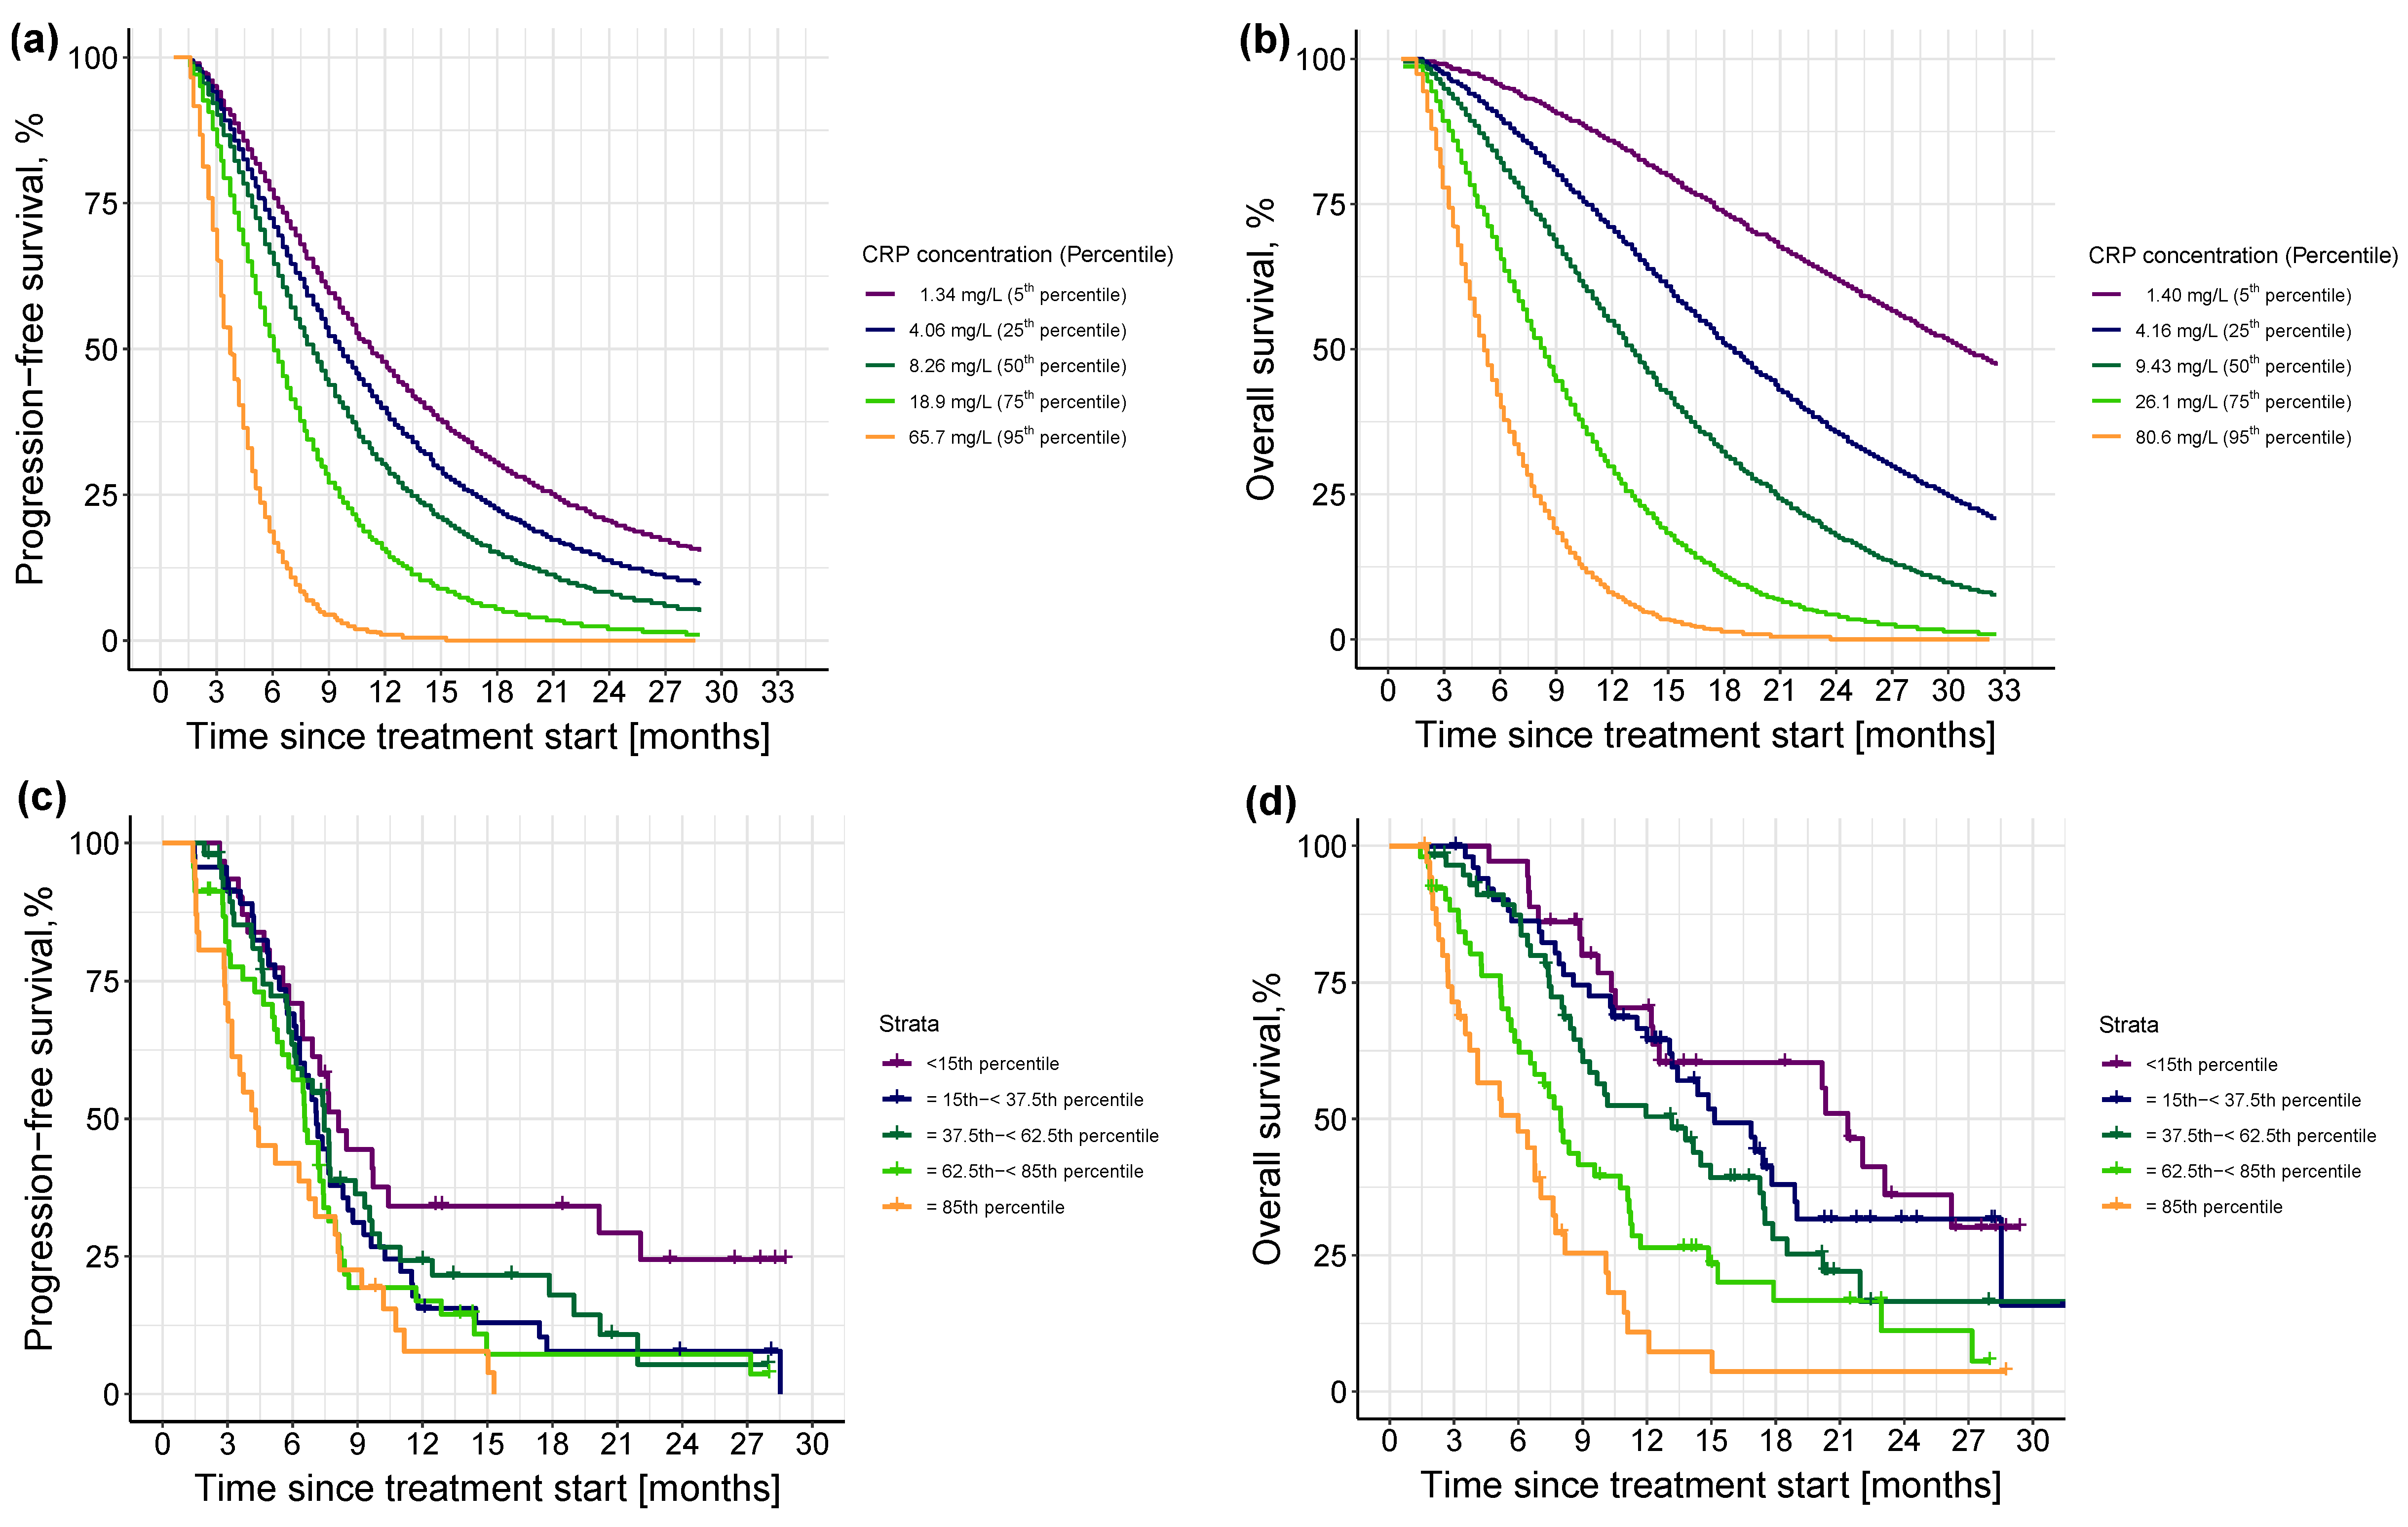
3.2.3. Impact of Different Levels of Inflammation on Efficacy Endpoints
4. Discussion
5. Conclusions
Supplementary Materials
Author Contributions
Funding
Institutional Review Board Statement
Informed Consent Statement
Data Availability Statement
Acknowledgments
Conflicts of Interest
References
- Siegel, R.L.; Miller, K.D.; Wagle, N.S.; Jemal, A. Cancer Statistics, 2023. CA Cancer J. Clin. 2023, 73, 17–48. [Google Scholar] [CrossRef] [PubMed]
- American Lung Association. State of Lung Cancer; American Lung Association: Chicago, IL, USA, 2022; Available online: https://www.lung.org/getmedia/647c433b-4cbc-4be6-9312-2fa9a449d489/solc-2022-print-report (accessed on 29 August 2023).
- Van Laar, M.; van Amsterdam, W.A.C.; van Lindert, A.S.R.; de Jong, P.A.; Verhoeff, J.J.C. Prognostic Factors for Overall Survival of Stage III Non-Small Cell Lung Cancer Patients on Computed Tomography: A Systematic Review and Meta-Analysis. Radiother. Oncol. J. Eur. Soc. Ther. Radiol. Oncol. 2020, 151, 152–175. [Google Scholar] [CrossRef]
- Katsurada, M.; Nagano, T.; Tachihara, M.; Kiriu, T.; Furukawa, K.; Koyama, K.; Otoshi, T.; Sekiya, R.; Hazama, D.; Tamura, D. Baseline Tumor Size as a Predictive and Prognostic Factor of Immune Checkpoint Inhibitor Therapy for Non-Small Cell Lung Cancer. Anticancer Res. 2019, 39, 815–825. [Google Scholar] [CrossRef]
- Holdenrieder, S.; Nagel, D.; Stieber, P. Estimation of Prognosis by Circulating Biomarkers in Patients with Non-Small Cell Lung Cancer. Cancer Biomark. 2010, 6, 179–190. [Google Scholar] [CrossRef] [PubMed]
- Machado, D.; Marques, C.; Dias, M.; Campainha, S.; Barroso, A. Inflammatory Prognostic Biomarkers in Advanced Non-Small Cell Lung Cancer. Pulmonology 2019, 25, 181–183. [Google Scholar] [CrossRef] [PubMed]
- Tanizaki, J.; Haratani, K.; Hayashi, H.; Chiba, Y.; Nakamura, Y.; Yonesaka, K.; Kudo, K.; Kaneda, H.; Hasegawa, Y.; Tanaka, K. Peripheral Blood Biomarkers Associated with Clinical Outcome in Non–Small Cell Lung Cancer Patients Treated with Nivolumab. J. Thorac. Oncol. 2018, 13, 97–105. [Google Scholar] [CrossRef] [PubMed]
- Lim, J.U.; Yeo, C.D.; Kang, H.S.; Park, C.K.; Kim, J.S.; Kim, J.W.; Kim, S.J.; Lee, S.H. Elevated Pretreatment Platelet-to-Lymphocyte Ratio Is Associated with Poor Survival in Stage IV Non-Small Cell Lung Cancer with Malignant Pleural Effusion. Sci. Rep. 2019, 9, 4721. [Google Scholar] [CrossRef]
- Ojara, F.W.; Nassar, Y.M.; Geiger, K.; Joerger, M.; van Dyk, M.; Holdenrieder, S.; Kloft, C. Prognostic Impact of Serum Biomarkers for Decision-Making in the Treatment of Advanced Non-Small Cell Lung Cancer Patients: Review of Existing Approaches for Modelling Serum Biomarker Data and Potential Role for Pharmacometrics. under preparation.
- Sproston, N.R.; Ashworth, J.J. Role of C-Reactive Protein at Sites of Inflammation and Infection. Front. Immunol. 2018, 9, 759. [Google Scholar] [CrossRef]
- Hart, P.C.; Rajab, I.M.; Alebraheem, M.; Potempa, L.A. C-Reactive Protein and Cancer-Diagnostic and Therapeutic Insights. Front. Immunol. 2020, 11, 595835. [Google Scholar] [CrossRef]
- Heikkilä, K.; Ebrahim, S.; Lawlor, D.A. A Systematic Review of the Association between Circulating Concentrations of C Reactive Protein and Cancer. J. Epidemiol. Community Health 2007, 61, 824–833. [Google Scholar] [CrossRef]
- Ni, X.; Wu, P.; Wu, C.; Ji, M.; Wu, J.; Gu, X.; Jiang, Z. Elevated Serum C-reactive Protein, Carcinoembryonic Antigen and N2 Disease Are Poor Prognostic Indicators in Non-small Cell Lung Cancer. Asia-Pacific J. Clin. Oncol. 2015, 11, e22–e30. [Google Scholar] [CrossRef] [PubMed]
- Cehreli, R.; Yavuzsen, T.; Ates, H.; Akman, T.; Ellidokuz, H.; Oztop, I. Can Inflammatory and Nutritional Serum Markers Predict Chemotherapy Outcomes and Survival in Advanced Stage Nonsmall Cell Lung Cancer Patients? Biomed Res. Int. 2019, 2019, 1648072. [Google Scholar] [CrossRef]
- Ojara, F.W.; Henrich, A.; Frances, N.; Nassar, Y.M.; Huisinga, W.; Hartung, N.; Geiger, K.; Holdenrieder, S.; Joerger, M.; Kloft, C. A Prognostic Baseline Blood Biomarker and Tumor Growth Kinetics Integrated Model in Paclitaxel/Platinum Treated Advanced Non-Small Cell Lung Cancer Patients. CPT Pharmacomet. Syst. Pharmacol. 2023. [Google Scholar] [CrossRef] [PubMed]
- Singh, N.; Baby, D.; Rajguru, J.P.; Patil, P.B.; Thakkannavar, S.S.; Pujari, V.B. Inflammation and Cancer. Ann. Afr. Med. 2019, 18, 121–126. [Google Scholar] [CrossRef]
- Ansar, W.; Ghosh, S. C-Reactive Protein and the Biology of Disease. Immunol. Res. 2013, 56, 131–142. [Google Scholar] [CrossRef]
- Aref, H.; Refaat, S. CRP Evaluation in Non-Small Cell Lung Cancer. Egypt. J. Chest Dis. Tuberc. 2014, 63, 717–722. [Google Scholar] [CrossRef]
- Ette, E.I.; Williams, P.J. Pharmacometrics: The Science of Quantitative Pharmacology; John Wiley & Sons: Hoboken, NJ, USA, 2007; ISBN 0471677833. [Google Scholar]
- Bender, B.C.; Schindler, E.; Friberg, L.E. Population Pharmacokinetic–Pharmacodynamic Modelling in Oncology: A Tool for Predicting Clinical Response. Br. J. Clin. Pharmacol. 2015, 79, 56–71. [Google Scholar] [CrossRef] [PubMed]
- Venkatakrishnan, K.; Friberg, L.E.; Ouellet, D.; Mettetal, J.T.; Stein, A.; Trocóniz, I.F.; Bruno, R.; Mehrotra, N.; Gobburu, J.; Mould, D.R. Optimizing Oncology Therapeutics Through Quantitative Translational and Clinical Pharmacology: Challenges and Opportunities. Clin. Pharmacol. Ther. 2015, 97, 37–54. [Google Scholar] [CrossRef]
- Joerger, M.; von Pawel, J.; Kraff, S.; Fischer, J.R.; Eberhardt, W.; Gauler, T.C.; Mueller, L.; Reinmuth, N.; Reck, M.; Kimmich, M.; et al. Open-Label, Randomized Study of Individualized, Pharmacokinetically (PK)-Guided Dosing of Paclitaxel Combined with Carboplatin or Cisplatin in Patients with Advanced Non-Small-Cell Lung Cancer (NSCLC). Ann. Oncol. 2016, 27, 1895–1902. [Google Scholar] [CrossRef]
- Joerger, M.; Kraff, S.; Huitema, A.D.R.; Feiss, G.; Moritz, B.; Schellens, J.H.M.; Beijnen, J.H.; Jaehde, U. Evaluation of a Pharmacology-Driven Dosing Algorithm of 3-Weekly Paclitaxel Using Therapeutic Drug Monitoring: A Pharmacokinetic-Pharmacodynamic Simulation Study. Clin. Pharmacokinet. 2012, 51, 607–617. [Google Scholar] [CrossRef]
- Eisenhauer, E.A.; Therasse, P.; Bogaerts, J.; Schwartz, L.H.; Sargent, D.; Ford, R.; Dancey, J.; Arbuck, S.; Gwyther, S.; Mooney, M.; et al. New Response Evaluation Criteria in Solid Tumours: Revised RECIST Guideline (Version 1.1). Eur. J. Cancer 2009, 45, 228–247. [Google Scholar] [CrossRef] [PubMed]
- Commission Directive 91/507/EEC of 19 July 1991 Modifying the Annex to Council Directive 75/318/EEC on the Approximation of the Laws of Member States Relating to Analytical, Pharmacotoxicological and Clinical Standards and Protocols in Respect of the Testing of Medicinal Products. Available online: http://data.europa.eu/eli/dir/1991/507/oj (accessed on 29 August 2023).
- Directive 2001/20/EC of the European Parliament and of the Council of 4 April 2001 on the approximation of the laws, regulations and administrative provisions of the Member States relating to the implementation of good clinical practice in the conduct of clinical trials on medicinal products for human use. Available online: http://data.europa.eu/eli/dir/2001/20/oj (accessed on 29 August 2023).
- Johansson, Å.M.; Karlsson, M.O. Multiple Imputation of Missing Covariates in NONMEM and Evaluation of the Method’s Sensitivity to η-Shrinkage. AAPS J. 2013, 15, 1035–1042. [Google Scholar] [CrossRef] [PubMed]
- Ojara, F.W.; Henrich, A.; Frances, N.; Huisinga, W.; Hartung, N.; Joerger, M.; Kloft, C. Time-to-Event Analysis of Paclitaxel-Associated Peripheral Neuropathy in Advanced Non-Small-Cell Lung Cancer Highlighting Key Influential Treatment/Patient Factors. J. Pharmacol. Exp. Ther. 2020, 375, 430–438. [Google Scholar] [CrossRef] [PubMed]
- Henrich, A.; Joerger, M.; Kraff, S.; Jaehde, U.; Huisinga, W.; Kloft, C.; Parra-Guillen, Z.P. Semimechanistic Bone Marrow Exhaustion Pharmacokinetic/Pharmacodynamic Model for Chemotherapy-Induced Cumulative Neutropenia. J. Pharmacol. Exp. Ther. 2017, 362, 347–358. [Google Scholar] [CrossRef] [PubMed]
- Rubin, D.B. Multiple Imputation for Nonresponse in Surveys; John Wiley & Sons: Hoboken, NJ, USA, 1987; ISBN 0471087052. [Google Scholar]
- Lacroix, B.D.; Friberg, L.E.; Karlsson, M.O. Evaluation of IPPSE, an Alternative Method for Sequential Population PKPD Analysis. J. Pharmacokinet. Pharmacodyn. 2012, 39, 177–193. [Google Scholar] [CrossRef]
- Dayneka, N.L.; Garg, V.; Jusko, W.J. Comparison of Four Basic Models of Indirect Pharmacodynamic Responses. J. Pharmacokinet. Biopharm. 1993, 21, 457–478. [Google Scholar] [CrossRef]
- Upton, R.N.; Mould, D.R. Basic Concepts in Population Modeling, Simulation, and Model-Based Drug Development: Part 3-Introduction to Pharmacodynamic Modeling Methods. CPT Pharmacomet. Syst. Pharmacol. 2014, 3, e88. [Google Scholar] [CrossRef]
- Vigushin, D.M.; Pepys, M.B.; Hawkins, P.N. Metabolic and Scintigraphic Studies of Radioiodinated Human C-Reactive Protein in Health and Disease. J. Clin. Investig. 1993, 91, 1351–1357. [Google Scholar] [CrossRef] [PubMed]
- Jonsson, E.N.; Karlsson, M.O. Automated Covariate Model Building within NONMEM. Pharm. Res. 1998, 15, 1463–1468. [Google Scholar] [CrossRef]
- Lindbom, L.; Ribbing, J.; Jonsson, E.N. Perl-Speaks-NONMEM (PsN)—A Perl Module for NONMEM Related Programming. Comput. Methods Programs Biomed. 2004, 75, 85–94. [Google Scholar] [CrossRef]
- Morgan, C.J. Landmark Analysis: A Primer. J. Nucl. Cardiol. 2019, 26, 391–393. [Google Scholar] [CrossRef] [PubMed]
- Beal, S.L.; Sheiner, L.B.; Boeckmann, A.J.; Bauer, R.J. NONMEM 7.4 Users Guides. (1989–2018); ICON Development Solutions Ltd.: Hanover, MD, USA, 2013. [Google Scholar]
- Keizer, R.J.; Karlsson, M.O.; Hooker, A. Modeling and Simulation Workbench for NONMEM: Tutorial on Pirana, PsN, and Xpose. CPT Pharmacomet. Syst. Pharmacol. 2013, 2, e50. [Google Scholar] [CrossRef]
- R Core Team A Language and Environment for Statistical Computing; R Foundation for Statistical Computing: Vienna, Austria, 2019.
- Nassar, Y.M.; Ojara, F.W.; Pérez Pitarch, A.; Holdenrieder, S.; Krueger, K.; Michelet, R.; Huisinga, W.; Joerger, M.; Kloft, C. Quantitative Impact of Different Patient and Disease Factors on C-Reactive Protein (CRP) Synthesis, a Prognostic Biomarker in Advanced Non-Small Cell Lung Cancer (NSCLC) Patients. In Proceedings of the 43rd European Organization of Research and Treatment of Cancer-Pharmacology and Molecular Mechanisms meeting (EORTC-PAMM), Florence, Italy, 15–17 December 2022; Available online: https://sites.altilab.com/files/CONGRES/2022/PAMM-ABSTRACTS-BOOKLET.pdf (accessed on 29 August 2023).
- Buil-Bruna, N.; López-Picazo, J.M.; Moreno-Jiménez, M.; Martín-Algarra, S.; Ribba, B.; Trocóniz, I.F. A Population Pharmacodynamic Model for Lactate Dehydrogenase and Neuron Specific Enolase to Predict Tumor Progression in Small Cell Lung Cancer Patients. AAPS J. 2014, 16, 609–619. [Google Scholar] [CrossRef] [PubMed]
- Gallus, S.; Lugo, A.; Suatoni, P.; Taverna, F.; Bertocchi, E.; Boffi, R.; Marchiano, A.; Morelli, D.; Pastorino, U. Effect of Tobacco Smoking Cessation on C-Reactive Protein Levels in A Cohort of Low-Dose Computed Tomography Screening Participants. Sci. Rep. 2018, 8, 12908. [Google Scholar] [CrossRef] [PubMed]
- Ohsawa, M.; Okayama, A.; Nakamura, M.; Onoda, T.; Kato, K.; Itai, K.; Yoshida, Y.; Ogawa, A.; Kawamura, K.; Hiramori, K. CRP Levels Are Elevated in Smokers but Unrelated to the Number of Cigarettes and Are Decreased by Long-Term Smoking Cessation in Male Smokers. Prev. Med. 2005, 41, 651–656. [Google Scholar] [CrossRef] [PubMed]
- Xiao, X.; Wang, S.; Long, G. C-Reactive Protein Is a Significant Predictor of Improved Survival in Patients with Advanced Non-Small Cell Lung Cancer. Medicine 2019, 98, 26. [Google Scholar] [CrossRef]
- Wang, Y.; Sung, C.; Dartois, C.; Ramchandani, R.; Booth, B.P.; Rock, E.; Gobburu, J. Elucidation of Relationship between Tumor Size and Survival in Non-small-cell Lung Cancer Patients Can Aid Early Decision Making in Clinical Drug Development. Clin. Pharmacol. Ther. 2009, 86, 167–174. [Google Scholar] [CrossRef]
- Nishino, M.; Dahlberg, S.E.; Cardarella, S.; Jackman, D.M.; Rabin, M.S.; Hatabu, H.; Jänne, P.A.; Johnson, B.E. Tumor Volume Decrease at 8 Weeks Is Associated with Longer Survival in EGFR-Mutant Advanced Non–Small-Cell Lung Cancer Patients Treated with EGFR TKI. J. Thorac. Oncol. 2013, 8, 1059–1068. [Google Scholar] [CrossRef]
- Suleiman, A.A.; Frechen, S.; Scheffler, M.; Zander, T.; Kahraman, D.; Kobe, C.; Wolf, J.; Nogova, L.; Fuhr, U. Modeling Tumor Dynamics and Overall Survival in Advanced Non–Small-Cell Lung Cancer Treated with Erlotinib. J. Thorac. Oncol. 2015, 10, 84–92. [Google Scholar] [CrossRef]
- Claret, L.; Girard, P.; Hoff, P.M.; Van Cutsem, E.; Zuideveld, K.P.; Jorga, K.; Fagerberg, J.; Bruno, R. Model-Based Prediction of Phase III Overall Survival in Colorectal Cancer on the Basis of Phase II Tumor Dynamics. J. Clin. Oncol. 2009, 27, 4103–4108. [Google Scholar] [CrossRef]
- Chan, P.; Marchand, M.; Yoshida, K.; Vadhavkar, S.; Wang, N.; Lin, A.; Wu, B.; Ballinger, M.; Sternheim, N.; Jin, J.Y. Prediction of Overall Survival in Patients across Solid Tumors Following Atezolizumab Treatments: A Tumor Growth Inhibition–Overall Survival Modeling Framework. CPT Pharmacomet. Syst. Pharmacol. 2021, 10, 1171–1182. [Google Scholar] [CrossRef]
- Li, J.; Zhu, H.; Sun, L.; Xu, W.; Wang, X. Prognostic Value of Site-Specific Metastases in Lung Cancer: A Population Based Study. J. Cancer 2019, 10, 3079. [Google Scholar] [CrossRef] [PubMed]
- Wang, J.-F.; Lu, H.-D.; Wang, Y.; Zhang, R.; Li, X.; Wang, S. Clinical Characteristics and Prognosis of Non-Small Cell Lung Cancer Patients with Liver Metastasis: A Population-Based Study. World J. Clin. Cases 2022, 10, 10882. [Google Scholar] [CrossRef] [PubMed]
- Choi, M.G.; Choi, C.-M.; Lee, D.H.; Kim, S.-W.; Yoon, S.; Kim, W.S.; Ji, W.; Lee, J.C. Different Prognostic Implications of Hepatic Metastasis According to Front-Line Treatment in Non-Small Cell Lung Cancer: A Real-World Retrospective Study. Transl. Lung Cancer Res. 2021, 10, 2551. [Google Scholar] [CrossRef] [PubMed]
- Gerber, D.E.; Dahlberg, S.E.; Sandler, A.B.; Ahn, D.H.; Schiller, J.H.; Brahmer, J.R.; Johnson, D.H. Baseline Tumour Measurements Predict Survival in Advanced Non-Small Cell Lung Cancer. Br. J. Cancer 2013, 109, 1476–1481. [Google Scholar] [CrossRef] [PubMed]
- Claret, L.; Lu, J.; Bruno, R.; Hsu, C.; Hei, Y.; Sun, Y. Simulations Using a Drug–Disease Modeling Framework and Phase II Data Predict Phase III Survival Outcome in First-line Non–Small-cell Lung Cancer. Clin. Pharmacol. Ther. 2012, 92, 631–634. [Google Scholar] [CrossRef]
- Wei, M.; Ye, Q.; Wang, X.; Wang, M.; Hu, Y.; Yang, Y.; Yang, J.; Cai, J. Early Tumor Shrinkage Served as a Prognostic Factor for Patients with Stage III Non-Small Cell Lung Cancer Treated with Concurrent Chemoradiotherapy. Medicine 2018, 97, e0632. [Google Scholar] [CrossRef]
- He, X.; Zhang, Y.; Ma, Y.; Zhou, T.; Zhang, J.; Hong, S.; Sheng, J.; Zhang, Z.; Yang, Y.; Huang, Y.; et al. Optimal Tumor Shrinkage Predicts Long-Term Outcome in Advanced Nonsmall Cell Lung Cancer (NSCLC) Treated with Target Therapy: Result from 3 Clinical Trials of Advanced NSCLC by 1 Institution. Medicine 2016, 95, e4176. [Google Scholar] [CrossRef]
- Hopkins, A.M.; Kichenadasse, G.; Karapetis, C.S.; Rowland, A.; Sorich, M.J. Early Tumor Shrinkage Identifies Long-Term Disease Control and Survival in Patients with Lung Cancer Treated with Atezolizumab. J. Immunother. Cancer 2020, 8, e000500. [Google Scholar] [CrossRef]
- Netterberg, I.; Karlsson, M.O.; Nielsen, E.I.; Quartino, A.L.; Lindman, H.; Friberg, L.E. The Risk of Febrile Neutropenia in Breast Cancer Patients Following Adjuvant Chemotherapy Is Predicted by the Time Course of Interleukin-6 and C-Reactive Protein by Modelling. Br. J. Clin. Pharmacol. 2018, 84, 490–500. [Google Scholar] [CrossRef]
- Kluwe, F.; Michelet, R.; Mueller-Schoell, A.; Maier, C.; Klopp-Schulze, L.; van Dyk, M.; Mikus, G.; Huisinga, W.; Kloft, C. Perspectives on Model-Informed Precision Dosing in the Digital Health Era: Challenges, Opportunities, and Recommendations. Clin. Pharmacol. Ther. 2021, 109, 29–36. [Google Scholar] [CrossRef] [PubMed]
- Maier, C.; Hartung, N.; de Wiljes, J.; Kloft, C.; Huisinga, W. Bayesian Data Assimilation to Support Informed Decision Making in Individualized Chemotherapy. CPT Pharmacomet. Syst. Pharmacol. 2020, 9, 153–164. [Google Scholar] [CrossRef] [PubMed]


| Predictor | Derivation | Abbreviation |
|---|---|---|
| Markers of inflammation | ||
| CRP-related metrics | ||
| Observed baseline | BLCRP | BLCRP |
| Model-estimated cycle 1 day 1 | CRPcycle1 | CRPcycle1 |
| Model-estimated cycle 2 day 1 | CRPcycle2 | CRPcycle2 |
| Model-estimated cycle 3 day 1 | CRPcycle3 | CRPcycle3 |
| Absolute difference in CRP concentration: | ||
| cycle 2 from cycle 1 | CRPcycle2−CRPcycle1 | CRPcycle2-1 |
| cycle 3 from cycle 1 | CRPcycle3−CRPcycle1 | CRPcycle3-1 |
| cycle 3 from cycle 2 | CRPcycle3−CRPcycle2 | CRPcycle3-2 |
| Relative change in CRP concentration: | ||
| cycle 2 from cycle 1 | (CRPcycle2−CRPcycle1)/CRPcycle1 | CRP(cycle2-1)/cycle1 |
| cycle 3 from cycle 1 | (CRPcycle3−CRPcycle1)/CRPcycle1 | CRP(cycle3-1)/cycle1 |
| cycle 3 from cycle 2 | (CRPcycle3−CRPcycle2)/CRPcycle2 | CRP(cycle3-2)/cycle2 |
| Fold change in CRP concentration: | ||
| cycle 2 from cycle 1 | CRPcycle2/CRPcycle1 | CRPcycle2/1 |
| cycle 3 from cycle 1 | CRPcycle3/CRPcycle1 | CRPcycle3/1 |
| cycle 3 from cycle 2 | CRPcycle3/CRPcycle2 | CRPcycle3/2 |
| Neutrophil-to-lymphocyte ratio-related metrics | ||
| Observed cycle 1 day 1 | N/Lcycle1 | N/Lcycle1 |
| Observed cycle 2 day 1 | N/Lcycle2 | N/Lcycle2 |
| Absolute difference in neutrophil-to-lymphocyte ratio: cycle 2 from cycle 1 | N/Lcycle2−N/Lcycle1 | N/Lcycle2-1 |
| Relative change in neutrophil-to-lymphocyte ratio: cycle 2 from cycle 1 | (N/Lcycle2−N/Lcycle1)/N/Lcycle1 | N/L(cycle2-1)/cycle1 |
| Fold change in neutrophil-to-lymphocyte ratio: cycle 2 from cycle 1 | (N/Lcycle2)/(N/Lcycle1) | N/Lcycle2/1 |
| Tumor size-related metrics | ||
| Observed baseline tumor size | — | BLTS |
| Model-estimated tumor growth rate | — | |
| Model-estimated tumor size at week 7 relative to baseline tumor size | TSweek7/BLTS | RS7 |
| Parameter | CRP Turnover Model | Coupled Tumor Dynamics-CRP Turnover Model | ||||
|---|---|---|---|---|---|---|
| Estimate | RSE, % | 95% CI a | Estimate | RSE, % | 95% CI b | |
| Fixed-effect parameters | ||||||
| [(mg·L−1)·h−1] | 0.297 | 17.9 | [0.204, 0.429] | 0.390 | 0.60 | [0.252, 0.602] |
| [(mg·L−1)·h−1] | — | — | — | 0.0109 c | — | — |
| [h−1] | 0.0365 d | — | — | 0.0365 d | — | — |
| Slope (linear parameter linking tumor size to CRP) | — | — | — | 0.819 | 6.70 | [0.711, 0.952] |
| Parameters of the effect of identified variables on e | ||||||
| Baseline IL-6 f | 0.263 | 14.0 | [0.175, 0.324] | 0.315 | 8.20 | [0.244, 0.363] |
| Baseline tumor size g | 0.0432 | 28.0 | [0.017, 0.070] | — | — | — |
| Disease stage IIIB relative to stage IV h | −0.401 | 28.7 | [−0.596, −0.102] | −0.392 | 26 | [−0.598, −0.097] |
| Former smokers relative to non-smokers h | 0.536 | 57.8 | [0.020, 1.415] | 0.645 | 12.1 | [0.0353, 1.64] |
| Current smokers relative to non-smokers h | 1.11 | 40.0 | [0.378, 2.272] | 1.26 | 19 | [0.398, 2.56] |
| Interindividual variability in respective parameters [CV, %] | ||||||
| 95.3 | 7.60 | [80.2, 109] | 92.1 | 7.40 | [74.2, 107] | |
| — | — | — | 60.4 | 15.2 | [40.3, 77.9] | |
| — | — | — | 100 j | — | — | |
| — | — | — | 100 j | — | — | |
| — | — | — | 100 j | — | — | |
| — | — | — | 100 j | — | — | |
| Residual variability | ||||||
| σexp i [SD, mg/mL] | 0.889 | 3.70 | [0.818, 0.953] | 0.763 | 1.70 | [0.686, 0.831] |
| Parameter | Estimate | RSE, % | 95% CI b |
|---|---|---|---|
| Fixed-effect parameters | |||
| σ [unitless] | 0.906 | 8.80 | [0.755, 1.14] |
| μ [unitless] | 9.11 | 2.50 | [8.76, 9.86] |
| Parameters of the effects of identified predictors on hazard function | |||
| CRPcycle3 c | 0.109 | 55.4 | [0.0348, 0.445] |
| CRPcycle3-2 d | −0.26 | 37.2 | [−0.461, −0.0637] |
| Parameter | Estimate | RSE, % | 95% CI a |
|---|---|---|---|
| Fixed-effect parameters | |||
| λ [1/h] | 1.6 × 10⁻⁵ | 25.7 | [9.32 × 10⁻⁶, 2.65 × 10⁻⁵] |
| α [unitless] | 1.68 | 5.30 | [1.54, 1.92] |
| Parameters of the effects of identified predictors on hazard function | |||
| CRPcycle3 b | 0.781 | 12.8 | [0.595, 0.999] |
| CRPcycle3-2 b | −0.392 | 24.9 | [−0.606, −0.185] |
| Baseline tumor size b | 0.491 | 33.2 | [0.201, 0.881] |
| Liver lesions c | 1.02 | 36.3 | [0.374, 2.03] |
Disclaimer/Publisher’s Note: The statements, opinions and data contained in all publications are solely those of the individual author(s) and contributor(s) and not of MDPI and/or the editor(s). MDPI and/or the editor(s) disclaim responsibility for any injury to people or property resulting from any ideas, methods, instructions or products referred to in the content. |
© 2023 by the authors. Licensee MDPI, Basel, Switzerland. This article is an open access article distributed under the terms and conditions of the Creative Commons Attribution (CC BY) license (https://creativecommons.org/licenses/by/4.0/).
Share and Cite
Nassar, Y.M.; Ojara, F.W.; Pérez-Pitarch, A.; Geiger, K.; Huisinga, W.; Hartung, N.; Michelet, R.; Holdenrieder, S.; Joerger, M.; Kloft, C. C-Reactive Protein as an Early Predictor of Efficacy in Advanced Non-Small-Cell Lung Cancer Patients: A Tumor Dynamics-Biomarker Modeling Framework. Cancers 2023, 15, 5429. https://doi.org/10.3390/cancers15225429
Nassar YM, Ojara FW, Pérez-Pitarch A, Geiger K, Huisinga W, Hartung N, Michelet R, Holdenrieder S, Joerger M, Kloft C. C-Reactive Protein as an Early Predictor of Efficacy in Advanced Non-Small-Cell Lung Cancer Patients: A Tumor Dynamics-Biomarker Modeling Framework. Cancers. 2023; 15(22):5429. https://doi.org/10.3390/cancers15225429
Chicago/Turabian StyleNassar, Yomna M., Francis Williams Ojara, Alejandro Pérez-Pitarch, Kimberly Geiger, Wilhelm Huisinga, Niklas Hartung, Robin Michelet, Stefan Holdenrieder, Markus Joerger, and Charlotte Kloft. 2023. "C-Reactive Protein as an Early Predictor of Efficacy in Advanced Non-Small-Cell Lung Cancer Patients: A Tumor Dynamics-Biomarker Modeling Framework" Cancers 15, no. 22: 5429. https://doi.org/10.3390/cancers15225429
APA StyleNassar, Y. M., Ojara, F. W., Pérez-Pitarch, A., Geiger, K., Huisinga, W., Hartung, N., Michelet, R., Holdenrieder, S., Joerger, M., & Kloft, C. (2023). C-Reactive Protein as an Early Predictor of Efficacy in Advanced Non-Small-Cell Lung Cancer Patients: A Tumor Dynamics-Biomarker Modeling Framework. Cancers, 15(22), 5429. https://doi.org/10.3390/cancers15225429