1. Introduction
Liver cancer ranks sixth in cancer incidence and third in cancer mortality worldwide [
1], which remains a major health challenge. Among liver cancer, hepatocellular carcinoma (HCC) accounts for more than 80% of cases. While hepatitis B virus (HBV) infection is the main risk factor for HCC in Asia, nonalcoholic steatohepatitis (NASH) is becoming the fastest growing etiology of HCC, especially in the west [
2]. Despite surgical resection at early stage, the recurrence rates reach 70% at five years [
3]. The median overall survival of advanced-HCC patients with first-line systemic therapies is less than 20 months [
2]. Thus, clarification of molecular mechanisms behind HCC initiation and progression, as well as discovery of potential prognostic markers and drug targets, are urgently needed.
With the rapid advancement of mass spectrometric techniques and bioinformatics, MS-based proteomics has provided deep insights into the characterization of HCC. For example, our previous study based on proteomics data from 101 pairs of early-stage HCC samples stratified HCC samples into three subtypes (S-I, S-II, and S-III) with increased malignancy, of which S-III subtype was associated with the poorest outcomes and featured cholesterol metabolism dysregulation [
4]. Due to the heterogeneity and complexity of HCC, more in-depth analysis of proteomics data is also required.
A growing body of evidence revealed that dysregulation of E3 ubiquitin ligases is related to the occurrence, progression, and prognosis of various cancers, including HCC [
5]. Among E3 ubiquitin ligases, really interesting new gene (RING)-finger (RNF) family is the largest one, with more than 300 validated members in humans, and mediates ubiquitination through their RING-finger domain [
6]. RNF proteins have been reported to regulate crucial cellular processes, including cell cycle, DNA repair, cell signaling, and responses to hypoxia [
7]. Several RNF proteins were found dysregulated in HCC, such as TRIM24 [
8] and RNF181 [
9]. TRIM24 expression correlates with poor prognosis, and promotes HCC progression through negatively regulating AMPK expression [
8]. Instead, RNF181 is downregulated in HCC tissues and suppresses HCC growth by inhibiting the ERK/MAPK pathway [
9]. However, whether there is any new player of the RNF family in HCC remains to be further investigated.
E3 ubiquitin protein ligase RING finger protein 149 (RNF149) belongs to the RNF family, and its gene is located on chromosome 2 in humans. Human RNF149 gene encodes a 400-amino-acid protein with a putative transmembrane domain in the middle region, and a RING-finger domain near its C terminus. It has been previously reported that
RNF149 gene is mutated in some human cancers, including breast, ovarian, and colorectal cancer. In colorectal cancer, RNF149 selectively degrades wild-type B-RAF instead of mutant B-RAF [
10]. In nasopharyngeal carcinoma (NPC), MFSD4A-recruited RNF149 mediates the ubiquitination and degradation of EPHA2, thus inhibiting the proliferation, migration, and invasion of NPC cells [
11]. Based on TCGA data,
RNF149 expression was also significant in many other cancers, including HCC and breast cancer (
Figure S1). Nevertheless, the role of RNF149 in HCC is largely unknown.
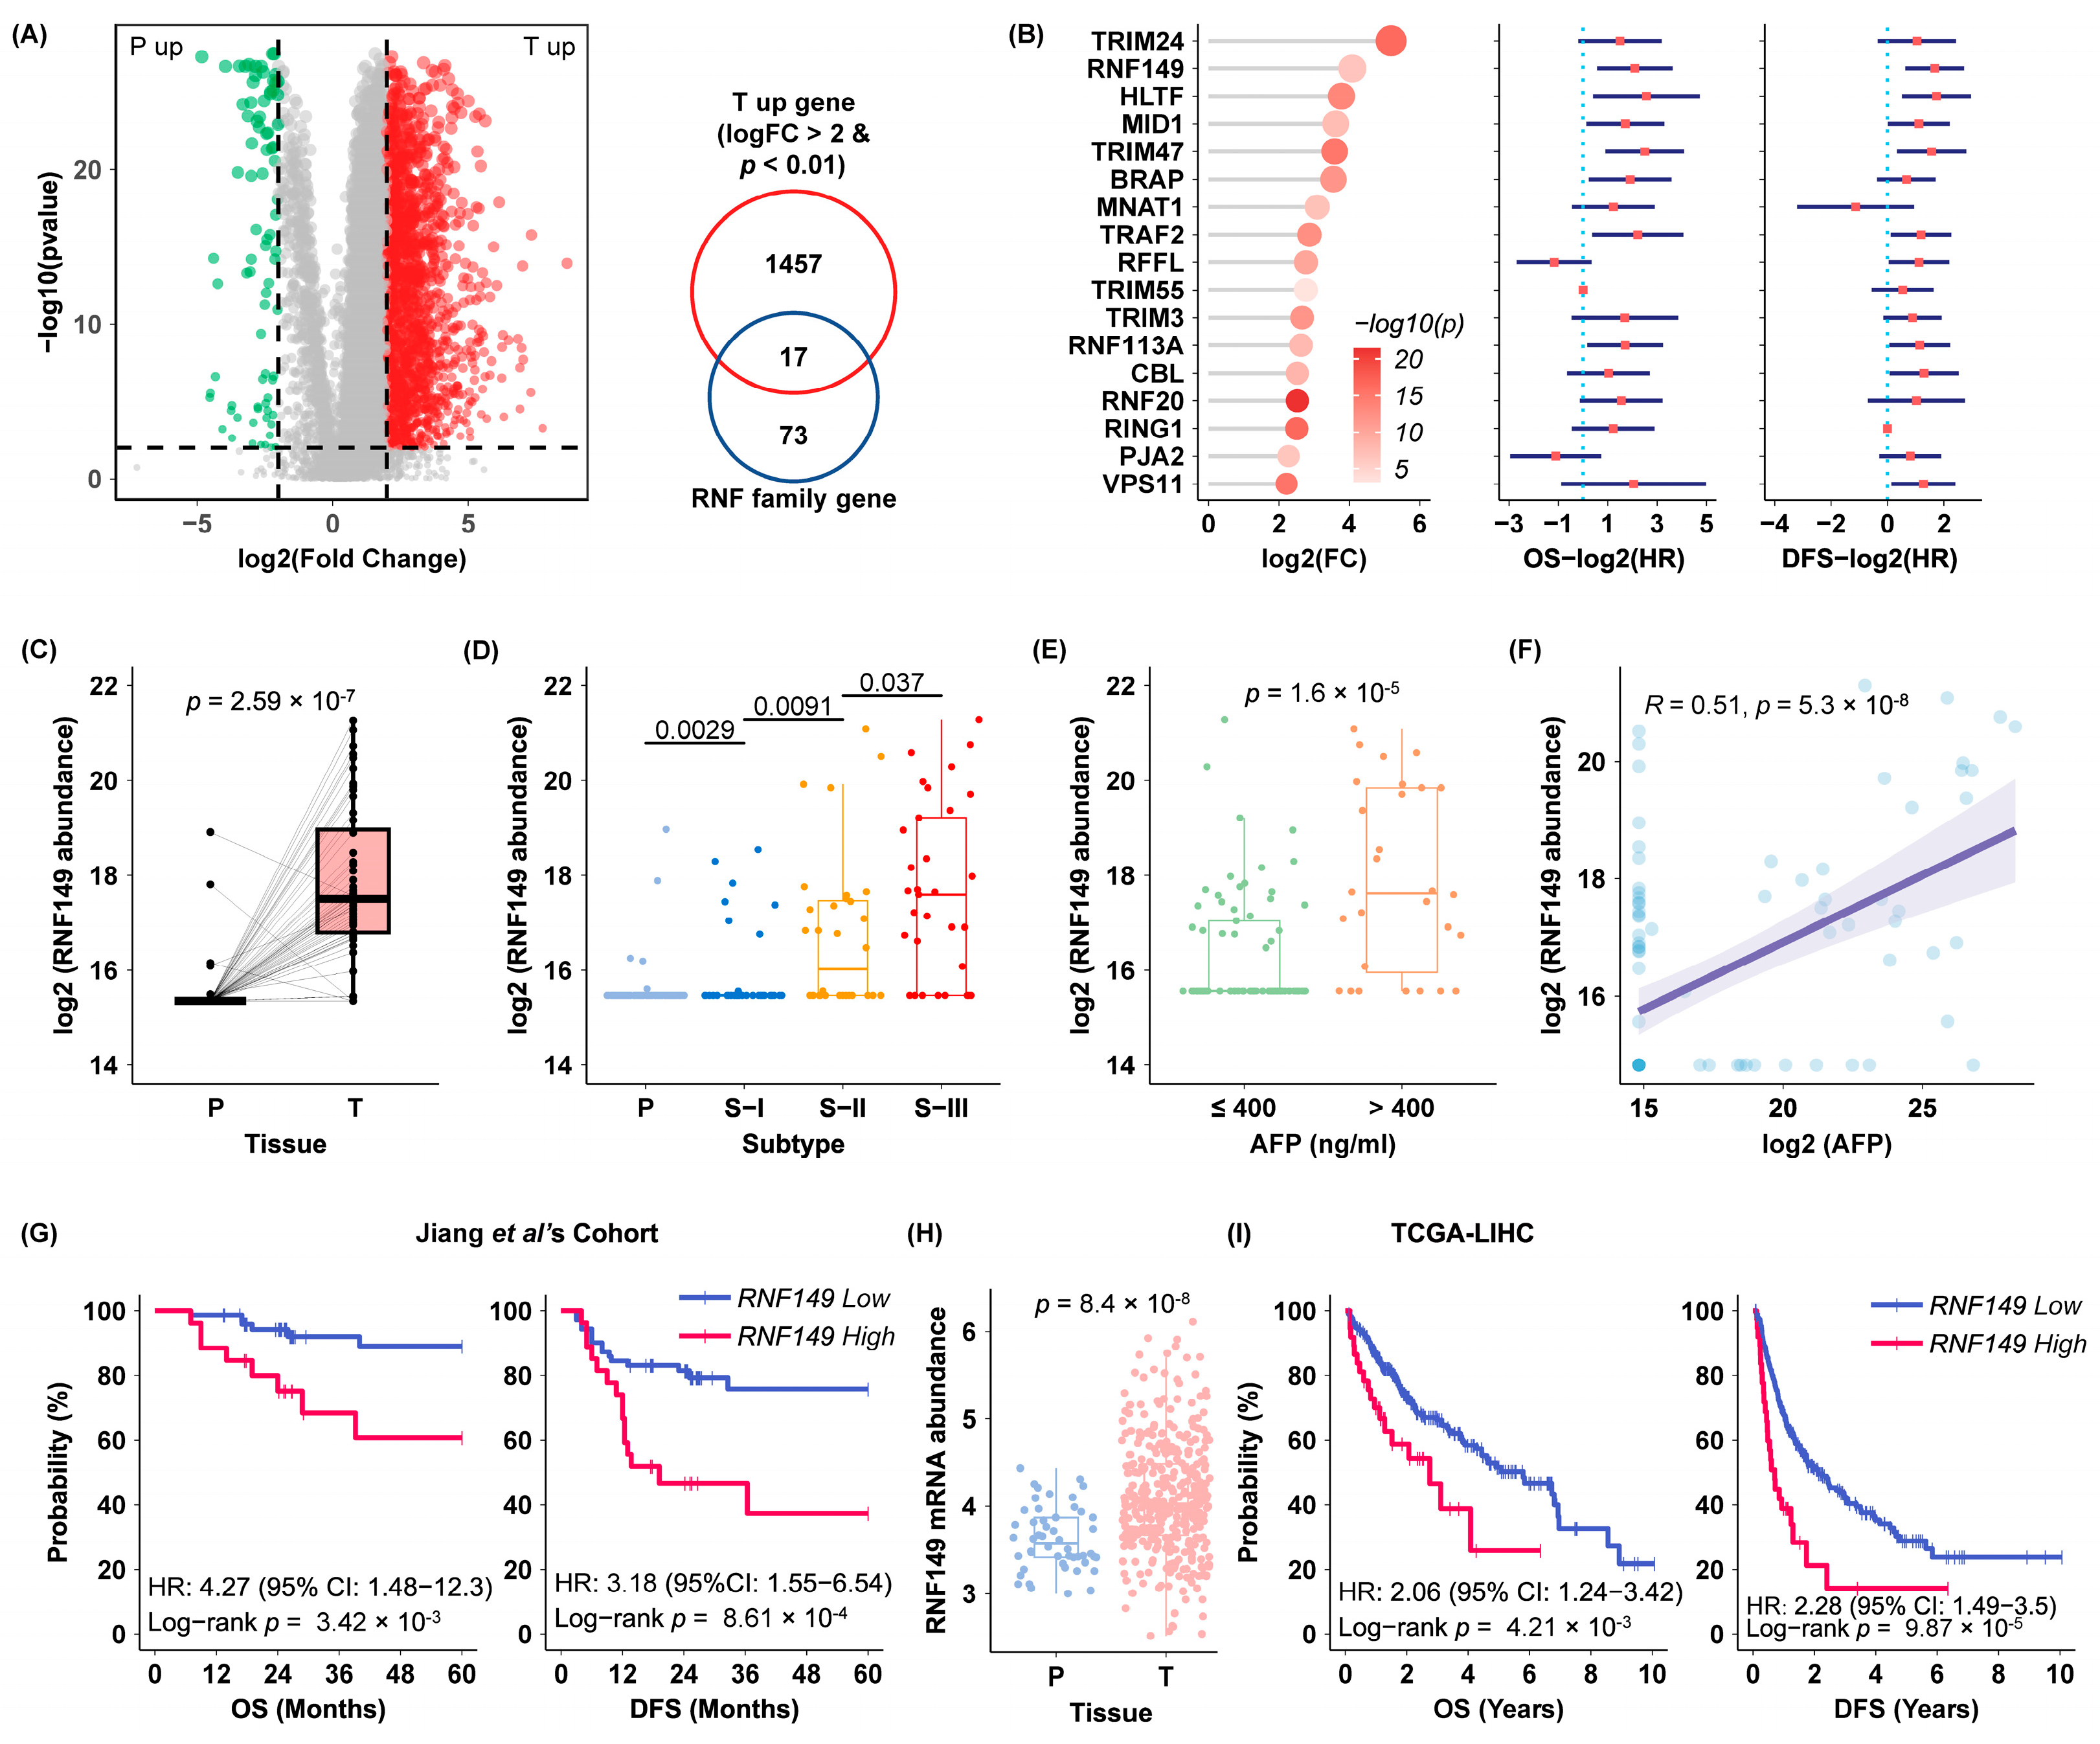
In this study, based on our previous proteomics data, we found that RNF149 was upregulated in tumor tissues and correlated with poor diagnosis of HCC patients. Furthermore, we validated for the first time that RNF149 promoted HCC progression in vitro through its ubiquitin ligase activity, and identified DNAJC25 as its novel substrate. In addition, our bioinformatics analysis, for the first time ever, revealed that RNF149 expression was associated with immunocyte infiltration and T cell functions, indicating its potential role in immune regulation of HCC.
2. Materials and Methods
2.1. HCC Proteomics and Transcriptomics Data Analysis
HCC proteomics data were downloaded from the Proteomics Identification Database (
https://www.ebi.ac.uk/pride/, accession number PXD006512, accessed on 5 September 2020) and were searched against the human UniProt database (version 20140922, 20,193 sequences) by MaxQuant (version 1.5.3.30, Max Planck Institute of Biochemistry, Munich, Germany) [
4,
12]. The Cancer Genome Atlas (TCGA)-Liver hepatocellular carcinoma (LIHC) transcriptomics data were downloaded from the Genomic Data Commons Data Portal (
https://portal.gdc.cancer.gov/, accessed on 9 December 2020) [
13].
Proteomics and transcriptomics data analysis was performed by R (version 4.2.2). Using R/Bioconductor package limma (version 3.54.0) to identify the differentially expressed proteins between HCC tissues and peritumor tissues, and proteins that meet the following criteria are considered as tumor upregulated proteins: (1) fold-change larger than 2; (2)
p less than 0.05. R/Bioconductor package enrichR (version 3.2), clusterProfiler (version 4.6.0), Gene Set Variation Analysis (version 1.46.0) was used for over-representation enrichment analysis (ORA), Gene Set Enrichment Analysis (GSEA), single sample GSEA (ssGSEA,), respectively [
14,
15,
16,
17]. R packages survival (version 3.5–0) and survminer (version 0.4.9) were utilized to perform Cox regression and Kaplan–Meier analysis on patients’ overall survival (OS) and disease-free survival (DFS), and provide a comparison between various groups. Pearson correlation was used for correlation analysis. Wilcoxon rank-sum test was used to compare two groups.
Based on the immune-related signature gene list [
18,
19,
20], ssGSEA was performed to assess the immune enrichment score and the immune cell infiltration, such as activated CD8+ T cell, exhausted T cell, M2 macrophage, etc. Enrichment score heatmap was plotted using the R/Bioconductor package ComplexHeatmap (v2.4.3). Pearson correlation was used to calculate correlations between RNF149 protein expression and immune cell infiltration.
2.2. Cell Culture
The human HCC cell lines HepG2 (Serial: SCSP-510), Huh7 (Serial: SCSP-526), Hep3B (Serial: SCSP-5045), PLC/PRF/5 (Serial: SCSP-5095), and SNU-387 (Serial: SCSP-5046), and the human embryonic kidney cell line HEK293T (Serial: SCSP-502) were obtained from Cell Bank/Stem Cell Bank, Chinese Academy of Sciences. The human HCC cell line SNU-475 cell line was purchased from Shanghai Zhong Qiao Xin Zhou Biotechnology. The human HCC cell line MHCC-97H cell line was obtained from Dr. Ying Jiang (National Center for Protein Sciences).
The HepG2, Huh7, Hep3B, PLC/PRF/5, MHCC-97H, SNU-387, SNU-475, and HEK293T cell lines were cultured in either Dulbecco’s modified Eagle’s medium (DMEM, Gibco, Grand Island, NY, USA) or Roswell Park Memorial Institute 1640 medium (RPMI 1640, Gibco, Grand Island, NY, USA) supplemented with 10% fetal bovine serum (FBS, Newzerum, Christchurch, New Zealand) and 1% Pen Strep (Gibco, Grand Island, NY, USA) at the conditions of 37 °C and 5% CO2. All of the cells were confirmed by short tandem repeat (STR) assay and contained no mycoplasma contamination.
2.3. Cell Transfection and Stable Cell Line Generation
For siRNA transfection, two different siRNAs targeted for RNF149 were purchased from JTS scientific (Wuhan, China), and sequences are as follows: siRNF149-1 5′-CCAGATGATGACGGAAGTGTT-3′, siRNF149-2 5′-GAATTGATGTTGATGCTGATT-3′. The siRNAs were transfected into cells using TurboFect reagent (Thermo Fisher Scientific, Waltham, MA, USA) according to its manual. A volume of 2 μg siRNA (or control) was added to 100 μL serum-free medium and incubated with 7 μL TurboFect for 20 min. Cells with a density of about 50% in 6-well plates were transfected, and replenished with fresh DMEM after 12 h of incubation.
For plasmid transfection, RNF149 cDNA was cloned into pCMV-HA and pHAGE-3 × FLAG vectors, and the plasmids were transfected into cells using TurboFect reagent (Thermo Fisher Scientific, Waltham, MA, USA) according to its manual.
Stable cell lines with RNF149 overexpression were constructed using pHAGE-3 × FLAG vector. Volumes of 12 μg of pHAGE-3 × FLAG vector or pHAGE-3 × FLAG-RNF149 plasmid, 3 μg of pMD2.G plasmid, and 9 μg of psPAX2 plasmid were added to 500 μL serum-free medium, and incubated with polyetherimide (23966-1, Polyscience, Warrington, PA, USA) for 20 min. HEK293T cells with a density of about 70% in 10 cm dishes were transfected. After 12 h of incubation, cells were replenished with fresh DMEM. The culture medium was collected at 48 h and 72 h after transfection, and the medium was filtered through a 0.45 μm filter membrane to obtain a lentiviral virus solution. The cells with a density of about 50% in the 6-well plate were infected with the concentrated virus solution and 4 μg/mL polybrene (Sigma-Aldrich, Darmstadt, Germany). After incubation for 12 h, the medium was replaced with fresh DMEM. After 72 h of infection, 2 μg/mL puromycin (Thermo Fisher Scientific, Waltham, MA, USA) was added to the medium to screen for the stable RNF149-overexpressing cells.
2.4. Antibodies
Antibody against Flag tag (A8592) was purchased from Sigma-Aldrich (Darmstadt, Germany). Antibody against β-Actin (66009-1-IG) was purchased from Proteintech (Wuhan, China). Antibody against RNF149 (HPA011424) was purchased from Atlas Antibodies (Bromma, Sweden). Horseradish peroxidase-labeled goat anti-mouse (SA00001-1) and goat anti-rabbit (SA00001-2) immunoglobulin G (IgG) (H + L) antibodies were purchased from Proteintech (Wuhan, China).
2.5. Western Blotting
Total cellular proteins were extracted using NETN lysis buffer (10 mM Tris, pH 8.0, 100 mM NaCl, 0.5% NP-40 and 1 mM EDTA) supplemented with protease inhibitor phenylmethylsulfonyl fluoride (PMSF) (Solarbio life sciences, Beijing, China) and phosphatase inhibitor NaF. After blowing and mixing, the cells were put on ice for 10 min and sonicated for 5 min. Protein concentration was quantified using BCA Protein Assay Kit (23227, Thermo Fisher Scientific, Waltham, MA, USA). The lysis product was mixed with the 5 × loading buffer (50 mM Tris, pH 6.8, 2% SDS, 10% glycerol, 0.005% bromophenol blue and 2% β-mercaptoethanol) in a 4:1 ratio, and the sample was boiled twice at 95 °C for 7 min each time to obtain the WB sample.
Western blot analysis followed standard procedures [
21]. The sample was loaded on a 10% SDS-PAGE gel and subjected to 120 V constant voltage electrophoresis until bromophenol blue ran out of the gel. The separated sample was electrolyzed at 250 mA for 90 min to a 0.45 nitrocellulose filter membrane (66485, BioTrace, Auckland, New Zealand). Nitrocellulose membrane was incubated with 5% skimmed milk dissolved in TBST at room temperature for 2 h. After blocking, the primary antibody was added and incubated overnight at 4 °C, and then washed three times with TBST, 7 min each time. The corresponding secondary antibody was added at room temperature and incubated for 1 h. Finally, the membrane was washed three times with TBST for 7 min each time. The target protein was visualized using NcmECL Ultra (P10200, NCM Biotech, Suzhou, China).
2.6. Proliferation and Colony Formation Assays
For the proliferation assay, 5000 cells were cultured in 96-well cell culture plates for 6 days, and cell proliferation was detected using Cell Counting Kit-8 (AQ308-3000T, Beijing Aoqing Biotechnology, Beijing, China) according to the manual, once each day.
For the colony formation assay, 4000 cells were cultured in 6-well cell culture plates for 14 days, and then fixed in methanol for 30 min and stained with crystal violet solution (C0121, Beyotime Biotechnology, Beijing, China) for 1 h. Representative images were acquired using a camera. The colony numbers were counted by Photoshop CS, and the data were analyzed using GraphPad Prism 7 software.
2.7. Migration and Invasion Assays
For cell migration or invasion, transparent PET membrane with 8 μm pores (353097, BD Biosciences, Franklin Lakes, NJ, USA) or Corning Matrigel Invasion Chamber 24-Well Plate 8.0 Micron (354480, BioCoat, Horsham, PA, USA) were used. Huh7 (1 × 10⁵), MHCC-97H (3 × 10⁵), PLC/PRF/5 (3 × 10⁵) or SNU-475 (1 × 10⁵) cells were seeded in the upper chamber with 300 μL serum-free medium, and 500 μL medium containing 10% FBS was added to the lower chamber. The incubation time for migration or invasion of Huh7 and SNU-475 was 24 h, and the incubation time for migration or invasion of MHCC-97H and PLC/PRF/5 was 60 h. After incubation, the cells were fixed in methanol and stained with crystal violet solution (C0121, Beyotime Biotechnology, Beijing, China). Representative images were acquired using an optical microscope (Nikon, Tokyo, Japan), and all images were taken from a random field of view. The cell numbers were counted by Photoshop CS and the data were analyzed using GraphPad Prism 7 software.
2.8. Immunohistochemistry (IHC)
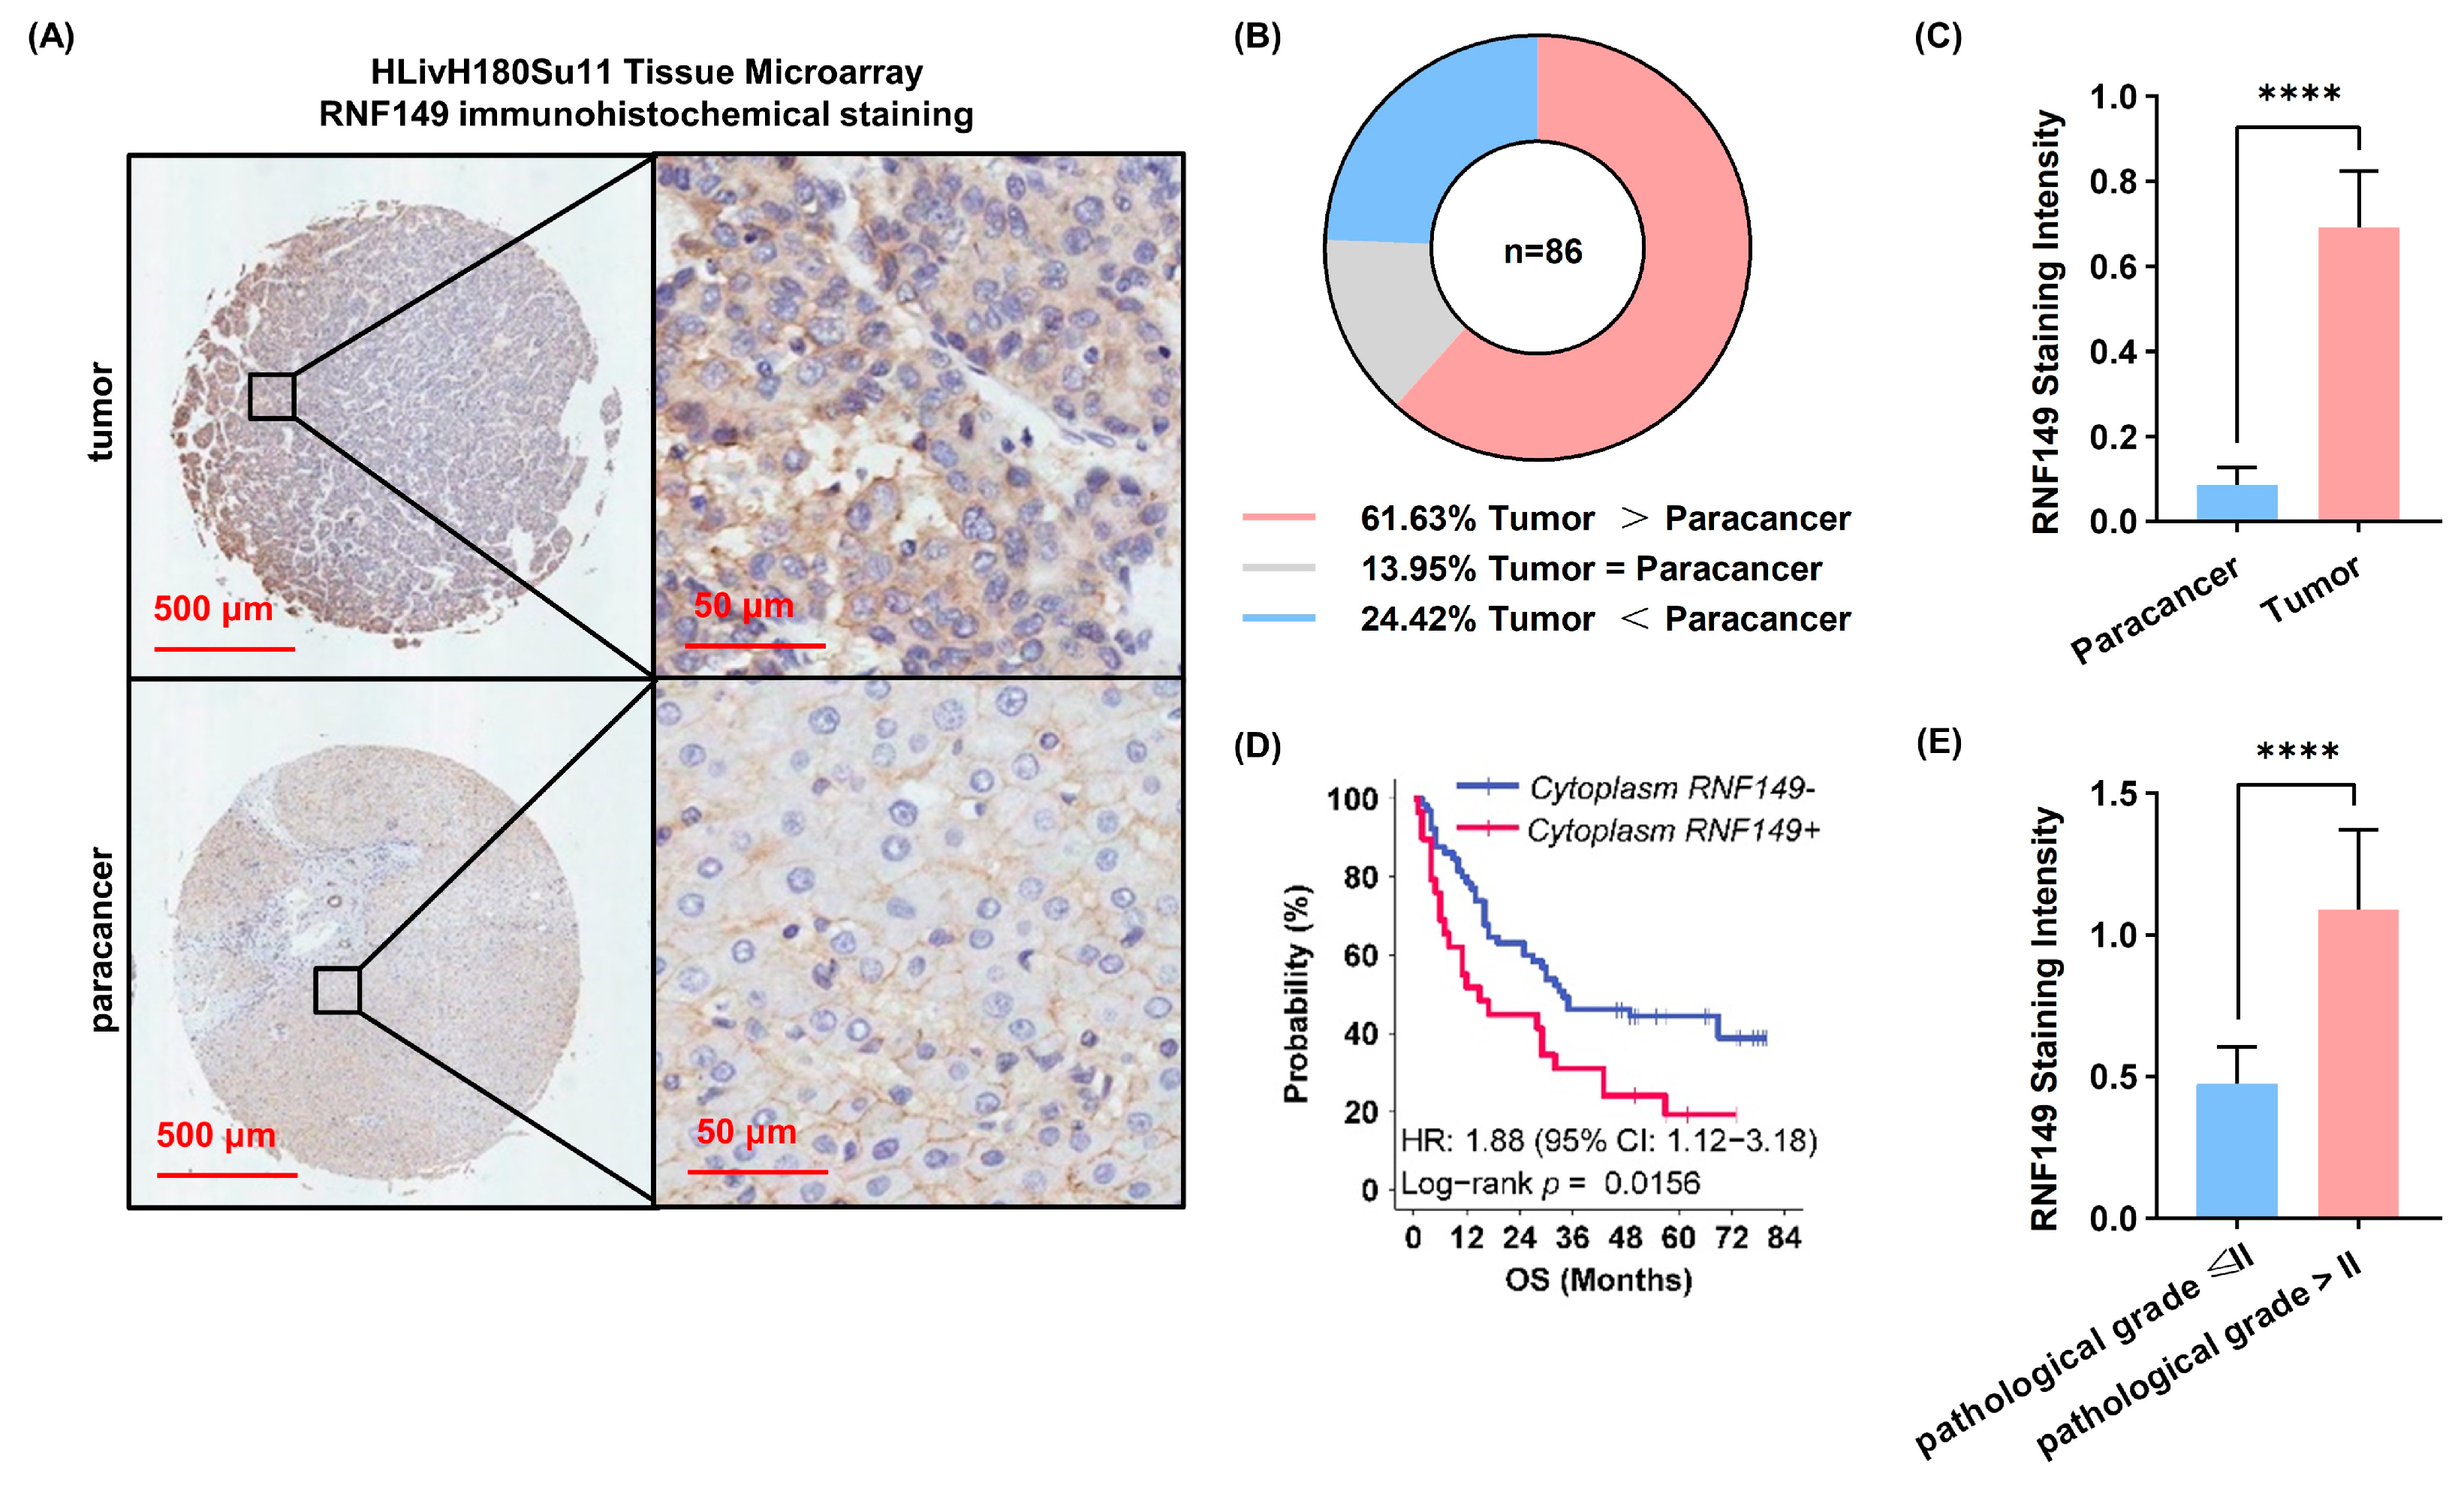
A tissue microarray (TMA) chip containing 94 HCC and 86 paired nontumor liver tissues were subjected to immunohistochemical staining at Shanghai Outdo Biotech Company using antibody against RNF149 (HPA011424, Atlas Antibodies, Bromma, Sweden). The chip’s protein intensity was scored by two trained pathologists, blindly and independently. The staining extent score ranged from 0 to 4 based on the percentage of immunoreactive tumor cells (0%, 1–5%, 6–25%, 26–75%, and 76–100%). The staining intensity was scored as negative (score = 0), weak positive (score = 1), positive (score = 2), or strong positive (score = 3). A score ranging from 0 to 12 was calculated by multiplying the staining extent score by the intensity score.
2.9. Co-Immunoprecipitation (Co-IP)
Total cellular proteins were extracted using NETN lysis buffer freshly supplemented with protease inhibitors (A32955, Thermo Scientific, Waltham, MA, USA) and phosphatase inhibitors (04906837001, Roche, Basel, Switzerland). After the whole cell lysate was obtained according to the previous method and the protein concentration was determined, 55 μL of the lysate was taken as the input group, mixed with the loading buffer, and boiled to obtain the WB sample.
For the protein with Flag tag, 30 μL Flag-agarose beads (A2220, Sigma-Aldrich, Darmstadt, Germany) were added to the remaining lysis products, and slowly mixed at 4 °C for 6 h. The agarose beads were washed with NETN lysis buffer 3 times, and slowly mixed at 4 °C for 5 min each time. The supernatant was discarded, and 55 μL 2 × loading buffer was added to the agarose beads. The sample was boiled to obtain the IP sample.
For RNF149, 20 μL Protein A/G PLUS agarose beads (sc-2003, Santa Cruz, CA, USA) and 1 μg Rabbit IgG (3900S, Cell Signaling Technology, Danvers, MA, USA) were added to the remaining lysates, and slowly mixed at 4 °C for 2 h to remove nonspecific binding proteins. The supernatant was taken, and 2 μg Rabbit IgG or RNF149 antibody was added to the control group or the experimental group, respectively, and slowly mixed at 4 °C overnight. The IP sample was obtained by adding 20 μL Protein A/G PLUS agarose beads, slowly mixing at 4 °C for 4 h, and adding 2 × loading buffer to boil the sample. The enriched proteins were then detected by WB.
2.10. IP-MS
Huh7 cells with RNF149 overexpression were treated with 50 μM MG132 (S2619, selleck, Houston, TX, USA) for 6 h, and then were harvested for preparation of whole cell lysates. After incubation with anti-Flag-agarose beads, the protein was subjected to SDS-PAGE. After electrophoresis, the protein gel was stained with Coomassie brilliant blue, and then analyzed by MS by QE-HF for 75 min.
2.11. Proteomic Profiling of HCC Cells
Huh7 cells with RNF149 overexpression and MHCC-97H cells with RNF149 knockdown were extracted by SDC lysis buffer (100 mM Tris, pH 8.5, 1% DOC, 10 mM TCEP, 40 mM CAA). The protein concentration was determined using the BCA Protein Assay Kit. Proteins were digested by trypsin (protein:enzyme, 50:1, w/w) overnight. The digested tryptic peptides were acidified by FA to a final FA concentration of 1%, and then centrifuged at 16,000× g for 10 min. The acidified supernatants were desalted using a homemade C18 stage-tip. The homemade C18 stage-tip was activated with acetonitrile and then equilibrated twice with 0.1% formic acid. The acidified supernatant was loaded to the C18 stage-tip, and then 0.1% formic acid was used to wash the column twice, and 50% acetonitrile with 0.1% formic acid was used to elute peptides. The peptides were analyzed by MS by QE-HF for 150 min.
2.12. Xenograft Tumor Growth Assays
Male NOD-SCID mice (SpePharm Biotechnology, Beijing, China), aged 4 weeks, were housed in a special pathogen-free animal facility. Each mouse was injected subcutaneously with 4 × 10⁶ RNF149 OE or empty vector (EV) control Huh7 cells into the right or left flank. The tumor length and short diameter were measured every three days with vernier calipers until 30 days later. Mice were euthanized and tumors were retained for follow-up analysis. Tumor volumes were determined using the ellipsoidal volume formula: 1/2 × length × width2. All animal experiments were performed according to our Institutional Animal Care and Use Committee (IACUC) guidelines.
2.13. Statistical Analysis
All data are recorded as mean ± SEM. Statistical analyses were performed with GraphPad Prism software (Version 8.0) (San Diego, TX, USA) using unpaired two-tailed Student’s t-test, as described in the figure legends. p value less than 0.05 was considered statistically significant.
4. Discussion
As a major health concern globally, research on HCC has attracted much attention. With the aid of advanced proteomics technology, researchers have been able to profile the proteomic landscape of HCC tissues from clinical cohorts, and have revealed multiple molecular aspects associated with HCC progression, treatment, and outcome. Our previous study identified sterol O-acyltransferase 1 (SOAT1) as a prognostic marker with unfavorable outcome and potential drug target for treatment of S-III subtype with highest malignancy [
4,
26]. In addition, another cohort study based on proteomics data discovered that phosphorylation of fructose-bisphosphate aldolase A (ALDOA) promoted HCC progression by enhancing glycolysis [
27]. Thus, it is conceivable that deep analysis of proteomics data will gain us a more insightful and comprehensive understanding towards the critical molecular mechanisms behind HCC, contributing to the identification of potential drug targets and biomarkers.
Through analyzing our previous proteomics data, we found 17 members of the RNF family with significant elevation in tumor tissues. Consistently, some RNF proteins among them have been reported to be related with HCC. For example, TRIM24 overexpression is related to HCC onset and progression, and functions as a tumor promoter by downregulating AMPK levels [
8]. HLTF expression is upregulated in HCC tissues, and overexpression of HLTF accelerates growth and metastasis of HCC cells via stabilizing SRSF1 and stimulating ERK/MAPK pathway [
28]. Notably, we identified RNF149 as a novel player of RNF proteins in HCC, which showed significant upregulation, preceded only by TRIM24. RNF149 expression positively correlated with AFP level and poor prognosis. Moreover, immunohistochemical experiments of independent HCC cohorts further validated that RNF149 expression was upregulated in tumors, and could be a prognostic marker.
As an E3 ubiquitin ligase, only two experimentally validated substrates of RNF149 were reported so far: wild-type but not mutant BRAF in colorectal cancer [
10], and EPHA2 in NPC [
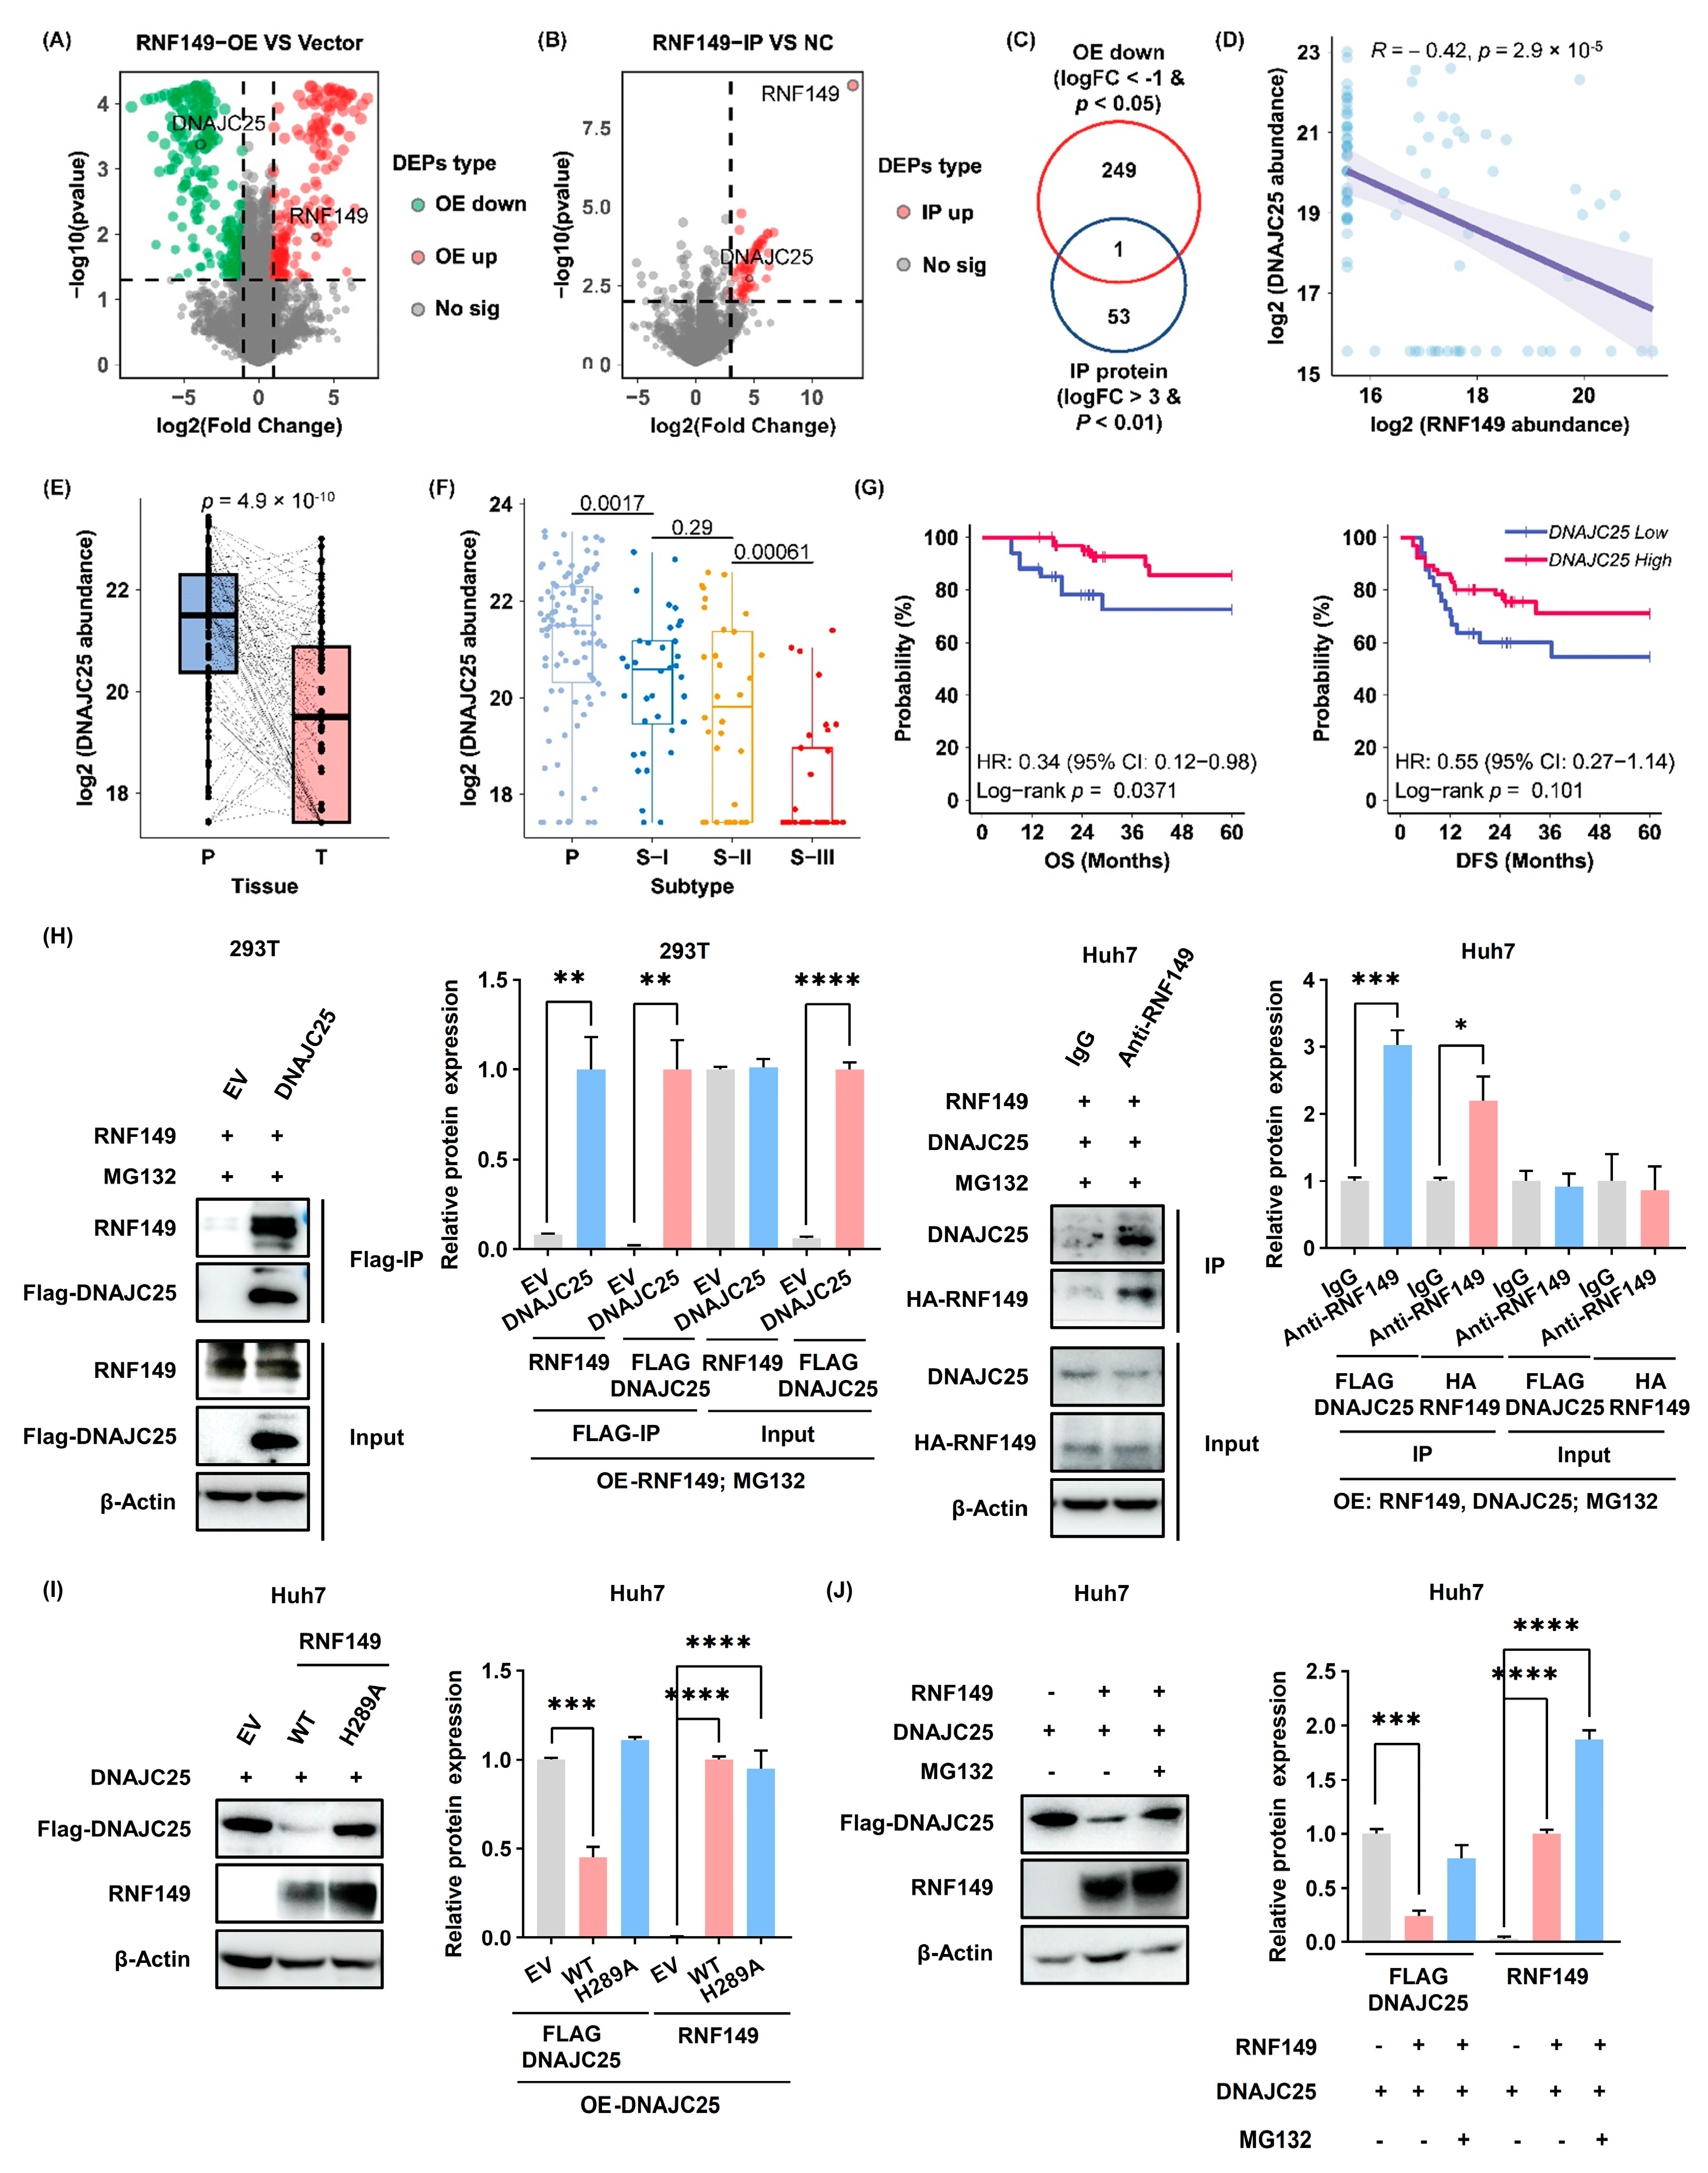
11]. To discover the substrate of RNF149 in HCC, we focused on the proteins which both showed significant downregulation in RNF149-overexpressed HCC cells and interacted with RNF149, and DNAJC25 was the only candidate with high confidence. Further biochemical experiments proved DNAJC25 was a substrate of RNF149. Consistently, DNAJC25 was reported be downregulated in HCC [
22]. Intriguingly, B-RAF and EPHA2 were not included in our candidate list, because B-RAF did not interact with RNF149 based on our Co-IP experiments, and EPHA2 protein levels did not decrease profoundly when RNF149 was overexpressed, which might be resulting from differences of experimental conditions and cancer cell lines. More substrate proteins of RNF149 need to be determined in the future.
Due to a putative single-pass transmembrane domain in its middle region, RNF149 is believed to be localized in membranes, such as endoplasmic reticulum (ER) membrane. However, reports regarding its functions in cells are few. It has been reported that RNF149 promotes cell survival in colorectal cancer [
10] and inhibits cell migration in NPC [
11]. Additionally, RNF149 is found to involve the development of rat neonatal gonocytes [
29]. Recently, a study showed that RNF149 interacts with components of pre-emptive ER associated quality control (pEQC) pathway, regulating the translocation of misfolded proteins [
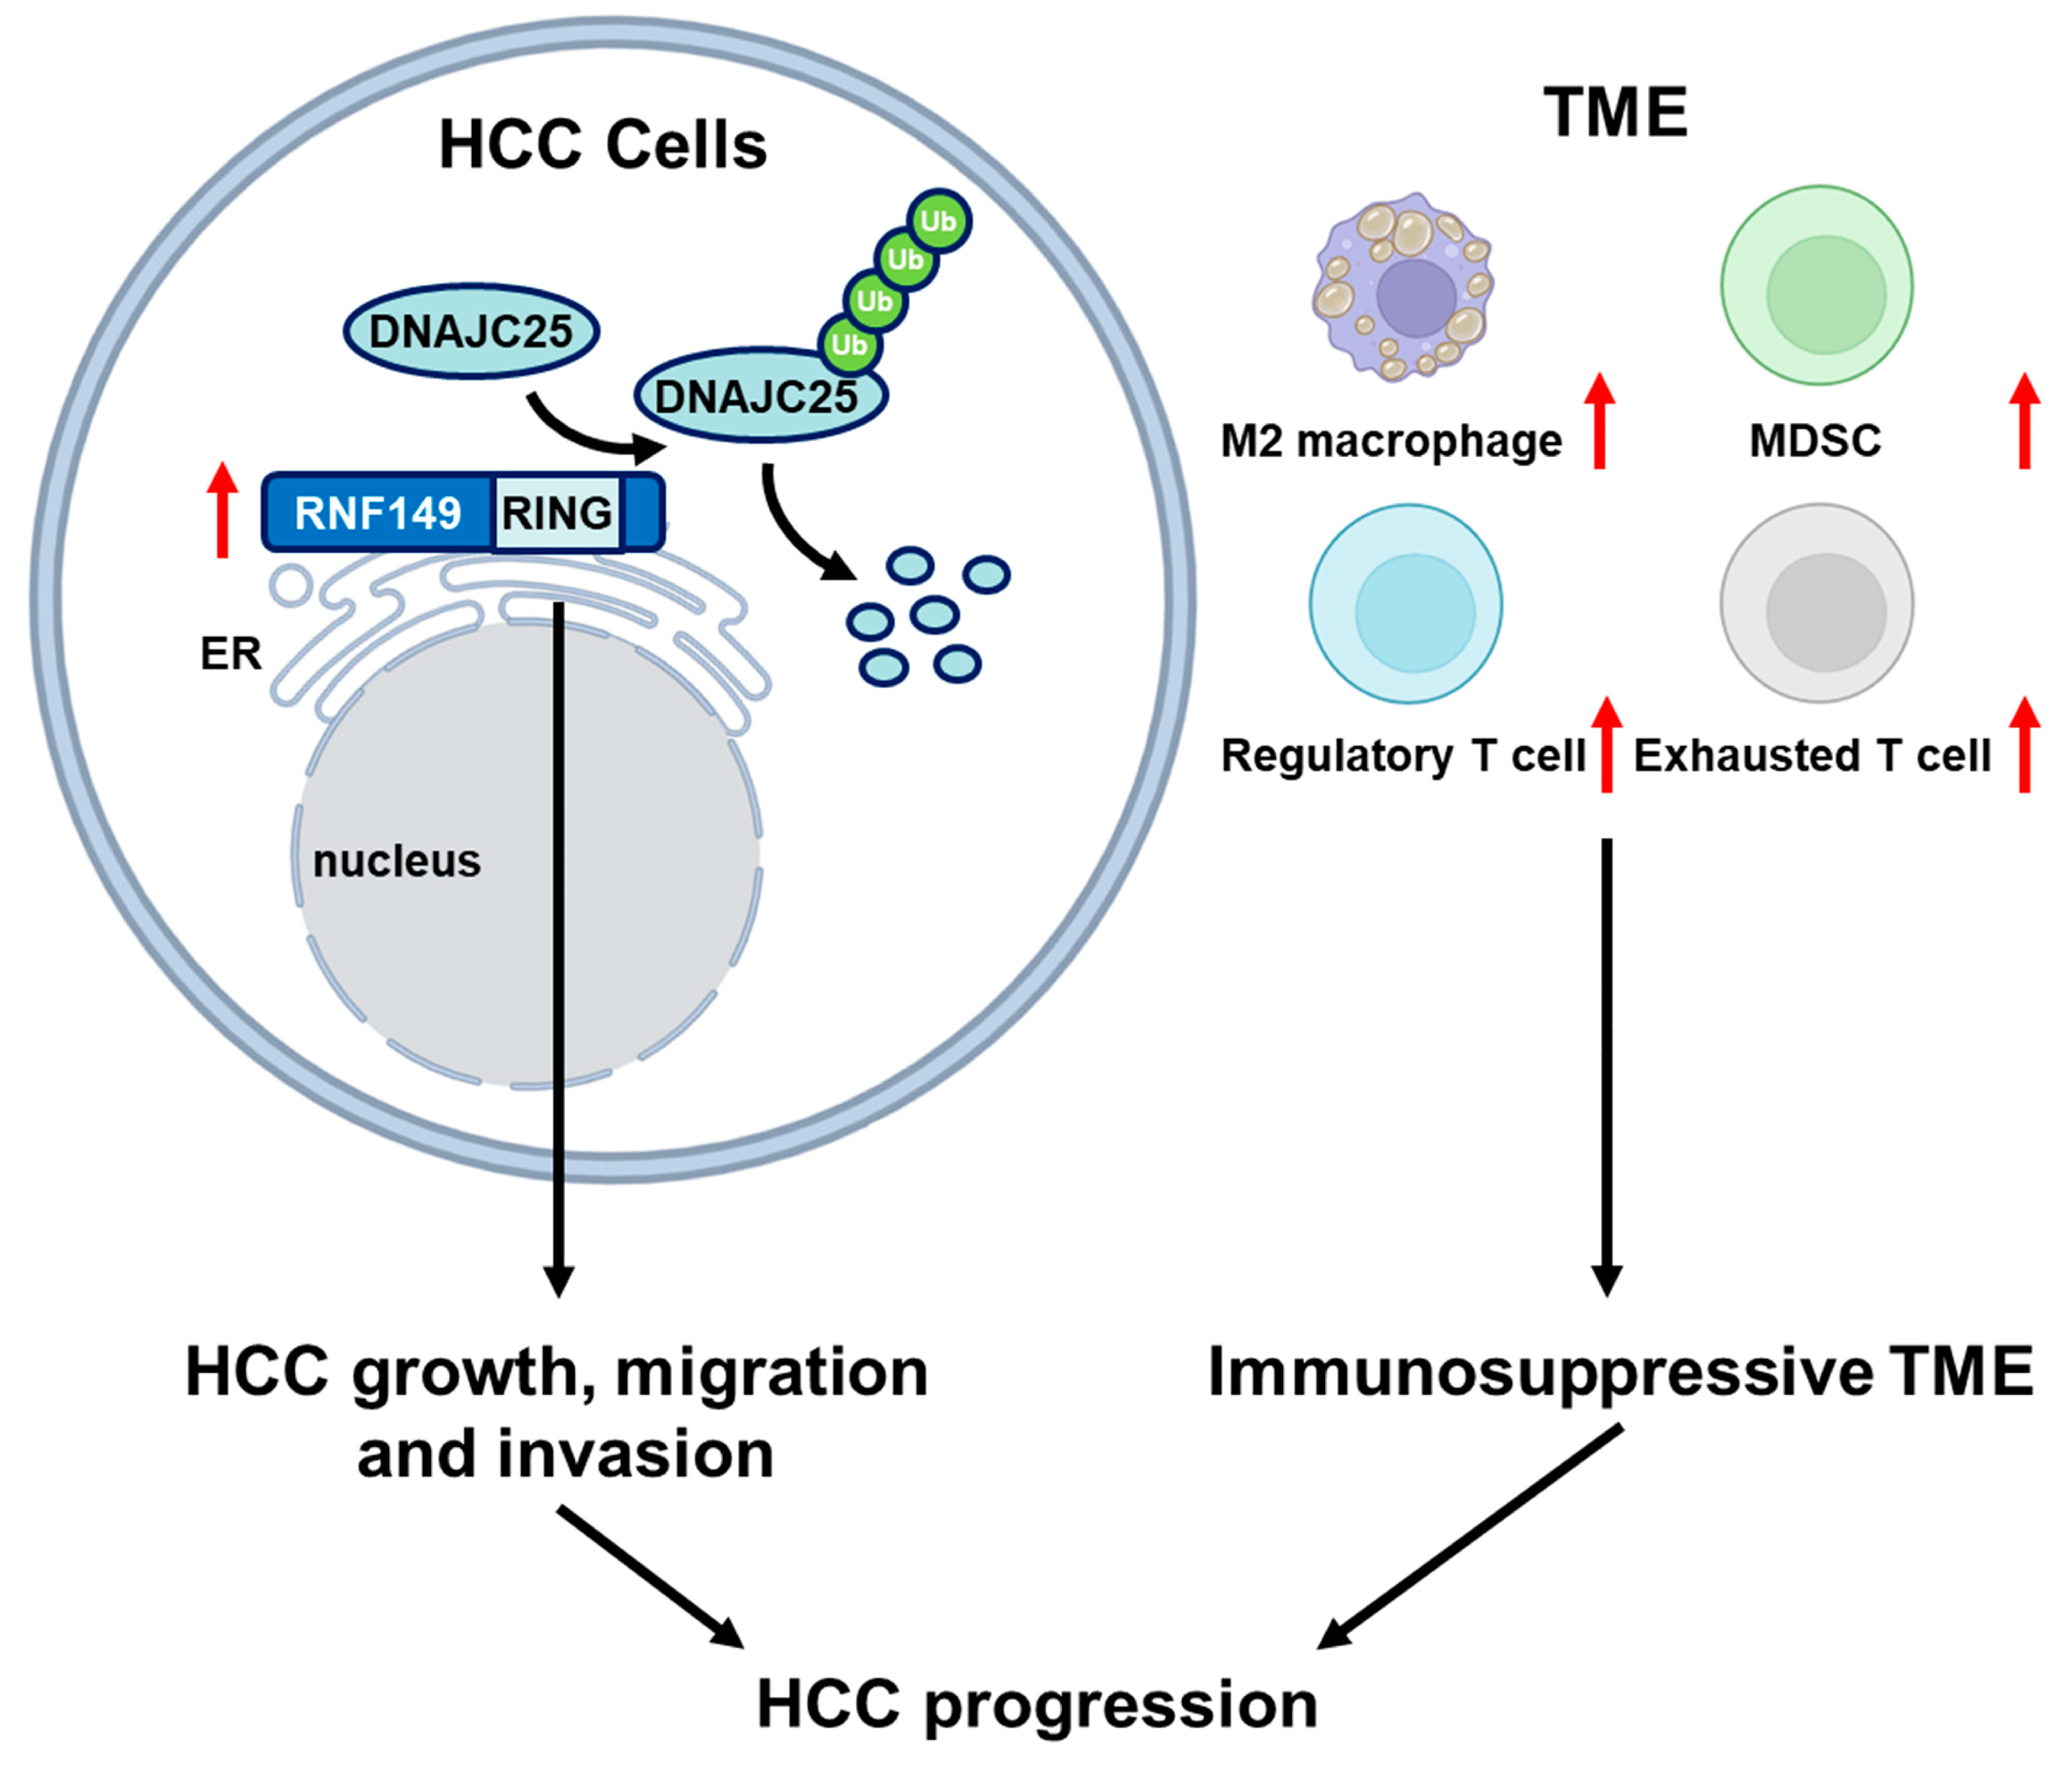
30]. In our research, we proved that RNF149 promoted cell growth and migration of HCC cells, and these tumor-promoting effects were dependent on its E3 ubiquitin ligase activity (
Figure 9). Notably, DNAJC25 is predicted to be ER localized and associated with protein folding [
22,
31], indicating that RNF149 may regulate quality surveillance of ER proteins through DNAJC25. In addition, enrichment analysis of differentially expressed proteins in RNF149-overexpressed or RNF149-knockdown cells also suggested that RNF149 might play a role in many cellular processes, such as mitotic cell cycle, fatty acid, and pyruvate metabolism, which remains to be further investigated.
Antitumor immunotherapy has attracted increasing attention, and immune checkpoint inhibition with antivascular endothelial growth factor (VEGF) neutralizing antibodies has become first-line therapy for advanced-HCC patients [
32]. Thus, we also explored the potential role of RNF149 in immune regulation of HCC. Based on proteomics data, we found that markers of CD4+ T cells and MDSCs were enriched in patients with high RNF149 expression. Additionally, RNF149 expression was correlated with T cell exhaustion and Treg cells. These results indicated an immunosuppressive feature of tumor microenvironment in RNF149-upregulated patients, and further study is needed to validate the functions of RNF149 in TME regulation.


