Simple Summary
Bisphenol A (BPA), an endocrine-disrupting chemical extensively used in the production of everyday products, profoundly affects human homeostasis and well-being. Given the liver’s critical role in toxins’ first passage detoxification, it may become highly susceptible to BPA harmful effects. The present study aimed at investigating changes in the liver transcriptomics caused by oral exposure to BPA in mice. Our findings may contribute to clarifying the impact of BPA on gene expression in mice livers to predict the molecular mechanisms underlying BPA-related hepatic toxicity and carcinogenic effect.
Abstract
Bisphenol A (BPA) is an environmental toxin widely used in the production of polycarbonate plastics. A correlation exists between BPA tissue contamination and the occurrence of pathological conditions, including cancer. First-passage detoxification of high BPA amounts in the liver promotes hepatotoxicity and morphological alterations of this organ, but there is a lack of knowledge about the molecular mechanisms underlying these phenomena. This prompted us to investigate changes in the liver transcriptomics of 3-month-old female mice exposed to BPA (50 mg/kg) in drinking water for 3 months. Five female mice served as controls. The animals were euthanized, the livers were collected, and RNA was extracted to perform RNA-seq analysis. The multistep transcriptomic bioinformatics revealed 120 differentially expressed genes (DEGs) in the BPA-exposed samples. Gene Ontology (GO) annotations indicated that DEGs have been assigned to many biological processes, including “macromolecule modification” and “protein metabolic process”. Several of the revealed DEGs have been linked to the pathogenesis of severe metabolic liver disorders and malignant tumors, in particular hepatocellular carcinoma. Data from this study suggest that BPA has a significant impact on gene expression in the liver, which is predictive of the carcinogenic potential of this compound in this organ.
1. Introduction
Bisphenol A (BPA) is a substance commonly found in our environment. This ubiquitous chemical was first synthesized in 1891 by Alexander P. Dainin through the condensation of two phenol molecules and one molecule of acetone, in the presence of a catalyst—hydrogen chloride or ion-exchange resin [1,2]. The available data suggest that approximately 8 million tons of BPA are produced worldwide each year [3]. Due to its very good mechanical properties, the low adsorption of moisture, and thermal stability, BPA is a constituent of synthetic polymers that are applied in the production of food containers, bottles, toys, dentistry products, laminated flooring, paints, and electronic devices [1,4]. Additionally, it is utilized in the manufacturing process of thermal paper used in shop receipts, tickets, envelopes, and even books [1,5]. Nevertheless, it is important to note that starting from 2 January 2020, the European Chemicals Agency (ECHA) imposed restrictions on the sale of thermal paper containing a concentration of BPA exceeding 0.02% by weight [6].
The human body may be contaminated with BPA by lifelong exposure to this xenoestrogen endocrine disruptor through oral intake (food from plastic and metal packaging, dental materials), dermal absorption (shop tickets, envelopes, books), and/or inhalation (dust from laminate flooring, paints) [7,8]. The issue of BPA food contamination is particularly worrisome as this chemical is released from container polymers into meals or water when products are heated or exposed to ultraviolet light [9].
Due to its lipophilic characteristics, BPA is rapidly absorbed and can accumulate in multiple organs of the human body, such as kidneys, liver, adipose tissue, and placenta [1]. While the half-life of BPA is roughly 4.5 days in water and less than one day in the air due to its low volatility, the potential risk of its accumulation in the human body arises from prolonged and repeated exposure over extended periods [10]. After enteric absorption, BPA is mostly metabolized in the liver in a process initiated in the endoplasmic reticulum, resulting in the formation of glucuronide and sulfate conjugates [11,12]. The dominant metabolite of BPA, known as BPA glucuronide conjugate, is primarily eliminated through the bile. This fact, coupled with the chemical stability of the conjugate, suggests its potential as a valid biomarker for assessing exposure [13,14].
Considering that the liver is a critical player in the detoxification and metabolism of many chemical substances, concerns arise about the disruption of the normal functioning of this organ upon lifelong exposure to BPA [3]. BPA metabolites contribute to the formation of DNA adducts and cause the downregulation of antioxidant genes, thus, promoting hepatotoxicity by allowing reactive oxygen species (ROS) accumulation [15,16,17]. Transcriptomic studies indicate that BPA may influence the metabolism of lipids through the overexpression of lipoprotein lipase, β-acetyl-coenzyme A carboxylase, and fatty acid synthase [18,19]. Additionally, BPA exposure has been associated with hepatocellular carcinoma (HCC) [20] and non-alcoholic fatty liver disease (NAFLD) [21].
Despite data available in the literature, there is a lack of information regarding the molecular mechanisms underlying BPA-induced hepatotoxicity. This prompted us to investigate the liver transcriptomic signature by targeted bioinformatic analysis in living mice exposed to oral BPA for three months.
2. Materials and Methods
2.1. Laboratory Animals
The study was performed on ten 3-month-old female mice (Mus musculus, C67BL6/J/CMDB strain) with an average body weight of 30 g. They were maintained under a controlled temperature of 22 ± 20 °C, humidity 55 ± 10%, and 12:12 h light–dark cycle. Mice were kept in the animal house (at the Faculty of Veterinary Medicine, University of Warmia and Mazury in Olsztyn, Poland) with free access to food and water. The experiment was performed following the guidelines of the local ethics committee for animal experimentation in Olsztyn, Poland (affiliated with the National Ethics Committee for Animal Experimentation, Polish Ministry of Science and Higher Education; decision No. 46/2019). The animals were randomly divided into two groups. Mice were given the same food and were weighed weekly. During the experiment, five mice served as controls (CTR), and these animals did not undergo any experimental procedures. BPA in the drinking water at a dose of 50 mg/kg b.w. for 3 months was given to the other 5 mice and they served as an experimental group (BPA-treated). This dose is considered a lowest observed adverse effect level (LOAEL) for this species [22,23]. The BPA dose was gradually increased by weighing mice every week. The animals were decapitated after 3 months [24]. The livers were immediately removed after death and stored under liquid nitrogen at −80 °C until further experimental procedures.
2.2. RNA Extraction, Library Construction, and High-Throughput Transcriptome Sequencing
The total RNA was isolated from the livers of both groups using the mirVanaTM miRNA Isolation Kit with phenol according to the manufacturer’s protocol (Thermo Fisher Scientific, Waltham, MA, USA). To measure the quantity and quality of total RNA isolates, a 2100 Bioanalyzer (Agilent Technologies, Santa Clara, CA, USA) with a 6000 Nano LabChip Kit was used. For the construction of the RNA-seq libraries, samples with the highest RNA integrity number (RIN) values and concentrations were chosen. Briefly, 1 µg of total RNA was used for library construction by the Illumina TruSeq mRNA LT Sample Prep kit (Illumina, Inc., San Diego, CA, USA). Primary mRNA was purified using poly-T-attached magnetic beads, and then divalent cations were used for fragmentation of the templates. To generate the initial complementary DNA (cDNA) strands, the fragmented RNA was amplified with SuperScript II reverse transcriptase (Invitrogen, Waltham, MA, USA) and random primers. In the subsequent step, the second-strand cDNA was synthesized using DNA polymerase I and RNase H. To construct the final cDNA libraries, the PCR products were purified and enriched. Quantity of the RNA-seq libraries was assessed with real-time PCR (KAPA Library Quantification kits for Illumina Sequencing platforms). The quality of the libraries was determined using the TapeStation D1000 ScreenTape (Agilent Technologies, Waldbronn, Germany). Next, indexed libraries were sequenced on the NovaSeq 6000 platform (Illumina, San Diego, CA, USA). Library preparation and sequencing procedure were outsourced to external company (Macrogen, Geumcheon-gu, Republic of Korea).
2.3. In Silico Profiling of Liver Transcriptome Affected by BPA
2.3.1. Processing and Mapping of Raw Reads
The raw high-throughput sequencing data obtained from the NovaSeq 6000 system underwent an assessment based on established quality control criteria using the FastQC software version 0.11.7 [25]. The paired-end reads (2 × 150 bp, with stranded orientation) were subjected to a trimming process, where Illumina adaptors were detected within the sequences and low-quality reads (PHRED cut-off score < 20) were removed from subsequent analysis using Trimmomatic software v. 0.38 [26]. The resulting 120 bp trimmed reads were aligned to the mouse reference genome, specifically, according to Genome Reference Consortium Mouse Build 39annotation (GRCm39), utilising STAR software v. 2.7.10a [27]. Alignments involving multiple instances of the same sequence were disregarded for further analysis. The incorporation of the StringTie v. 2.2.1 pipeline allowed for a re-evaluation of the Genome Reference Consortium annotations, resulting in the identification of novel sequences on regions of intergenic expression [28]. Whole transcriptome high-throughput sequencing (RNA-seq) of BPA libraries was conducted to identify the expression profiles of differentially expressed genes (DEGs), differentially expressed long non-coding RNA (DELs), and differential alternative splicing events (DASs).
2.3.2. Detection of Differentially Expressed Genes and Long Non-Coding RNAs and Interaction Analyses
The analysis focused on identifying differentially expressed protein-coding transcripts. These transcripts were organized based on their genomic position and tagged as transcriptionally active regions (TARs). To perform the differentially expressed analysis, the DESeq2 tool v. 1.36.0 [29] was utilized, employing a negative binomial generalized linear model. Only TARs whose expression modification patterns reached the presumed binary logarithm of fold change (log2FC) cutoff level (absolute log2FC > 1) and significance threshold (adjusted p-value < 0.05) were included in further analyses. TARs located within the genomic region of protein-coding genes were categorized as DEGs, while those occurring in regions of long non-coding RNAs were classified as DELs. The DEGs–DELs potential correlations were estimated by co-expression analysis and the pairs located on different chromosomes but showing similarity of transcriptional profiles were characterized as trans-interactions based on Pearson’s correlation coefficient (absolute r value > 0.8 and p-value < 0.05).
2.3.3. Alternative Splicing Events and Differential Analysis
The replicate multivariate analysis of transcript splicing (rMATS v.3.2.5) was used to find differences in alternative splicing (AS) events among examined groups and the analysis was based on RNA-seq raw reads mapped to the reference Mus musculus genome [30]. The examined AS events included: alternative 5′ splice site (A5SS), alternative 3′ splice site (A3SS), mutually exclusive exons (MXE), retained intron (RI), and skipped exon (SE). The percent of splicing inclusion (PSI) values was calculated for all AS events according to the reads aligned to the spliced junction sites. The differential alternative splicing (DAS) events were statistically tested (FDR < 0.05) for each subject of the experimental and the control group. Moreover, DAS events were filtered according to the differential level of the ΔPSI > 0.1. To draw volcano and heatmap plots, R Bioconductor packages (http://www.R-project.org/, accessed date: 15 January 2023; v.4.1.1), i.a., ggplot2 (Wickham H. 2016, v.3.3.5), and circlize (Gu. Z. 2014, v.0.4.15) were applied.
2.3.4. Functional Annotations of DEGs, DELs, and DASs
The obtained liver gene signatures, DEGs, DELs, and DASs, were scanned according to Gene Ontology Consortium (GO) annotations [31,32] using g:Profiler software [33]. Biological processes (BP), cellular components (CC), and molecular functions (MF) were annotated as ontological terms for the essential genes. The enrichment analysis (adjusted p-value < 0.05) was applied to uncover ontology and pathway annotations regulated by DEGs, DELs, and DASs. To visualize the contribution of the identified DEGs, DELs, and DASs to liver function, those events were highlighted using the circlize R packages.
2.4. Real-Time PCR
The mRNA levels of specific transcripts were determined by real-time PCR. Primer3Plus software was used to design primers for target genes based on the sequences indicated in Table S1 [34]. The cDNA was synthesized using the Applied Biosystems™ High-Capacity cDNA Reverse Transcription Kit (Thermo Fisher Scientific, Vilnius, Lithuania) according to the manufacturer’s instructions. Real-time PCR was performed using the Applied Biosystems™ PowerUp™ SYBR™ Green Master Mix (Thermo Fisher Scientific, Vilnius, Lithuania) on the QuantStudio™ 3 Real-Time PCR System (Applied Biosystems™, Thermo Fisher Scientific Inc., Waltham, MA, USA). Four technical replicates were performed for each biological sample. The expression level of each gene was determined by the comparative Pfaffl method [32], in which gene expression in treated samples was changed by a factor compared with control samples and normalized to endogenous reference genes (UBC, GenBank NM _019639.4, and ACTB GenBank NM _007393.3) (relative quantification RQ = 1). Results were expressed as means of biological replicates ± standard deviations. Statistical analysis was performed using Prism 8 software (GraphPad Software Inc, San Diego, CA, USA) with a two-tailed Student’s t test. p values < 0.05 were considered statistically significant when <0.0332 (*), <0.0021 (**), <0.0002 (***), and <0.0001 (****) [35].
3. Results
3.1. Liver Transcriptomic Statistics and the Abundance of Expression Profiles
Overall, as a result of sequencing, 63.318 mln raw reads were obtained. The filtration procedure removed 9.187 mln reads with a low-quality score and the trimming procedure clipped out Illumina adaptor sequences. The surviving 49.619 mln paired-end reads were mapped to the Mus musculus reference genome (GRCm39). The results of the mapping process were applied to the further identification of the DEGs, DELs, and DASs. Uniquely mapped reads contained an average of 92.24% out of all processed sequences. According to the gene structure, 68.67% of paired-end reads’ nucleotides were aligned to the coding sequence (CDS), 27.00% to the untranslated regions (UTR), 2.62% to the intronic sequences, and 1.70% to the intergenic localizations. A numerical summary of the initial stages of sequencing data processing is shown in Table 1. The raw reads obtained during this study have been submitted to the European Nucleotide Archive under accession no. PRJEB65086.

Table 1.
Overview of the sequencing and mapping results for the ten RNA-seq libraries. CTR 1–5 refers to the biological replicates of the control liver; BPA 1–5 refers to the mice liver after BPA administration; unique reads refer to the reads mapped to only one location of the mouse genome; multi-mapped reads refer to reads aligned to more than one locus on the reference genome; reads mapped with too many loci refer to the reads mapped more than 20 to multiple loci on the reference genome.
3.2. Transcriptomic Differences in the Liver after Oral Exposure to BPA
Screening RNA-seq data for differential gene expression analysis revealed that the liver transcriptome affected by oral exposure to BPA was associated with 120 differentially expressed TARs. Among them, 101 TARs encoding protein sequences were classified as DEGs. In total, 48 DEGs were upregulated and 53 were downregulated under the influence of BPA. Estimated DEGs’ log2FC values range from −26.14 (PANK1, encoding the pantothenate kinase regulating the biosynthesis of coenzyme A) to 25.62 (NFIB, regulating the expression of transcription factors, like TGF-β1, involved in differentiation). The deep transcriptome analysis reveals eight long non-coding RNA (DELs) under BPA influence, within which five are upregulated (highest log2FC = 5.86—GM17077) and three downregulated (lowest log2FC = −2.72—RAPGEF4OS1). An overview of the expression profiles of all DEGs, DELs, and other TARs is represented as a volcano plot (Figure 1) and a heatmap supplemented with trans-interactions information (Figure 2). Statistics on identified DEGs, DELs, and other differentially expressed RNAs (DE-RNAs) are summarized in Table S2.
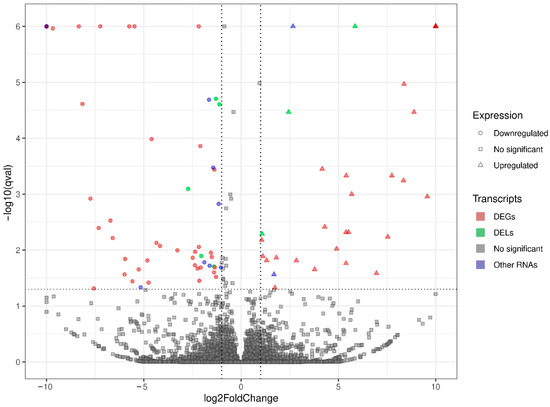
Figure 1.
Volcano plot presenting the expression changes measured by log2 fold change (log2FC) level within gene expression profiles in BPA-treated versus control experimental comparison. The difference values of each gene are presented on the X-axis, and the negative logarithmic adjusted p-value (q-value) is presented on the Y-axis. The horizontal dotted line is equal to the negative logarithmic value of q cut-off (0.05) and two vertical lines are equal to the absolute value of log2FC (1.0). Colored points represent different types of significant differentially expressed genes (DEGs), long non-coding RNAs (DELs), and other RNAs (DE-RNAs) and gray points represent non-significant genes.
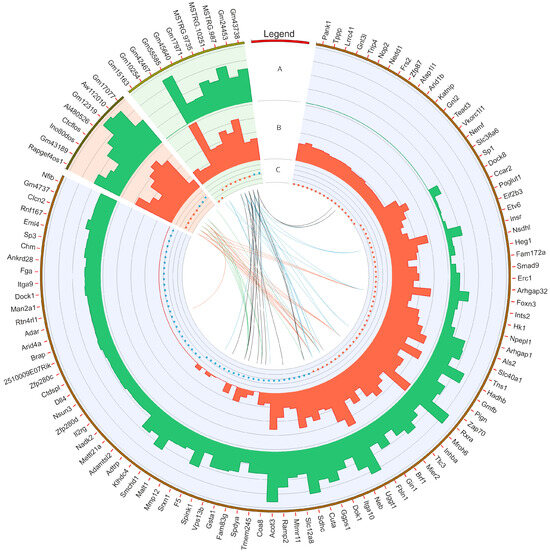
Figure 2.
Circular heatmap visualization of differentially expressed genes (DEGs), long non-coding RNAs (DELs), and other DE-RNAs in BPA-affected and control libraries. The DEGs, DELs, and other DE-RNAs were highlighted by blue, red, and green backgrounds, respectively. The first track shows the gene ID for particular transcripts/genes. In the second (A) and third tracks (B), the bars describe the summarized counts values of BPA-treated (green bars) and CTR (red bars). The fourth track (C) depicts down- (red dots) and upregulated (blue dots) transcripts. The internal links merge expression profiles of DEGs and other non-coding RNAs according to the Pearson correlation coefficient (absolute r value > 0.8). The red and blue links join positively correlated DEGs and non-coding RNAs. The black and green lines show negative correlations.
The co-expression analysis reveals 27 DEG−DEL trans-interactions. Identified events show the mediation of six DELs in the regulation of nine DEGs. The majority of DEG−DEL trans-actions (19) are positively correlated, although only 8 show a negative correlation of expression (involving DEGs: DOK1, FBLN1, SPDYA, and SPINK1, and DELs: AI480526, CTCFLOS, GM17077, GM43189, and INO80DOS). Detected trans-interactions details are summarized in Table S3.
3.3. Transcriptomic Alternative Splicing Signatures of the Liver after Oral Exposure to BPA
The applied procedure, incorporating rMATS software, allowed the detection of 900 alternative splicing events, including significant 215 DASs resulting from the comparison of BPA vs. CTR samples (Figure 3). Among all detected DASs events, 36 were classified as A5SS, 27 as A3SS, 14 as MXE, 70 as RI, and 68 as SE. The occurrence of alternative splicing significant differences between groups and information on the appearance of multiple events within a single gene are summarized in Figure 4. Calculated inclusion level differences range from −0.71 (SE) to 0.68 (MXE), both within the TPD52L1. All disclosed DASs were localized within 187 TARs, of which 90 were identified within protein-coding genes (according to the GCR mouse database), 6 lncRNA-coding regions, and 1 within another genome region. Alternative splicing events were discovered in three DEGs: DOCK1 (RI, also referred as MSTRG.23609), MSTRG.6242 (three SE events) and MSTRG.12732 (A5SS), and one DEL: MSTRG.14959 (SE). Selected events of alternative splicing occurring within SRRT, PRDM2, and CANT1 genes are visualized in Figure 5, while all identified cases are summarized in Table S4.
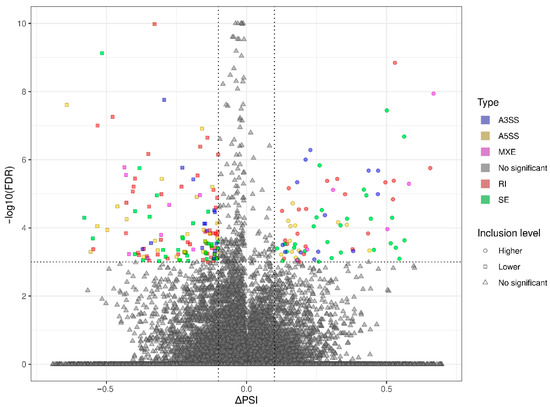
Figure 3.
Volcano plot showing the inclusion level differences (ΔPSI; X-axis) against the statistical significance (−log10FDR; Y-axis) of differential alternative splicing events (DASs) identified within genes of murine BPA-affected liver vs. control samples. The horizontal dotted line is equal to the negative logarithmic value of the FDR cut-off (0.05) and two vertical lines are equal to the absolute value of 0.1 ∆PSI. The colors of the dots indicate specific types of DAS: alternative 3′ splice site (A3SS—blue), alternative 5′ splice site (A5SS—yellow), mutually exclusive exons (MXE—purple), retained intron (RI—brown), skipping exon (SE—green), and not a significant event (gray). Uncolored figures denote ΔPSI values (circle—higher inclusion level in BPA, square—higher inclusion level in CTR, triangle—not significant).
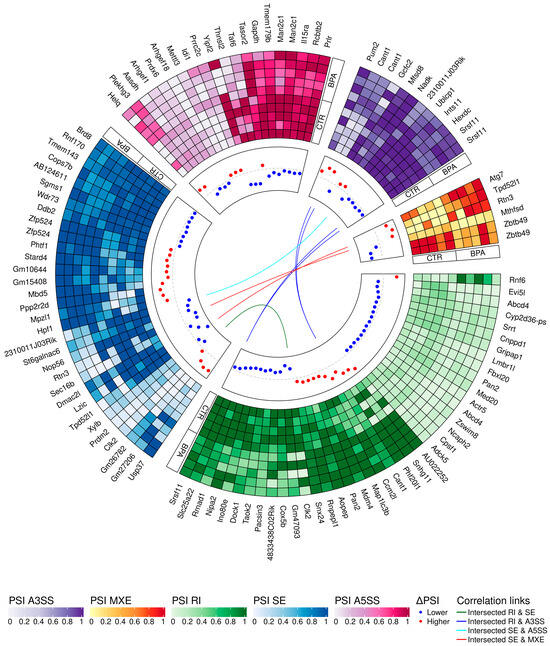
Figure 4.
Circular heatmap presents the differentially alternative splicing events (DASs) occurring after BPA treatment. The five-scale color heatmaps (outer track) represent inclusion level values (PSI) in experimental (BPA) and control (CTR) samples. The heatmap blocks present types of alternative splicing events, where purple is alternative 3′ splice site (A3SS), orange is mutually exclusive exons (MXE), green is retained intron (RI), blue is skipped exon (SE), and pink is alternative 5′ splice site (A5SS). The middle track describes the difference in the compared group, measured by inclusion level differences (red—higher inclusion level in BPA, blue—higher inclusion level in CTR). Colors inner links join common genes with more than one DAS classified in different types of alternative splicing events (green line intersects RI and SE, navy RI and A3SS, light blue SE and A5SS, and red links SE and MXE).
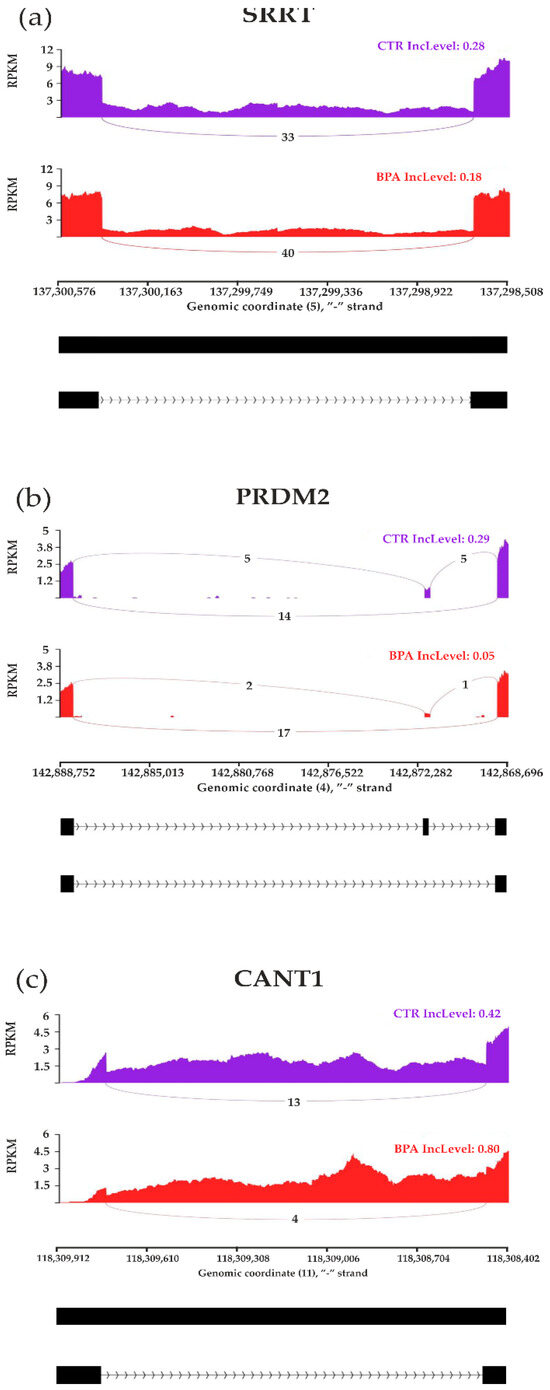
Figure 5.
Sashimi plot visualizing statistically significant differentiated alternative splicing events within (a) SRRT, (b) PRDM2, and (c) CANT1 genes. Red and purple histograms show detected coverage of RNA-seq reads on the reference genome fragments within control and BPA-treated groups. The average values of reads combining distant genome fragments (black blocks underneath the graphs) are displayed on lines symbolizing spliced regions. Abbreviations: IncLevel—inclusion level, RPKM—reads per kilobase million.
3.4. Gene Ontology Networks and Pathway Signaling Analysis of DEGs, DELs and DASs
Gene Ontology (GO) enrichment analysis reflected the functional annotations of the identified TARs engaged in liver activity after oral BPA administration. The 117/120 unique TARs were assigned to functional GO annotations grouped into eleven BP, two MF, and two CC categories. The GO gene annotation, enriched in BP ontological processes in BPA-affected livers revealed DEGs within terms such as “macromolecule modification” (GO:0043412); “protein metabolic process” (GO:0019538), and “protein modification process” (GO:0036211) (Figure 6). In the MF category, the DEGs were engaged in processes involved in “binding” (GO:0005488) and “peptide hormone binding” (GO:0017046), while the CC category grouping revealed that BPA-modulated mRNAs were involved mainly in “cytoplasm” (GO:0005737) as well as “cytosol” (GO:0005829) functioning. The comprehensive GO enrichment classification is summarized in Table S5.
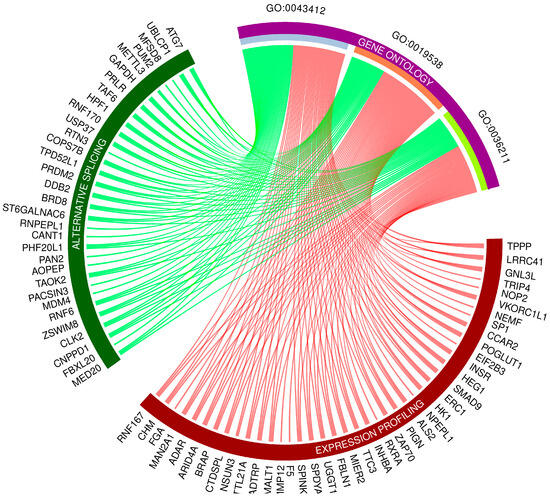
Figure 6.
Circos-plot relationship of differentially expressed genes (DEGs) and differentially alternatively spliced genes (DASs) engaged in liver function under BPA influence significantly associated with three selected Gene Ontology (GO)-enriched terms. Color links merge genes with the GO terms (GO:0043412: macromolecule modification; GO:0019538: protein metabolic process; GO:0036211: protein modification process).
3.5. Validation of the Results
The genes for verification of RNA-seq data were selected following the assessment of their expression values and read’s distribution within liver BPA-treated and CTR samples. Statistical analysis using the Pfaffl method proved the significant changes in the expression levels of seven downregulated genes (INTS2, PIGN, MROH6, NEB, GMFB, HEG1, and INHBA) compared with the control; real-time PCR analysis confirmed the expression profiles of all validated genes obtained by sequencing (Figure 7).
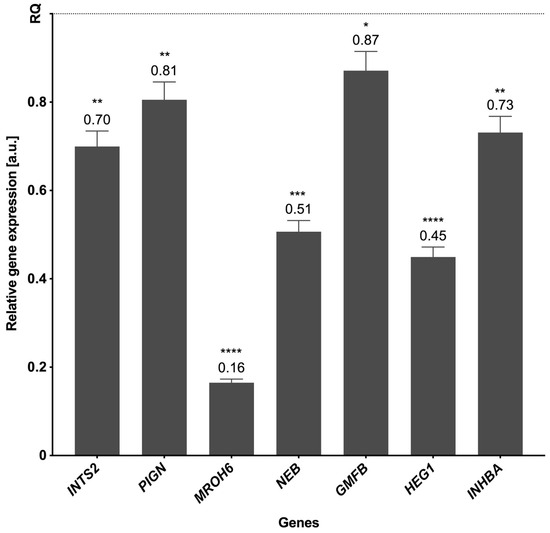
Figure 7.
The mRNA expression of selected genes was obtained through real-time PCR. The expression of endogenous control is shown as normalized to a value of 1 (REF), and the expression of validated genes indicates the changes relative to the control. The exact values of the expression are marked above the bars. p-values < 0.05 were considered statistically significant, where 0.0332 (*), 0.0021 (**), 0.0002 (***), and 0.0001 (****).
4. Discussion
BPA is regarded as an endocrine-disrupting chemical (EDC) agent. Due to its lipophilicity and occurrence in everyday products, it may be readily absorbed by human beings, leading to anomalous accumulation and malfunction of multiple organs [36]. There is growing evidence that BPA harms liver function, manifested by necrotic changes, inflammatory infiltration, and vascular congestion of hepatocytes [37]. BPA exposure is associated with increased plasma levels of aspartate aminotransferase and alanine aminotransferase, which are considered reliable indicators of hepatocyte damage [38,39]. Recent studies suggest that BPA hepatotoxicity is associated with inducing oxidative stress, mitochondrial damage, and lipid peroxidation resulting from inflammatory responses [39,40]. The development and progression of hepatic tumours have also been linked to BPA accumulation in the body. Modifications of several signalling pathways by BPA accumulation promote cancer cell growth/survival, tissue invasion, and anticancer drug resistance [41]. The results of the current study indicate that oral administration of BPA to living mice results in profound changes in the transcriptomic profiling of key molecular pathways in the liver. The applied multistep bioinformatics screening identified 120 DEGs (including 67 downregulated and 53 upregulated) in the BPA-treated livers, which have been assigned to many biological processes, including “macromolecule modification”, “protein metabolic process”, or “protein modification process”.
BPA administration has been followed by upregulation of the glutathione S-transferase alpha 1 (GSTA1) gene encoding glutathione S-transferase alpha 1-1 (GSTA1) protein, which is responsible for the cellular detoxification of endogenous and exogenous compounds in the liver, such as carcinogens, oxidative stress products, and environmental toxins including BPA [42]. Thus, overexpression of GSTA1 certainly may be caused by ongoing BPA detoxification. Remarkably, excess of GSTA1 is also a very sensitive biomarker for hepatocellular damage [43].
The most striking result emerging from the present study is that several DEGs detected in the liver of mice administered BPA in drinking water for 3 months have been previously associated with severe metabolic liver disorders or malignant tumors. For instance, there was an upregulation of the dedicator of cytokinesis 1 (DOCK1) gene in the liver followed BPA intake by mice. The overexpression of DOCK1 has been observed in various malignancies, including thyroid, bladder, and breast cancers [44,45,46,47]. Most relevant to this study, DOCK1 upregulation was associated with HCC growth and progression [48]. HCC is one of the five most common cancers in the world [49] that, in contrast to other malignancies, tends to affect only the liver without spreading elsewhere [50]. The development of HCC is multifactorial, including a history of chronic liver disease, hepatitis B virus (HBV), hepatitis C virus (HCV) infection, and alcoholism [51].
The transcriptomic analysis made in this study also predicts that exposure to BPA might have carcinogenic potential in the liver. This assumption is strengthened by several DEGs uncovered in the liver of BPA-treated animals, which include overexpression of nuclear factor I B (NFIB), NOP2/Sun RNA methyltransferase 3 (NSUN3), and serine peptidase inhibitor Kazal-type 1 (SPINK1) genes, while transcription of the tubulin polymerization-promoting protein (TPPP), inhibin subunit beta A (INHBA), heart development protein with EGF-like domains 1 (HEG1), and integrator complex subunit 2 (INTS2) genes were downregulated. It is known that NFIB is an oncogene, and, according to recent reports, its upregulation has been linked with the growth and progression of several types of cancer [51], including HCC [52]. A concerning overexpression is that of the NSUN3 gene, as it has been involved in the promotion of cancer cell invasion and metastasis by favoring the synthesis of proteins participating in the mitochondrial respiratory chain [53]. Excessive NSUN3 transcription has been positively correlated with poor prognosis in patients with HCC [53]. Likewise, overexpression of SPINK1 (also known as tumor-associated trypsin inhibitor, TATI) has been linked to the expansion of many malignant tumors, including the HCC, as it favors cancer cells proliferation, metastasis, and anticancer drug resistance [54,55,56,57]. Also, the protein encoded by the TPPP gene plays a role in cancerogenesis [58], as it controls normal cell proliferation by modulating microtubule dynamics [59]. Therefore, BPA-induced downregulation of TPPP gene transcription may contribute to abnormal hepatic cell proliferation and poor prognosis of patients with HCC, as previously demonstrated [60]. The downregulated INHBA encodes inhibin protein belonging to the TGFβ superfamily, which controls cell proliferation, differentiation, apoptosis, and inflammation in many cell types and organs including the liver, and recently, it has been found that INHBA is strongly engaged in hepatocarcinogenesis in rats [61,62,63]. The under-expressed HEG1 encodes protein participating in the cancer metastasis process [64], while the protein encoded by the downregulated INTS2 belongs to a key regulator of RNA polymerase II-mediated transcription integrator complex. The functional impairment of this complex has been revealed in several types of tumors [65,66].
It is worth mentioning that we also examined differential alternative splicing (DAS) gene events in the livers of healthy controls and BPA-treated mice. Our findings show that some identified DAS gene events, including helicase POLQ-like (HELQ), StAR-related lipid transfer domain containing 4 (STARD4), cytochrome C oxidase subunit 5B (COX5B), serrate, RNA effector molecule (SRRT), positive regulatory/Su(var)3-9, enhancer-of-zeste and trithorax domain 2 (PRDM2), and calcium-activated nucleotidase 1 (CANT1) were previously associated with cancerogenesis. HELQ is critical for DNA repair, thus, it is regarded as an important genome caretaker and has been identified as a potential target for anticancer therapies. Moreover, emerging evidence reveals that HELQ alterations leads to abnormalities in its protective action, which are often found in malignancies, such as squamous cell carcinoma, gastric cancer, and HCC [67]. STARD4 gene transcription is upregulated in patients suffering from HCC, in which its levels correlate with poor prognosis. Presumably, STARD4 transcriptional variations in HCC significantly affect cholesterol intracellular metabolism and transport [68]. The COX5B gene is highly expressed in HCC, thus, confirming its putative role as a growth-promoting agent in this type of cancer. Upregulation of COX5B gene transcripts in hepatoma cells is also associated with an unfavorable postoperative prognosis of HCC, concurring with increased proliferation and migration of this tumor type [69]. The SRRT gene (also known as an arsenite-resistance protein 2 gene; ARS2) is critical in mammalian cell proliferation. Knockdown of this gene slows all stages of the cell cycle, whereas its overexpression promotes HCC and has a prognostic value in this type of cancer [70]. Another alternatively spliced gene revealed in our study, PRDM2, is a tumor suppressor gene, downregulated in various cancers. PRDM2 belongs to HCC-associated genes and it has been revealed that its hypermethylation significantly increases the risk of HCC [71]. CANT1 is also known to be overexpressed in several malignancies and its alternative splicing transcript variants in tumors are considered important indicators of cancer progression [72]. Knockdown of this gene causes suppression of cell proliferation, migration, and invasion, thus, it has been proposed as a potential therapeutic target for HCC [73].
Furthermore, some uncovered DAS gene events were localized within transcripts involved in autophagy, such as the microtubule-associated protein 1 light chain 3 beta (MAP1LC3B; a gene known to be an autophagy marker strongly expressed in HCC cells) [74] and the autophagy-related 7 gene (ATG7; encoding a protein working in the autophagy pathway as a ubiquitin-activating enzyme) [75]. Given that BPA intake has been positively linked to oxidative stress and ROS formation [11] and the latter processes initiate autophagy designed to remove unnecessary or damaged cellular components [76], alternative splicing of genes involved in autophagy may result in the accumulation of dysfunctional proteins, leading to organ failure and cancer development [76].
Several studies have indicated the linkage between BPA tissue contamination and the incidence of non-alcoholic fatty liver disease (NAFLD) [20,77]. NAFLD is the major cause of chronic liver disease among children and adults and the most common cause of liver transplantation [78]. The NAFLD pathological spectrum goes from simple steatosis to steatohepatitis, which may progress to hepatic cirrhosis and HCC [79]. NAFLD is strongly associated with obesity, insulin resistance, and type 2 diabetes mellitus [80]. Excessive caloric intake leads to increased serum levels of free fatty acids (FFA) and adipocyte resistance to insulin. Insulin resistance contributes to NAFLD by damaging the insulin receptor signaling, causing the defective inhibition of FFA release from fat cells. Therefore, insulin resistance and excess FFA are thought to be a vicious circle in the development of NAFLD [81,82]. The RNA-seq analysis performed in this study shows that oral exposure to BPA identified several DEGs in the liver contributing to NAFLD development. These include the downregulation of the insulin receptor (INSR), retinoid X receptor alpha (RXRA),pantothenate kinase 1 (PANK1), and maestro heat-like repeat family member 6 (MROH6). INSR is a receptor that upon binding to insulin regulates the management of proteins, lipids, and carbohydrates, including glucose absorption and cellular uptake [81]. Deficient INSR gene processing may impair insulin biological responses, ultimately causing insulin resistance and glucose intolerance [83,84]. On the other hand, both RXRA and PANK1 are involved in signaling pathways controlling the metabolism of lipids by hepatocytes [85,86], while downregulation may contribute to serious liver disorders, such as NAFLD. Moreover, PANK1 is a negative regulator of the Wnt/β-catenin signaling cascade involved in the pathogenesis of HCC. PANK1 has been pointed out as a potential therapeutic target for HCC, given that downregulation of this gene transcription promotes the growth and invasiveness of HCC cells [87]. The alterations of the MROH6 have been recently revealed in pre-teenage children suffering from NAFLD [88].
5. Conclusions
To the best of our knowledge, this is the first study addressing the impact of oral intake of BPA on gene transcription changes in the liver to predict the molecular mechanisms underlying hepatic toxicity and potential carcinogenicity of this widespread environmental chemical contaminant. Data from our comprehensive transcriptomic analysis together with diverse sets of results from the literature confirm that exposure to BPA exhibits a carcinogenic potential, as well as contributing to the development of other severe metabolic liver diseases, including NAFLD. The authors are aware that exposure to BPA starting at a younger age of mice would be more reflective of real-world exposure scenarios and that post-weaning animals are much more sensitive to the effects of toxic compounds, however, the aim of the study was to evaluate the influence of BPA on the adult, no-longer-developing organism. Moreover, it must be emphasized that young cells have greater regenerative capabilities so, in order to better understand the hepatotoxic effects of this xenoestrogen after a long-time exposure, the authors decided to study post-maturation organisms. Of course transcriptomics prediction of HCC and NAFLD from BPA exposure may not be of clinical relevance, however, in our opinion, it should constitute a legitimate ground for further reducing its usage, especially in food containers.
Supplementary Materials
The following supporting information can be downloaded at: https://www.mdpi.com/article/10.3390/cancers15205014/s1, Table S1: The list of primers applied during real-time PCR procedure. Table S2: Detailed results of DEGs, DELs, and other DE-RNAs expression patterns induced by BPA treatment in mouse liver; Table S3: Results of DEGs–DELs and DEGs–other DE-RNAs trans-interactions; Table S4: Detailed results of BPA-modulated DASs analysis in mouse liver; Table S5: Results of GO, Reactome, and TRANSFAC functional analysis of DEGs and genes incorporating DASs induced by BPA treatment in mouse liver.
Author Contributions
Conceptualization: M.M., E.L., K.M., S.G. and M.W.; methodology: M.W., M.M., E.L., K.M., M.A.M., Ł.P. and S.G.; software: Ł.P., M.A.M. and K.G.M.; validation: E.Ł.-B.; formal analysis: Ł.P., M.A.M. and K.G.M.; tissue collection: M.W., E.L., M.M., K.M. and S.G.; investigation: M.W., E.L., A.L. and M.M.; writing—original draft preparation: M.W., E.L. and M.M.; writing—review and editing: M.W., E.L., A.L., M.A.M., Ł.P. and M.M.; visualization: E.L., M.A.M., K.G.M. and M.M.; supervision: E.L. and M.M.; project administration: E.L., P.C.-d.-S. and M.M.; funding acquisition: M.W., E.L., K.M. and M.M. All authors have read and agreed to the published version of the manuscript.
Funding
The project was financially supported by the statutory Fund of the School of Medicine, Collegium Medicum (61.610.008–110), University of Warmia and Mazury in Olsztyn and National Science Centre in Poland (grant no. 2018/31/N/NZ7/01252). PCS acknowledges the financial support from the Portuguese Foundation for Science and Technology (FCT projects: UIDB/04308/2020 and UIDP/04308/2020) via MedInUP.
Institutional Review Board Statement
The study was conducted according to the guidelines of the local ethics committee for animal experimentation in Olsztyn, Poland (affiliated with the National Ethics Committee for Animal Experimentation, Polish Ministry of Science and Higher Education; decision No. 46/2019).
Informed Consent Statement
Not applicable.
Data Availability Statement
The RNA-seq data have been submitted (https://www.ebi.ac.uk/ena, accessed date: 14 August 2023) to the European Nucleotide Archive under accession no. PRJEB (https://www.ebi.ac.uk/ena/browser/view/PRJEB65086, accessed date: 1 October 2023).
Conflicts of Interest
The authors declare no conflict of interest.
References
- Michałowicz, J. Bisphenol A—Sources, Toxicity and Biotransformation. Environ. Toxicol. Pharmacol. 2014, 37, 738–758. [Google Scholar] [CrossRef] [PubMed]
- Rubin, B.S. Bisphenol A: An Endocrine Disruptor with Widespread Exposure and Multiple Effects. J. Steroid Biochem. Mol. Biol. 2011, 127, 27–34. [Google Scholar] [CrossRef] [PubMed]
- Wang, K.; Zhao, Z.; Ji, W. Bisphenol A Induces Apoptosis, Oxidative Stress and Inflammatory Response in Colon and Liver of Mice in a Mitochondria-Dependent Manner. Biomed. Pharmacother. 2019, 117, 109182. [Google Scholar] [CrossRef] [PubMed]
- Huang, Y.Q.; Wong, C.K.C.; Zheng, J.S.; Bouwman, H.; Barra, R.; Wahlström, B.; Neretin, L.; Wong, M.H. Bisphenol A (BPA) in China: A Review of Sources, Environmental Levels, and Potential Human Health Impacts. Environ. Int. 2012, 42, 91–99. [Google Scholar] [CrossRef] [PubMed]
- Liao, C.; Liu, F.; Kannan, K. Bisphenol S, a New Bisphenol Analogue, in Paper Products and Currency Bills and Its Association with Bisphenol A Residues. Environ. Sci. Technol. 2012, 46, 6515–6522. [Google Scholar] [CrossRef]
- EU Commission Regulation (EU) 2016/2235 of 12 December 2016 Amending Annex XVII to Regulation (EC) No 1907/2006 of the European Parliament and of the Council Concerning the Registration, Evaluation, Authorisation and Restriction of Chemicals (REACH) as Regar. Off. J. Eur. Union 2016, 2001, 20–30.
- Hanaoka, T.; Kawamura, N.; Hara, K. Urinary Bisphenol A and Plasma Hormone Concentrations in Male Workers Exposed to Bisphenol A Diglycidyl Ether and Mixed Organic Solvents. Occup. Environ. Med. 2002, 59, 625–628. [Google Scholar] [CrossRef]
- Konieczna, A.R.A.; Rachoń, D. Health Risk of Exposure to Bisphenol A (BPA). Rocz. Państwowego Zakładu Hig. 2015, 66, 5–11. [Google Scholar]
- Noureddine El Moussawi, S.; Karam, R.; Cladière, M.; Chébib, H.; Ouaini, R.; Camel, V. Effect of Sterilisation and Storage Conditions on the Migration of Bisphenol A from Tinplate Cans of the Lebanese Market. Food Addit. Contam. Part A 2018, 35, 377–386. [Google Scholar] [CrossRef]
- Besaratinia, A. The State of Research and Weight of Evidence on the Epigenetic Effects of Bisphenol A. Int. J. Mol. Sci. 2023, 24, 7951. [Google Scholar] [CrossRef]
- Shmarakov, I.O.; Borschovetska, V.L.; Blaner, W.S. Hepatic Detoxification of Bisphenol A Is Retinoid-Dependent. Toxicol. Sci. 2017, 157, kfx022. [Google Scholar] [CrossRef] [PubMed]
- Hanioka, N.; Naito, T.; Narimatsu, S. Human UDP-Glucuronosyltransferase Isoforms Involved in Bisphenol A Glucuronidation. Chemosphere 2008, 74, 33–36. [Google Scholar] [CrossRef] [PubMed]
- Andra, S.S.; Austin, C.; Yang, J.; Patel, D.; Arora, M.; Abstract, G. Recent Advances in Simultaneous Analysis of Bisphenol A and Its Conjugates in Human Matrices: Exposure Biomarker Perspectives HHS Public Access. Sci. Total Environ. 2016, 572, 770–781. [Google Scholar] [CrossRef] [PubMed]
- Landolfi, A.; Troisi, J.; Savanelli, M.C.; Vitale, C.; Barone, P.; Amboni, M. Bisphenol A Glucuronidation in Patients with Parkinson’s Disease. Neurotoxicology 2017, 63, 90–96. [Google Scholar] [CrossRef] [PubMed]
- Atkinson, A.; Roy, D. In Vivo DNA Adduct Formation by Bisphenol A. Environ. Mol. Mutagen. 1995, 26, 60–66. [Google Scholar] [CrossRef]
- Kazemi, S.; Mousavi Kani, S.N.; Rezazadeh, L.; Pouramir, M.; Ghasemi-Kasman, M.; Moghadamnia, A.A. Low Dose Administration of Bisphenol A Induces Liver Toxicity in Adult Rats. Biochem. Biophys. Res. Commun. 2017, 494, 107–112. [Google Scholar] [CrossRef]
- Hassan, Z.K.; Elobeid, M.A.; Virk, P.; Omer, S.A.; ElAmin, M.; Daghestani, M.H.; AlOlayan, E.M. Bisphenol A Induces Hepatotoxicity through Oxidative Stress in Rat Model. Oxid. Med. Cell Longev. 2012, 2012, 194829. [Google Scholar] [CrossRef]
- Ma, L.; Hu, J.; Li, J.; Yang, Y.; Zhang, L.; Zou, L.; Gao, R.; Peng, C.; Wang, Y.; Luo, T.; et al. Bisphenol A Promotes Hyperuricemia via Activating Xanthine Oxidase. FASEB J. 2018, 32, 1007–1016. [Google Scholar] [CrossRef]
- Lee, S.; Min, H.; Ha, J.; Kim, B.; Choi, M.; Kim, S. Dysregulation of the MiRNA Biogenesis Components DICER1, DROSHA, DGCR8 and AGO2 in Clear Cell Renal Cell Carcinoma in Both a Korean Cohort and the Cancer Genome Atlas Kidney Clear Cell Carcinoma Cohort. Oncol. Lett. 2019, 18, 4337. [Google Scholar] [CrossRef]
- Dallio, M.; Diano, N.; Masarone, M.; Gravina, A.G.; Patanè, V.; Romeo, M.; Di Sarno, R.; Errico, S.; Nicolucci, C.; Abenavoli, L.; et al. Chemical Effect of Bisphenol A on Non-Alcoholic Fatty Liver Disease. Int. J. Environ. Res. Public Health 2019, 16, 3134. [Google Scholar] [CrossRef]
- Ma, Y.; Liu, H.; Wu, J.; Yuan, L.; Wang, Y.; Du, X.; Wang, R.; Marwa, P.W.; Petlulu, P.; Chen, X.; et al. The Adverse Health Effects of Bisphenol A and Related Toxicity Mechanisms. Environ. Res. 2019, 176, 108575. [Google Scholar] [CrossRef] [PubMed]
- Choi, C.-W.; Jeong, J.-Y.; Hwang, M.-S.; Jung, K.-K.; Lee, K.-H.; Lee, H.-M. Establishment of the Korean Tolerable Daily Intake of Bisphenol A Based on Risk Assessments by an Expert Committee. Toxicol. Res. 2010, 26, 285–291. [Google Scholar] [CrossRef] [PubMed]
- Tyl, R.W. Three-Generation Reproductive Toxicity Study of Dietary Bisphenol A in CD Sprague-Dawley Rats. Toxicol. Sci. 2002, 68, 121–146. [Google Scholar] [CrossRef] [PubMed]
- Makowska, K.; Lepiarczyk, E.; Gonkowski, S. The Comparison of the Influence of Bisphenol A (BPA) and Its Analogue Bisphenol S (BPS) on the Enteric Nervous System of the Distal Colon in Mice. Nutrients 2022, 15, 200. [Google Scholar] [CrossRef]
- Andrews, S. FastQC: A Quality Control Tool for High Throughput Sequence Data. Babraham Bioinform. 2010. Available online: www.bioinformatics.babraham.ac.uk/projects/fastqc (accessed on 23 August 2023).
- Bolger, A.M.; Lohse, M.; Usadel, B. Trimmomatic: A Flexible Trimmer for Illumina Sequence Data. Bioinformatics 2014, 30, 2114–2120. [Google Scholar] [CrossRef]
- Dobin, A.; Davis, C.A.; Schlesinger, F.; Drenkow, J.; Zaleski, C.; Jha, S.; Batut, P.; Chaisson, M.; Gingeras, T.R. Sequence Analysis STAR: Ultrafast Universal RNA-Seq Aligner. Bioinformatics 2013, 29, 15–21. [Google Scholar] [CrossRef]
- Pertea, M.; Pertea, G.M.; Antonescu, C.M.; Chang, T.-C.; Mendell, J.T.; Salzberg, S.L. StringTie Enables Improved Reconstruction of a Transcriptome from RNA-Seq Reads. Nat. Biotechnol. 2015, 33, 290–295. [Google Scholar] [CrossRef]
- Love, M.I.; Huber, W.; Anders, S. Moderated Estimation of Fold Change and Dispersion for RNA-Seq Data with DESeq2. Genome Biol. 2014, 15, 550. [Google Scholar] [CrossRef]
- Shen, S.; Park, J.W.; Lu, Z.-X.; Lin, L.; Henry, M.D.; Wu, Y.N.; Zhou, Q.; Xing, Y. RMATS: Robust and Flexible Detection of Differential Alternative Splicing from Replicate RNA-Seq Data. Proc. Natl. Acad. Sci. USA 2014, 111, E5593–E5601. [Google Scholar] [CrossRef]
- Ashburner, M.; Ball, C.A.; Blake, J.A.; Botstein, D.; Butler, H.; Cherry, J.M.; Davis, A.P.; Dolinski, K.; Dwight, S.S.; Eppig, J.T.; et al. Gene Ontology: Tool for the Unification of Biology. Nat. Genet. 2000, 25, 25–29. [Google Scholar] [CrossRef]
- Carbon, S.; Dietze, H.; Lewis, S.E.; Mungall, C.J.; Munoz-Torres, M.C.; Basu, S.; Chisholm, R.L.; Dodson, R.J.; Fey, P.; Thomas, P.D.; et al. Expansion of the Gene Ontology Knowledgebase and Resources: The Gene Ontology Consortium. Nucleic Acids Res. 2017, 45, D331–D338. [Google Scholar] [CrossRef]
- Reimand, J.; Arak, T.; Adler, P.; Kolberg, L.; Reisberg, S.; Peterson, H.; Vilo, J. G:Profiler—A Web Server for Functional Interpretation of Gene Lists. Nucleic Acids Res. 2016, 44, W83–W89. [Google Scholar] [CrossRef] [PubMed]
- Untergasser, A.; Cutcutache, I.; Koressaar, T.; Ye, J.; Faircloth, B.C.; Remm, M.; Rozen, S.G. Primer3--New Capabilities and Interfaces. Nucleic Acids Res. 2012, 40, e115. [Google Scholar] [CrossRef] [PubMed]
- Pfaffl, M.W. A New Mathematical Model for Relative Quantification in Real-Time RT-PCR. Nucleic Acids Res. 2001, 29, e45. [Google Scholar] [CrossRef]
- Kumar, M.; Sarma, D.K.; Shubham, S.; Kumawat, M.; Verma, V.; Prakash, A.; Tiwari, R. Environmental Endocrine-Disrupting Chemical Exposure: Role in Non-Communicable Diseases. Front. Public. Health 2020, 8, 553850. [Google Scholar] [CrossRef]
- Abdulhameed, A.-S.A.R.; Lim, V.; Bahari, H.; Khoo, B.Y.; Abdullah, M.N.H.; Tan, J.J.; Yong, Y.K. Adverse Effects of Bisphenol A on the Liver and Its Underlying Mechanisms: Evidence from In Vivo and In Vitro Studies. Biomed. Res. Int. 2022, 2022, 8227314. [Google Scholar] [CrossRef]
- Zou, Y.; Zhong, L.; Hu, C.; Sheng, G. Association between the Alanine Aminotransferase/Aspartate Aminotransferase Ratio and New-Onset Non-Alcoholic Fatty Liver Disease in a Nonobese Chinese Population: A Population-Based Longitudinal Study. Lipids Health Dis. 2020, 19, 245. [Google Scholar] [CrossRef]
- Elswefy, S.E.-S.; Abdallah, F.R.; Atteia, H.H.; Wahba, A.S.; Hasan, R.A. Inflammation, Oxidative Stress and Apoptosis Cascade Implications in Bisphenol A-Induced Liver Fibrosis in Male Rats. Int. J. Exp. Pathol. 2016, 97, 369–379. [Google Scholar] [CrossRef]
- Bindhumol, V.; Chitra, K.C.; Mathur, P.P. Bisphenol A Induces Reactive Oxygen Species Generation in the Liver of Male Rats. Toxicology 2003, 188, 117–124. [Google Scholar] [CrossRef]
- Murata, M.; Kang, J.H. Bisphenol A (BPA) and Cell Signaling Pathways. Biotechnol. Adv. 2018, 36, 311–327. [Google Scholar] [CrossRef]
- Deng1, Q.; He1, B.; Pan1, Y.; Sun2, H.; Liu1, X.; Chen2, J.; Ying3, H.; Lin1, K.; Peng3, H.; Wang1, S. Polymorphisms of GSTA1 Contribute to Elevated Cancer Risk: Evidence from 15 Studies. J. Buon 2015, 20, 287–295. [Google Scholar]
- Van Runnard Heimel, P.J.; Kavelaars, A.; Heijnen, C.J.; Peters, W.H.M.; Huisjes, A.J.M.; Franx, A.; Bruinse, H.W. HELLP Syndrome Is Associated with an Increased Inflammatory Response, Which May Be Inhibited by Administration of Prednisolone. Hypertens. Pregnancy 2008, 27, 253–265. [Google Scholar] [CrossRef] [PubMed]
- Chiang, S.K.; Chang, W.C.; Chen, S.E.; Chang, L.C. DOCK1 Regulates Growth and Motility through the RRP1B-Claudin-1 Pathway in Claudin-Low Breast Cancer Cells. Cancers 2019, 11, 1762. [Google Scholar] [CrossRef]
- Cui, W.; Xue, J. Circular RNA DOCK1 Downregulates MicroRNA-124 to Induce the Growth of Human Thyroid Cancer Cell Lines. BioFactors 2020, 46, 591–599. [Google Scholar] [CrossRef] [PubMed]
- Liu, P.; Li, X.; Guo, X.; Chen, J.; Li, C.; Chen, M.; Liu, L.; Zhang, X.; Zu, X. Circular RNA DOCK1 Promotes Bladder Carcinoma Progression via Modulating CircDOCK1/Hsa-miR-132-3p/Sox5 Signalling Pathway. Cell Prolif. 2019, 52, e12614. [Google Scholar] [CrossRef]
- Wang, L.; Wei, Y.; Yan, Y.; Wang, H.; Yang, J.; Zheng, Z.; Zha, J.; Bo, P.; Tang, Y.; Guo, X.; et al. CircDOCK1 Suppresses Cell Apoptosis via Inhibition of MiR-196a-5p by Targeting BIRC3 in OSCC. Oncol. Rep. 2018, 39, 951–966. [Google Scholar] [CrossRef]
- Lu, Y.; Zhang, J.; Wu, Y. Interference with CircRNA DOCK1 Inhibits Hepatocellular Carcinoma Cell Proliferation, Invasion and Migration by Regulating the MiR-654-5p/SMAD2 Axis. Mol. Med. Rep. 2021, 24, 1–8. [Google Scholar] [CrossRef]
- Zhou, L.; Wang, Q.-L.; Mao, L.-H.; Chen, S.-Y.; Yang, Z.-H.; Liu, X.; Gao, Y.-H.; Li, X.-Q.; Zhou, Z.-H.; He, S. Hepatocyte-Specific Knock-Out of Nfib Aggravates Hepatocellular Tumorigenesis via Enhancing Urea Cycle. Front. Mol. Biosci. 2022, 9, 1–14. [Google Scholar] [CrossRef]
- Inokawa, Y.; Sonohara, F.; Kanda, M.; Hayashi, M.; Nishikawa, Y.; Sugimoto, H.; Kodera, Y.; Nomoto, S. Correlation Between Poor Prognosis and Lower TPPP Gene Expression in Hepatocellular Carcinoma. Anticancer Res. 2016, 36, 4639–4646. [Google Scholar] [CrossRef]
- Yu, W.; Dai, Y. LncRNA LOXL1-AS1 Promotes Liver Cancer Cell Proliferation and Migration by Regulating the MiR-377-3p/NFIB Axis. Oncol. Lett. 2021, 22, 1–11. [Google Scholar] [CrossRef]
- Zhang, Q.; Cao, L.Y.; Cheng, S.J.; Zhang, A.M.; Jin, X.S.; Li, Y. P53-Induced MicroRNA-1246 Inhibits the Cell Growth of Human Hepatocellular Carcinoma Cells by Targeting NFIB. Oncol. Rep. 2015, 33, 1335–1341. [Google Scholar] [CrossRef] [PubMed]
- Zhu, J.; Kuang, J.; Yang, Y.; Zhang, L.; Leng, B.; She, R.; Zou, L. A Prognostic Model Based on NSUN3 Was Established to Evaluate the Prognosis and Response to Immunotherapy in Liver Hepatocellular Carcinoma. Mediat. Inflamm. 2023, 2023, 6645476. [Google Scholar] [CrossRef] [PubMed]
- Chen, Y.T.; Tsao, S.C.; Yuan, S.S.F.; Tsai, H.P.; Chai, C.Y. Serine Protease Inhibitor Kazal Type 1 (SPINK1) Promotes Proliferation of Colorectal Cancer Through the Epidermal Growth Factor as a Prognostic Marker. Pathol. Oncol. Res. 2015, 21, 1201–1208. [Google Scholar] [CrossRef] [PubMed]
- Huang, K.; Xie, W.; Wang, S.; Li, Q.; Wei, X.; Chen, B.; Hua, Y.; Li, S.; Peng, B.; Shen, S. High SPINK1 Expression Predicts Poor Prognosis and Promotes Cell Proliferation and Metastasis of Hepatocellular Carcinoma. J. Investig. Surg. 2021, 34, 1011–1020. [Google Scholar] [CrossRef]
- Wang, F.; Liu, H.; Bai, Y.; Li, H.; Wang, Z.; Xu, X. Performance of SPINK1 and SPINK1-Based Diagnostic Model in Detection of Hepatocellular Carcinoma. J. Clin. Lab. Anal. 2021, 35, e24025. [Google Scholar] [CrossRef]
- Lin, T.C. Functional Roles of Spink1 in Cancers. Int. J. Mol. Sci. 2021, 22, 3814. [Google Scholar] [CrossRef]
- Chang, Y.-H.; Lin, P.-H.; Chen, C.-C.; Weng, W.-H.; Yu, K.-J.; Liu, C.-Y.; Hsieh, C.-H.; Chang, T.-H.; Shao, I.-H.; Kan, H.-C.; et al. Gain of TPPP as a Predictor of Progression in Patients with Bladder Cancer. Exp. Ther. Med. 2021, 22, 1204. [Google Scholar] [CrossRef]
- Schofield, A.V.; Gamell, C.; Suryadinata, R.; Sarcevic, B.; Bernard, O. Tubulin Polymerization Promoting Protein 1 (Tppp1) Phosphorylation by Rho-Associated Coiled-Coil Kinase (Rock) and Cyclin-Dependent Kinase 1 (Cdk1) Inhibits Microtubule Dynamics to Increase Cell Proliferation*. J. Biol. Chem. 2013, 288, 7907–7917. [Google Scholar] [CrossRef]
- Safran, M.; Dalah, I.; Alexander, J.; Rosen, N.; Iny Stein, T.; Shmoish, M.; Nativ, N.; Bahir, I.; Doniger, T.; Krug, H.; et al. GeneCards Version 3: The Human Gene Integrator. Database 2010, 2010, baq020. [Google Scholar] [CrossRef]
- Schulte-Hermann, R.; Bursch, W.; Löw-Baselli, A.; Wagner, A.; Grasl-Kraupp, B. Apoptosis in the Liver and Its Role in Hepatocarcinogenesis. Cell Biol. Toxicol. 1997, 13, 339–348. [Google Scholar] [CrossRef]
- Rodgarkia-Dara, C.; Vejda, S.; Erlach, N.; Losert, A.; Bursch, W.; Berger, W.; Schulte-Hermann, R.; Grusch, M. The Activin Axis in Liver Biology and Disease. Mutat. Res./Rev. Mutat. Res. 2006, 613, 123–137. [Google Scholar] [CrossRef] [PubMed]
- Frost, K.; Seir, K.; Lackner, A.; Grusch, M.; Grasl-Kraupp, B.; Schulte-Hermann, R.; Rodgarkia-Dara, C. Inhibin/Activin Expression in Human and Rodent Liver: Subunits α and Βb as New Players in Human Hepatocellular Carcinoma. Br. J. Cancer 2011, 104, 1303–1312. [Google Scholar] [CrossRef] [PubMed]
- Dewdney, B.; Hebbard, L. A Novel Function for HEG1 in Promoting Metastasis in Hepatocellular Carcinoma. Clin. Sci. 2019, 133, 2019–2022. [Google Scholar] [CrossRef]
- Federico, A.; Rienzo, M.; Abbondanza, C.; Costa, V.; Ciccodicola, A.; Casamassimi, A. Pan-Cancer Mutational and Transcriptional Analysis of the Integrator Complex. Int. J. Mol. Sci. 2017, 18, 936. [Google Scholar] [CrossRef]
- Lim, B.; Kim, C.; Kim, J.-H.; Kwon, W.S.; Lee, W.S.; Kim, J.M.; Park, J.Y.; Kim, H.S.; Park, K.H.; Kim, T.S.; et al. Genetic Alterations and Their Clinical Implications in Gastric Cancer Peritoneal Carcinomatosis Revealed by Whole-Exome Sequencing of Malignant Ascites. Oncotarget 2016, 7, 8055–8066. [Google Scholar] [CrossRef]
- Han, X.; Zhao, L.; Li, X. HELQ in Cancer and Reproduction Minireview. Neoplasma 2016, 63, 607–616. [Google Scholar] [CrossRef] [PubMed]
- Yue, X.; Kong, Y.; Zhang, Y.; Sun, M.; Liu, S.; Wu, Z.; Gao, L.; Liang, X.; Ma, C. SREBF2–STARD4 Axis Confers Sorafenib Resistance in Hepatocellular Carcinoma by Regulating Mitochondrial Cholesterol Homeostasis. Cancer Sci. 2023, 114, 477–489. [Google Scholar] [CrossRef]
- Chu, Y.D.; Lin, W.R.; Lin, Y.H.; Kuo, W.H.; Tseng, C.J.; Lim, S.N.; Huang, Y.L.; Huang, S.C.; Wu, T.J.; Lin, K.H.; et al. Cox5b-Mediated Bioenergetic Alteration Regulates Tumor Growth and Migration by Modulating Ampk-Uhmk1-Erk Cascade in Hepatoma. Cancers 2020, 12, 1646. [Google Scholar] [CrossRef]
- He, Q.; Huang, Y.; Cai, L.; Zhang, S.; Zhang, C. Expression and Prognostic Value of Ars2 in Hepatocellular Carcinoma. Int. J. Clin. Oncol. 2014, 19, 880–888. [Google Scholar] [CrossRef]
- Tanadi, C.; Bambang, A.; Wendi, I.P.; Sidharta, V.M.; Hananta, L.; Sumarpo, A. The Predictive Value of PRDM2 in Solid Tumor: A Systematic Review and Meta-Analysis. PeerJ 2020, 8, e8826. [Google Scholar] [CrossRef]
- Yao, Q.; Yu, Y.; Wang, Z.; Zhang, M.; Ma, J.; Wu, Y.; Zheng, Q.; Li, J. CANT1 Serves as a Potential Prognostic Factor for Lung Adenocarcinoma and Promotes Cell Proliferation and Invasion In Vitro. BMC Cancer 2022, 22, 117. [Google Scholar] [CrossRef] [PubMed]
- Yang, C.; Huang, X.; Li, Y.; Chen, J.; Lv, Y.; Dai, S. Prognosis and Personalized Treatment Prediction in TP53 -Mutant Hepatocellular Carcinoma: An in Silico Strategy towards Precision Oncology. Brief. Bioinform. 2021, 22, bbaa164. [Google Scholar] [CrossRef] [PubMed]
- Qin, J.; Li, Q.; Zeng, Z.; Wu, P.; Jiang, Y.; Luo, T.; Ji, X.; Zhang, Q.; Hao, Y.; Chen, L. Increased Expression of G9A Contributes to Carcinogenesis and Indicates Poor Prognosis in Hepatocellular Carcinoma. Oncol. Lett. 2018, 15, 9757–9765. [Google Scholar] [CrossRef] [PubMed]
- Yang, Y.; Karsli-Uzunbas, G.; Poillet-Perez, L.; Sawant, A.; Hu, Z.S.; Zhao, Y.; Moore, D.; Hu, W.; White, E. Autophagy Promotes Mammalian Survival by Suppressing Oxidative Stress and P53. Genes. Dev. 2020, 34, 688–700. [Google Scholar] [CrossRef] [PubMed]
- Taucher, E.; Mykoliuk, I.; Fediuk, M.; Smolle-Juettner, F.-M. Autophagy, Oxidative Stress and Cancer Development. Cancers 2022, 14, 1637. [Google Scholar] [CrossRef]
- Cimmino, I.; Fiory, F.; Perruolo, G.; Miele, C.; Beguinot, F.; Formisano, P.; Oriente, F. Potential Mechanisms of Bisphenol A (BPA) Contributing to Human Disease. Int. J. Mol. Sci. 2020, 21, 5761. [Google Scholar] [CrossRef]
- Burra, P.; Becchetti, C.; Germani, G. NAFLD and Liver Transplantation: Disease Burden, Current Management and Future Challenges. JHEP Rep. 2020, 2, 100192. [Google Scholar] [CrossRef]
- Nicolucci, C.; Errico, S.; Federico, A.; Dallio, M.; Loguercio, C.; Diano, N. Human Exposure to Bisphenol A and Liver Health Status: Quantification of Urinary and Circulating Levels by LC–MS/MS. J. Pharm. Biomed. Anal. 2017, 140, 105–112. [Google Scholar] [CrossRef]
- Masarone, M.; Rosato, V.; Dallio, M.; Gravina, A.G.; Aglitti, A.; Loguercio, C.; Federico, A.; Persico, M. Role of Oxidative Stress in Pathophysiology of Nonalcoholic Fatty Liver Disease. Oxidative Med. Cell. Longev. 2018, 2018, 9547613. [Google Scholar] [CrossRef]
- Marušić, M.; Paić, M.; Knobloch, M.; Liberati Pršo, A.M. NAFLD, Insulin Resistance, and Diabetes Mellitus Type 2. Can. J. Gastroenterol. Hepatol. 2021, 2021, 6613827. [Google Scholar] [CrossRef]
- Tanase, D.M.; Gosav, E.M.; Costea, C.F.; Ciocoiu, M.; Lacatusu, C.M.; Maranduca, M.A.; Ouatu, A.; Floria, M. The Intricate Relationship between Type 2 Diabetes Mellitus (T2DM), Insulin Resistance (IR), and Nonalcoholic Fatty Liver Disease (NAFLD). J. Diabetes Res. 2020, 2020, 3920196. [Google Scholar] [CrossRef] [PubMed]
- Nobakht, H.; Mahmoudi, T.; Sabzikarian, M.; Tabaeian, S.P.; Rezamand, G.; Asadi, A.; Farahani, H.; Dabiri, R.; Mansour-Ghanaei, F.; Maleki, I.; et al. Insulin and Insulin Receptor Gene Polymorphisms and Susceptibility to Nonalcoholic Fatty Liver Disease. Arq. Gastroenterol. 2020, 57, 203–208. [Google Scholar] [CrossRef] [PubMed]
- Michael, M.D.; Kulkarni, R.N.; Postic, C.; Previs, S.F.; Shulman, G.I.; Magnuson, M.A.; Kahn, C.R. Loss of Insulin Signaling in Hepatocytes Leads to Severe Insulin Resistance and Progressive Hepatic Dysfunction. Mol. Cell 2000, 6, 87–97. [Google Scholar] [CrossRef] [PubMed]
- Ouamrane, L.; Larrieu, G.; Gauthier, B.; Pineau, T. RXR Activators Molecular Signalling: Involvement of a PPARα-Dependent Pathway in the Liver and Kidney, Evidence for an Alternative Pathway in the Heart. Br. J. Pharmacol. 2003, 138, 845–854. [Google Scholar] [CrossRef]
- Yong-Mei Zhang, H.; Chohnan, S.; Virga, K.G.; Stevens, R.D.; Ilkayeva, O.R.; Wenner, B.R.; Bain, J.R.; Newgard, C.B.; Lee, R.E.; Rock, C.O.; et al. Chemical Knockout of Pantothenate Kinase Reveals the Metabolic and Genetic Program Responsible for Hepatic Coenzyme A. Chem. Biol. 2007, 14, 291–302. [Google Scholar] [CrossRef]
- Zi, Y.; Gao, J.; Wang, C.; Guan, Y.; Li, L.; Ren, X.; Zhu, L.; Mu, Y.; Chen, S.; Zeng, Z.; et al. Pantothenate Kinase 1 Inhibits the Progression of Hepatocellular Carcinoma by Negatively Regulating Wnt/β-Catenin Signaling. Int. J. Biol. Sci. 2022, 18, 1539–1554. [Google Scholar] [CrossRef]
- Moylan, C.A.; Mavis, A.M.; Jima, D.; Maguire, R.; Bashir, M.; Hyun, J.; Cabezas, M.N.; Parish, A.; Niedzwiecki, D.; Diehl, A.M.; et al. Alterations in DNA Methylation Associate with Fatty Liver and Metabolic Abnormalities in a Multi-Ethnic Cohort of Pre-Teenage Children. Epigenetics 2022, 17, 1446–1461. [Google Scholar] [CrossRef]
Disclaimer/Publisher’s Note: The statements, opinions and data contained in all publications are solely those of the individual author(s) and contributor(s) and not of MDPI and/or the editor(s). MDPI and/or the editor(s) disclaim responsibility for any injury to people or property resulting from any ideas, methods, instructions or products referred to in the content. |
© 2023 by the authors. Licensee MDPI, Basel, Switzerland. This article is an open access article distributed under the terms and conditions of the Creative Commons Attribution (CC BY) license (https://creativecommons.org/licenses/by/4.0/).