
Efficient Convolution Network to Assist Breast Cancer Diagnosis and Target Therapy


Abstract
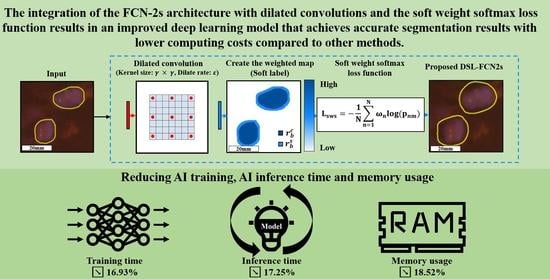
Simple Summary
Abstract
1. Introduction
2. Related Works
2.1. Dilated Convolution
2.2. Segmentation Approaches
3. Materials and Methods
3.1. Materials
3.1.1. Breast Cancer Metastases WSI Dataset
3.1.2. FISH Fluorescent Microscopy Dataset of Invasive Breast Cancer
3.1.3. DISH Light Microscopy Dataset of Invasive Breast Cancer
3.2. Proposed Method: Dilated Soft Label FCN2s
3.2.1. Proposed Dilate Soft-Label FCN Architecture


3.2.2. Model Selection
3.2.3. WSI Processing Framework
3.2.4. Implementation Details
4. Results
4.1. Quantitative Evaluation with Statistical Analysis in Breast Cancer Metastases Dataset
4.2. Quantitative Evaluation with Statistical Analysis in FISH Breast Dataset
4.3. Quantitative Evaluation with Statistical Analysis in DISH Breast Dataset

5. Run Time Analysis and Ablation Study
6. Discussion
7. Conclusions
Supplementary Materials
Author Contributions
Funding
Institutional Review Board Statement
Informed Consent Statement
Data Availability Statement
Conflicts of Interest
References
- Pati, P.; Foncubierta-Rodríguez, A.; Goksel, O.; Gabrani, M. Reducing annotation effort in digital pathology: A Co-Representation learning framework for classification tasks. Med. Image Anal. 2021, 67, 101859. [Google Scholar] [CrossRef]
- Mormont, R.; Geurts, P.; Marée, R. Multi-task pre-training of deep neural networks for digital pathology. IEEE J. Biomed. Health Inform. 2020, 25, 412–421. [Google Scholar] [CrossRef] [PubMed]
- Litjens, G.; Kooi, T.; Bejnordi, B.E.; Setio, A.A.A.; Ciompi, F.; Ghafoorian, M.; Van Der Laak, J.A.; Van Ginneken, B.; Sánchez, C.I. A survey on deep learning in medical image analysis. Med. Image Anal. 2017, 42, 60–88. [Google Scholar] [CrossRef] [PubMed]
- Wang, C.W.; Liou, Y.A.; Lin, Y.J.; Chang, C.C.; Chu, P.H.; Lee, Y.C.; Wang, C.H.; Chao, T.K. Artificial intelligence-assisted fast screening cervical high grade squamous intraepithelial lesion and squamous cell carcinoma diagnosis and treatment planning. Sci. Rep. 2021, 11, 16244. [Google Scholar] [CrossRef] [PubMed]
- Khalil, M.A.; Lee, Y.C.; Lien, H.C.; Jeng, Y.M.; Wang, C.W. Fast Segmentation of Metastatic Foci in H&E Whole-Slide Images for Breast Cancer Diagnosis. Diagnostics 2022, 12, 990. [Google Scholar] [PubMed]
- Wang, C.W.; Lee, Y.C.; Chang, C.C.; Lin, Y.J.; Liou, Y.A.; Hsu, P.C.; Chang, C.C.; Sai, A.K.O.; Wang, C.H.; Chao, T.K. A Weakly Supervised Deep Learning Method for Guiding Ovarian Cancer Treatment and Identifying an Effective Biomarker. Cancers 2022, 14, 1651. [Google Scholar] [CrossRef]
- Wang, C.W.; Chang, C.C.; Lee, Y.C.; Lin, Y.J.; Lo, S.C.; Hsu, P.C.; Liou, Y.A.; Wang, C.H.; Chao, T.K. Weakly supervised deep learning for prediction of treatment effectiveness on ovarian cancer from histopathology images. Comput. Med. Imaging Graph. 2022, 99, 102093. [Google Scholar] [CrossRef]
- Wang, C.W.; Lin, K.Y.; Lin, Y.J.; Khalil, M.A.; Chu, K.L.; Chao, T.K. A Soft Label Deep Learning to Assist Breast Cancer Target Therapy and Thyroid Cancer Diagnosis. Cancers 2022, 14, 5312. [Google Scholar] [CrossRef]
- Lin, Y.J.; Chao, T.K.; Khalil, M.A.; Lee, Y.C.; Hong, D.Z.; Wu, J.J.; Wang, C.W. Deep Learning Fast Screening Approach on Cytological Whole Slides for Thyroid Cancer Diagnosis. Cancers 2021, 13, 3891. [Google Scholar] [CrossRef]
- Lu, W.; Toss, M.; Dawood, M.; Rakha, E.; Rajpoot, N.; Minhas, F. Slidegraph+: Whole slide image level graphs to predict her2 status in breast cancer. Med. Image Anal. 2022, 80, 102486. [Google Scholar] [CrossRef]
- Wang, Q.; Qiao, K.; Qin, R.; Hai, J.; Yan, B. Predictive model of breast cancer lymph node metastasis based on deep learning (E-Transformer). In Proceedings of the 2021 6th International Symposium on Computer and Information Processing Technology (ISCIPT), Changsha, China, 11–13 June 2021; IEEE: Piscataway, NJ, USA, 2021; pp. 168–173. [Google Scholar]
- Wesoła, M.; Jeleń, M. A comparison of IHC and FISH cytogenetic methods in the evaluation of HER2 status in breast cancer. Adv. Clin. Exp. Med. 2015, 24, 899–903. [Google Scholar] [CrossRef]
- Emde, A.; Köstler, W.J.; Yarden, Y.; Association of Radiotherapy and Oncology of the Mediterranean arEa (AROME). Therapeutic strategies and mechanisms of tumorigenesis of HER2-overexpressing breast cancer. Crit. Rev. Oncol. 2012, 84, e49–e57. [Google Scholar] [CrossRef] [PubMed]
- Hilal, T.; Romond, E.H. ERBB2 (HER2) testing in breast cancer. JAMA 2016, 315, 1280–1281. [Google Scholar] [CrossRef] [PubMed]
- Vogel, C.L.; Cobleigh, M.A.; Tripathy, D.; Gutheil, J.C.; Harris, L.N.; Fehrenbacher, L.; Slamon, D.J.; Murphy, M.; Novotny, W.F.; Burchmore, M.; et al. Efficacy and safety of trastuzumab as a single agent in first-line treatment of HER2-overexpressing metastatic breast cancer. J. Clin. Oncol. 2002, 20, 719–726. [Google Scholar] [CrossRef]
- Piccart-Gebhart, M.J.; Procter, M.; Leyland-Jones, B.; Goldhirsch, A.; Untch, M.; Smith, I.; Gianni, L.; Baselga, J.; Bell, R.; Jackisch, C.; et al. Trastuzumab after adjuvant chemotherapy in HER2-positive breast cancer. N. Engl. J. Med. 2005, 353, 1659–1672. [Google Scholar] [CrossRef]
- Gajaria, P.K.; Tambe, S.; Pai, T.; Patil, A.; Desai, S.B.; Shet, T.M. Dual-color dual-hapten in situ hybridization (D-DISH)–Comparison with fluorescence in situ hybridization (FISH) for HER2/neu testing in breast cancer. Indian J. Pathol. Microbiol. 2020, 63, 194. [Google Scholar]
- Bartlett, J.; Campbell, F.M.; Ibrahim, M.; O’Grady, A.; Kay, E.; Faulkes, C.; Collins, N.; Starczynski, J.; Morgan, J.M.; Jasani, B.; et al. A UK NEQAS ISH multicenter ring study using the Ventana HER2 dual-color ISH assay. Am. J. Clin. Pathol. 2011, 135, 157–162. [Google Scholar] [CrossRef]
- Troxell, M.; Sibley, R.K.; West, R.B.; Bean, G.R.; Allison, K.H. HER2 dual in situ hybridization: Correlations and cautions. Arch. Pathol. Lab. Med. 2020, 144, 1525–1534. [Google Scholar] [CrossRef]
- Yu, K.H.; Beam, A.L.; Kohane, I.S. Artificial intelligence in healthcare. Nat. Biomed. Eng. 2018, 2, 719–731. [Google Scholar] [CrossRef] [PubMed]
- Zakrzewski, F.; de Back, W.; Weigert, M.; Wenke, T.; Zeugner, S.; Mantey, R.; Sperling, C.; Friedrich, K.; Roeder, I.; Aust, D.; et al. Automated detection of the HER2 gene amplification status in Fluorescence in situ hybridization images for the diagnostics of cancer tissues. Sci. Rep. 2019, 9, 8231. [Google Scholar] [CrossRef]
- Bera, K.; Schalper, K.A.; Rimm, D.L.; Velcheti, V.; Madabhushi, A. Artificial intelligence in digital pathology—new tools for diagnosis and precision oncology. Nat. Rev. Clin. Oncol. 2019, 16, 703–715. [Google Scholar] [CrossRef]
- Shelhamer, E.; Long, J.; Darrell, T. Fully convolutional networks for semantic segmentation. IEEE Trans. Pattern Anal. Mach. Intell. 2017, 39, 640–651. [Google Scholar] [CrossRef] [PubMed]
- Falk, T.; Mai, D.; Bensch, R.; Çiçek, Ö.; Abdulkadir, A.; Marrakchi, Y.; Böhm, A.; Deubner, J.; Jäckel, Z.; Seiwald, K.; et al. U-Net: Deep learning for cell counting, detection, and morphometry. Nat. Methods 2019, 16, 67–70. [Google Scholar] [CrossRef] [PubMed]
- Szegedy, C.; Ioffe, S.; Vanhoucke, V.; Alemi, A.A. Inception-v4, inception-resnet and the impact of residual connections on learning. In Proceedings of the Thirty-first AAAI Conference on Artificial Intelligence, San Francisco, CA, USA, 4–9 February 2017. [Google Scholar]
- He, K.; Zhang, X.; Ren, S.; Sun, J. Deep residual learning for image recognition. In Proceedings of the IEEE Conference on Computer Vision and Pattern Recognition, Las Vegas, NV, USA, 27–30 June 2016; pp. 770–778. [Google Scholar]
- Badrinarayanan, V.; Kendall, A.; Cipolla, R. Segnet: A deep convolutional encoder-decoder architecture for image segmentation. IEEE Trans. Pattern Anal. Mach. Intell. 2017, 39, 2481–2495. [Google Scholar] [CrossRef] [PubMed]
- Ke, L.; Tai, Y.W.; Tang, C.K. Deep Occlusion-Aware Instance Segmentation with Overlapping BiLayers. In Proceedings of the IEEE/CVF Conference on Computer Vision and Pattern Recognition (CVPR), Nashville, TN, USA, 19–25 June 2021; pp. 4019–4028. [Google Scholar]
- Upschulte, E.; Harmeling, S.; Amunts, K.; Dickscheid, T. Contour Proposal Networks for Biomedical Instance Segmentation. Med. Image Anal. 2022, 77, 102371. [Google Scholar] [CrossRef]
- Wang, X.; Zhang, R.; Kong, T.; Li, L.; Shen, C. Solov2: Dynamic and fast instance segmentation. Adv. Neural Inf. Process. Syst. 2020, 33, 17721–17732. [Google Scholar]
- Chen, L.C.; Zhu, Y.; Papandreou, G.; Schroff, F.; Adam, H. Encoder-decoder with atrous separable convolution for semantic image segmentation. In Proceedings of the European Conference on Computer Vision (ECCV), Munich, Germany, 8–14 September 2018; pp. 801–818. [Google Scholar]
- Howard, A.G.; Zhu, M.; Chen, B.; Kalenichenko, D.; Wang, W.; Weyand, T.; Andreetto, M.; Adam, H. Mobilenets: Efficient convolutional neural networks for mobile vision applications. arXiv 2017, arXiv:1704.04861. [Google Scholar]
- Chollet, F. Xception: Deep learning with depthwise separable convolutions. In Proceedings of the IEEE Conference on Computer Vision and Pattern Recognition, Honolulu, HI, USA, 21–26 July 2017; pp. 1251–1258. [Google Scholar]
- Minaee, S.; Boykov, Y.; Porikli, F.; Plaza, A.; Kehtarnavaz, N.; Terzopoulos, D. Image Segmentation Using Deep Learning: A Survey. IEEE Trans. Pattern Anal. Mach. Intell. 2022, 44, 3523–3542. [Google Scholar] [CrossRef] [PubMed]
- Yu, F.; Koltun, V. Multi-Scale Context Aggregation by Dilated Convolutions. In Proceedings of the ICLR, San Juan, CA, USA, 2–4 May 2016. [Google Scholar]
- Nishimura, K.; Wang, C.; Watanabe, K.; Ker, D.F.E.; Bise, R. Weakly supervised cell instance segmentation under various conditions. Med. Image Anal. 2021, 73, 102182. [Google Scholar] [CrossRef]
- Rad, R.M.; Saeedi, P.; Au, J.; Havelock, J. Trophectoderm segmentation in human embryo images via inceptioned U-Net. Med. Image Anal. 2020, 62, 101612. [Google Scholar] [CrossRef]
- Raza, S.E.A.; Cheung, L.; Shaban, M.; Graham, S.; Epstein, D.; Pelengaris, S.; Khan, M.; Rajpoot, N.M. Micro-Net: A unified model for segmentation of various objects in microscopy images. Med. Image Anal. 2019, 52, 160–173. [Google Scholar] [CrossRef] [PubMed]
- Jubayer, F.; Soeb, J.A.; Mojumder, A.N.; Paul, M.K.; Barua, P.; Kayshar, S.; Akter, S.S.; Rahman, M.; Islam, A. Detection of mold on the food surface using YOLOv5. Curr. Res. Food Sci. 2021, 4, 724–728. [Google Scholar] [CrossRef] [PubMed]
- IBM Corp. IBM SPSS Statistics for Windows, Version 25.0; IBM Corp.: Armonk, NY, USA, 2017. [Google Scholar]
- Barisoni, L.; Lafata, K.J.; Hewitt, S.M.; Madabhushi, A.; Balis, U.G. Digital pathology and computational image analysis in nephropathology. Nat. Rev. Nephrol. 2020, 16, 669–685. [Google Scholar] [CrossRef]
- Fang, X.; Mou, H.; Ying, X.; Hou, X.; Wang, L.; Wu, Y.; Yan, N.; Guo, L.; Liao, Q. Case report: Long-term clinical benefit of pyrotinib therapy following trastuzumab resistance in HER2-amplification recurrent mucinous ovarian carcinoma. Front. Oncol. 2022, 12, 1024677. [Google Scholar] [PubMed]
- Albagoush, S.A.; Limaiem, F. HER2. In StatPearls; StatPearls Publishing: Treasure Island, FL, USA, 2022. [Google Scholar]
- Dhritlahre, R.K.; Saneja, A. Recent advances in HER2-targeted delivery for cancer therapy. Drug Discov. Today 2021, 26, 1319–1329. [Google Scholar] [CrossRef]
- Makhija, S.; Amler, L.C.; Glenn, D.; Ueland, F.R.; Gold, M.A.; Dizon, D.S.; Paton, V.; Lin, C.Y.; Januario, T.; Ng, K.; et al. Clinical activity of gemcitabine plus pertuzumab in platinum-resistant ovarian cancer, fallopian tube cancer, or primary peritoneal cancer. J. Clin. Oncol. 2010, 28, 1215–1223. [Google Scholar] [CrossRef]
- Gaye, E.; Penel, N.; Lebellec, L. Novel treatment approaches for HER2 positive solid tumors (excluding breast cancer). Curr. Opin. Oncol. 2022, 34, 570–574. [Google Scholar] [CrossRef]
- Ughetto, S.; Migliore, C.; Pietrantonio, F.; Apicella, M.; Petrelli, A.; D’Errico, L.; Durando, S.; Moya-Rull, D.; Bellomo, S.E.; Rizzolio, S.; et al. Personalized therapeutic strategies in HER2-driven gastric cancer. Gastric Cancer 2021, 24, 897–912. [Google Scholar] [CrossRef]
- Yumoto, K.; Rashid, J.; Ibrahim, K.G.; Zielske, S.P.; Wang, Y.; Omi, M.; Decker, A.M.; Jung, Y.; Sun, D.; Remmer, H.A.; et al. HER2 as a potential therapeutic target on quiescent prostate cancer cells. Transl. Oncol. 2023, 31, 101642. [Google Scholar] [CrossRef]
- Woo, J.S.; Apple, S.K.; Sullivan, P.S.; Rao, J.Y.; Ostrzega, N.; Moatamed, N.A. Systematic assessment of HER2/neu in gynecologic neoplasms, an institutional experience. Diagn. Pathol. 2016, 11, 102. [Google Scholar] [CrossRef]
- LeCun, Y.; Bengio, Y.; Hinton, G. Deep learning. Nature 2015, 521, 436–444. [Google Scholar] [CrossRef] [PubMed]
- Mroz, P.; Parwani, A.V.; Kulesza, P. Central pathology review for phase III clinical trials: The enabling effect of virtual microscopy. Arch. Pathol. Lab. Med. 2013, 137, 492–495. [Google Scholar] [CrossRef] [PubMed]
- Nam, S.; Chong, Y.; Jung, C.K.; Kwak, T.Y.; Lee, J.Y.; Park, J.; Rho, M.J.; Go, H. Introduction to digital pathology and computer-aided pathology. J. Pathol. Transl. Med. 2020, 54, 125–134. [Google Scholar] [CrossRef]
- Pell, R.; Oien, K.; Robinson, M.; Pitman, H.; Rajpoot, N.; Rittscher, J.; Snead, D.; Verrill, C.; UK National Cancer Research Institute (NCRI) Cellular-Molecular Pathology (CM-Path) quality assurance working group; Driskell, O.J.; et al. The use of digital pathology and image analysis in clinical trials. J. Pathol. Clin. Res. 2019, 5, 81–90. [Google Scholar] [CrossRef]
- Bejnordi, B.E.; Veta, M.; Van Diest, P.J.; Van Ginneken, B.; Karssemeijer, N.; Litjens, G.; Van Der Laak, J.A.; Hermsen, M.; Manson, Q.F.; Balkenhol, M.; et al. Diagnostic assessment of deep learning algorithms for detection of lymph node metastases in women with breast cancer. JAMA 2017, 318, 2199–2210. [Google Scholar] [CrossRef] [PubMed]
- Lu, C.; Xu, H.; Xu, J.; Gilmore, H.; Mandal, M.; Madabhushi, A. Multi-pass adaptive voting for nuclei detection in histopathological images. Sci. Rep. 2016, 6, 33985. [Google Scholar] [CrossRef]
- Sornapudi, S.; Stanley, R.J.; Stoecker, W.V.; Almubarak, H.; Long, R.; Antani, S.; Thoma, G.; Zuna, R.; Frazier, S.R. Deep learning nuclei detection in digitized histology images by superpixels. J. Pathol. Inform. 2018, 9, 5. [Google Scholar] [CrossRef]
- Wang, H.; Cruz-Roa, A.; Basavanhally, A.; Gilmore, H.; Shih, N.; Feldman, M.; Tomaszewski, J.; Gonzalez, F.; Madabhushi, A. Mitosis detection in breast cancer pathology images by combining handcrafted and convolutional neural network features. J. Med. Imaging 2014, 1, 034003. [Google Scholar] [CrossRef]


| Dataset | Hospital | Cancer Type | Scanner/ Imaging System | Overall Magnification | Size (pixels) | Slides | |||
|---|---|---|---|---|---|---|---|---|---|
| Total | Training | Validation | Testing | ||||||
| H&E-stained WSI dataset [5] | National Taiwan University Hospital | Breast cancer | 3DHISTECH Pannoramic | 200× | 113,501 × 228,816 | 94 | 60(63.8%) | 8(8.5%) | 26(27.7%) |
| FISH fluorescent microscopy dataset [8] | Tri-Service General Hospital National Defense Medical Center | Breast cancer | Olympus | 600× | 1360 × 1024 | 200 | 120(60%) | 14(7%) | 66(33%) |
| DISH light microscopy dataset [8] | Tri-Service General Hospital National Defense Medical Center | Breast cancer | Olympus | 600× | 1360 × 1024 | 60 | 37(61.7%) | 5(8.3%) | 18(30%) |
| Layer | Features (Train) | Features (Inference) | Kernel Size | Stride | Dilation |
|---|---|---|---|---|---|
| Input | 512 × 512 × 3 | 512 × 512 × 3 | - | - | - |
| Conv1_1 | 710 × 710 × 64 | 710 × 710 × 64 | 3 × 3 | 1 | - |
| relu1_1 | 710 × 710 × 64 | 710 × 710 × 64 | - | - | - |
| Conv1_2 | 710 × 710 × 64 | 710 × 710 × 64 | 3 × 3 | 1 | - |
| relu1_2 | 710 × 710 × 64 | 710 × 710 × 64 | - | - | - |
| Pool1 | 355 × 355 × 64 | 355 × 355 × 64 | 2 × 2 | 2 | - |
| Scale | 355 × 355 × 3 | 355 × 355 × 3 | - | - | - |
| Convolution | 355 × 355 × 64 | 355 × 355 × 64 | 1 × 1 | - | - |
| Conv2_1 | 355 × 355 × 128 | 355 × 355 × 128 | 3 × 3 | 1 | - |
| relu2_1 | 355 × 355 × 128 | 355 × 355 × 128 | - | - | - |
| Conv2_2 | 355 × 355 × 128 | 355 × 355 × 128 | 3 × 3 | 1 | - |
| relu2_2 | 355 × 355 × 128 | 355 × 355 × 128 | - | - | - |
| Pool2 | 178 × 178 × 128 | 178 × 178 × 128 | 2 × 2 | 2 | - |
| Scale | 178 × 178 × 128 | 178 × 178 × 128 | - | - | - |
| Convolution | 178 × 178 × 3 | 178 × 178 × 3 | 1 × 1 | - | - |
| Conv3_1 | 178 × 178 × 256 | 178 × 178 × 256 | 3 × 3 | 1 | - |
| relu3_1 | 178 × 178 × 256 | 178 × 178 × 256 | - | - | - |
| Conv3_2 | 178 × 178 × 256 | 178 × 178 × 256 | 3 × 3 | 1 | - |
| relu3_2 | 178 × 178 × 256 | 178 × 178 × 256 | - | - | - |
| Conv3_3 | 178 × 178 × 256 | 178 × 178 × 256 | 3 × 3 | 1 | - |
| relu3_3 | 178 × 178 × 256 | 178 × 178 × 256 | - | - | - |
| Pool3 | 89 × 89 × 256 | 89 × 89 × 256 | 2 × 2 | 2 | - |
| Scale | 89 × 89 × 256 | 89 × 89 × 256 | - | - | - |
| Convolution | 89 × 89 × 3 | 89 × 89 × 3 | 1 × 1 | - | - |
| Conv4_1 | 89 × 89 × 512 | 89 × 89 × 512 | 3 × 3 | 1 | - |
| relu4_1 | 89 × 89 × 512 | 89 × 89 × 512 | - | - | - |
| Conv4_2 | 89 × 89 × 512 | 89 × 89 × 512 | 3 × 3 | 1 | - |
| relu4_2 | 89 × 89 × 512 | 89 × 89 × 512 | - | - | - |
| Conv4_3 | 89 × 89 × 512 | 89 × 89 × 512 | 3 × 3 | 1 | - |
| relu4_3 | 89 × 89 × 512 | 89 × 89 × 512 | - | - | - |
| Pool4 | 45 × 45 × 512 | 45 × 45 × 512 | 2 × 2 | 2 | - |
| Scale | 45 × 45 × 512 | 45 × 45 × 512 | - | - | - |
| Convolution | 45 × 45 × 3 | 45 × 45 × 3 | 1 × 1 | - | - |
| Conv5_1 | 45 × 45 × 512 | 45 × 45 × 512 | 3 × 3 | 1 | - |
| relu5_1 | 45 × 45 × 512 | 45 × 45 × 512 | - | - | - |
| Conv5_2 | 45 × 45 × 512 | 45 × 45 × 512 | 3 × 3 | 1 | - |
| relu5_2 | 45 × 45 × 512 | 45 × 45 × 512 | - | - | - |
| Conv5_3 | 45 × 45 × 512 | 45 × 45 × 512 | 3 × 3 | 1 | - |
| relu5_3 | 45 × 45 × 512 | 45 × 45 × 512 | - | - | - |
| Pool5 | 23 × 23 × 512 | 23 × 23 × 512 | 2 × 2 | 2 | - |
| Dilation Conv6 | 17 × 17 × 4096 | 17 × 17 × 4096 | × | 1 | |
| relu6 + Drop6 | 17 × 17 × 4096 | 17 × 17 × 4096 | - | - | - |
| Conv7 | 17 × 17 × 4096 | 17 × 17 × 4096 | 1 × 1 | 1 | - |
| relu7 + Drop7 | 17 × 17 × 4096 | 17 × 17 × 4096 | - | - | - |
| Conv8 | 17 × 17 × N | 17 × 17 × N | 1 × 1 | 1 | - |
| Deconv1 | 36 × 36 × N | 36 × 36 × N | 4 × 4 | 2 | - |
| Crop1 | 36 × 36 × N | 36 × 36 × N | - | - | - |
| Eltwise | 36 × 36 × N | 36 × 36 × N | - | - | - |
| Deconv2 | 74 × 74 × N | 74 × 74 × N | 4 × 4 | 2 | - |
| Crop2 | 74 × 74 × N | 74 × 74 × N | - | - | - |
| Eltwise | 74 × 74 × N | 74 × 74 × N | - | - | - |
| Deconv3 | 150 × 150 × N | 150 × 150 × N | 4 × 4 | 2 | - |
| Crop3 | 150 × 150 × N | 150 × 150 × N | - | - | - |
| Eltwise | 150 × 150 × N | 150 × 150 × N | - | - | - |
| Deconv4 | 302 × 302 × N | 320 × 320 × N | 4 × 4 | 2 | - |
| Crop4 | 302 × 302 × N | 302 × 302 × N | - | - | - |
| Eltwise | 302 × 302 × N | 302 × 302 × N | - | - | - |
| Deconv5 | 606 × 606 × N | 606 × 606 × N | 4 × 4 | 2 | - |
| Crop5 | 512 × 512 × N | 512 × 512 × N | - | - | - |
| Soft weight softmax loss | 512 × 512 × N | 512 × 512 × N | - | - | - |
| Output Class Map | 512 × 512 × 1 | 512 × 512 × 1 | - | - | - |
| (a) Breast Metastases WSI Dataset (Histopathology) | |||||||||||
| Method | Precision | Recall | Dice Coefficient | IoU | Rank Dice Coefficient | ||||||
| Proposed D-FCN2s | 87.56 ± 16.67 | 88.95 ± 15.85 | 86.40 ± 13.36 | 78.13 ± 19.56 | 1 | ||||||
| Proposed DSL-FCN2s | 82.37 ± 17.78 | 87.20 ± 13.90 | 82.80 ± 12.23 | 72.35 ± 17.84 | 4 | ||||||
| SL-FCN [8] | 88.83 ± 16.13 | 85.48 ± 15.39 | 85.23 ± 11.94 | 75.89 ± 17.25 | 2 | ||||||
| Modified FCN [4,5,6,7,9] | 89.17 ± 16.21 | 83.67 ± 16.85 | 84.42 ± 12.78 | 74.92 ± 18.83 | 3 | ||||||
| DeepLabv3+ [31] with Mobilenet [32] | 64.33 ± 26.22 | 68.25 ± 27.77 | 64.08 ± 24.11 | 50.42 ± 22.96 | 5 | ||||||
| DeepLabv3+ [31] with Resnet [26] | 75.33 ± 28.64 | 58.42 ± 29.00 | 62.17 ± 25.95 | 48.75 ± 25.11 | 6 | ||||||
| DeepLabv3+ [31] with Xception [33] | 61.33 ± 35.45 | 44.00 ± 26.12 | 48.00 ± 26.24 | 34.42 ± 21.39 | 8 | ||||||
| U-Net [24] | 48.58 ± 11.65 | 64.25 ± 2.26 | 56.42 ± 9.50 | 47.33 ± 11.48 | 7 | ||||||
| SegNet [27] | 54.75 ± 9.10 | 58.83 ± 2.82 | 46.25 ± 12.48 | 38.00 ± 12.91 | 9 | ||||||
| FCN [23] | 55.17 ± 6.18 | 50.00 ± 8.15 | 45.08 ± 7.89 | 36.33 ± 8.67 | 10 | ||||||
| (b) FISH Breast Dataset | |||||||||||
| Method | Accuracy | Precision | Recall | Dice Coefficient | IoU | Rank Dice Coefficient | |||||
| Proposed DSL-FCN2s | 95.46 ± 5.61% | 89.30 ± 12.80% | 94.76 ± 5.54% | 91.55 ± 9.26% | 85.56 ± 13.83% | 1 | |||||
| SL-FCN [8] | 93.54 ± 5.24% | 91.75 ± 8.27% | 83.52 ± 13.15% | 86.98 ± 9.85% | 78.22 ± 14.73% | 2 | |||||
| Modified FCN [4,5,6,7,9] | 93.38 ± 4.46% | 91.90 ± 7.87% | 82.13 ± 10.99% | 86.41 ± 8.38% | 76.97 ± 12.50% | 3 | |||||
| DeepLabv3+ [31] with Mobilenet [32] | 85.17 ± 5.18% | 75.53 ± 6.14% | 64.94 ± 9.99% | 69.36 ± 7.27% | 53.55 ± 8.08% | 7 | |||||
| DeepLabv3+ [31] with Resnet [26] | 85.06 ± 5.23% | 69.79 ± 7.30% | 76.44 ± 9.28% | 72.52 ± 6.62% | 57.29 ± 7.65% | 5 | |||||
| DeepLabv3+ [31] with Xception [33] | 76.83 ± 11.67% | 66.35 ± 19.82% | 45.27 ± 24.82% | 47.55 ± 20.44% | 33.73 ± 15.58% | 9 | |||||
| CPN [29] | 77.67 ± 8.38% | 57.55 ± 8.46% | 76.95 ± 8.03% | 65.35 ± 6.72% | 48.46 ± 7.37% | 8 | |||||
| SOLOv2 [30] | 88.11 ± 4.48% | 79.55 ± 8.01% | 75.86 ± 6.60% | 77.308 ± 5.82% | 62.94 ± 7.45% | 4 | |||||
| BCNet [28] | 85.98 ± 5.58% | 83.27 ± 8.11% | 62.36 ± 12.08% | 70.55 ± 9.77% | 54.80 ± 10.79% | 6 | |||||
| (c) DISH Breast Dataset | |||||||||||
| Method | Accuracy | Precision | Recall | Dice Coefficient | IoU | Rank Dice Coefficient | |||||
| Proposed DSL-FCN2s | 95.33 ± 1.89% | 90.81 ± 6.04% | 83.84 ± 7.26% | 87.08 ± 6.08% | 77.60 ± 9.31% | 1 | |||||
| SL-FCN [8] | 94.64 ± 2.23% | 86.78 ± 8.16% | 83.78 ± 6.42% | 85.14 ± 6.61% | 74.67 ± 10.05% | 2 | |||||
| U-Net [24]+InceptionV4 [25] | 85.41 ± 5.25% | 74.65 ± 9.90% | 64.46 ± 9.57% | 68.94 ± 8.92% | 53.35 ± 12.17% | 5 | |||||
| Ensemble of U-Net variants | 84.82 ± 4.38% | 74.39 ± 9.56% | 61.28 ± 5.82% | 66.89 ± 5.85% | 51.69 ± 6.96% | 7 | |||||
| U-Net [24] | 86.89 ± 4.25% | 70.40 ± 10.90% | 69.09 ± 7.45% | 69.13 ± 6.93% | 52.97 ± 7.78% | 4 | |||||
| SegNet [27] | 86.17 ± 3.92% | 65.71 ± 10.84% | 79.00 ± 8.46% | 70.74 ± 5.68% | 55.00 ± 6.59% | 3 | |||||
| FCN [23] | 83.75 ± 5.89% | 72.55 ± 10.05% | 45.71 ± 12.25% | 54.23 ± 9.77% | 37.75 ± 8.71% | 14 | |||||
| Modified FCN [4,5,6,7,9] | 89.05 ± 5.26% | 82.12 ± 9.48% | 59.42 ± 11.96% | 68.30 ± 9.99% | 52.68 ± 11.51% | 6 | |||||
| DeepLabv3+ [31] with Mobilenet [32] | 77.33 ± 8.51% | 55.06 ± 9.59% | 69.50 ± 16.74% | 59.78 ± 10.57% | 44.00 ± 12.18% | 12 | |||||
| DeepLabv3+ [31] with Resnet [26] | 80.89 ± 4.56% | 59.00 ± 9.16% | 73.28 ± 11.80% | 64.17 ± 9.19% | 48.56 ± 12.00% | 9 | |||||
| DeepLabv3+ [31] with Xception [33] | 78.72 ± 5.15% | 56.00 ± 9.34% | 63.61 ± 14.77% | 57.89 ± 7.68% | 40.67 ± 7.65% | 13 | |||||
| CPN [29] | 83.61 ± 5.23% | 67.39 ± 8.02% | 67.22 ± 13.21% | 66.33 ± 10.09% | 50.33 ± 10.06% | 8 | |||||
| SOLOv2 [30] | 84.78 ± 6.47% | 79.11 ± 10.24% | 52.44 ± 7.21% | 62.22 ± 5.35% | 45.34 ± 5.45% | 11 | |||||
| BCNet [28] | 83.72 ± 5.74% | 73.61 ± 11.42% | 57.06 ± 7.18% | 63.50 ± 6.40% | 48.50 ± 10.85% | 10 | |||||
| FISH Breast Dataset | ||||||
|---|---|---|---|---|---|---|
| Method | Accuracy | Precision | Recall | Dice Coefficient | IoU | Rank Dice Coefficient |
| Proposed DSL-FCN2s | 95.46 ± 5.61% | 89.30 ± 12.80% | 94.76 ± 5.54% | 91.55 ± 9.26% | 85.56 ± 13.83% | 1 |
| Propoesd DSL-FCN2s w/o model selection | 93.67 ± 4.92% | 91.89 ± 7.53% | 83.32 ± 11.19% | 87.13 ± 8.83% | 78.20 ± 13.15% | 2 |
| SL-FCN [8] | 93.54 ± 5.24% | 91.75 ± 8.27% | 83.52 ± 13.15% | 86.98 ± 9.85% | 78.22 ± 14.73% | 3 |
| Modified FCN + Dilated convolution + soft label weight loss | 89.98 ± 8.04% | 92.70 ± 6.71% | 69.09 ± 20.63% | 77.49 ± 17.09% | 66.00 ± 20.26% | 6 |
| Modified FCN + Dilated convolution | 92.93 ± 5.05% | 91.59 ± 7.93% | 80.57 ± 14.18% | 85.14 ± 10.67% | 75.46 ± 14.68% | 5 |
| Modified FCN [4,5,6,7,9] | 93.38 ± 4.46% | 91.90 ± 7.87% | 82.13 ± 10.99% | 86.41 ± 8.38% | 76.97 ± 12.50% | 4 |
| FISH Breast Dataset | |||||
|---|---|---|---|---|---|
| Method | Training Time | Memory Usage | Inference Time | Conv6 Parameter | Total Parameter |
| Proposed DSL−FCN2s | 4 h 15 min(−16.93%) | 2846 MiB(− 18.52%) | 0.489 s(−17.25%) | 18,878,464(−81.6%) | 50.39 M(−62.48%) |
| Proposed DSL−FCN2s w/o model selection | 4 h 9 min(−18.89%) | 2846 MiB(−18.52%) | 0.495 s(−16.24%) | 18,878,464(−81.6%) | 50.39 M(−62.48%) |
| SL−FCN [8] | 5 h 10 min(+0.97%) | 3493 MiB | 0.563 s(−4.73%) | 102,764,544 | 134.31 M |
| Modified FCN + Dilated convolution + soft label weight loss | 4 h 9 min(−18.89%) | 2535 MiB(−27.42%) | 0.505 s(−14.55%) | 18,878,464(−81.6%) | 50.42 M(−62.45%) |
| Modified FCN + Dilated convolution | 4 h 7 min(−19.54%) | 2535 MiB(−27.42%) | 0.515 s(−12.85%) | 18,878,464(−81.6%) | 50.42 M(−62.45%) |
| Modified FCN [4,5,6,7,9] | 5 h 7 min | 3493 MiB | 0.591 s | 102,764,544 | 134.31 M |
Disclaimer/Publisher’s Note: The statements, opinions and data contained in all publications are solely those of the individual author(s) and contributor(s) and not of MDPI and/or the editor(s). MDPI and/or the editor(s) disclaim responsibility for any injury to people or property resulting from any ideas, methods, instructions or products referred to in the content. |
© 2023 by the authors. Licensee MDPI, Basel, Switzerland. This article is an open access article distributed under the terms and conditions of the Creative Commons Attribution (CC BY) license (https://creativecommons.org/licenses/by/4.0/).
Share and Cite
Wang, C.-W.; Chu, K.-L.; Muzakky, H.; Lin, Y.-J.; Chao, T.-K. Efficient Convolution Network to Assist Breast Cancer Diagnosis and Target Therapy. Cancers 2023, 15, 3991. https://doi.org/10.3390/cancers15153991
Wang C-W, Chu K-L, Muzakky H, Lin Y-J, Chao T-K. Efficient Convolution Network to Assist Breast Cancer Diagnosis and Target Therapy. Cancers. 2023; 15(15):3991. https://doi.org/10.3390/cancers15153991
Chicago/Turabian StyleWang, Ching-Wei, Kai-Lin Chu, Hikam Muzakky, Yi-Jia Lin, and Tai-Kuang Chao. 2023. "Efficient Convolution Network to Assist Breast Cancer Diagnosis and Target Therapy" Cancers 15, no. 15: 3991. https://doi.org/10.3390/cancers15153991
APA StyleWang, C.-W., Chu, K.-L., Muzakky, H., Lin, Y.-J., & Chao, T.-K. (2023). Efficient Convolution Network to Assist Breast Cancer Diagnosis and Target Therapy. Cancers, 15(15), 3991. https://doi.org/10.3390/cancers15153991